
 Open Access Article
 This Open Access Article is licensed under a
 Creative Commons Attribution 3.0 Unported Licence
Revisiting polymer coatings on nanoparticles: correlation between molecular weight and coating thickness in chain transfer polymerizations†
Daniel
Döpping
 a,
Andreas
Stihl
bc,
Dominik
Voll
a,
Felix H.
Schacher
bc and
Patrick
Théato
*ad
a,
Andreas
Stihl
bc,
Dominik
Voll
a,
Felix H.
Schacher
bc and
Patrick
Théato
*ad
aInstitute for Chemical Technology and Polymer Chemistry (ITCP), Karlsruhe Institute of Technology (KIT), Engesserstraße 18, D-76131 Karlsruhe, Germany. E-mail: patrick.theato@kit.edu
bInstitute of Organic Chemistry and Macromolecular Chemistry (IOMC), Friedrich Schiller University Jena (FSU), Lessingstraße 8, D-07743 Jena, Germany
cJena Center for Soft Matter (JCSM), Friedrich-Schiller-University Jena, Philosophenweg 7, D-07743 Jena, Germany
dSoft Matter Synthesis Laboratory, Institute for Biological Interfaces III, Karlsruhe Institute of Technology (KIT), Hermann-von-Helmholtz-Platz 1, D-76344 Eggenstein-Leopoldshafen, Germany
First published on 18th March 2025
Abstract
Various poly(methyl methacrylate) (PMMA) and poly(acrylonitrile) (PAN) coated silica nanoparticles were synthesized via chain transfer polymerization with the goal to assess the coating behavior and characterization of polymer coated silica nanoparticles with monomers of different reactivities. The particles were characterized by TGA, EDXS, TEM and correlated to the free PMMA/PAN formed in the crude reaction mixture characterized with SEC. It was found that the mass loss observed in TGA and coating thickness obtained from TEM micrographs correlate strongly with the average polymer chain-length in the crude reaction mixture.
1. Introduction
The development of functional polymer coatings on surfaces and particles has been a significant area of research in polymer chemistry due to its broad range of applications, including energy storage,1 drug delivery,2 contrast agents,3 antimicrobials,4 catalysts,5 and more. These coatings enhance surface properties of nanoparticles (NPs), providing characteristics such as dispersion stability,6 conductivity,7 and biocompatibility.8 Often, only very thin homogeneous monolayers are necessary to achieve these desired properties, making precise control over coating thickness a critical aspect of material design.9One effective method for controlling the thickness of polymer coatings is through (semi-)controlled polymerization at the particle surface, which allows for precise control over the degree of polymerization (DPn). This control directly correlates to the thickness of the polymer coating, enabling the fine-tuning of surface properties to meet specific application requirements. Matyjaszewski and Li confirmed this in the early 2000s by grafting and subsequently cleaving polymers to NPs through atom transfer radical polymerization (ATRP).10–12 However, one distinct drawback of this method is the fairly tedious preparation of the ATRP precursor NPs and the cleavage of the polymer chains from the NPs, which irreversibly destroys the coating for the molecular weight determination. In 2001 Zhou et al. developed a method for polymer surface coatings on silica and silicon wafers treated with (3-mercaptopropyl) trimethoxy silane (SH-TMS), which acts as a chain transfer agent for a semi-controlled free radical polymerization onto the silica/silicon wafer surface. Further, they confirmed that the molecular weight Mw in the crude reaction mixture decreased with increasing the thiol functionalized silica concentration, concluding that the thiol functionalized silica particles act as a chain transfer agent in the reaction media.13 Additionally, they found that the polymerization seems to proceed more effectively on the silicon wafers compared to the silica particles and they attributed this to an increased rate of termination through higher chain and particle mobility of silica particles.
The semi-controlled coating method is advantageous over perfectly controlled polymerization techniques, such as ATRP, due to its simplicity and ability to quickly yield uniform coatings. Furthermore, free polymer for analysis is easily accessible from the crude reaction mixture without the need to cleave off polymer chains of the NPs.
However, a key question remains about the correlation between molecular weight Mn and coating thickness on NPs. Since it is a chain transfer radical polymerization, it potentially allows the formation of independent polymer chains that do not include substrate thiols for various reasons, such as saturation of free thiols, kinetic hindrance, or side reactions. Hence, a direct correlation between coating thickness of NPs and the molecular weight Mn in solution needs to be confirmed.
To address this question, we conducted a systematic study using poly(methyl methacrylate) (PMMA) and polyacrylonitrile (PAN) on silica nanoparticles as model systems. Methyl methacrylate has the tendency for less side reactions during polymerizations in comparison to acrylonitrile14 and is widely employed in coatings.15 The difference in polymerization behavior might have significant impact on their application for surface or particle coatings. Hence, identifying differences in their coating properties is interesting to find more applications for polymer coatings. This study aims to confirm whether Mn still correlates with coating thickness in a semi-controlled polymerization mechanism and optimize the coating properties. Understanding this correlation is crucial for developing more effective polymer coating strategies and moreover effective and fast characterization opportunities for the coating thickness of NPs.
2. Results and discussion
First, to choose a surface anchor that is suitable for a chain-transfer polymerization of a plethora of radically polymerizable monomers, the method first reported by Zhou et al. was adapted.13 Here, thiols are immobilized at the surface through an alkoxy silane condensation and subsequently coated with PMMA by chain transfer polymerization. Further, Biehl and Schacher successfully coated iron oxide particles with different polymers in the same manner, proving the effectiveness of the chain-transfer mechanism for surface coatings of NPs.16 The reaction to immobilize thiols at the silica particle surface is depicted in Fig. 1. | ||
| Fig. 1 (a) Reaction scheme of the hydrolyzation of (3-mercaptopropyl)-trimethoxysilane (SH-TMS) to (3-mercaptopropyl)-silanetriol under acidic conditions. (b) Surface modification of oxide particles with (3-mercaptopropyl)-silanetriol via condensation. Additional condensation products were omitted for clarity. The (3-mercaptopropyl)-silanetriol can have 1 to 3 condensations with the surface or react with other silanetriols to an amorphous network at the surface or in solution. The thiol-surface acts as a chain-transfer agent in the polymerization. | ||
As nanoparticles, commercially available SiO2 nanoparticles (SiO2-NPs) with an average diameter of 200 nm and a uniform spherical shape were chosen. Methyl methacrylate and acrylonitrile were chosen as simple monomers with high reactivity for chain transfer reactions (e.g., reversible-fragmentation chain transfer polymerization13,17,18). With the chain transfer agent (CTA) SH-TMS attached to the surface of the silica nanoparticles and growing PMMA/PAN polymer chains in solution, the recombination of growing chains with the CTA determines the coating thickness of the polymer layer on top of the silica surface. Hence, a strong correlation between the polymer chain length in solution and the coating thickness is expected. In Fig. 2 the basic mechanism of a chain transfer reaction to a particle surface via SH-TMS is depicted. Briefly, upon decomposition of the initiator, a free radical polymerization in solution is started. The growing polymer chain can be terminated by hydrogen atom abstraction from the thiol at the SiO2-NP surface. This leaves a reactive thiyl-radical which itself can start another radical polymerization with monomers or terminate an already growing chain via recombination, resulting in the attachment of polymer chains to the particle surface and polymer chains in solution through recombination. Hence, the coating thickness of the particles should be proportional to the molecular weight of the polymers in solution, as long as there is enough available CTA to moderate the radical concentration.
 | ||
| Fig. 2 Simplified chain transfer mechanism of PAN to the SH-TMS at the silica particle surface. PMMA reacts in the same manner. Pn represents the polymer chain of PAN, the black bars represent the silica particle. Growing and terminated polymer chains in solution (blue) and polymer chains bound via SH-TMS (red) to the silica nanoparticle surface are mechanistically linked. Therefore, the chain length in solution and coating thickness of PAN should be correlated. (a) Depicts a “grafting-from” reaction path while (b) depicts “grafting-to” which simultaneously happens during the coating. Note that for simplification several competing reaction pathways are not depicted. The most important alternative reaction path does not include a CTA and therefore reacts according to a classical free radical polymerization. | ||
Importantly, the kinetics of a chain-transfer polymerization change once the CTA is used up or hindered to participate in the reaction. If this occurs, the polymerization will continue without the moderation of free radicals through the CTA leading to higher dispersities and low control over molecular weight.19 Especially in surface polymerizations this effect needs to be considered since the CTA has a reduced mobility and can be sterically hindered by growing polymer chains at the particle surface. This may only happen at higher monomer concentrations, hence, a wide range of monomer concentration of both monomers was employed.
After surface functionalization of the SiO2-NPs with SH-TMS the obtained SH@SiO2 NPs were split into 5 batches of 500 mg each and dispersed in 5 mL N,N-dimethylformamide (DMF) in an ultrasonic bath. 125 mg azobisisobutyronitrile (AIBN) and acrylonitrile or methyl methacrylate in ratios of 0.1, 0.5, 1, 2, and 5 times the weight of SH@SiO2 were added, respectively, and the five reaction mixtures were heated to 60 °C for 24 h under nitrogen atmosphere. The coated particles were centrifuged, separated from the crude reaction mixture, and labelled according to their SH@SiO2![[thin space (1/6-em)]](https://www.rsc.org/images/entities/char_2009.gif) :AN/MMA weight ratio. The NPs with the corresponding polymer are labelled PMMA@SiO2 and PAN@SiO2, respectively.
:AN/MMA weight ratio. The NPs with the corresponding polymer are labelled PMMA@SiO2 and PAN@SiO2, respectively.
To determine the polymer chain length, i.e., degree of polymerization, in solution, SEC samples were taken directly from the crude reaction mixtures after separation of the NPs by centrifugation. Further, the dried NPs were measured by thermogravimetric analysis (TGA) to assess the loss of organic material which correlates to the amount of polymer at the particle surface (depicted in Fig. 3).
 | ||
| Fig. 3 PMMA (top) and PAN (bottom) (a) SEC elugram of all tested concentrations of the polymer in the crude reaction mixture against a PMMA standard. (b) TGA measurements of all coated silica NPs at a heating rate of 10 K min−1. (c) Correlation between Mn determined in SEC and mass loss in TGA (average of three measurements) from all samples. R2 of the linear fit function indicates a strong correlation for both polymers. For PAN, the 1:5 concentration is omitted from the linear fit as it is an outlier due to the onset of the gel effect. | ||
As expected, by increasing the monomer concentration, the Mn of both polymers in the crude reaction mixture increased. It is of high importance for SEC measurements that PMMA-standards were used for both polymers. Consequently, the values obtained for PMMA can be considered absolute values. However, for PAN the values can only be considered relatively to other values from PAN measurements due to differences in polarity and hydrodynamic radii between the calibrants and the analyte. In general, PMMA showed higher Mn values across all concentrations. One exception was 1:0.1 concentration, where PMMA had a lower molecular weight in solution. This could be a result due to the mismatch in standards and thus, molecular weights of PAN might be possibly higher than stated. Also, the weight loss in the TGA from the dried NPs increased with monomer concentration indicating an increased polymeric surface coating. For PAN@SiO2 1:5 the mass loss in TGA was significantly higher. All other samples were off-white powders, whereas PAN@SiO2 1:5 appeared as a yellow solid after drying, as can be seen in Fig. S1 in the ESI.† Due to the high concentration of acrylonitrile in the 1:5 mixture, a drastic increase in viscosity was observed, which probably led to an accelerated chain-growth due to the Trommsdorff-Norrish-effect (or gel effect) at the particle surface. This corroborates the hypothesis of too small molecular weights obtained for PAN through SEC measurements as PAN had an Mn of 9500 g mol−1 compared to PMMAs 16900 g mol−1, which did not show indications of Trommsdorff-Norrish-effect. Considering this and omitting this data point for PAN@SiO2 1:5, we found a strong linear correlation between the number average molecular weight Mn of both polymers from the crude solution and the mass loss derived from TGA measurements of the coated particles. This was derived from the R2 value obtained from the linear regression of Mnvs. mass loss in TGA. PMMA had a slightly better correlation for all five data points of R2 = 0.95 while PAN had a correlation of R2 = 0.94 for four data points with the highest monomer concentration omitted for the aforementioned reasons.
As depicted in Table 1, the dispersity Đ also increased with increasing monomer concentration. This indicated that the radical regulating effect of the surface bound thiol decreased with increasing monomer concentration. Further, it was observed, that the dispersity of PMMA was significantly narrower and increases from 1.71–2.3 while PAN increased from 3.82 to about 7. The higher dispersity of PAN compared to PMMA in chain transfer polymerization may arise from differences in their polymerization kinetics and monomer behavior.20 Acrylonitrile has a higher reactivity, leading to increased side reactions and consequently to a broader molecular weight distribution. Additionally, acrylonitrile has a slower propagation rate and is more prone to chain transfer to polymer chains, solvent, and side reactions due to its nitrile group,21 further increasing dispersity. In contrast, methyl methacrylate exhibited a more controlled polymerization, with fewer chain transfer events and a more uniform chain growth, resulting in a narrower dispersity.
| Ratio | PMMA (THF-SEC PMMA standard) | PAN (DMAC-SEC PMMA standard) | ||
|---|---|---|---|---|
| M n/g mol−1 | Đ | M n/g mol−1 | Đ | |
| 1:0.1 |
400 | 1.71 | 900 | 3.82 |
| 1:0.5 |
5000 | 1.74 | 2400 | 4.38 |
| 1:1 |
6200 | 1.85 | 4000 | 5.19 |
| 1:2 |
8800 | 2.22 | 4900 | 7.02 |
| 1:5 |
16900 |
2.30 | 9500 | 6.75 |
Overall, the lower dispersity of PMMA, the lower molecular weight at ratio 1:0.1 and narrower dispersity indicated a strong affinity of propagating PMMA chains for chain-transfer reactions toward the particle surface, whereas PAN exhibited less controlled parameters due to its more random polymerization kinetics.
This indicated that MMA had a higher affinity for the chain transfer to the thiol surface of the SiO2-NPs while acrylonitrile was more prone to side reactions and transfer reactions omitting the CTA. To assess the influence of these different behaviors on the polymer coating atop the SiO2-NPs, TEM micrographs of the coated particles were taken. The TEM micrographs of both polymer coatings with the respective monomer concentration (depicted in Fig. 4) showed a mostly homogeneous coating layer with only small irregularities.
 | ||
| Fig. 4 TEM micrographs of PMMA and PAN coatings on SiO2-NPs at the respective monomer concentration in solution. Dark gray spherical shapes are the SiO2-NPs with the lighter gray edges showing the amorphous polymer coating. | ||
As expected, the modified SiO2-NPs exhibited a core–shell structure, where the silica core (50–400 nm) was surrounded by the polymer coating. The images reveal how the thickness and uniformity of the polymer shell changed as the concentration of the monomer increased during polymerization. At lower monomer concentrations, the polymer coating appeared relatively thin and uniform. However, as the monomer concentration increased, the polymer shell became noticeably thicker. Along with the increase in thickness, the polymer coating also became more inhomogeneous at higher monomer concentrations. The TEM micrographs highlight this by showing areas where the polymer shell is uneven or rough, indicating that the polymerization process was less uniform in these regions. This irregularity suggests that the polymer coating may have local variations in density or distribution.
Furthermore, the interface between the silica core and the polymer coating became less distinct as the monomer concentration was increased. At lower concentrations, the boundary between the silica and polymer was sharp and well-defined. In contrast, at higher concentrations, the transition between the two phases became more gradual or diffuse. On contact points between two particles, the polymer layer also exhibited increased thickness, which implies an accelerated polymerization due to diffusion limitations at the interfaces.
To gain more insights into the elemental distribution and confirm the polymer coatings correspond to the light gray shell observed in the TEM micrographs, energy-dispersive X-ray spectroscopy (EDXS) was measured on one PAN@SiO2 1:2 particle. This specific sample was chosen to be able to clearly distinguish between each layer with a single element, e.g., Si for SiO2-NPs, S for the SH-TMS CTA layer, and N for the PAN coating (refer to Fig. 5). Further, the suspected PAN coating on this sample was visually the thickest and therefore the resolution of the EDXS scans, which is about 1–2 nm, would not be a problem to clearly distinguish between CTA and PAN layer.
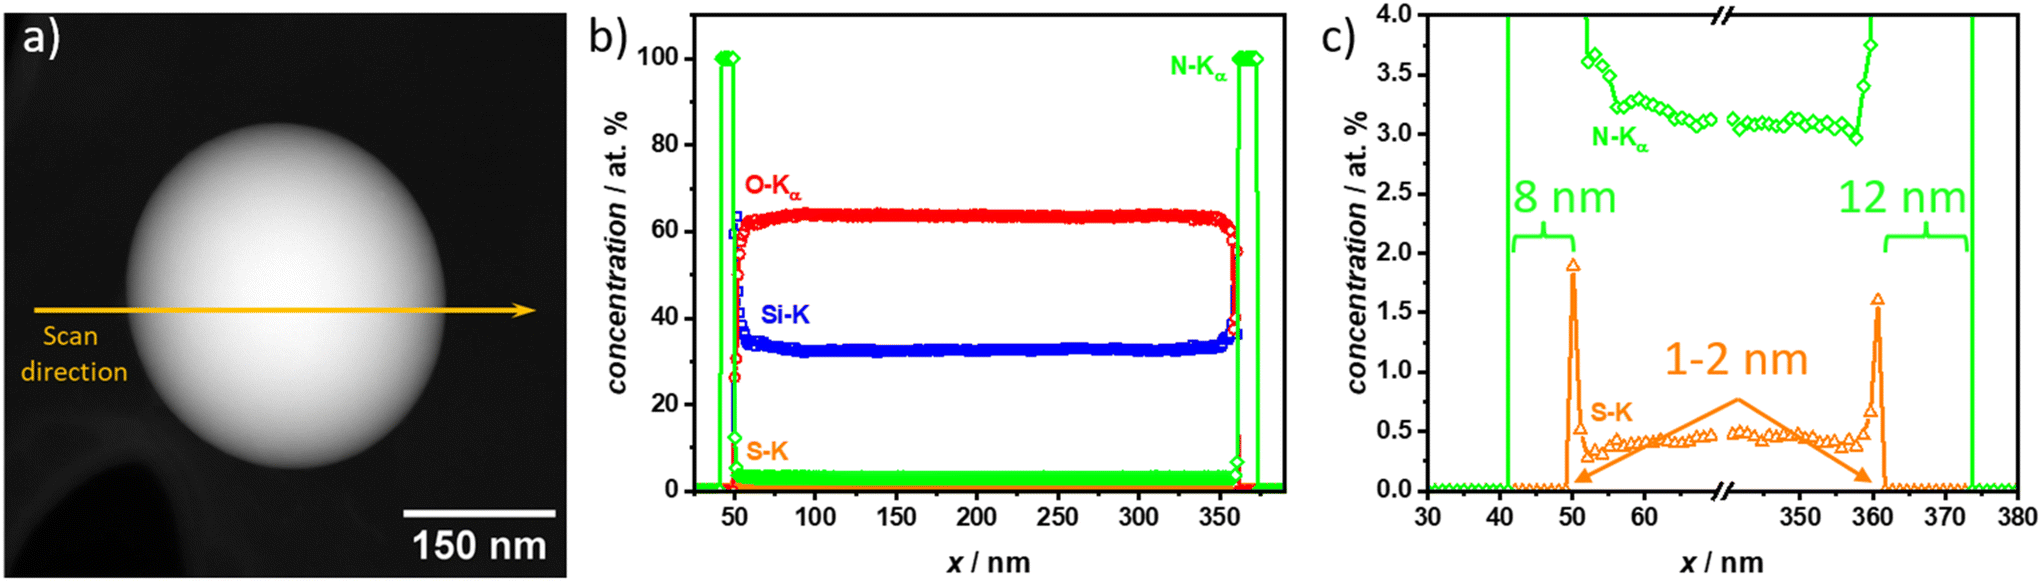 | ||
| Fig. 5 (a) High-angle annular dark-field (HAADF) scanning transmission electron microscopy (STEM) of PAN@SiO2 1:2. The Si-, O-, S- and N-distributions within the single SiO2 core–shell nanoparticle are determined from the EDXS line profile, which is recorded along the orange line in the HAADF-STEM image. The particle has a diameter of 320 nm. (b) Elemental distribution along the EDXS scanning line for PAN@SiO2 1:2. Si-, O-, S-, and N-distributions are shown in blue, red, orange, and green, respectively. Si and O show the position of the SiO2-NP. S indicates the SH-TMS CTA coating layer. N represents the PAN coating attached to the CTA. (c) Elemental distribution along the EDXS scanning line magnified to better visualize the interface. S- and N-distributions are shown in orange, and green, respectively. The coating thickness of the nitrogen containing PAN is 8 nm on the left side and 12 nm on the right side. The thickness of the sulfur layer is 1–2 nm within the range of the resolution limit of the EDXS scan. | ||
The EDXS scan confirmed the core–shell structure through the elemental composition across a three-layer structure consisting of PAN, a CTA, and the silica nanoparticle core. The outermost layer, corresponding to the PAN coating, was clearly identifiable by the presence of nitrogen (N, green) signals in the EDXS data. The scan showed that the polymer layer was approximately 8 nm thick on one side and 12 nm on the other, which formed the outer boundary of the structure. This consistent elemental profile suggests that the polymer coating was evenly applied around the silica nanoparticle core, but as already observed in the TEM micrographs can have varying thickness.
Beneath the polymer coating lies the chain-transfer agent (CTA) layer, which is composed of sulfur-containing thiol groups. The EDXS scan revealed a distinct sulfur (S, orange) peak, confirming the presence of the CTA. The sulfur signal was confined to a very thin layer, approximately less than 2 nm thick, positioned between the polymer coating and the silica nanoparticle core. This sharp sulfur peak highlights the thin, interfacial nature of the CTA layer, suggesting that it played a key role in the polymerization process without significantly extending beyond the interface region.
The innermost layer, representing the silica nanoparticle core, was characterized by strong silicon (Si, blue) and oxygen (O, red) signals in a 1:2 ratio, which was expected of silica. The EDXS data showed a clear transition to a homogenous intensity of silicon and oxygen peaks as the scan moved towards the core. The absence of significant sulfur or nitrogen signals in this region confirmed that the coating along the scan axis was thin and no large PAN or SH-TMS agglomerates were formed.
After confirming the viability of visual identification of the coating layer in TEM micrographs (Fig. S7–15†), all coated particles were assessed for their average coating thickness by measuring the visible coating layer in ImageJ. For each sample, about 40–80 values were measured in even intervals wherever the coating layer was clearly identifiable. The arithmetic mean values and standard derivation of the coating thickness of all samples was calculated and plotted against the Mn obtained from the crude solution (depicted in Fig. 6).
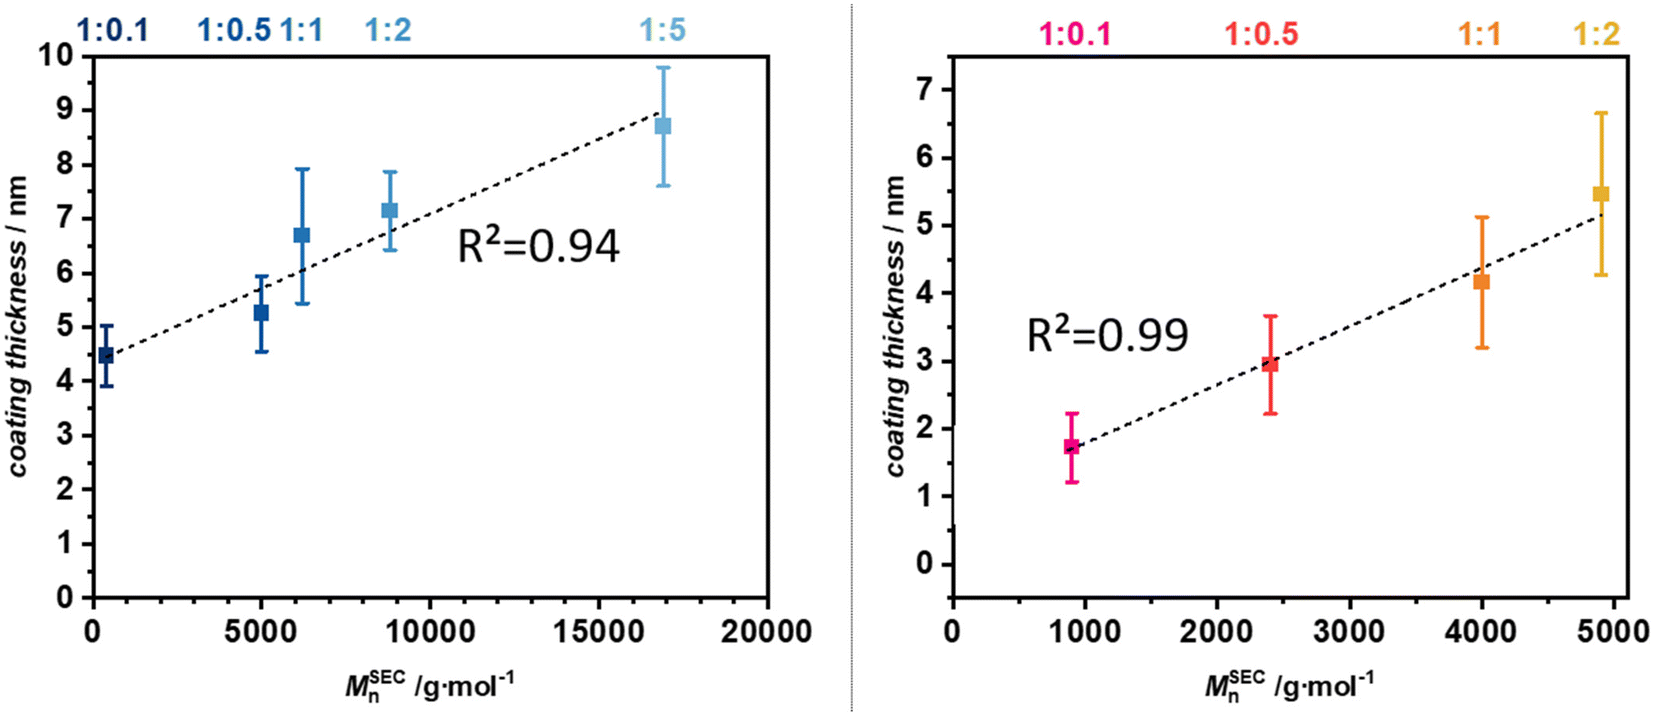 | ||
| Fig. 6 M n in solution plotted against the coating thickness of PMMA (left) and PAN (right) on SiO2-NPs. Values for the coating thickness are derived from ImageJ. Depicted is the arithmetic mean with one standard deviation as error. The dotted line is the linear fit of the Mn-coating thickness data points indicating a strong correlation between polymer chain length in solution and coating thickness on the surface of SiO2-NPs. All values used for calculation are available in the ESI Table S1† and following. | ||
Importantly both PMMA- and PAN-coated nanoparticles were suspended in water and dried for cryo-TEM measurements. Due to their distinct affinities for water, the hydration and subsequent drying of the particles may influence the coating thickness, potentially rendering a cross-correlation between PMMA and PAN invalid. However, the correlation between thickness and molecular weight remains valid for each polymer type individually.
Evidently, the coating behavior of PMMA and PAN differed on the SiO2-NPs. For PMMA the coating thickness started at approximately 4.4 nm at the lowest monomer concentration while for PAN it started at 1.7 nm. This difference reinforces the assumption, that MMA has a higher affinity towards a chain-transfer to the thiol-surface as more PMMA chains attached to the particles leading to a higher coating thickness. As the molecular weight increased, the coating thickness showed a consistent upward trend for both polymer coatings, eventually reaching around 7.1 nm for PMMA and 5.5 nm for PAN at a ratio of 1:2. The trend of PMMA having a thicker coating layer continued for all concentrations, however, the difference in coating thickness between the two polymer shrank from 2.7 nm at 1:0.1 to 1.6 nm at 1:2. Therefore, it seems that at higher monomer concentrations, the loss of moderating effect of the thiol CTA as seen in the increased dispersity, also leads to a more monomer independent coating behavior. Moreover, the linear fit function for PMMA has a R2 of 0.94 which was comparable to the value obtained from the TGA-Mn correlation. PAN on the other hand had a significantly higher R2 of 0.99 compared to 0.94 obtained from the TGA-Mn correlation. Also, PAN seems to have a more linear increase in variance of its coating thickness. This finding is interesting, as a more controlled polymerization with MMA should lead to a more even chain-growth and thus a more homogeneous coating. It seems, the diffusion limitations at the surface lead to a slightly more uneven chain-growth at the particle surface and the higher rate of transfers and termination in growing PAN chains apparently suppressed this effect and led to a more even coating thickness distribution.
3. Conclusions
In conclusion, homogeneously PMMA- and PAN-coated silica nanoparticles were synthesized with various polymer coating thicknesses through a chain-transfer polymerization with the CTA attached to the particle surface. It was found that the mass loss in TGA and coating thickness obtained from TEM micrographs correlated strongly with the average polymer chain-length in the crude reaction mixture. Using the free polymer chains in solution leaves the coated particles intact without the need to cleave polymer chains from the particle surface as is required for controlled surface polymerizations utilizing, e.g., ATRP, NMP or RAFT. PMMA has a higher coating thickness than PAN at the same monomer concentration. Overall, increasing the monomer concentration led to higher coating thickness, while also increasing unevenness and agglomerates in the coating. Diffusion limitations at the surface appear to have caused uneven chain growth for PMMA coatings, while PAN's higher rates of transfer and termination mitigate this effect slightly, resulting in a more uniform coating thickness, although the PAN polymerization overall was less controlled compared to PMMA.4. Experimental
4.1. Materials
| Chemical | Supplier |
|---|---|
| Silica nanoparticles (SiO2, 99.9%, 200 nm, spherical) | US Research Nanomaterials, Inc. |
| (3-Mercaptopropyl)trimethoxysilane (95%) | Sigma Aldrich |
| Acrylonitrile 99+ % | Acros Organics |
| Methyl methacrylate 99%, stabilized | Sigma Aldrich |
| Azobisisobutyronitrile 98% | Sigma Aldrich |
| N,N-Dimethylformamide, 99.8%, extra dry, over molecular sieve | Acros Organics |
| Acetic acid 100% | Carl Roth |
| Ethanol 99% | VWR |
| Dichloromethane 99.5% | VWR |
4.2. Characterization techniques
THF SEC was carried out on a Tosoh Bioscience HLC-8320GPC EcoSEC system equipped with 3 PSS SDV columns, 5 μm (100, 1000, 100000 Å) (8 × 300 mm2), and a UV and a differential refractive index (RI) detector. The operation temperature was set to 35 °C with a flow rate of 1 mL min−1. Calibration is done with ReadyCal Standards purchased from PSS in the range of 800–2.2 mio. Da for PMMA, and 370–2.52 Da for PS.
Typically, 50 μL of a 2.0 mg mL−1 sample solution was injected onto the columns. Evaluation is done in PSS WinGPC UniChrom software.
Alternatively, EDX elemental maps of Si (Si–Kα line), O (O–Kα line), N (N–Kα line) and S (S–Kα line) are recorded and used to investigate their distribution within nanoparticles. The maps are analyzed by using the ESPRIT software (version 1.9) from Bruker.
4.3. Synthesis
Data availability
The data supporting this article have been included as part of the ESI.† Further, the raw data used is available under https://dx.doi.org/10.22000/r3rtjpe1b5w7zbzw.Conflicts of interest
There are no conflicts to declare.Acknowledgements
Financial support from the Federal Ministry of Education and Research (BMBF) within the project FestBatt2-Hybrid (03XP0428C) is gratefully acknowledged. A. S. and F. H. S. are grateful for support from the DFG within the SFB 1278 “PolyTarget” (project number 316213987, project B04). The TEM facilities of the Jena Center for Soft Matter (JCSM) were established with a grant from the German Research Council (DFG) and the European Fonds for Regional Development (EFRE).References
- X. Ma, M. Liu, Q. Wu, X. Guan, F. Wang, H. Liu and J. Xu, ACS Appl. Mater. Interfaces, 2022, 14, 53828–53839 CAS.
- J. Khandare and T. Minko, Prog. Polym. Sci., 2006, 31, 359–397 CAS.
- M. Khalkhali, K. Rostamizadeh, S. Sadighian, F. Khoeini, M. Naghibi and M. Hamidi, Daru, J. Pharm. Sci., 2015, 23, 45 Search PubMed.
- S. Mumtaz, S. Ali, S. Mumtaz, T. A. Mughal, H. M. Tahir and H. A. Shakir, Polym. Bull., 2023, 80, 4719–4736 CAS.
- M. Nasrollahzadeh, N. Shafiei, M. Maham, Z. Issaabadi, Z. Nezafat and R. S. Varma, Mol. Catal., 2020, 494, 111129 CrossRef CAS.
- H. ShamsiJazeyi, C. A. Miller, M. S. Wong, J. M. Tour and R. Verduzco, J. Appl. Polym. Sci., 2014, 131(15), 40576 Search PubMed.
- U. Baig, M. K. Uddin and M. Sajid, Mater. Today Commun., 2020, 25, 101534 CAS.
- M. G. Soliman, B. Pelaz, W. J. Parak and P. del Pino, Chem. Mater., 2015, 27, 990–997 CAS.
- M. J. A. Hore, Soft Matter, 2019, 15, 1120–1134 CAS.
- K. Matyjaszewski and N. V. Tsarevsky, Nat. Chem., 2009, 1, 276–288 CrossRef CAS PubMed.
- D. A. Savin, J. Pyun, G. D. Patterson, T. Kowalewski and K. Matyjaszewski, J. Polym. Sci., Part B: Polym. Phys., 2002, 40, 2667–2676 CAS.
- B. Ou and D. Li, Sci. China, Ser. B: Chem., 2008, 51, 51–57 CAS.
- F. Zhou, W. Liu, M. Chen and D. C. Sun, Chem. Commun., 2001, 2446–2447 RSC.
- S. Balke, L. Garcia-Rubio and R. Patel, Polym. Eng. Sci., 1982, 22, 777–787 CrossRef CAS.
- J.-J. Hwang, C.-Y. Wu, Y.-H. Hung, M.-X. Li, K.-H. Luo, H.-W. Jia, J. N. I. Balitaan, S.-R. Lin and J.-M. Yeh, Surf. Interfaces, 2023, 36, 102548 CrossRef CAS.
- P. Biehl and F. H. Schacher, Surfaces, 2020, 3, 116–131 CrossRef CAS.
- A. Aqil, C. Detrembleur, B. Gilbert, R. Jérôme and C. Jérôme, Chem. Mater., 2007, 19, 2150–2154 CrossRef CAS.
- X. Li, Z. Chen, S. Shi, J. Yuan, W. Sun, Y. Liu, S.-J. Su, J. Loos, K. Liu and T. Wen, Polym. Chem., 2023, 14, 2788–2796 RSC.
- M. Nomura, H. Suzuki, H. Tokunaga and K. Fujita, J. Appl. Polym. Sci., 1994, 51, 21–31 CrossRef CAS.
- S. Beuermann, M. Buback, T. P. Davis, R. G. Gilbert, R. A. Hutchinson, A. Kajiwara, B. Klumperman and G. T. Russell, Macromol. Chem. Phys., 2000, 201, 1355–1364 CrossRef CAS.
- D. M. Huang, M. J. Monteiro and R. G. Gilbert, Macromolecules, 1998, 31, 5175–5187 CrossRef CAS.
Footnote |
| † Electronic supplementary information (ESI) available. See DOI: https://doi.org/10.1039/d5py00081e |
| This journal is © The Royal Society of Chemistry 2025 |