
 Open Access Article
 This Open Access Article is licensed under a Creative Commons Attribution-Non Commercial 3.0 Unported Licence
Personalized medicine: a quality by design approach to printable tablet production†
Thomas P.
Forbes
 *a,
Olivia
Agolini
b,
Zainab
Altamimi
c and
Jeffrey
Lawrence
a
*a,
Olivia
Agolini
b,
Zainab
Altamimi
c and
Jeffrey
Lawrence
a
aNational Institute of Standards and Technology, Materials Measurement Science Division, Gaithersburg, MD 20899, USA. E-mail: thomas.forbes@nist.gov
bUniversity of Virginia, Department of Biomedical Engineering, Charlottesville, VA 22904, USA
cGannon University, Department of Biomedical Engineering, Erie, PA 16541, USA
First published on 7th July 2025
Abstract
The versatility afforded by emerging additive manufacturing technologies (e.g., 3D printing and precision drop-on-demand deposition) has enabled the rapid and agile production of personalized medicine. The on-demand customization capabilities of these technologies provide novel avenues for point-of-care or distributed pharmaceutical manufacturing and compounding applications. Quality by design principles were used to investigate the production of solid tablet dosage forms for narrow therapeutic index (warfarin), selective serotonin reuptake inhibitor (citalopram), and medical countermeasure (doxycycline) drugs. We examined critical material attributes, critical process parameters, and critical quality attributes for the semisolid extrusion of pharmaceutical tablet excipients and drop-on-demand active pharmaceutical ingredient (API) ink dosing. Detailed investigations optimized the API ink formulation – specifically fluid properties relative to the tablet semisolid excipient, excipient temperature and physical state (i.e., solid vs. liquid), and solidification time – allowing for API and excipient mixing and redistribution. Personalized drug dosages, adjusted doses, and tapered regimens were manufactured, demonstrating accurate API quantity and required production content uniformity, as specified by the U.S. Pharmacopeia. Atline API ink verification and inline drop counting control strategies were employed and confirmed by post-production quantification measurements to properly maintain tablet-to-tablet quality assurance.
Introduction
The emergence of innovative technologies and developments in existing technologies have advanced pharmaceutical manufacturing processes, control strategies, and drug product formulations.1,2 These advancements cover the spectrum from Industry 4.0 concepts such as integrated and autonomous systems, artificial intelligence or adaptive learning, and digital twins3,4 to additive manufacturing, 2D and 3D printing, and microdispensing or material jetting.5–7 Many of these emerging technologies have progressed during, and in the shadow of, the COVID-19 pandemic, which highlighted the critical need for robust supply chains, a networked production infrastructure, and distribution avenues of medicine. Advanced manufacturing schemes seek to not only improve the quality of medicine but provide an agile and resilient production paradigm to avoid drug shortages and delayed response to public health emergencies. One component of this responsive paradigm is the expansion of distributed and point-of-care (POC) pharmaceutical manufacturing facilities,8–10 as well as compounded drug outsourcing facilities11 – a relatively new category of compounders (as defined by the United States [U.S.] Food and Drug Administration [FDA]).12Distributed manufacturing (DM) refers to a decentralization of manufacturing across numerous facilities, all operating under an overarching pharmaceutical quality system (PQS) or within their own.13 POC facilities take this a step further, with placement in close proximity to patients where produced drugs will be administered, further reducing lead time. Portable on demand or pharmacy on demand facilities that can be relocated as needed have also been introduced.14 These varieties would operate under approved current good manufacturing practice (CGMP) standards. Traditional compounding facilities and outsourcing facilities provide support for specific patient needs at pharmacies, hospitals, and related health care facilities. It is important to note that these areas operate under differing regulations and requirements as established across the U.S. by the Federal Food, Drug, and Cosmetic Act of 1938, FDA Modernization Act of 1997, and Drug Quality and Security Act of 2013 and operate together to support diverse needs across the health care system.
As pharmaceutical manufacturing and compounding improve production agility, avenues for personalized medicine, pediatric or special dosing, drug shortage mitigation, and small(er) batch clinical trial production have evolved.15–18 Additive manufacturing technologies demonstrate appealing capabilities for on-demand production of customizable drug products.19–22 The overarching area of additive manufacturing and 3D printing covers quite a few technologies, such as fused deposition modelling (FDM), semisolid extrusion (SSE), drop-on-demand (DoD) or inkjet printing (IJP), direct powder extrusion (DPE), selective laser sintering (SLS), and more; many of which have found application in pharmaceutical production.21–24 These methods exhibit a range of benefits and limitations for pharmaceutical production, which are dependent on the active pharmaceutical ingredient (API) or bulk drug substance (BDS) incorporated, as well as the patient needs and delivery/dissolution properties. Delivery mechanisms often include vehicles such as tablets, orodispersible films, and other related solid dosage forms. However, capsule filling and single-dose liquid vials also present options to rapid printing or production avenues. Numerous reviews across the additive manufacturing of pharmaceuticals field are available, providing further details.5,16,21,22,25,26 Here, we focused on an additive manufacturing process decoupling the production of the solid tablet form (i.e., without drug or active ingredient), from the precision DoD deposition of formulated API ink to create a complete API-dosed tablet.26,27
In line with our previous work27 and accordance with the FDA's adoption,28–30 we employed a quality by design (QbD) approach to investigate the production of personalized medicine in tablet dosage forms. QbD generally focuses on a detailed understanding of the processes involved and final product, all with an analysis of the associated risks and appropriate control measures for risk mitigation. Detailed definitions for the QbD framework can be found in the International Conference on Harmonization (ICH) Quality Guidelines.28 We investigated a manufacturing workflow comprised of API ink creation, API microdispensing, and personalized tablet dose production. Critical material attributes (CMAs), critical process parameters (CPPs) and critical quality attributes (CQAs) for a pharmaceutical operation combining the tablet production and API dosing were identified and examined.
We built upon the risk assessment (based on cause-and-effect analysis)31,32 and control measures (i.e., atline API ink verification and inline drop counting) developed in our previous work.27 Here, we focused on tablet production with a semisolid pharmaceutical excipient and the interactions associated with DoD API dosing. CMAs and CPPs, including API ink formulation, tablet state during API dosing (i.e., solid vs. liquid), and the solidification time were examined, ultimately evaluating their impact on the final tablet product CQAs. Process performance was predominantly characterized in terms of the tablet dose CQA; however, following process optimization, content uniformity and dissolution attributes were also measured. Personalized and customizable tablet dosages were manufactured for a number of relevant drug categories, including narrow therapeutic index (NTI) drugs – requiring dose precision,33 selective serotonin reuptake inhibitors (SSRIs) – drugs amendable to personalized tapering,34 and medical countermeasures (MCMs) – for emergency response.35 The produced tablets met relevant API quantity and content uniformity metrics defined by the U.S. Pharmacopeia (USP).36
Methods
Materials and sample preparation
Citalopram hydrobromide (HBr) [biopharmaceutical classification system (BCS) Class II], warfarin sodium (BCS Class I), doxycycline (BCS Class I), dimethyl sulfoxide (DMSO), ethanol (EtOH), propylene glycol (PG), and phosphate buffered saline (PBS) were purchased from Sigma-Aldrich (St Louis, MO, USA). The digestible semisolids Gelucire 48/16 (polyoxyl-32 stearate) and Gelucire 50/13 (stearoyl polyoxyl-32 glycerides), and sustained release excipient Compritrol 888 ATO (glyceryl dibehenate) were provided as samples from Gattefossé USA (Paramus, NJ, USA) and used as the bulk tablet component. API inks of specific concentrations were gravimetrically produced by dissolution of purchased API powders in an appropriate solvent or solvent mixture. The properties of the ink composition played an important role and details are provided below. Warfarin sodium was dissolved in deionized water and citalopram HBr was dissolved in a 2![[thin space (1/6-em)]](https://www.rsc.org/images/entities/char_2009.gif) :3:5 (v/v/v) mixture of deionized water:EtOH:PG, both at 200 mg mL−1. Doxycycline ink was dissolved in DMSO at concentrations ranging from 100 mg mL−1 to 25 mg mL−1, depending on targeted dose ranges. DMSO presented appealing printability and ethanol aided in solubility, both of which are classified by the U.S. FDA as Class 3 residual solvents. Class 3 residual levels less than 50 mg per day are accepted – well above the mass of solvents employed in this study. Class 3 is the safest category with further specifications in ICH and USP documentation (ICH Q3C Impurities: Residual Solvents and USP 〈467〉 Residual Solvents).
:3:5 (v/v/v) mixture of deionized water:EtOH:PG, both at 200 mg mL−1. Doxycycline ink was dissolved in DMSO at concentrations ranging from 100 mg mL−1 to 25 mg mL−1, depending on targeted dose ranges. DMSO presented appealing printability and ethanol aided in solubility, both of which are classified by the U.S. FDA as Class 3 residual solvents. Class 3 residual levels less than 50 mg per day are accepted – well above the mass of solvents employed in this study. Class 3 is the safest category with further specifications in ICH and USP documentation (ICH Q3C Impurities: Residual Solvents and USP 〈467〉 Residual Solvents).
Instrumentation
:EtOH:PG citalopram HBr pharmaceutical ink. The specific 2:3:5 (v/v/v) water:EtOH:PG mixture was incorporated due to the high solubility of citalopram HBr as demonstrated in the literature.19 The general process involved adjusting the pressure pulse magnitude through a range of values and enumerating the ejected drops to completely dispense a defined quantity (using a calibrated pipette). Each pressure level was measured in triplicate to provide a complete calibration curve for operation. Lastly, a custom heated aluminum plate was incorporated into the target housing to maintain tablets in a liquid state. This will be discussed more below.
 | ||
| Fig. 1 (a) Photograph of the API dispensing system, identifying the pressure heads (×8), API ink source plate, inline LED/photodiode drop detection, API deposition (×6 active nozzles), and semisolid tablets held by the delivery vehicle target plate. (b) Schematic representation of a single nozzle with approximate tablet dimensions and ‘Base’/‘Apex’ labels for conical geometry. Photographs of (c) the empty tablet mold and (d) full of API-dosed tablets. Scale: tablet diameters are approximately 8 mm. | ||
000 frames per s using a FASTCAM Nova camera (Model S6, 800K-M-32GB, Photron USA, Inc., San Diego, CA, USA). Additional lighting was supplied by an adjustable gooseneck fiber optic light source. Video images were captured and cropped using the Photron FASTCAM Viewer (PFV) software. Manufactured tablets were also imaged by scanning electron microscope (JSM-7800F SEM, JEOL USA, Peabody, MA, USA) with electron beam energy of 1.5 keV. Preliminary dissolution studies were conducted with USP apparatus 2 (paddle) at 50 rpm, in 250 mL PBS buffer held at 37 °C by a temperature-controlled water bath (Dissolution Tester DT 126 Light, Erweka GmbH, Langen, Germany). Time-point samples were withdrawn from the vessel (3 replicate 1 mL samples) and measured by UV-Vis spectroscopy. PBS buffer at temperature replenished the extracted volumes of each dissolution vessel.
Data processing and evaluation of uncertainty
![[X with combining overline]](https://www.rsc.org/images/entities/i_char_0058_0305.gif) | + ks. Variables were defined as API quantities relative to the label specified dosage. Preliminary determinations of the AV were taken from n = 10 tablets, with = mean API content across tablets (as % label dose),
| + ks. Variables were defined as API quantities relative to the label specified dosage. Preliminary determinations of the AV were taken from n = 10 tablets, with = mean API content across tablets (as % label dose),  is the tablet dose standard deviation, and k = 2.4 is an acceptability constant. The parameter M was based off the average tablet dose (with target dose of 100%), where: if 98.5% ≤ ≤ 101.5%, M = ; if < 98.5%, M = 98.5%; and if > 101.5%, M = 101.5%. The USP guidelines specified a required AV below 15% for evaluation of the first 10 tablets. If the preliminary measurement yielded AV > 15%, then 30 tablets can be evaluated in the same manner with an acceptability constant of k = 2.0.
Results and discussion
Process and product characterization
QbD principles were employed to focus the study of critical parameters impacting the process and final product, as well as guiding effective control strategies of high-risk aspects. Similar to our previous work, we considered a DoD pharmaceutical manufacturing process comprised of three main operations, specifically, (1) the stock API pharmaceutical ink formulation and production, (2) API deposition/dosing, and (3) delivery vehicle production (Fig. 2(a)).27 Here, we focused solely on the production of tablet-based delivery. The overall workflow considered pharmaceutical ink formulation and production either at a more traditional manufacturing facility with GMP standards and documented pharmaceutical quality system (i.e., part of an approved drug product) or on-site in a compounding scenario – traditional or outsourcing facility (Fig. S2(a) and S2(b)†). The certified pharmaceutical ink, distributed to POC facilities, or formulated on-site, would be verified by spectroscopic techniques prior to use (e.g., UV-Vis, NIR, or Raman). This control strategy confirmed the status of the ink, put in place to eliminate production with degraded or otherwise out of specification inks. The following two pharmaceutical operations – API deposition and tablet production – were closely intertwined and completed at the POC. This work focused on the DoD deposition onto and into tablets composed of semisolid excipient materials (Fig. 1). A series of individually-addressable pressure heads and source nozzles generated API ink bursts toward a target plate containing the delivery vehicle – in this instance, tablets. The platform included an array of LED-photodiodes for detection of discrete ink bursts for traceable monitoring and quantification of the number dispensed. Our previous work27 investigated this inline control strategy, thus we employed it here for dose confirmation. The delivery vehicle target (a PDMS tablet mold) held the arrayed format of conical tablets. | ||
| Fig. 2 (a) Pharmaceutical production operations: 1. API ink creation, 2. API microdispensing, and 3. tablet (delivery vehicle) production. (b) The interplay between tablet production and API dosing is captured in the functional relationship between CMAs, CPPs, and CQAs. The API ink and semisolid excipient input materials were operated on to create personalized dose tablets. Italicized CPPs for the API deposition component were investigated in previous work.27 The CMAs, CPPs, and CQAs in red and labeled with an asterisk (*) were considered here. | ||
An important aspect of a QbD approach to process and product design is the interplay and relationship between the input materials, process parameters, and output materials of a pharmaceutical operation or operations. Fig. 2(b) displays a demonstrative functional relationship between the input material attributes (considering tablet materials and APIs), process parameters, and output material quality attributes (of a final product) for the combined tablet production/API dosing operations. A risk assessment was incorporated to identify the CMAs, CPPs, and CQAs – those parameters or properties with greatest impact on the final product quality (ICH guidelines Q8).28 This risk assessment was an expansion of previous assessments using cause-and-effect analysis and Ishikawa diagrams.27 The process parameters listed in italics in Fig. 2(b) were investigated in detail previously.27 We now focused on those CMAs, CPPs, and CQAs, specific to the tablet production process and interplay with API deposition (i.e., tablet dosing) (those starred in Fig. 2(b)). These included the pharmaceutical ink properties (e.g., the ink solvent density, specifically related to the tablet material properties) the tablet state during dosing (i.e., solid form or liquid form of the semisolid), and the post-printing solidification time (i.e., how long the tablet was maintained liquified before allowed to solidify). The CMAs and CPPs were investigated, and the final optimization employed to measure CQAs: API quantity (or dose) in individual tablets, production content uniformity (measured by the USP acceptance value), and tablet dissolution profiles.
API ink production
Several API pharmaceutical inks were investigated, specifically to address various potential applications for POC manufacturing or compounding of personalized medicine. These included, (1) NTI drugs, which may require precise dosing specific to a patient, (2) SSRIs for depression and other drugs (e.g., opioids) that may require a personalized or customizable taper to wean off, and (3) MCMs, which may require a significant local increase in availability resulting from a public health emergency. Though a range of compounds were investigated, we focused the presented results and discussion on a compound from each category, specifically, the anticoagulant warfarin (NTI), the antidepressant citalopram (SSRI), and antibiotic doxycycline (MCM – used to prevent malaria). Representative mass, UV-Vis, and Raman spectra can be found in the ESI (Fig. S3†). In line with our previous work, formulated API ink were verified by UV-Vis spectroscopy prior to production.27 Here, we updated this measurement to employ a microdrop spectrometer requiring only 0.3 μL to 2.0 μL of API ink. Though UV-Vis was used here, alternative non-destructive spectroscopic techniques such as near infrared (NIR) or Raman spectroscopy could also be incorporated.Tablet production and API deposition
The delivery vehicle or mechanism (e.g., single-dose liquid vials, capsules, tablets, orodispersible films, nasal aerosols, etc.) plays an important role in the material attributes and process parameters with the greatest impact on the final product. Similarly, the specific API, patient, and therapeutic need will also influence which delivery avenue is best or most appropriate. Here, we focused exclusively on the production of tablet forms from semisolid excipient materials. The Compritrol extended-release excipient required slightly higher temperatures for melting (≈90 °C to 100 °C) and was not used for the remainder of this work. The digestible Gelucire lipid materials liquified at around 70 °C to 80 °C and exhibited ethylene oxide repeat units (C2OH4) in their mass spectra (Fig. S4(a) and S4(b)†). The THz Raman of each semisolid demonstrated similar vibration and rotational mode peaks, with the Gelucire 48/16 presenting a more intense lattice vibration peak in the low frequency range (Fig. S4(c)†). THz Raman was also employed to observe the solidification of the Gelucire material from an amorphous liquid to an amorphous solid to a crystalline solid (Fig. S4(d)†). The intense crystal lattice vibration peak in the 76 cm−1 to 77 cm−1 wavenumber range was used in studies discussed below. The two Gelucire variations performed similarly for most of the investigations presented here. The Gelucire 50/13 exhibited a significant increase in viscosity at a higher temperature during the cooling process, likely the appealing feature for its applicability to FDM 3D printing approaches. However, SSE was employed here with a mold to define geometry, for which we focused predominantly on the Gelucire 48/16 semisolid excipient, which was easier in tablet production (e.g., lower melting point made for easier handling and provided more time to dose with API). A conical tablet geometry was considered, though any relevant mold could be employed. The base tablets comprised of 55 μL of the semisolid material at approximately 75 °C, extruded into each well of the tablet mold (Fig. 1). Base Gelucire 48/16 and 50/13 tablets (i.e., without API) were (65.8 ± 1.2) mg and (61.0 ± 2.0) mg (n = 10 each).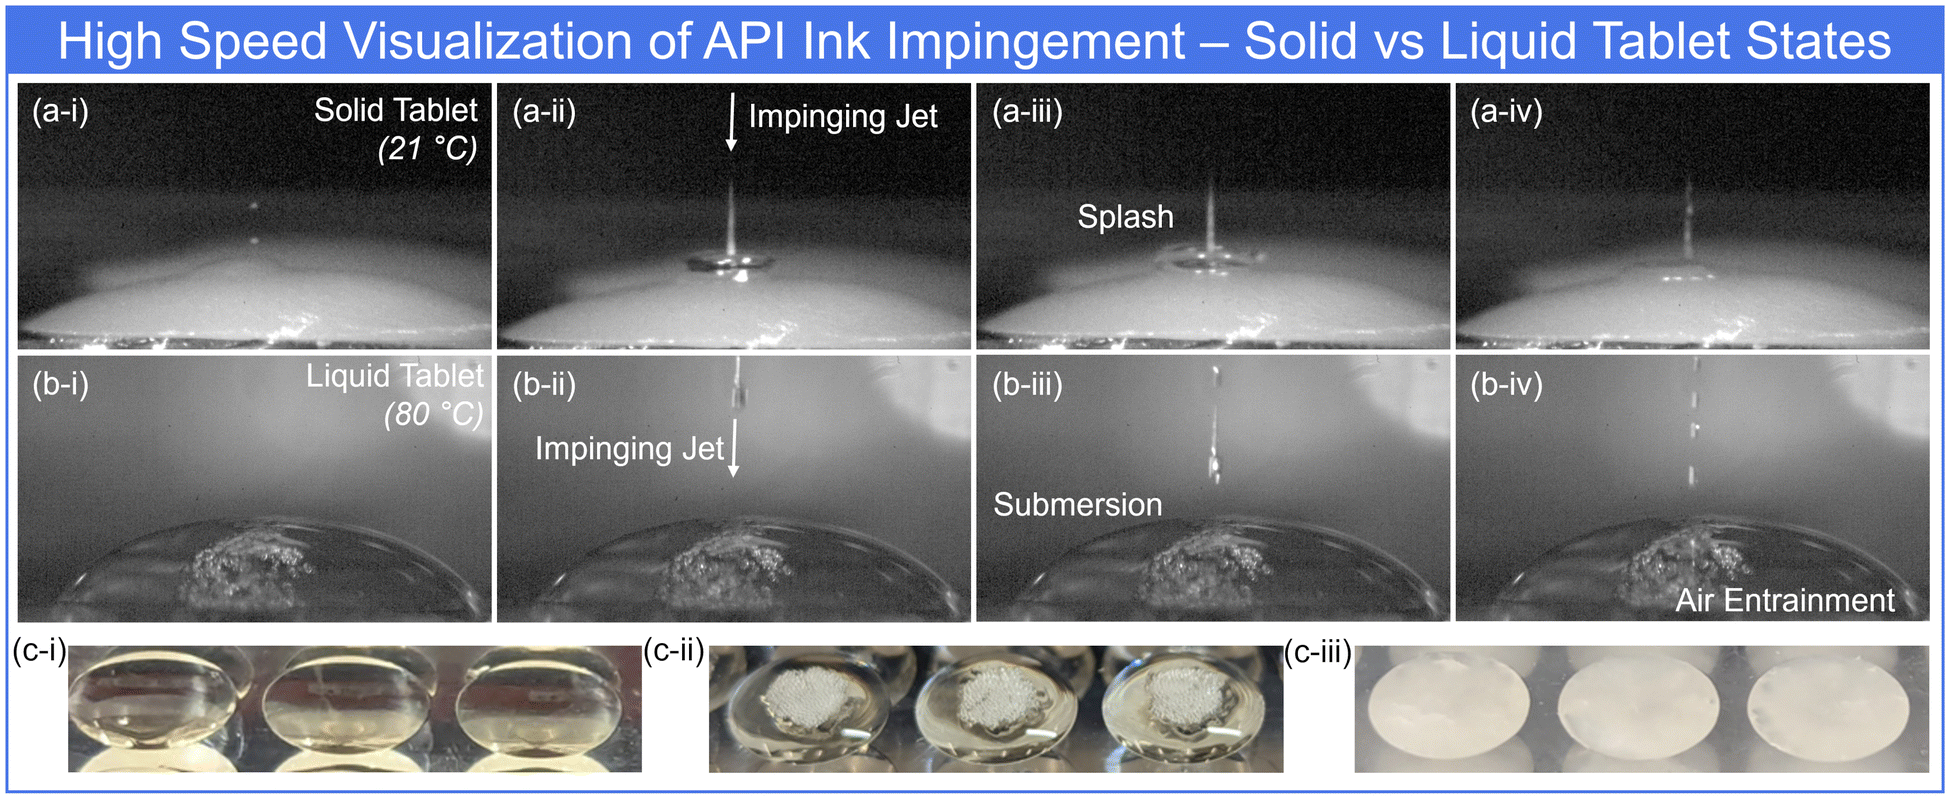 | ||
| Fig. 3 High-speed visualization of (a) drop/jet impingement and splashing onto solid tablets and (b) jet impingement and submersion into liquid tablets. Images of (1024 × 576) pixels were acquired at 12000 frames per s by a FASTCAM Nova camera and cropped for display. (c) Photographic images of (i) liquid, (ii) API-dosed, and (iii) solidified tablets. Scale: tablet diameters are approximately 8 mm. | ||
In general, the uncertainty of API loss due to such effects led to a focus on API ink encapsulation within liquid tablets. The tablet plate was heated to melt the tablets prior to API dosing. Fig. 3(b) demonstrates the impingement and submersion of a DMSO-based API ink into a liquid tablet. The surface deformation created by the impacting ink entrained air bubbles into the viscous excipient material (Fig. 3(b) and (c-ii)). The entrained air escaped during the solidification period as the tablet cooled (Fig. 3(c-iii)); however the interplay between excipient and API solvent affected the final product, which we cover next. Future work will also consider alternative dispensing parameters to reduce ejection velocities and presumably air entrainment.
The chemical characterizations provided below did not exhibit molecular degradation of the warfarin, citalopram, or doxycycline following the tablet production process (i.e., no additional absorbance or vibrational peaks, or mass spectral differences readily observed). However, the process of heating the tablets for API encapsulation may be detrimental to more labile APIs that are thermally sensitive. Similar hurdles must be considered for related tablet 3D printing and additive manufacturing schemes that require heated printheads.18,20,39 Alternative delivery mechanisms, including, capsules, orodispersible films, or single-dose liquid vials should be investigated for more labile or sensitive APIs.
 | ||
| Fig. 4 Images of liquid semisolid tablets dosed with (a) DMSO- and (b) water-based blue dye API inks. Insets display the solidified tablets and schematic representation of the API (i.e., blue dye in this case) spatial location. Scale: tablet diameters are approximately 8 mm. | ||
 | ||
| Fig. 5 (a) Residual DMSO from tablets dosed with 10 μL of DMSO ink as a function of the time remaining at elevated temperatures in liquid state (i.e., solidification delay). Datapoints and uncertainty represent the average and standard deviation of UV-Vis peak intensity for triplicate measurements from triplicate tablets at each setting (i.e., nine total measurements). Horizontal line represents the DMSO peak intensity for triplicate blank tablets dissolved in PBS followed by addition of 10 μL DMSO. (b) Representative THz Raman spectra for the semisolid tablet material and DMSO with peaks identified for monitoring through line scans. Inset displays the direction of laser interrogation and line down the slope for the line scans. Rotated line scan results exhibit the distribution of (i) Gelucire and (ii) DMSO for (c) 0 min and (d) 120 min solidification delays, with (iii) corresponding SEM images (scale bar: 1 mm). | ||
 | ||
| Fig. 6 Photographs of base, apex, and side views for tablets dosed with (a) DMSO-based and (b) water-based inks of red dye as a function of the solidification delay time. Scale: tablets are approximately 8 mm in diameter. UV-Vis spectroscopy peak intensities for (c) doxycycline from DMSO-based ink and (d) warfarin from water-based ink as a function of solidification time. Horizontal lines display the peak intensity for blank tablets dissolved in PBS and then dosed with (c) 1 mg doxycycline or (d) 2 mg warfarin. Data points and uncertainty represented by average and standard deviation (often smaller than datapoint) of triplicate measurements from triplicate tablets at each point. | ||
Delaying solidification led to diffusive mixing of the DMSO ink and semisolid tablet materials, improving the structural integrity and yielding an increased DMSO intensity in the measurement of dissolved tablets (Fig. 5(a)). A maximum DMSO signal was observed for a delay time of around 45 minutes. Further increases to the delay time resulted in a gradual decrease in DMSO content, attributed to evaporative losses. The redistribution and evaporation of DMSO was further investigated spatially by THz Raman spectroscopy line scans down the conical slope of the tablets. Fig. 5(b) displays the spectra for the pure semisolid excipient (Gelucire 48/16) and pure DMSO. Line scans were acquired starting at the tablet apex and moving toward the base edge (Fig. 5(b) inset). Representative peaks of 76 cm−1 (Gelucire excipient) and 674 cm−1 (DMSO) were monitored and rotated 360°, generating 2D images of the distribution (rough approximation of radial symmetry). Fig. 5(c) displays the approximate distribution of Gelucire and DMSO immediately following production (pure Gelucire tablet for reference displayed in Fig. S7†). Confirming the prior observations, the DMSO initially sank through the Gelucire excipient and concentrated at the tablet apex. The semisolid excipient solidified around the still liquid DMSO. Any remaining liquid DMSO in the tablet rapidly evaporated under the SEM vacuum during attempts to visualize – Fig. 5(c-iii). This residual DMSO left voids and crevasses in the tablet apex region (Fig. 5(c-iii)). Alternatively, allowing appropriate mixing and evaporation of the DMSO-based ink and semisolid excipient during a lengthy solidification delay, significantly reduced the spatial concentration of DMSO at the apex (Fig. 5(d)) and yielded much smoother and robust tablets (Fig. 5(d-iii)) without the voids seen in Fig. 5(c-iii). Similar results were demonstrated for the Gelucire 50/13 semisolid excipient (Fig. S8†).
The preliminary analysis of delaying tablet solidification focused on the DMSO component of the ink due to the strong resulting signals for both UV-Vis and Raman spectroscopy measurements. Next, we verified the results translated to the API component of the pharmaceutical inks. Fig. 6(a) displays tablets dosed with a DMSO-based red ink for visualization, confirming the relative locations and diffusive mixing of the dye. DMSO losses were also observed as the tablets allowed to solidify immediately were removed from the mold (Fig. 6(a) inset). A DMSO-based pharmaceutical ink of the antibiotic doxycycline was used to create 1 mg tablets. Fig. 6(c) demonstrates the peak intensity of the doxycycline from dissolved tablets as a function of solidification delay. Similar to the pure DMSO results, without a delay, the spatial separation between portions of the tablet and API ink led to losses during removal from the mold. As the delay time allowed more mixing, the losses decreased, again up to approximately 45-minute delay settings. Delays longer than 45 minutes led to minimal change in the doxycycline signal, but again demonstrated the reduction of DMSO through evaporation (Fig. 6(c)).
A mirror study was conducted with water-based red ink (Fig. 6(b)). The lower density of water kept the ink on the tablet surface (cone base) for tablets allowed to immediately solidify. However, given the high(er) vapor pressure, the water evaporated prior to the 15-minute delay time point. All remaining timepoints exhibited a redistribution of the red dye molecules, first as a settling to the tablet apex, followed by diffusive mixing throughout the tablet. To confirm the result of these transport processes on the API, water-based pharmaceutical warfarin sodium ink was used to produce 2 mg tablets. The properties of the water-based ink yielded consistent warfarin intensity for all solidification delay times, demonstrating no losses during removal from the mold (Fig. 6(d)). Raman measurements of the tablets from increasing solidification time further established the transport of the warfarin from at/near the base surface for 0-minute delays to encapsulated within the tablets for delays beyond (Fig. S9†). The investigation of a number of CMAs and CPPs impacting the coupled tablet production and API dosing processes provided the understanding necessary for precision production of personalized drug doses. Next, we demonstrated several potential personalized or customized applications, measuring the resulting API doses and content uniformity CQAs.
 | ||
Fig. 7 Schematic representations of on-demand (a) personalized tablet dose production and (b) personalized dose adjustments to existing tablets. Inset: tablet image. (c) Tablet production dosages, customization, deposition parameters, in-line drop-counting results, and product CQAs. (d) Boxplot distributions of four tablet production demonstrations, with quantification of 10 tablets normalized by label dose. Tablet doses displayed as open circles (○), 10-tablet mean displayed as an ‘×’, and outliers represented by stars ( ). The central horizontal line, box extent and whisker extent represent the median, lower and upper quartiles, and 1.5× interquartile range. Triangles represent 95% confidence intervals around the distribution median. ). The central horizontal line, box extent and whisker extent represent the median, lower and upper quartiles, and 1.5× interquartile range. Triangles represent 95% confidence intervals around the distribution median. | ||
The customization parameters, API deposition parameters with inline feedback drop counting, and the final product CQAs are listed in Fig. 7(c). As introduced above and investigated in previous work,27 the inline drop counting control strategy provided a real-time confirmation of each individual ‘unit’ dose – in this case each tablet. The LED/photodiode counting was processed to provide a dispense report for each print. In addition, the platform was supplied with a number of potential corrective actions for missed drops, API ink depletion, and related.27Fig. 7(c) displays a few of the outputs provided in the dispense report. The dose quantification in Fig. 7(c) represents the standard deviation of ten tablets. The uncertainty due to the linear least squares calibration was on the order of 0.1 mg to 0.13 mg, depending on dose (calibration curves: Fig. S10†). Uncertainty resulting from linear least squares could also be reduced with improved processing methods (e.g., derivative spectrophotometry)41 or advanced methods with automation (e.g., liquid chromatography and tandem mass spectrometry).27Fig. 7(d) displays boxplots of ten tablets from each customization, quantified and normalized as a percent of the label dose. The ten tablet averages were all within 4% of the label dose and content uniformity acceptance values all below the USP requirement of 15% (values reported in Fig. 7(c)).
Fig. 8(a) displays portions of the dispense report for production of ten, 2 mg tablets of the SSRI citalopram. The inline drop-counting measurement confirmed the complete dispense of 341 drops without misses for each of the tablets. Quantification of the citalopram dose within each of the ten tablets was verified by UV-Vis spectroscopy (Fig. S10†), with a mean and standard deviation across the tablets of 2.03 ± 0.05 mg (range: 98.9% to 105.7% label dose). The average content as a percentage of the label dose (i.e., 2 mg) was 101.4%, with distribution displayed in Fig. 8(b). The appropriate USP formula for content uniformity based on these values yielded a 5.7% acceptance value, below the 15% USP requirement.
 | ||
| Fig. 8 (a) Demonstration of the 10-tablet production in-line drop-counting report, confirming dispense of all drops with no misses. Inset displays the 10-tablet average dose of citalopram. (b) Boxplot display of 10-tablet distribution quantified and normalized by label dose (i.e., 2 mg). Inset displays corresponding content uniformity acceptance value. Boxplot details defined in Fig. 7 caption. (c) Quantified tablet doses for 10-day tapers starting at 2 mg following linear, halving, and logarithmic decays. Datapoints represent average tablet doses for replicate tablets. Solid lines and dotted lines represent functional fit and 95% confidence intervals. Inset displays linear, halving, and logarithmic decays (top-to-bottom) using dyed ink for visualization. | ||
Further, some medications such as certain antidepressants, opioids, benzodiazepines, or blood pressure drugs may require appropriate tapering or weaning off, often to avoid withdrawal symptoms.42,43 The presented framework for personalized medicine enables complete control over customizable taper regimens based on a physician's prescription and adapted to the patient's needs. Fig. 8(c) demonstrates three different 10-day tapers from 2 mg citalopram to 0 mg citalopram tablets. The exhibited taper regimens included a linear decrease, a halving decrease (i.e., each day was 50% the dose of the previous day), and a rapid logarithmic decrease (Fig. S11†). A wide range of alternative decay functions or multiple functions with intermediate leveling and regimen durations (e.g., weeks, months, and beyond) are possible to fit any individual needs and determination by a physician.
Finally, a preliminary look at the solid dosage form dissolution profiles for two semisolid excipients was conducted. Citalopram release from tablets produced of Gelucire 48/16 and Gelucire 50/13 was measured by microdrop UV-Vis spectroscopy across a 5-h period, sampling at (0, 5, 10, 15, 30, 45, 60, 90, 150, 210, and 300) minute timepoints. The USP monograph for citalopram tablet dissolution recommends a buffer with pH 1.5; this cursory study considered dissolution in a PBS buffer at pH 7.4 for a simple comparison of the two excipient compositions. Under these conditions, the Gelucire 48/16 dissolved quicker and more completely, releasing the citalopram (Fig. 9). Gelucire 50/13 tablets exhibited slower dissolution that yielded a turbid solution with remaining particulate (Fig. 9 (inset)). The suspended particulate in extracted samples led to the increased variability in measurements (Fig. 9(c)). Future studies will characterize dissolution for a variety of formulations, incorporating filtering prior to measurement for improved repeatability.
 | ||
| Fig. 9 (a) Citalopram tablet dissolution profiles for excipients Gelucire 48/16 and 50/13 (G-48/16 and G-50/13). Inset displays images of the solution turbidity from 300 min timepoint for both excipients. (b) Exemplary absorbance spectra for citalopram tablets of Gelucire 48/16 from each timepoint. (c) Average relative standard deviation of total measurements for each excipient. | ||
Conclusions
The advancement of additive manufacturing technologies has enabled the evolution of new routes for pharmaceutical manufacturing and compounding at distributed, point-of-care, and outsourcing facilities. This paradigm shift requires sound measurement science and risk-based control strategies to ensure compliance with CGMP and related regulations (depending on the production scenario), as well as patient safety and an effective clinical outcome. We continued to investigate such a manufacturing or compounding framework by employing QbD principles. CMAs and CPPs impacting the interaction between tablet production and API dosing – ultimately impacting final tablet CQAs – were examined in detail. The relative fluid properties of the API ink formulation and tablet semisolid excipient (e.g., density, miscibility, volatility, etc.) determined the three-dimensional spatial distribution of the API and final tablet integrity. Further, adjusting the duration the API ink and semisolid excipient interact as liquids (i.e., solidification delay time) also influenced spatial distributions and residual solvent levels. Ongoing work is exploring the mass and volume limits for API dosing of semisolid tablets, for example the relative ratios of excipient-to-API ink that still yields robust tablets with appropriate integrity. Future work also seeks to investigate additional tablet formulations, potential API-excipient interactions, and API release profiles. Though personalized and point-of-care medicine will likely be produced in small batches for short-term use, stability and shelf-life studies are needed to define tablet lifetimes.The full production process implemented here incorporated API ink formulation, API dispensing, and tablet production. Though interacting during manufacturing, the initial decoupling of API ink and tablet production enabled control strategies aimed at each to be employed. In this study we relied on atline ink verification using microdrop UV-Vis spectroscopy to check API concentration and lack of compound degradation, along with inline drop counting to confirm the dispensed dose for each tablet to mitigate production risks. Alternative atline and inline technologies such as gravimetric weighing of printed tablets39,44 or NIR spectroscopy18 have also be demonstrated for quality assurance. As the size and cost of portable Raman, other spectroscopic, and related non-destructive techniques reduces, a range of options for quality control are available.45 The optimized CMAs and CPPs, along with appropriate control strategies enabled on-demand production of personalized tablets of doxycycline, warfarin, and citalopram – all meeting dosage and content uniformity specifications. Variations on tablet customization and personalized taper decays were also demonstrated, providing opportunities for specific physician prescribed healthcare.
Conflicts of interest
The authors declare no competing financial interests.Data availability
UV-Vis spectra, mass spectra, THz Raman spectra, select print log files, and extracted data files with calibration curves, quantification, and content uniformity evaluations are available on the NIST Public Data Repository: https://doi.org/10.18434/mds2-3661. Chemical characterization data from additional compounds investigated but not included in the manuscript can be found in the Dataset, i.e., levothyroxine sodium, fluoxetine hydrochloride (HCl), and oxycodone.Acknowledgements
The authors would like to thank Matthew Staymates and Brian Bush of the National Institute of Standards and Technology for aiding with high-speed visualization and SEM imaging. Certain commercial equipment, instruments, or materials are identified in this article in order to specify the experimental procedure adequately. Such identification is not intended to imply recommendation or endorsement by NIST, nor is it intended to imply that the materials or equipment identified are necessarily the best available for the purpose. Official contribution of the National Institute of Standards and Technology; not subject to copyright in the United States.References
-
National Academies of Sciences and Medicine, Innovations in Pharmaceutical Manufacturing on the Horizon: Technical Challenges, Regulatory Issues, and Recommendations, The National Academies Press, Washington, DC, 2021, DOI:10.17226/26009
.
-
L. Nhon, Innovations in Pharmaceutical Manufacturing on the Horizon: Proceedings of a Workshop in Brief, National Acadamies of Sciences, Engineering, and Medicine, The National Academies Press, Washington, DC, 2022, DOI:10.17226/26539
- N. S. Arden, A. C. Fisher, K. Tyner, L. X. Yu, S. L. Lee and M. Kopcha, Industry 4.0 for pharmaceutical manufacturing: Preparing for the smart factories of the future, Int. J. Pharm., 2021, 602, 120554, DOI:10.1016/j.ijpharm.2021.120554
- Y. Chen, O. Yang, C. Sampat, P. Bhalode, R. Ramachandran and M. Ierapetritou, Digital Twins in Pharmaceutical and Biopharmaceutical Manufacturing: A Literature Review, Processes, 2020, 8(9), 1088 CrossRef
- P. K. Bg, S. Mehrotra, S. M. Marques, L. Kumar and R. Verma, 3D printing in personalized medicines: A focus on applications of the technology, Mater. Today Commun., 2023, 35, 105875, DOI:10.1016/j.mtcomm.2023.105875
- I. El Aita, J. Rahman, J. Breitkreutz and J. Quodbach, 3D-Printing with precise layer-wise dose adjustments for paediatric use via pressure-assisted microsyringe printing, Eur. J. Pharm. Biopharm., 2020, 157, 59–65, DOI:10.1016/j.ejpb.2020.09.012
- J. Krause, L. Müller, D. Sarwinska, A. Seidlitz, M. Sznitowska and W. Weitschies, 3D Printing of Mini Tablets for Pediatric Use, Pharmaceuticals, 2021, 14(2), 143 CrossRef CAS PubMed
- M. Algorri, M. J. Abernathy, N. S. Cauchon, T. R. Christian, C. F. Lamm and C. M. V. Moore, Re-Envisioning Pharmaceutical Manufacturing: Increasing Agility for Global Patient Access, J. Pharm. Sci., 2022, 111(3), 593–607, DOI:10.1016/j.xphs.2021.08.032
-
U.S. Food and Drug Administration, Distributed Manufacturing and Point-of-Care Manufacturing of Drugs. Center for Drug Evaluation and Research, 2022. https://www.fda.gov/about-fda/reports-budgets-cder/distributed-manufacturing-and-point-care-manufacturing-drugs-discussion-paper (accessed 2023-09-05) Search PubMed
-
U.S. Food and Drug Administration, CDER's Framework for Regulatory Advanced Manufacturing Evaluation (FRAME) Initiative. 2023. https://www.fda.gov/about-fda/center-drug-evaluation-and-research-cder/cders-framework-regulatory-advanced-manufacturing-evaluation-frame-initiative (accessed 2023-09-05) Search PubMed
- N. Beer, S. Kaae, N. Genina, S. K. Sporrong, T. L. Alves, J. Hoebert, M. L. De Bruin and I. Hegger, Magistral Compounding with 3D Printing: A Promising Way to Achieve Personalized Medicine, Ther. Innov. Regul. Sci., 2023, 57(1), 26–36, DOI:10.1007/s43441-022-00436-7
-
U.S. Food and Drug Administration, Outsourcing Facility Information, Center for Drug Evaluation and Research, 2017. https://www.fda.gov/media/107569/download Search PubMed
-
Center for Biologics Evaluation and Research and U.S. Food and Drug Administration (FDA), Guidance for Industry: Q10 Pharmaceutical Quality System, Center for Drug Evaluation and Research, 2009. https://www.fda.gov/regulatory-information/search-fda-guidance-documents/q10-pharmaceutical-quality-system (accessed) Search PubMed
- J. J. Lewin III, E. J. Choi and G. Ling, Pharmacy on demand: New technologies to enable miniaturized and mobile drug manufacturing, Am. J. Health-Syst. Pharm., 2016, 73(2), 45–54, DOI:10.2146/ajhp150639
- L. J. Lesko and S. Schmidt, Individualization of Drug Therapy: History, Present State, and Opportunities for the Future, Clin. Pharmacol. Ther., 2012, 92(4), 458–466, DOI:10.1038/clpt.2012.113
- S. J. Trenfield, A. Awad, A. Goyanes, S. Gaisford and A. W. Basit, 3D Printing Pharmaceuticals: Drug Development to Frontline Care, Trends Pharmacol. Sci., 2018, 39(5), 440–451, DOI:10.1016/j.tips.2018.02.006
- A. Goyanes, C. M. Madla, A. Umerji, G. Duran Piñeiro, J. M. Giraldez
Montero, M. J. Lamas Diaz, M. Gonzalez Barcia, F. Taherali, P. Sánchez-Pintos and M.-L. Couce,
et al., Automated therapy preparation of isoleucine formulations using 3D printing for the treatment of MSUD: First single-centre, prospective, crossover study in patients, Int. J. Pharm., 2019, 567, 118497, DOI:10.1016/j.ijpharm.2019.118497
- I. Seoane-Viaño, X. Xu, J. J. Ong, A. Teyeb, S. Gaisford, A. Campos-Álvarez, A. Stulz, C. Marcuta, L. Kraschew and W. Mohr,
et al., A case study on decentralized manufacturing of 3D printed medicines, Int. J. Pharm.:X, 2023, 5, 100184, DOI:10.1016/j.ijpx.2023.100184
- I. Ahola, D. Raijada, C. Cornett, J. Bøtker, J. Rantanen and N. Genina, Tailor-Made Doses of Pharmaceuticals by Tunable Modular Design: A Case Study on Tapering Antidepressant Medication, Adv. Mater., 2024, 36(30), 2403852, DOI:10.1002/adma.202403852
- A. Lion, R. D. Wildman, M. R. Alexander and C. J. Roberts, Customisable Tablet Printing: The Development of Multimaterial Hot Melt Inkjet 3D Printing to Produce Complex and Personalised Dosage Forms, Pharmaceutics, 2021, 13(10), 1679 CrossRef CAS PubMed
- D. Muhindo, R. Elkanayati, P. Srinivasan, M. A. Repka and E. A. Ashour, Recent Advances in the Applications of Additive Manufacturing (3D Printing) in Drug Delivery: A Comprehensive Review, AAPS PharmSciTech, 2023, 24(2), 57, DOI:10.1208/s12249-023-02524-9
- V. M. Vaz and L. Kumar, 3D Printing as a Promising Tool in Personalized Medicine, AAPS PharmSciTech, 2021, 22(1), 49, DOI:10.1208/s12249-020-01905-8
- C.-Y. Liaw and M. Guvendiren, Current and emerging applications of 3D printing in medicine, Biofabrication, 2017, 9(2), 024102, DOI:10.1088/1758-5090/aa7279
- V. Sundarkumar, W. Wang, Z. Nagy and G. Reklaitis, Manufacturing pharmaceutical mini-tablets for pediatric patients using drop-on-demand printing, Int. J. Pharm., 2023, 644, 123355, DOI:10.1016/j.ijpharm.2023.123355
- P. Carou-Senra, L. Rodríguez-Pombo, A. Awad, A. W. Basit, C. Alvarez-Lorenzo and A. Goyanes, Inkjet Printing of Pharmaceuticals, Adv. Mater., 2024, 36(11), 2309164, DOI:10.1002/adma.202309164
- R. Daly, T. S. Harrington, G. D. Martin and I. M. Hutchings, Inkjet printing for pharmaceutics – A review of research and manufacturing, Int. J. Pharm., 2015, 494(2), 554–567, DOI:10.1016/j.ijpharm.2015.03.017
- T. P. Forbes, J. G. Gillen, W. Feeney and J. Ho, Quality by Design Considerations for Drop-on-Demand Point-of-Care Pharmaceutical Manufacturing of Precision Medicine, Mol. Pharm., 2024, 21(7), 3268–3280, DOI:10.1021/acs.molpharmaceut.4c00032
-
U.S. Food and Drug Administration (FDA) and Center for Biologics Evaluation and Research, Guidance for Industry: Q8(R2) Pharmaceutical Development, Center for Drug Evaluation and Research, 2009. https://www.fda.gov/regulatory-information/search-fda-guidance-documents/q8r2-pharmaceutical-development (accessed 2023-09-05) Search PubMed
- L. X. Yu, G. Amidon, M. A. Khan, S. W. Hoag, J. Polli, G. K. Raju and J. Woodcock, Understanding Pharmaceutical Quality by Design, AAPS J., 2014, 16(4), 771–783, DOI:10.1208/s12248-014-9598-3
- R. A. Lionberger, S. L. Lee, L. Lee, A. Raw and L. X. Yu, Quality by Design: Concepts for ANDAs, AAPS J., 2008, 10(2), 268–276, DOI:10.1208/s12248-008-9026-7
- K. Pramod, M. A. Tahir, N. A. Charoo, S. H. Ansari and J. Ali, Pharmaceutical product development: A quality by design approach, Int. J. Pharm. Invest., 2016, 6(3), 129–138, DOI:10.4103/2230-973x.187350
- S. L. R. Ellison and V. J. Barwick, Estimating measurement uncertainty: reconciliation using a cause and effect approach, Accredit. Qual.
Assur., 1998, 3(3), 101–105, DOI:10.1007/s007690050198
- R. J. Tyson, C. C. Park, J. R. Powell, J. H. Patterson, D. Weiner, P. B. Watkins and D. Gonzalez, Precision Dosing Priority Criteria: Drug, Disease, and Patient Population Variables, Front. Pharmacol., 2020, 11, 420, DOI:10.3389/fphar.2020.00420
- M. A. Horowitz and D. Taylor, Tapering of SSRI treatment to mitigate withdrawal symptoms, Lancet Psychiatry, 2019, 6(6), 538–546, DOI:10.1016/S2215-0366(19)30032-X
- S. Elbe, A. Roemer-Mahler and C. Long, Medical countermeasures for national security: A new government role in the pharmaceuticalization of society, Biopsychosoc. Sci. Med., 2015, 131, 263–271, DOI:10.1016/j.socscimed.2014.04.035
- 〈905〉 Uniformity of Dosage Units. United States Pharmacopeia (USP), 2023. https://www.usp.org/harmonization-standards/pdg/excipients/uniformity-of-dosage-units (accessed 2023-10-23).
-
S. L. R. Ellison, M. Rosslein and A. Williams, Eurachem/CITAC guide: Quantifying Uncertainty in Analytical Measurement, 2000 Search PubMed
-
B. N. Taylor and C. E. Kuyatt, NIST Technical Note 1297, Guidelines for evaluating and expressing the uncertainty of NIST measurement results, NIST Technical Note, 1994. https://www.nist.gov/pml/pubs/tn1297/ Search PubMed
- C. Bendicho-Lavilla, L. Rodríguez-Pombo, P. Januskaite, C. Rial, C. Alvarez-Lorenzo, A. W. Basit and A. Goyanes, Ensuring the quality of 3D printed medicines: Integrating a balance into a pharmaceutical printer for in-line uniformity of mass testing, J. Drug Delivery Sci. Technol., 2024, 92, 105337, DOI:10.1016/j.jddst.2024.105337
- P. R. Vuddanda, M. Alomari, C. C. Dodoo, S. J. Trenfield, S. Velaga, A. W. Basit and S. Gaisford, Personalisation of warfarin therapy using thermal ink-jet printing, Eur. J. Pharm. Sci., 2018, 117, 80–87, DOI:10.1016/j.ejps.2018.02.002
- C. Bosch Ojeda and F. Sanchez Rojas, Recent developments in derivative ultraviolet/visible absorption spectrophotometry, Anal. Chim. Acta, 2004, 518(1), 1–24, DOI:10.1016/j.aca.2004.05.036
-
Mayo Foundation for Medical Education and Research (MFMER), Tapering off opioids: When and how, Mayo Clinic Press, 2023. https://www.mayoclinic.org/diseases-conditions/prescription-drug-abuse/in-depth/tapering-off-opioids-when-and-how/art-20386036 (accessed 2024, Dec. 2) Search PubMed
- A. Sørensen, K. Juhl Jørgensen and K. Munkholm, Clinical practice guideline recommendations on tapering and discontinuing antidepressants for depression: a systematic review, Ther. Adv. Psychopharmacol., 2022, 12 DOI:10.1177/20451253211067656
- G. Mora-Castaño, L. Rodríguez-Pombo, P. Carou-Senra, P. Januskaite, C. Rial, C. Bendicho-Lavilla, M. L. Couce, M. Millán-Jiménez, I. Caraballo and A. W. Basit,
et al., Optimising 3D printed medications for rare diseases: In-line mass uniformity testing in direct powder extrusion 3D printing, Int. J. Pharm., 2025, 668, 124964, DOI:10.1016/j.ijpharm.2024.124964
- A. K. Jørgensen, J. J. Ong, M. Parhizkar, A. Goyanes and A. W. Basit, Advancing non-destructive analysis of 3D printed medicines, Trends Pharmacol. Sci., 2023, 44(6), 379–393, DOI:10.1016/j.tips.2023.03.006
Footnote |
| † Electronic supplementary information (ESI) available: Additional experimental method details, data, figures, and images. See DOI: https://doi.org/10.1039/d5pm00041f |
| This journal is © The Royal Society of Chemistry 2025 |