
Multilevel, solar-blind, and thermostable physical unclonable functions based on host-sensitized luminescence of β-Ga2O3:Dy3+![[thin space (1/6-em)]](https://www.rsc.org/images/entities/h2_char_2009.gif) †
†
Dong
Zhu
ab,
Chunfeng
Wang
 *a,
Fuhang
Jiao
a,
Jiujun
Xu
a,
Haoran
Xu
a,
Shun
Han
a,
Peijiang
Cao
a,
Yuxiang
Zeng
a,
Ming
Fang
a,
Wenjun
Liu
a,
Deliang
Zhu
*a and
Youming
Lu
*ab
*a,
Fuhang
Jiao
a,
Jiujun
Xu
a,
Haoran
Xu
a,
Shun
Han
a,
Peijiang
Cao
a,
Yuxiang
Zeng
a,
Ming
Fang
a,
Wenjun
Liu
a,
Deliang
Zhu
*a and
Youming
Lu
*ab
aCollege of Materials Science and Engineering, Guangdong Research Center for Interfacial Engineering of Functional Materials, Shenzhen University, Shenzhen 518060, PR China. E-mail: ymlu@szu.edu.cn; dlzhu@szu.edu.cn; cfwang@szu.edu.cn
bCollege of Physics and Optoelectronic Engineering Shenzhen University, Shenzhen 518060, China
First published on 18th February 2025
Abstract
Optical physical unclonable functions (PUFs) are powerful tools to combat counterfeiting, owing to their unpredictable preparation processes and unique, identifiable information content. Achieving high entropy and robustness in optical PUFs is essential for practical applications but remains challenging. This study demonstrates a multilevel, solar-blind, and thermostable PUF based on host-sensitized luminescence of trivalent dysprosium (Dy3+) in β-phase gallium oxide (β-Ga2O3). The controllable occupation of Dy3+ in both tetrahedral and octahedral Ga3+ sites of β-Ga2O3 results in heterochromatic optical emission, which affords the resulting PUFs with a multilevel encoding capacity of 44096 at 64 × 64 pixels. The wide bandgap (∼4.6 eV) of β-Ga2O3:Dy3+ confines the PUF response to solar-blind irradiation, encompassing a light spectrum in the range 230–270 nm, which does not overlap with ambient light, ensuring interference-free stimulation and therefore achieving 100% recognition accuracy. Additionally, the high thermal quenching activation energy (0.386 eV) of β-Ga2O3:Dy3+ provides thermal stability, enabling the PUFs to operate from room temperature up to 125 °C. With near-ideal uniformity, uniqueness, and reproducibility, these PUFs hold considerable promise for practical applications in anticounterfeiting and encryption.
 Chunfeng Wang | Chunfeng Wang is an Assistant Professor in the College of Materials Science and Engineering at Shenzhen University. He received his B.S. degree in Materials Science and Engineering from Zhengzhou University in 2013 and his Ph.D. in Materials Processing Engineering from Zhengzhou University in 2019. His research interests focus on optoelectronic functional materials and soft devices. |
Introduction
Counterfeit consumer products have led to economic losses at a billion-dollar scale. In particular, counterfeit medical devices and medicines have been threatening human safety and public health. In the digital age, private information including communication, military, finance, and personal data, are often vulnerable to abuse by mercenary actors for purposes including cyber terrorism across all areas of modern society. A myriad of security strategies including fluorescent holograms, graphical barcodes, watermarks, security inks, and software-based cryptography have been developed to deter counterfeiting and unauthorized access.1–5 However, these conventional security strategies rely on deterministic production processes, which become susceptible to duplication over time owing to their weak construction and advancements in precision processing technology. Physical unclonable functions (PUFs) are devices that create unique cryptographic “fingerprints” by exploiting the inherent randomness of physical features introduced during manufacturing or material synthesis.6,7 These features are impossible to replicate, making PUFs an attractive alternative to conventional security strategies.Since the introduction of PUF concepts, various types of PUFs, including optical,8–11 magnetic,12–15 and electronic,16–19 have been reported. Optical PUFs derive their encoded information from the optical properties of materials, offering distinct advantages, which include material versatility, ease of processing, output complexity, non-contact characteristics, and immunity to electro-magnetic interference. Additionally, they enable quick and straightforward verification using portable image capture tools and well-established image processing techniques.20–23 Thus, optical PUFs utilizing various materials and manufacturing routes have emerged since the pioneering work by Pappu et al.24 For example, Gu et al. developed Raman-based PUF labels composed of different types of core–shell nanoparticles with various mapping resolutions for anticounterfeiting.25 Kayaci et al. presented the design and facile fabrication of organic light-emitting PUFs under ambient conditions using green-emissive oligo(p-phenyleneethynylene) molecules.26 Kim et al. demonstrated a lens-free optical PUF based on stochastically manifested diffraction using native silk fibers.27 Jung et al. proposed a scalable approach for creating optical PUFs utilizing the kinetics of oxide particles in polymer solutions.28 Im et al. reported a four-dimensional PUF by forming time-varying chaotic phosphorescent patterns on MoS2 atomic seeds.29 Huang et al. demonstrated near-infrared circularly polarized PUFs by incorporating Yb-doped metal halide perovskite nanocrystals into chiral imprinted photonic films.30
While great progress has been made, it should be noted that the stimulation light wavelength of many existing optical PUFs falls within the UVA (320–400 nm) or visible (400–780 nm) spectral ranges, which will be affected or overshadowed by the ambient light, perturbating the generation of PUF patterns and thus diminishing the recognition accuracy. And these luminescent materials are prone to be sensitive to the fluctuation of thermal excitation, which may alter their original luminescence properties, resulting in the distortion or invalidation of PUF labels. Furthermore, the growing significance of enhanced encryption for secure authentication and data transmission highlights the need for multilevel optical PUFs with heightened encoding capability and security.
To address these concerns, a multilevel, solar-blind, and thermostable PUF based on host-sensitized luminescence of trivalent dysprosium (Dy3+) in β-Ga2O3 is developed in this study. The wide bandgap (∼4.6 eV) enables transparency in both the UV and visible regions, allowing β-Ga2O3:Dy3+ to be stimulated only by deep-ultraviolet (DUV) light in the 230–270 nm range, which is often referred to as “solar-blind ultraviolet light” owning to its absence near the Earth's surface, as it is absorbed by atmospheric ozone. This solar-blind excitation allows for noise-free generation of PUF patterns without interference from the ambient light, ensuring 100% accuracy in identifying the response signals under both dark and ambient lighting conditions. In addition, β-Ga2O3:Dy3+, with a thermal quenching activation energy of 0.386 eV, provides PUFs with excellent stability against thermal excitation fluctuations. The PUF performs reliably across a wide temperature range, from room temperature to 125 °C, maintaining low intra-hamming distances from approximately 1.1% to 3.6%, which is well below the critical 7% threshold. Most importantly, β-Ga2O3 provides two doping sites, octahedral and tetrahedral Ga3+ sites, for the host-sensitive luminescence of Dy3+, corresponding to two dominant emission bands of blue (470–500 nm, 4F9/2–6H15/2) and yellow (550–600 nm, 4F9/2–6H13/2), respectively. And the occupy of Dy3+ in Ga3+ sites can be tuned by adjusting the Dy3+ concentration or the post-calcination temperature, shifting the ratio of blue-to-yellow (B/Y) emission intensity. The heterochromatic optical emissions of β-Ga2O3:Dy3+ are thus obtained, enabling the construction of multilevel optical PUFs. With the quaternary encode of β-Ga2O3:Dy3+ emissions with two different B/Y ratios, the PUFs can achieve an encoding capacity of 44096 at 64 × 64 pixels. Meanwhile, these PUFs exhibit excellent uniformity, uniqueness, and reproducibility, making them applicable as a private key to fulfill the customization demands of circulating commodities.
Results and discussion
Principle of optical PUFs based on β-Ga2O3:Dy3+
Fig. 1 illustrates the concept of utilizing host-sensitized luminescence of Dy3+ in β-Ga2O3 for creating optical PUFs. In this strategy, β-Ga2O3:Dy3+ particles with varying B/Y emission intensity ratios were randomly distributed on quartz glass substrates and exposed to solar-blind ultraviolet (UV) light at a wavelength of 254 nm (see Experimental section for details). The B/Y emission ratios were precisely modulated by controlling the incorporation of Dy3+ ions into Ga3+ lattice sites. Specifically, Dy3+ ions occupying octahedral Ga3+ sites contributed to blue emission (470–500 nm, corresponding to the 4F9/2–6H15/2 transition), whereas those at tetrahedral Ga3+ sites produced yellow emissions (550–600 nm, corresponding to the 4F9/2–6H13/2 transition). This modulation can be achieved either by altering the Dy3+ doping concentration or by adjusting the post-calcination temperature, resulting in heterochromatic optical emissions characteristic of β-Ga2O3:Dy3+. These optical emissions are further processed into PUF labels using a customized image extractor. This enables the generation of multiple PUFs with diverse dimensions and encoding capacities, tailored for specific applications. Utilizing the intrinsic thermostability of β-Ga2O3:Dy3+, these PUF labels exhibit high durability and are well-suited for practical applications in anticounterfeiting and encryption. Potential use cases include secure labeling for microchips and other related technological implementations. | ||
| Fig. 1 Schematic illustration of optical PUFs based on heterochromatic β-Ga2O3:Dy3+ for anticounterfeiting applications. | ||
Synthesis and characterization of β-Ga2O3:Dy3+
The synthesis process of β-Ga2O3:Dy3+ is depicted in Fig. 2a. The gallium hydroxide (GaOOH) precursor was initially prepared using a coprecipitation method and subsequently calcined in a muffle furnace to induce phase transformation and Dy3+ doping, resulting in β-Ga2O3:Dy3+ with desirable optical characteristics (see Experimental section for details). Notably, the post-calcination method (rapid quenching or natural cooling) significantly affects the Dy3+ occupancy at the Ga sites. As shown in Fig. 2b, the GaOOH precursor exhibited a rod-shaped morphology with a broader base and a tapered tip, featuring a smooth, uniform surface. The rods had diameters ranging from 50 to 100 nm and lengths of approximately 5 μm. After calcination under controlled conditions, the resulting β-Ga2O3:Dy3+ largely retained this rod-like structure, albeit with a slightly rougher surface texture. Higher magnification revealed that the rods are composed of aggregated nanoparticles, each smaller than 20 nm in diameter (Fig. S1†). The energy-dispersive X-ray spectroscopy (EDS) mapping images confirm the uniform dispersion of Ga, O, and Dy throughout the sample. | ||
| Fig. 2 Synthesis and characterization of β-Ga2O3:Dy3+. (a) Schematic process of preparing β-Ga2O3:Dy3+ by coprecipitation and calcination. (b) SEM images of GaOOH and β-Ga2O3:Dy3+ and the EDS mapping images of β-Ga2O3:Dy3+. (c) XRD patterns of GaOOH and β-Ga2O3:Dy3+. (d) TEM images and SAED pattern of β-Ga2O3:Dy3+. (e) Rietveld XRD plots of β-Ga2O3:Dy3+. (f) Schematic crystal structure of β-Ga2O3:Dy3+. (g) XPS spectra of GaOOH and β-Ga2O3:Dy3+. (h) Raman spectra of GaOOH and β-Ga2O3:Dy3+. | ||
The X-ray diffraction (XRD) patterns of GaOOH and β-Ga2O3:Dy3+ are shown in Fig. 2c. The peaks observed for GaOOH correspond to hexagonal GaOOH (JCPDS: 010-9861). After calcination at 950 °C for 2 hours, regardless of the post-calcination method, the XRD patterns indicated only monoclinic β-Ga2O3 had formed (JCPDS: 041-1103). A noteworthy shift of the primary diffraction peak (002) toward lower angles was observed with increasing Dy3+ doping concentrations (Fig. S2†), suggesting a lattice expansion. Field emission transmission electron microscopy (FE-TEM) images in Fig. 2d further support this observation. Lattice fringes with a spacing of approximately 3.157 Å were visible, consistent with the standard value for the (400) plane of β-Ga2O3. However, an enlargement of ∼0.1531 Å was evident, indicating a lattice expansion of ∼4.90%. Additionally, the selected area electron diffraction (SAED) patterns displayed strong white spots and ring-like features, confirming the polycrystalline nature of β-Ga2O3.
Crystal structure data for β-Ga2O3 doped with 3% Dy3+ were analyzed using Topas software (Fig. 2e). Detailed lattice parameters are provided in Table S1.† The calculated Dy3+ occupancy was approximately 0.62 at% at the tetrahedral Ga3+ sites and 2.12 at% at the octahedral Ga3+ sites, yielding a theoretical total doping concentration of 2.74 at%, closely matching the experimental value of ∼3%. Based on these data, a structural model of monoclinic β-Ga2O3 doped with Dy3+ is presented in Fig. 2f. The XPS and Raman spectra of both GaOOH and β-Ga2O3:Dy3+ are shown in Fig. 2g and h. In the XPS spectrum, no distinct Dy LLM peak was observed; however, a weak Dy 3d peak was detected at ∼1336 eV. Similarly, Raman spectroscopy revealed no additional phonon vibrational modes beyond those intrinsic to β-Ga2O3 (Table S2†). These results may be attributed to the low Dy3+ doping concentration and suggest that Dy3+ ions are successfully incorporated into the β-Ga2O3 lattice by occupying Ga3+ sites. This incorporation occurs without significantly altering the crystal structure, forming secondary phases, or causing agglomeration.
Host-sensitized heterochromatic emissions of β-Ga2O3:Dy3+
The photoluminescence excitation (PLE) spectra of β-Ga2O3:Dy3+ phosphors (0.01 ≤ x ≤ 0.05, Δx = 0.01) at room temperature (25 °C) are shown in Fig. 3a. The excitation spectra exhibited strong similarity at both 492 and 580 nm, featuring a prominent absorption band in the solar-blind UV region (230–270 nm) with a maximum identified at 256 nm. As the charge transfer band and the 4f9 → 4f85d transitions of Dy3+ occur below 200 nm, this excitation was attributed to the bandgap excitation of β-Ga2O3:Dy3+.31,32 This interpretation aligns with the optical bandgap values (∼4.6 eV) presented in Fig. S3,† which show a slight decrease in bandgap energy as the Dy3+ concentration increases. This bandgap narrowing also explains the minor redshift observed in the PLE spectrum. When excited at 256 nm, distinct emission peaks corresponding to the 4F9/2 → 6H15/2 (blue) and 4F9/2 → 6H13/2 (yellow) transitions of Dy3+ are observed, as shown in Fig. 3b. The photoluminescence (PL) intensity initially increases with increasing Dy3+ concentration but then decreases, reaching an extinguishing concentration at ∼3%, which is consistent with the ∼3.03% theoretical value derived from the photoluminescence fitting analysis and attributed to the dipole–dipole interactions of the Dy3+ (see ESI Note S1 and Fig. S4† for details).33 This quenching mechanism is not only related to the doping concentration of Dy3+ but also to the type and quantity of defects in the host material. Defect energy levels can act as traps or recombination centers for energy migration, thereby influencing the pathways and efficiency of energy transfer. After doping with Dy3+, the intrinsic emission peaks of the β-Ga2O3 host lattice disappears, indicating that energy is effectively transferred from the host lattice to Dy3+.34 Gaussian fitting of the intrinsic PL spectrum of β-Ga2O3 revealed three emission components: (I) UV emission from self-trapped hole states, (II) blue emission from gallium vacancies or gallium–oxygen vacancy pairs (VGa or VGa–VO), and (III) green emission from oxygen interstitials. These emissions originate from donor–acceptor pair (DAP) recombinations at defect sites. The fitted emission peaks closely correspond to the main Dy3+ emission peaks, supporting the energy transfer model depicted in Fig. 3c.35 In this model, electrons excited to the conduction band are captured by VO donor levels, leading to DAP recombinations. The emitted energy is transferred non-radiatively to Dy3+ ions, which subsequently relax to the 4F9/2 level and emit their characteristic transitions. As a result, intrinsic DAP emissions are quenched, while the luminous efficiency increases from 13.26% (undoped) to 36.57% at the Dy3+ quenching concentration (see ESI Note S2, Fig. S5 and Table 3† for details). This highlights the role of β-Ga2O3 as both an efficient host lattice and an energy sensitizer in this host-sensitized luminescence system. | ||
| Fig. 3 Host-sensitized heterochromatic emissions of β-Ga2O3:Dy3+. (a) Excitation spectra of β-Ga2O3:Dy3+ with different Dy3+ concentrations. (b) Emission spectra of β-Ga2O3:Dy3+ with different Dy3+ concentrations. (c) Energy transfer schematic of Dy3+ emission in β-Ga2O3. (d) Comparison of the integrated intensity of blue-to-yellow light as a function of Dy3+ doping concentration. (e) Emission spectra of β-Ga2O3:Dy3+ with different calcination conductions. (f) Comparison of the integrated intensity of blue-to-yellow light of β-Ga2O3:Dy3+ with different calcination conductions. (g) CIE chromaticity diagram and photographs of β-Ga2O3:Dy3+ with different calcination conductions. (h) Temperature-dependent photoluminescence spectra of β-Ga2O3:3%Dy3+ phosphor measured between 300 and 400 K under 254 nm UV light. (i) Arrhenius plot to calculate the activation energy for thermal quenching of β-Ga2O3:3%Dy3+. | ||
The relative PL intensities of blue (4F9/2 → 6H15/2) and yellow (4F9/2 → 6H13/2) emissions vary with Dy3+ concentration, as shown in Fig. 3d. The yellow emission intensity increases more rapidly than the blue emission due to its hypersensitive transition from Dy3+ at tetrahedral Ga3+ sites, which is strongly influenced by the local coordination environment.36 Both blue and yellow emissions exhibit concentration quenching at ∼3%, with the yellow emission decreasing more sharply at higher Dy3+ concentrations, resulting in a decline in the B/Y intensity ratios.
The sensitivity of the yellow emission to local crystal field environments offers a tunable approach for emission control. Accordingly, a series of β-Ga2O3:Dy3+ samples (S1–S5) were prepared under varied calcination conditions. Samples S1–S4 were heated at 1 °C min−1 to 950 °C, held for 2 hours, and removed from the muffle furnace at different post-calcination temperatures: 950 °C (S1), 600 °C (S2), 250 °C (S3), and room temperature (25 °C, S4). Sample S5 was prepared with a higher heating rate of 20 °C min−1 to 950 °C, held for 2 hours, and removed at room temperature. The emission spectra of these samples under 256 nm excitation are shown in Fig. 3e, with significant changes in blue and yellow intensities, as detailed in Fig. 3f, indicating that slow heating promotes Dy3+ incorporation into smaller tetrahedral Ga3+ sites, whereas rapid cooling stabilizes Dy3+ ions in these sites. The tunable emissions of samples S1–S5, ranging from high-color-temperature blue to low-color-temperature yellow, are depicted in Fig. 3g, along with corresponding sample photographs due to defects caused by the escape of Dy3+ from β-Ga2O3, which increases the intrinsic blue luminescence of β-Ga2O3 resulting in an increase in color temperature (see ESI Note S3 and Table 4† for details).
To evaluate the thermal stability of β-Ga2O3:Dy3+, the emission spectra of sample S1 were recorded from 300 to 400 K (Fig. 3h). The spectral profile and peak positions showed negligible shifts, while the emission intensity slightly decreased with increasing temperature, following Arrhenius behavior (see ESI Note S4† for details).37 The activation energy, determined from the slope of the ln[(I0/I)−1] vs. 1/kT plot (Fig. 3i), was calculated as 0.386 eV. Fig. S6 and Table S5† show that the color of the β-Ga2O3:Dy3+ stays essentially unchanged at high temperatures, attributing to the quenching mode of the dipole–dipole interactions that safeguards the excellent thermal stability of this system in a certain temperature range, providing theoretical support for its application as an optical material in extreme environments.
Multilevel optical PUFs based on β-Ga2O3:Dy3+
Fig. 4a illustrates the workflow for extracting cryptographic keys from optical PUF labels, comprising raw response acquisition, bit sequence extraction, and final digital key generation. Thin films with distinct patterns were created by spray-coating mixtures of samples S1 and S5 onto quartz glass substrates, with a thin polydimethylsiloxane (PDMS) layer serving as an adhesion layer (see Experimental section for details). These films were analyzed under a confocal fluorescence microscope. When illuminated with 254 nm UV light, yellow and blue phosphors were uniformly distributed across the patterns. The fluorescence images of the PUF labels were pixelated into sections, revealing complex and random square patterns. This randomness and uniqueness make it impossible for deterministic methods to replicate the labels. | ||
| Fig. 4 Multilevel PUFs based on β-Ga2O3:Dy3+. (a) Schematic process of extracting encryption keys from β-Ga2O3:Dy3+-PUF labels. Binary (b), ternary (c), and quaternary (d) bitmaps derived from the same fluorescence image of the PUF label. Bit uniformities of binary (e), ternary (f), and quaternary (g) bitmaps calculated from 50 different PUF labels. (h) Statistical distribution of inter-device and intra-device HDs calculated for binary bitmaps from 50 different PUF labels. (i) Statistical distribution of correlation coefficient calculated for ternary bitmaps from 50 different PUF labels. (j) Statistical distribution of correlation coefficient calculated for quaternary bitmaps from 50 different PUF labels. (i) Pairwise HD comparisons of 50 independent PUF labels encoded in binary (k), ternary (l), or quaternary (m) formats. | ||
Cryptographic keys were extracted from the pixelated fluorescence images via the following process: the pixel with the maximum emission intensity in each segmented area was chosen as an anchor point, and its intensity was normalized to mitigate inconsistencies from test equipment. An adjustable threshold was applied based on the fluorescence intensity of each anchor point to ensure bitmap uniformity. The processed outputs were then converted into binary, ternary, or quaternary bitmaps to generate digital keys (keyn, where n = 2, 3, or 4). Notably, increasing the density of anchor points improved the uniformity and precision of the optical PUF labels. However, excessive clustering of anchor points can lead to over-density, which reduced resolution and diminished the randomness of the optical PUF labels.38
Leveraging the heterochromatic optical emissions of β-Ga2O3:Dy3+, Fig. 4b–d demonstrates the binary, ternary, and quaternary bitmaps derived from the same fluorescence image of a PUF label. These bitmaps exhibit disordered and complex symbol distributions. Compared to conventional QR codes, multidimensional bitmaps offer greater encoding capacity and higher data density (Fig. S7†). For an M-ary n × n matrix, the encoding capacity is proportional to mn×n, where m is the number of responses for each pixel and n is the total number of pixels in the bitmaps. As m increases, the amount of editable and assignable information grows exponentially. For instance, a quaternary bitmap can achieve an encoding capacity of 44096 at 64 × 64 pixels. This added complexity significantly increases the difficulty of forgery or duplication, which is critical for high-security applications.
The performance of PUF labels were evaluated by encoding 50 samples into M-ary 64 × 64 bitmaps for validation (Fig. S8†). Bit uniformity measures the probability distribution of distinct bits in digital keys. Ideally, the average bit uniformity for M-ary bitmaps should be approximately 1/m. As shown in Fig. 4e–g, the measured average bit uniformities for binary, ternary, and quaternary bitmaps were 0.50183, 0.33276, and 0.25073, respectively, closely matching their theoretical values.39
Hamming distance (HD) was used to assess the repeatability and uniqueness of binary encoding (see PUF performance analysis for details). Fig. 4h reveals that intra-HD values for binary bitmaps followed a Gaussian distribution, with an average intra-HD of 0.01125 for repeated measurements of the same label. This non-zero value likely results from system instabilities during optical signal acquisition, such as alignment shifts or variations in UV lamp intensity. The intra-HD value remained well below the 7% error tolerance of standard QR codes, confirming the high verification reliability of the PUF label.40 The average inter-HD for binary bitmaps was approximately 0.48093, close to the theoretical value of 0.5, verifying the uniqueness of the PUF label. Cross-correlation analysis was used to evaluate the repeatability and uniqueness of ternary and quaternary bitmaps. For ternary bitmaps, the average correlation coefficient among different labels converged to 0.00618, close to the ideal value of 0, indicating minimal dependence (Fig. 4i). For repeated measurements of the same label, the correlation coefficient averaged 0.8894, reflecting strong reproducibility. Similar results were observed for quaternary matrices (Fig. 4j), with inter-label coefficients near 0.0333 and intra-label coefficients around 0.9015.
Fig. 4k–m shows pairwise HD comparisons of 50 independent PUF labels encoded in binary, ternary, or quaternary formats. Diagonal elements represent average intra-HD values from repeated measurements of the same label, whereas off-diagonal elements represent inter-HD averages from 50 different labels. The results demonstrate that repeated measurements of the same PUF label exhibit high similarity, whereas different PUF labels show low similarity. Additionally, average similarity values decreased from 0.4930 (binary) to 0.3440 (ternary) and 0.2467 (quaternary) as m increased, reflecting enhanced differentiation and encoding capacity.
Solar-blind and thermostable optical PUFs
Although optical PUFs have emerged as a promising technology in various high-security applications, their practical deployment is heavily influenced by environmental factors, necessitating robust designs to ensure reliable performance across diverse operational conditions. A critical challenge arises from the excitation requirements of many existing optical PUFs, which are often designed to function under UVA (320–400 nm) or visible light (400–780 nm) excitation. These wavelengths are prone to interference from ambient light, which can compromise the accuracy of PUF pattern recognition and thereby undermine their security potential.Fig. 5a compares the binary response of an optical PUF label based on β-Ga2O3:Dy3+ under three conditions: natural light, 254 nm excitation under natural light, and 254 nm excitation in a dark environment. Under natural light, the PUF label failed to produce fluorescence, leading to a washed-out image marred by optical noise. The corresponding binary bitmap exhibited dense, uneven bit distribution, with a calculated bit uniformity of 0.4756 (Fig. 5b). Repeated measurements (n = 100) reveal an average intra-HD of 9.327%, exceeding the 7% error tolerance standard for QR codes, rendering the PUF unsuitable for secure key verification (Fig. 5c). Conversely, when illuminated with 254 nm excitation, the performance of the PUF label improved significantly. In both natural light and dark environments, the PUF label produced bright, vividly colored feedback, facilitating clear fluorescence imaging. Binary bitmaps derived from these conditions exhibited enhanced uniformity, with bit uniformity values improving to 0.4861 under natural light and 0.4989 in darkness (Fig. 5b). Furthermore, the average intra-HD decreased markedly to 1.847% and 1.125%, respectively (Fig. 5c). This improvement can be attributed to the strong dichromatic emission of β-Ga2O3:Dy3+ under 254 nm solar-blind UV excitation. The aforementioned wavelength is effectively absorbed by Earth's atmosphere, thereby minimizing interference from background light. This ensures interference-free stimulation and enables a recognition accuracy of 100%, demonstrating the effectiveness of this excitation wavelength for secure applications.
 | ||
| Fig. 5 Solar-blind and thermostable optical PUFs. (a) Binary bitmaps derived from images in natural light (NL), in natural light with a 254 nm UV lamp (NL + UV), and in a dark environment with UV lamp excitation (UV). (b) Average bit uniformity of the binary bitmaps calculated from 100 different PUF tags under natural light (NL), under natural light with a 254 nm UV lamp (NL + UV), and under UV lamp excitation in a dark environment (UV). (c) Average intra-device HDs of the binary bitmaps calculated from 100 different PUF tags under natural light (NL), under natural light with a 254 nm UV lamp (NL + UV), and under UV lamp excitation (UV) in a dark environment. (d) Binary bitmap from the same fluorescence image of the PUF label, measured at t °C (25 ≤ t ≤ 125, Δt = 20). (e) Average bit uniformity calculated for binary bitmaps from 50 different PUF labels measured at t °C (25 ≤ t ≤ 125, Δt = 20), respectively. (f) Average intra-device Hamming distances (HDs) calculated for binary bitmaps from 50 different PUF labels measured at t °C (25 ≤ t ≤ 125, Δt = 20), respectively. (g) Inter-device HDs of the binary bitmap of the same PUF tag compared at 25 °C vs. t °C (45 ≤ t ≤ 125, Δt = 20) individually. (h) Schematic of the manufacturing to application process of traceable, solar-blind, and thermally stable β-Ga2O3:Dy3+-PUF tags. | ||
Beyond light stability, thermodynamic stability plays a vital role in determining the reliability of optical PUFs in extreme environments. The performance of β-Ga2O3:Dy3+ PUF labels was evaluated across a temperature gradient ranging from 25 °C to 125 °C, simulating challenging operational scenarios. As shown in Fig. 5d, although fluorescence intensity exhibited minor variations with increasing temperature, the extracted bitmaps remained consistent. Bit uniformity declined slightly, from 0.4989 at 25 °C to 0.4929 at 125 °C (Fig. 5e). Meanwhile, intra-HD increased from approximately 1.1% to 3.6% (Fig. 5f), remaining below the critical 7% threshold. Inter-HD trended steadily upward, peaking at approximately 4.2% but still within acceptable limits (Fig. 5g). These results highlight the high thermal activation energy of β-Ga2O3:Dy3+, which contributes to the stability and repeatability of the PUF label under fluctuating thermal conditions (see ESI Fig. S10 and Table 5† for details), making it an ideal candidate for high-temperature applications.
With superior uniformity, uniqueness, and repeatability, these PUF labels are ideal for private key generation and product customization. Fig. 5h illustrates how embedding PUF labels during manufacturing enables a comprehensive traceability system. Users can scan QR codes to verify and track products throughout the supply chain, ensuring end-to-end traceability. The stable β-Ga2O3:Dy3+ PUF labels provide robust physical security, rendering them invaluable for anti-counterfeiting in high-end semiconductor components, secure communications, and aerospace sectors. These qualities highlight their substantial commercial and strategic potential.
Conclusion
This study demonstrates a multilevel, solar-blind, and thermostable PUF based on the host-sensitized luminescence of trivalent dysprosium (Dy3+) in β-Ga2O3. The wide bandgap (∼4.6 eV) enables β-Ga2O3:Dy3+ to be selectively stimulated by solar-blind ultraviolet light (230–270 nm), effectively eliminating interference from ambient light and ensuring 100% accuracy in signal identification. Additionally, the thermal stability of β-Ga2O3:Dy3+, with a thermal quenching activation energy of 0.386 eV, enables the PUF to operate reliably across a broad temperature range (up to 125 °C), maintaining low intra-Hamming distances (∼0.03) between room and elevated temperatures. Moreover, the dual emission bands of Dy3+ (blue and yellow), arising from occupation of distinct Ga3+ sites, offer tunable emission ratios, facilitating the generation of heterochromatic optical emissions and therefore the construction of multilevel optical PUFs. These PUFs exhibit exceptional uniformity, uniqueness, and reproducibility, rendering them highly effective as secure private keys. The principles established here also highlight the potential of other wide-bandgap materials for creating advanced PUF systems, further expanding the horizon of secure information technology.Experimental section
Materials
Gallium nitrate nonahydrate (Ga(NO3)3·9H2O, 99.99%) and dysprosium nitrate hexahydrate (Dy(NO3)3·5H2O, 99.99%) were obtained from Alfa Aesar (China) Chemical Co., Ltd. Ammonium bicarbonate (NH4HCO3, 99.995%), ammonium hydroxide (NH4OH, 99.999%), n-hexane (C6H14, UV/VIS spectroscopy grade), and absolute ethanol (CH33CH2OH, 99.8%) were provided by Shanghai Aladdin Biochemical Technology Co., Ltd. Polydimethylsiloxane (PDMS, Sylgard 184) was sourced from Dow Corning. All chemicals were of analytical reagent grade and used without further purification.Synthesis and characterization of β-Ga2O3:Dy3+
To address the hygroscopic nature of nitrate hydrates under ambient conditions, 0.1 M aqueous solutions of Ga(NO3)3·9H2O and Dy(NO3)3·5H2O were prepared separately. For each synthesis, 0.002 mol of combined cations were dissolved to form a 250 mL solution. This solution was gradually titrated into an ammonium bicarbonate solution, maintaining a pH of 10 using ammonium hydroxide. After titration, the suspension was continuously stirred for 6 hours to ensure thorough homogenization. The resulting precipitate was washed with deionized water and n-hexane to remove impurities, then dried at 65 °C for 6 hours, yielding gallium oxyhydroxide (GaOOH) as the precursor. The GaOOH precursor was calcined in a muffle furnace (Nabertherm LHT 08-18, Germany) at a certain heating rate (1 °C min−1 or 20 °C min−1), reaching 950 °C, with a 2-hour dwell time and different post-calcination conductions to facilitate phase transformation and Dy3+ doping. Following calcination, the β-Ga2O3:Dy3+ phosphor was cooled and finely ground using an agate mortar and pestle. The resulting powder was sieved through a 1000-mesh stainless steel sieve (15 μm pore size) to achieve uniform particle size.Field emission scanning electron microscopy (FE-SEM, Hitachi SU-70, Japan) was employed to analyze the morphology of the samples. Elemental composition was determined using energy-dispersive X-ray spectroscopy (EDS) at an accelerating voltage of 5 kV. Field emission transmission electron microscopy (FE-TEM, JEM-F200, JEOL, Japan) was used to visualize nanostructures and lattice spacings, with selected area electron diffraction (SAED) patterns captured to provide crystallographic information. X-ray diffraction (XRD) measurements were carried out using a Rigaku SmartLab system (Japan), scanning from 10° to 110° (2θ) with a step size of 0.02° and a scanning speed of 0.05° per step. Structural refinement was performed using the Le Bail method with Topas3 software to accurately determine the crystal lattice parameters. The elemental composition and chemical state of the system were analyzed using X-ray photoelectron spectroscopy (XPS, ESCALAB 250Xi, Thermo Fisher Scientific, USA). The intrinsic crystal structure and vibrational modes of β-Ga2O3:Dy3+ were analyzed using a Renishaw inVia-Reflex Raman spectrometer (Renishaw, UK), revealing detailed chemical bonding characteristics. UV-vis-NIR absorbance spectra were recorded in the range of 200 to 800 nm using a Lambda 950 spectrophotometer (PerkinElmer, USA). The Kubelka–Munk function was applied to convert reflectance data into absorbance spectra. Photoluminescence (PL), photoluminescence excitation (PLE), quantum efficiency (QE), and fluorescence decay profiles were obtained using a steady-state and lifetime fluorescence spectrometer (FLS-1000 fluorimeter, Edinburgh Instruments, UK), providing comprehensive insights into the phosphorescent efficiency and decay dynamics of β-Ga2O3:Dy3+.
Fabrication and characterization of PUF labels
A precise 2 g of the sieved powder was mixed with 20 mL of ethanol in a spray bottle and thoroughly shaken to form a homogeneous suspension. Quartz glass substrates were laser-engraved with unique patterns 1 mm deep. Polydimethylsiloxane (PDMS) was combined with an adhesive and applied to fill the engraved grooves. Before the PDMS fully cured, the phosphor suspension was evenly sprayed onto the substrate. Excess material was carefully removed using a cotton swab. The assembled substrate was then placed in an oven at 80 °C for 6 hours to complete the curing process.The cured patterns were characterized and imaged using a microscope system (Axioscope 5, Carl Zeiss, Germany) under 254 nm UV excitation to facilitate PUF label readout. By fine-tuning the microscope stage, a series of PUF labels were generated and imaged. The system's continuous imaging feature allowed for repeated measurements, with each label being assessed hundreds of times to evaluate reproducibility. To assess the anti-counterfeiting performance, the PUF labels were simulated under various environmental conditions: natural light, 254 nm excitation under natural light, and 254 nm excitation in complete darkness. A heating/cooling stage (LTS420, Linkam, England) was used to heat the samples to target temperatures, simulating extreme conditions for robustness testing. This comprehensive methodology enabled a precise evaluation of the PUF labels’ performance across diverse scenarios.
The multilevel encoding mechanism
Fig. S10a† represents an optical image of β-Ga2O3:Dy3+. After digitization, the image is converted into a 64 × 64 digital matrix, with the median value of the matrix serving as the binary encoding threshold. Pixels with values greater than this threshold are assigned a value of 1, while those with smaller values are assigned a value of 0, resulting in the binary-encoded image shown in Fig. S10b.† Following this, the image is divided into two separate images based on the color channels. Each image is processed as described above, yielding two distinct matrices. After visualization of these matrices, two separate images are obtained, as shown in Fig. S10c.† These images are then processed using the algorithm provided in the program for averaging, resulting in ternary bitmaps (Fig. S10d†) and quaternary bitmaps (Fig. S10e†).PUF performance analysis
To digitize and validate β-Ga2O3:Dy3+-based optical PUF tags, a custom MATLAB program was developed to extract digital keys and analyze the resulting bitmaps. The digitization process involves converting high-resolution digital images of the PUF tags into matrix data. After calibrating the measurement scale, the image is segmented into fixed regions, exemplified by a 64 × 64 grid in this study. Within each region, anchor points are defined based on brightness levels, and threshold values are established to classify data subsets. The Hamming distance between two matrices is then computed to evaluate their similarity. For multi-level (M-ary) encoding, the threshold value is extended into two or three levels, allowing data classification into binary, ternary, or quaternary matrices based on application-specific needs. This method enhances the flexibility of the classification process, enabling higher security levels.According to international standards for QR code evaluation, several key metrics are essential for assessing PUF performance: bit uniformity, device uniqueness, readout repeatability, cross-correlation coefficient, and similarity index.41
Bit uniformity
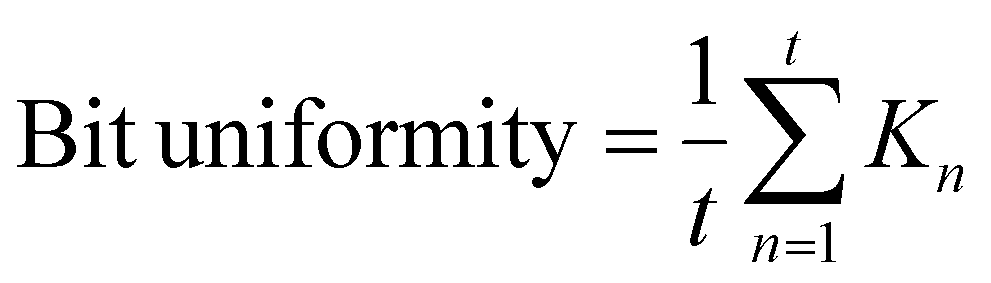
The bit uniformity can be calculated using the following equation:where Kn is the n-th binary bit in the PUF digitized keys and t is the key size.
Device uniqueness
The device uniqueness between any two PUF patterns can be defined as:where Kn and Km are t-bit keys of the n-th PUF device and the m-th PUF device, respectively, and s is the total number of the PUF labels.

Readout reproducibility
The readout reproducibility can be calculated as the following equation:where Kn is the original t-bit reference binary coding matrix and

 is at-bit binary coding matrix extracted from repeated measurements of the same PUF label.
Cross-correlation coefficient
The cross-correlation coefficient can be defined as:where cov(x,y) denotes the covariance of x and y, std(x,y) denotes the standard deviation of x and y.

Similarity index
The similarity index was calculated as a function:where K is the original t-bit reference binary coding matrix and K′ is a t-bit binary coding matrix extracted from repeated measurements of the same PUF.

Author contributions
Dong Zhu: writing – original draft, visualization, validation, software, investigation, and formal analysis. Chunfeng Wang: review & editing, writing – original draft, project administration, methodology, investigation, and funding acquisition. Fuhang Jiao: validation, software, and investigation. Jiujun Xu: investigation, data curation, and conceptualization. Haoran Xu: visualization, methodology, and validation. Shun Han: investigation, formal analysis, methodology, and conceptualization. Peijiang Cao: investigation, formal analysis, and conceptualization. Yuxiang Zeng: resources, data curation, and formal analysis. Ming Fang: resources data curation, and methodology. Wenjun Liu: supervision, validation and formal analysis. Deliang Zhu: supervision, resources, and formal analysis. Youming Lu: project administration, methodology, funding acquisition, and conceptualization.Data availability
The data supporting this article have been included as part of the ESI.†Conflicts of interest
The authors declare no competing interest.Acknowledgements
This work was supported by the National Natural Science Foundation of China (grant no. 52372154, 12074263, 51872187, and U22A2077), the Natural Science Foundation of Guangdong Province (grant no. 2021A1515012013), the Shenzhen Science and Technology Innovation Commission (grant no. JCYJ20240813142628038, JCYJ20220809152330002, JCYJ20180305124701756, JCYJ20180508163404043, JCYJ2018030507182248925), and the Shenzhen High-End Talent Scientific Research Program.References
- W. Akemann and L. Bourdieu, APL Photonics, 2024, 9, 046103 CrossRef PubMed.
- Y. Fu, Q. Cheng, J. Zheng, Y. Yuan, L. Zhang, D. Wang, W. Cai, S. Sun, H. Zhou and Y. Wang, ACS Appl. Mater. Interfaces, 2024, 16, 4984–4990 CrossRef CAS PubMed.
- J. B. Chen, M. S. Li, R. R. Sun, Y. Xie, J. R. Reimers and L. N. Sun, Adv. Funct. Mater., 2024, 34, 2315276 CrossRef CAS.
- C. K. Shilpa, S. V. Jasira, V. P. Veena, B. Abhishek and K. M. Nissamudeen, Mater. Today Commun., 2024, 38, 107954 CrossRef.
- F. Pandey, P. Dash, D. Samanta and M. Sarma, Comput. Electr. Eng., 2022, 101, 107947 CrossRef.
- L. Z. Wang, X. Yu, T. T. Zhang, Y. Hou, D. Y. Lei, X. J. Qi and Z. Q. Chu, Nat. Commun., 2024, 15, 10602–10602 CrossRef CAS PubMed.
- Z. T. Wang, M. Li, Y. H. Fu, Y. Wang and Y. Q. Lu, Adv. Mater., 2025, 37(3), 2409170 CrossRef CAS PubMed.
- P. P. Niu, J. Geng, Q. L. Jiang, Y. Y. D. Wang, J. X. Sang, Z. H. Wang and L. P. Shi, Adv. Sci., 2025, 12(1), 2411449 CrossRef CAS PubMed.
- B. Wilson, Y. H. Chen, D. K. Singh, R. Ojha, J. Pottle, M. Bezick, A. Boltasseva, V. M. Shalaev and A. V. Kildishev, Adv. Photonics, 2024, 6, 2411449 Search PubMed.
- F. H. Jiao, C. A. Lin, L. Dong, Y. Wu, Y. Xiao, Z. F. Zhang, J. L. Sun, W. B. Zhao, S. F. Li, X. Yang, P. A. Ni, L. J. Wang and C. X. Shan, ACS Appl. Mater. Interfaces, 2024, 16, 44328–44339 CrossRef CAS PubMed.
- K. Wang, J. W. Shi, W. X. Lai, Q. He, J. Xu, Z. Y. Ni, X. F. Liu, X. D. Pi and D. R. Yang, Nat. Commun., 2024, 15, 3203 CrossRef CAS PubMed.
- J. M. Kang, D. Han, K. Lee, S. Ko, D. Koh, C. Park, J. Ahn, M. R. Yu, M. Pakala, S. Noh, H. Lee, J. Kwon, K. J. Kim, J. Park, S. Lee, J. Lee and B. G. Park, ACS Nano, 2024, 18, 12853–12860 CrossRef CAS PubMed.
- Y. C. Chiu, W. S. Khwa, C. S. Yang, S. H. Teng, H. Y. Huang, F. C. Chang, Y. Wu, Y. A. Chien, F. L. Hsieh, C. Y. Li, G. Y. Lin, P. J. Chen, T. H. Pan, C. C. Lo, R. S. Liu, C. C. Hsieh, K. T. Tang, M. S. Ho, C. P. Lo, Y. D. Chih, T. Y. J. Chang and M. F. Chang, Nat. Electron., 2023, 6, 534–543 CrossRef.
- G. Park, Y. S. Choi, S. J. Kwon and D. K. Yoon, Adv. Mater., 2023, 35, 2303077 CrossRef CAS PubMed.
- S. Lee, J. Kang, J. M. Kim, N. Kim, D. Han, T. Lee, S. Ko, J. Yang, S. Lee, S. Lee, D. Koh, M. G. Kang, J. Lee, S. Noh, H. Lee, J. Kwon, S. H. C. Baek, K. J. Kim and B. G. Park, Adv. Mater., 2022, 34, 2203558 CrossRef CAS PubMed.
- W. Choi, J. Shin, Y. J. Kim, J. Hur, B. C. Jang and H. Yoo, Adv. Mater., 2024, 36, 2312831 CrossRef CAS PubMed.
- K. S. Woo, J. Han, S.-i. Yi, L. Thomas, H. Park, S. Kumar and C. S. Hwang, Nat. Commun., 2024, 15, 3245 CrossRef CAS PubMed.
- Y. Miao, X. F. Zhou, Z. W. Wang, X. C. Liu, Y. H. Yuan, Y. M. Jing, H. Luo, D. Zhang and J. Sun, Adv. Funct. Mater., 2024, 34, 2314883 CrossRef CAS.
- K. C. Zhu, G. Vescio, S. González-Torres, J. López-Vidrier, J. L. Frieiro, S. Pazos, X. Jing, X. Gao, S. D. Wang, J. Ascorbe-Muruzábal, J. A. Ruiz-Fuentes, A. Cirera, B. Garrido and M. R. Lanza, Nanoscale, 2023, 15, 9985–9992 RSC.
- H. C. Sun, Q. Yang, J. L. Wang, M. C. Ding, M. Y. Cheng, L. Liao, C. Cai, Z. T. Chen, X. D. Huang and Z. B. Wang, Nat. Commun., 2024, 15, 9476 CrossRef CAS PubMed.
- Z. M. Zeng, M. N. Hu, J. Y. Liu and Z. N. Wang, Nano Energy, 2024, 132, 110358 CrossRef.
- S. Gandla, J. Yoon, C. W. Yang, H. Lee, W. Park and S. Kim, Nat. Commun., 2024, 15, 8772 CrossRef CAS PubMed.
- Y. Li, Y. Li, J. X. Yang, Z. Y. Chen, M. Feng, L. S. Liu, F. Song and W. Huang, ACS Appl. Mater. Interfaces, 2024, 16, 25256–25267 CrossRef CAS PubMed.
- R. Pappu, R. Recht, J. Taylor and N. Gershenfeld, Science, 2002, 297, 2026–2030 CrossRef CAS PubMed.
- Y. Q. Gu, C. He, Y. Q. Zhang, L. Lin, B. D. Thackray and J. Ye, Nat. Commun., 2020, 11, 516 CrossRef CAS PubMed.
- N. Kayaci, R. Ozdemir, M. Kalay, N. B. Kiremitler, H. Usta and M. S. Onses, Adv. Funct. Mater., 2021, 32, 2108675 CrossRef.
- M. S. Kim, G. J. Lee, J. W. Leem, S. Choi, Y. L. Kim and Y. M. Song, Nat. Commun., 2022, 13, 247 CrossRef CAS PubMed.
- U. Jung, C. J. Beak, K. Kim, J. H. Na and S. H. Lee, ACS Nano, 2024, 18, 27642–27653 CrossRef CAS PubMed.
- H. Im, J. Yoon, B. So, J. Choi, D. H. Park, S. Kim and W. Park, ACS Nano, 2024, 18, 11703–11716 CrossRef CAS PubMed.
- J. Huang, X. Jin, X. F. Yang, T. H. Zhao, H. L. Xie and P. F. Duan, ACS Nano, 2024, 18, 15888–15897 CrossRef CAS PubMed.
- X. H. Liu, H. Shao, N. Li, X. Teng, D. Li, X. T. Dong and H. B. Zhang, Chem. Eng. J., 2024, 500, 157531 CrossRef CAS.
- H. F. Huang, L. L. Wang, H. C. Zhou, H. Z. Xing, L. J. Wang, W. Zhang, K. Tang, J. Huang and L. J. Wang, ACS Appl. Mater. Interfaces, 2024, 16, 63808–63817 CrossRef CAS PubMed.
- H. S. Albaqawi, S. M. Al-shomar, I. M. Danmallam and I. Bulus, J. Alloys Compd., 2023, 965, 171101 CrossRef CAS.
- M. Parvathy, P. S. Ghosh, A. Arya and M. Sabeena, Mater. Res. Bull., 2024, 178, 112885 CrossRef CAS.
- P. C. Stanish, P. H. Yin and P. V. Radovanovic, Chem. Mater., 2020, 32, 7516–7523 CrossRef CAS.
- D. X. Guo, Z. J. Wang, N. Wang, B. Zhao, Z. H. Li, J. W. Chang, P. H. Zhao, Y. Wang, X. Y. Ma, P. L. Li and H. Suo, Chem. Eng. J., 2024, 492, 152312 CrossRef CAS.
- P. J. Keenan, R. M. Purkiss, T. Klamroth, P. A. Sloan and K. R. Rusimova, Nat. Commun., 2024, 15, 10322–10322 CrossRef CAS PubMed.
- B. Lyu, O. Y. Yang, D. G. Gao, X. Y. Wan and X. Bao, Small, 2025, 21(3), 2408574 CrossRef CAS PubMed.
- M. P. Ma, Z. T. Jiang, T. J. Ma, X. X. Gao, J. Li, M. H. Liu, J. C. Yan and X. S. Jiang, Adv. Funct. Mater., 2024, 34, 2405239 CrossRef CAS.
- Q. Xu, J. P. B. Ataides, C. A. Pattison, N. Raveendran, D. Bluvstein, J. Wurtz, B. Vasic, M. D. Lukin, L. Jiang and H. Zhou, Nat. Phys., 2024, 20, 1084–1090 Search PubMed.
- F. H. Jiao, C. N. Lin, L. Dong, X. Mao, Y. Wu, F. Y. Dong, Z. F. Zhang, J. L. Sun, S. F. Li, X. Yang, K. K. Liu, L. J. Wang and C. X. Shan, Adv. Sci., 2024, 11, 2308337 Search PubMed.
Footnote |
| † Electronic supplementary information (ESI) available. See DOI: https://doi.org/10.1039/d4nr05237d |
| This journal is © The Royal Society of Chemistry 2025 |