
 Open Access Article
 This Open Access Article is licensed under a Creative Commons Attribution-Non Commercial 3.0 Unported Licence
Physical determinants of nanoparticle-mediated lipid membrane fusion†
Beatrice
Leonardini
 ac,
Davide
Bochicchio
a,
Paolo
Volpe
a,
Francesco
Stellacci
b,
Silvia
Dante
c,
Ester
Canepa
*ad,
Giulia
Rossi
*a and
Annalisa
Relini
a
ac,
Davide
Bochicchio
a,
Paolo
Volpe
a,
Francesco
Stellacci
b,
Silvia
Dante
c,
Ester
Canepa
*ad,
Giulia
Rossi
*a and
Annalisa
Relini
a
aDepartment of Physics, University of Genoa, 16146, Genoa, Italy. E-mail: giulia.rossi@unige.it; ester.canepa@edu.unige.it; ester.canepa@cbni.ucd.ie
bInstitute of Material Science & Engineering, EPFL, 1015, Lausanne, Switzerland
cMaterials Characterization Facility, Istituto Italiano di Tecnologia, 16163, Genoa, Italy
dCentre for BioNano Interactions, School of Chemistry, University College Dublin, Belfield, Dublin 4, Ireland
First published on 5th March 2025
Abstract
A wide range of fundamental cellular activities rely on lipid membrane fusion. Membrane fusion processes can be mimicked by synthetic approaches to understand fusion mechanisms and develop novel drug delivery systems and therapeutic agents. Recently, membrane-embedded amphiphilic gold nanoparticles (AuNPs) have been employed as artificial fusogens to induce finely tuned membrane fusion in vitro. However, the physical determinants driving and regulating the fusion process mediated by AuNPs remain largely unexplored, thus limiting the application potential of this synthetic fusion system. Herein, we focus on unraveling the effect of the interplay between the curvature of the lipid membrane and the size of amphiphilic AuNPs during fusion events. We employed AuNPs with the same surface chemistry but different core diameters (∼2 nm and ∼4 nm) interacting with phosphatidylcholine unilamellar vesicles of different membrane curvatures containing a biologically relevant percentage of cholesterol. Based on a combination of fluorescence spectroscopy assays, dissipative quartz microbalance, and molecular dynamics simulations, our findings reveal that small AuNPs promote vesicle fusion regardless of the membrane curvature. In contrast, large AuNPs do not exhibit fusogenic properties with low curvature membranes and can induce fusion events only with significantly curved membranes. Large NPs impede the progression from the stalk state to the hemifused state via steric hindrance, an effect that is only partially compensated by the membrane curvature. These results offer novel insights into the role of AuNP core size and membrane curvature in mediating the interaction between the vesicles during fusion and highlight how understanding these physical determinants has broad implications in fully exploiting the application potential of novel synthetic fusion approaches.
1. Introduction
Membrane fusion is a key biological process allowing for the mixing of the content and membrane components of membrane-bound compartments.1 This mechanism is crucial in various cellular activities, including neurotransmitter release, hormone secretion via exocytosis, intracellular vesicle trafficking, and cell–cell communication.1–4 In such contexts, the fusion of lipid vesicles with target membranes is precisely controlled by the presence of sophisticated families of fusogenic proteins, such as the SNAP REceptors (SNAREs) proteins and synaptotagmins involved in mediating synaptic transmission in neuronal cells.5–8In the last few decades, considerable efforts have been made to advance our understanding of the complex behaviour of SNARE complexes and similar protein machineries regulating membrane fusion.7,8 At the same time, the use of artificial fusogenic agents in vitro has become an emerging arena in fundamental and applied research focusing on understanding the mechanistic details that govern the fusion process and their potential exploitation for the advancement of novel fusion-related biomedical approaches, including targeted drug delivery systems.9–12
In artificial systems, lipid vesicle fusion is successfully induced by employing synthetic membrane fusogens that have been designed to force bilayers into close proximity.13 These include fusogenic peptide sequences,10,14,15 complementary oligonucleotide strands,16–19 polymers20,21 and engineered inorganic nanoparticles (NPs).22–27 Such biomimetic studies have clearly shown that the mechanism of membrane fusion can be finely modulated by numerous factors, including the physicochemical design of both the synthetic fusogenic agent (e.g. its size and chemical structure)17,18,20,25 and the membrane (e.g. its curvature and lipid composition).22,26
Here, we explore the mechanistic details of the interplay between the size of fusogenic NPs and the curvature of synthetic lipid vesicles in modulating the fusion process in vitro. To this end, we employ small amphiphilic gold NPs (AuNPs) and zwitterionic 1,2-dioleoyl-sn-glycero-3-phosphocholine (DOPC) vesicles enriched with a physiological amount of membrane cholesterol (chol). It is known that small amphiphilic AuNPs embedded in DOPC–chol vesicles are able to act as a minimal synthetic fusion machinery finely tuned by calcium ions (Ca2+) and the membrane cholesterol composition,26 but very little is known about the physical determinants that regulate this NP-mediated lipid membrane fusion.
Our AuNPs are functionalized with an amphiphilic thiol monolayer formed by a mixture of the negatively charged 11-mercapto-1-undecanesulfonate (MUS) and the hydrophobic 1-octanethiol (OT) in a MUS![[thin space (1/6-em)]](https://www.rsc.org/images/entities/char_2009.gif) :OT 2:1 molar ratio (i.e. 68 mol% MUS and 32 mol% OT).26 This ligand mixture confers the NPs with peculiar surface properties that, together with their extremely small size (2–5 nm), allow them to passively and nondestructively penetrate the lipid bilayer of biomimetic membranes28–30 and mammalian cell membranes in vivo31 and in vitro.32,33 In a previous, solely computational, investigation, we predicted that the size of the core of the AuNPs may be an important physical determinant for stalk formation.34 In particular, we suggested that the kinetics of stalk formation may be related to the hydrophobic area exposed by the NP to the facing bilayer. Such an area resulted to be counterintuitively larger for the small, 2 nm in diameter, NPs than for the large ones (4 nm). Moreover, we found that the NP size can influence also the stalk bulkiness, leading to thicker and more stable stalks formed on top of the small NPs.
:OT 2:1 molar ratio (i.e. 68 mol% MUS and 32 mol% OT).26 This ligand mixture confers the NPs with peculiar surface properties that, together with their extremely small size (2–5 nm), allow them to passively and nondestructively penetrate the lipid bilayer of biomimetic membranes28–30 and mammalian cell membranes in vivo31 and in vitro.32,33 In a previous, solely computational, investigation, we predicted that the size of the core of the AuNPs may be an important physical determinant for stalk formation.34 In particular, we suggested that the kinetics of stalk formation may be related to the hydrophobic area exposed by the NP to the facing bilayer. Such an area resulted to be counterintuitively larger for the small, 2 nm in diameter, NPs than for the large ones (4 nm). Moreover, we found that the NP size can influence also the stalk bulkiness, leading to thicker and more stable stalks formed on top of the small NPs.
Here, aiming for an experimental validation of the computational predictions, we experimentally tested the fusogenicity of two populations of monodisperse MUS:OT AuNPs with the same surface functionalization (i.e. 2:1 MUS:OT molar ratio) but different gold core diameters, i.e. small AuNPs with a core size of (2.4 ± 0.4) nm and larger AuNPs with a core size of (4.8 ± 0.5) nm comparable to the thickness of the lipid bilayer (Fig. S1 and Table S1†). Both monodisperse AuNP sizes were tested on zwitterionic vesicles made of 70 mol% DOPC and 30 mol% chol, a biologically relevant cholesterol content that has been shown to remarkably promote fusogenicity in previous biomimetic vesicle fusion studies.26
In addition to testing AuNPs with different sizes, we employed unilamellar DOPC:chol vesicles of different diameters to evaluate the effect of membrane curvature on the NP-mediated fusion process. Specifically, we prepared small unilamellar vesicles (SUVs) by extrusion through membranes with 30 and 50 nm pore sizes and large unilamellar vesicles (LUVs) using membranes with a 100 nm pore size. These vesicles mimic the sizes of some of the key biological vesicles involved in fusion events, such as small synaptic vesicles (∼40–50 nm in diameter) and exocytotic vesicles (around a few hundred nanometers).35,36 Refer to the ESI, Fig. S2† for detailed vesicle characterization.
By probing the role of AuNP core size and lipid membrane curvature with a combined experimental and computational approach based on fluorimetric and dissipative quartz microbalance measurements (QCM-D) validated by molecular dynamics (MD) simulations, we show that the fusogenic activity of amphiphilic AuNPs is dramatically affected by the NP core size and lipid membrane curvature. Interestingly, our results reveal that smaller AuNPs possess more pronounced fusogenic activity than their larger counterparts, promoting vesicle fusion regardless of membrane curvature. In contrast, increasing the size of the gold core significantly hinders the fusion process in the presence of low-curvature membranes. The larger NPs remain fusogenic only in the case of membranes with very large curvatures. Molecular simulations allow us to interpret these results in terms of a different arrangement of the lipid tails in the proximity of the NP in the stalk state, directly affecting the transition from the stalk state to the hemifused stage. Overall, these results represent another fundamental step toward understanding how engineered NPs can be rationally designed to achieve finely controlled fusion events in artificial membranes to develop novel applications in medicine, biotechnology, and materials science.
2. Results and discussion
Fluorescence assays and QCM-D experiments
We investigated the NP-mediated vesicle fusion process by combining fluorescence spectroscopy assays and QCM-D measurements. Membrane fusion was first probed by a lipid mixing fluorescence assay based on Förster resonance energy transfer (FRET) between the donor lipid 1,2-dioleoyl-sn-glycero-3-phosphoethanolamine-N-(7-nitro-2-1,3-benzoxadiazol-4-yl) (NBD-PE) and the acceptor lipid 1,2-dioleoyl-sn-glycero-3-phosphoethanolamine-N-(lissamine rhodamine B sulfonyl) (Rhod-PE). Such a fluorimetric method is conventionally used in fusion studies to detect the lipid redistribution that occurs when the two membranes come in contact and establish a stable hydrophobic contact, corresponding to the formation of the stalk state and to the subsequent metastable states characterizing the fusion process (formation of the hemifusion diaphragm and complete fusion). For these experiments, an unlabeled population of vesicles and a population labeled with the two FRET probes were mixed and incubated with small or large AuNPs. To trigger fusion events, we added 2 mM Ca2+ and monitored the temporal changes of the FRET fluorescence signal. In each LUV experiment, we fixed the molar ratio (R) between lipids and NPs at R = 5800, corresponding to ∼13 AuNPs per vesicle, whereas for SUV experiments we used R = 5800 (the same ratio tested for LUVs, now corresponding to ∼3 AuNPs/vesicle) and R = 2320 (∼7 AuNPs/vesicle) (for calculation of AuNPs/vesicle ratios see the ESI†). Fig. 1a and b show the time course of the FRET-based lipid mixing signals of LUVs at R = 5800 and SUVs at R = 2320. Lipid mixing curves of SUVs with fewer NPs per vesicle are reported in Fig. S4a.† Compared to the control experiment without NPs (green curve) which exhibits a flat fluorescence signal of Rhod-PE, with NPs each curve shows a decrease of Rhod-PE fluorescence after Ca2+ injection (Fig. 1a and b, blue and pink curves). This indicates that lipid mixing occurred, which increased the spatial distance between the FRET donor and acceptor probes, thus resulting in a decreased acceptor signal. The lipid mixing curves for LUVs show that the Rhod-PE signal decreases until reaching a plateau after a few hours. Even in the case of SUVs, a decrease in the Rhod-PE signal is observed and the plateau is reached 30 minutes after the addition of Ca2+. | ||
Fig. 1 (a) and (b) Normalized reduction (%) of the real-time Rhod-PE fluorescence signal. Lipid mixing assay based on the FRET was performed with DOPC:chol 70:30 (mol%) vesicles of different membrane curvatures. LUVs and SUVs were preincubated for 15 min with AuNPs at a molar ratio  (i.e. ∼13 AuNPs/vesicle) and (i.e. ∼13 AuNPs/vesicle) and  (i.e. ∼7 AuNPs/vesicle), respectively. Only the last 10 minutes of preincubation are shown. After Ca2+ injection (2 mM, 600 s, dashed arrows), lipid mixing of the vesicles led to a decrease in the Rhod-PE fluorescence signal in the presence of both small and large NPs. This behaviour, observed with both vesicle curvatures, indicates a remodelling of the membranes due to vesicle–vesicle interactions mediated by AuNPs. (c) and (d) QCM-D representative curves (5th overtone) showing normalized frequency (ΔFnorm) and dissipation (ΔD) for experiments involving small and large AuNPs interacting with large DOPC:chol 70:30 (mol%) vesicles. Both experiments were conducted under identical conditions (0.25 mg ml−1 lipid concentration and 0.15 μM AuNP concentration) and followed the same procedural steps, which are numbered in the graphs. The red dashed lines indicate rinses, during which a complete exchange of the solution in the QCM-D chamber occurs, and all material not adhered to the sensor is washed away. The black dashed lines indicate the steps represented with the cartoons below the graphs. The gold sensor was allowed to equilibrate for 600 s in the buffer before the addition of vesicles. The first significant decrease in frequency corresponds to the formation of the SVL (1, vesicle addition; 2, rinse of vesicles not adhering to the sensor). The second decrease corresponds to the uptake of AuNPs into the membrane (3, NP addition; 4, rinse of not uptaken NPs). Following this, a control step was performed, wherein vesicles without calcium were introduced into the chamber (5, vesicle addition; 6, rinse). The third step (7, vesicle and calcium addition; 8, rinse) corresponds to vesicle fusion or hemifusion with the SVL, triggered by the presence of calcium (red points in cartoon 7). Lipid mixing and QCM-D experiments were performed in 2.5 mM Trizma® base and 50 mM NaCl at 25 °C (pH 7.4). Cartoons are not to scale. See the ESI† for full details on the experimental setup and data analysis. (i.e. ∼7 AuNPs/vesicle), respectively. Only the last 10 minutes of preincubation are shown. After Ca2+ injection (2 mM, 600 s, dashed arrows), lipid mixing of the vesicles led to a decrease in the Rhod-PE fluorescence signal in the presence of both small and large NPs. This behaviour, observed with both vesicle curvatures, indicates a remodelling of the membranes due to vesicle–vesicle interactions mediated by AuNPs. (c) and (d) QCM-D representative curves (5th overtone) showing normalized frequency (ΔFnorm) and dissipation (ΔD) for experiments involving small and large AuNPs interacting with large DOPC:chol 70:30 (mol%) vesicles. Both experiments were conducted under identical conditions (0.25 mg ml−1 lipid concentration and 0.15 μM AuNP concentration) and followed the same procedural steps, which are numbered in the graphs. The red dashed lines indicate rinses, during which a complete exchange of the solution in the QCM-D chamber occurs, and all material not adhered to the sensor is washed away. The black dashed lines indicate the steps represented with the cartoons below the graphs. The gold sensor was allowed to equilibrate for 600 s in the buffer before the addition of vesicles. The first significant decrease in frequency corresponds to the formation of the SVL (1, vesicle addition; 2, rinse of vesicles not adhering to the sensor). The second decrease corresponds to the uptake of AuNPs into the membrane (3, NP addition; 4, rinse of not uptaken NPs). Following this, a control step was performed, wherein vesicles without calcium were introduced into the chamber (5, vesicle addition; 6, rinse). The third step (7, vesicle and calcium addition; 8, rinse) corresponds to vesicle fusion or hemifusion with the SVL, triggered by the presence of calcium (red points in cartoon 7). Lipid mixing and QCM-D experiments were performed in 2.5 mM Trizma® base and 50 mM NaCl at 25 °C (pH 7.4). Cartoons are not to scale. See the ESI† for full details on the experimental setup and data analysis. | ||
To further understand the interaction between vesicles and AuNPs of different sizes, we employed QCM-D measurements involving DOPC:chol 70:30 (mol%) LUVs. We used gold-coated QCM sensors where vesicles adhere without merging. In this way, vesicles deposit and form a supported vesicle layer, which provides a suitable system with viscoelastic properties for studying interactions with NPs and other vesicles. We aimed at monitoring the uptake of the two NP populations into the supported vesicle layers (SVL) and investigating their impact on vesicle fusion.
Interactions between 2–5 nm core size AuNPs and membranes have already been demonstrated in previous studies using techniques such as confocal, electron, atomic force microscopy and electrophysiology experiments.37–39 Consistent with these findings and our previous results based on SVLs,26,29 the QCM-D investigation on small NPs indicated their ability to passively penetrate the membrane. Furthermore, we observed that also large AuNPs stably interact with the membrane, although they exhibit slower entry kinetics compared to the smaller ones (Fig. 1c and d, steps 3–4). We estimated that the number of NPs per vesicle is similar to small and large NPs, being equal to approximately 94 small AuNPs and 84 large AuNPs per vesicle (see the ESI† for details). Following NP uptake, we used QCM-D to detect mass changes induced by vesicle membrane fusion events. Again, we investigated Ca2+-triggered vesicle fusion testing both AuNP sizes. A control measurement was performed by injecting additional Ca2+-free vesicles into the chamber (Fig. 1c and d, step 5), resulting in no significant changes in frequency (consistent with the absence of lipid mixing prior to Ca2+ addition). After approximately 15 minutes, we performed a rinse (Fig. 1c and d, step 6) followed by the addition of vesicles mixed with 2 mM Ca2+ (Fig. 1c and d, step 7) and a final rinse to remove all unbound material (Fig. 1c and d, step 8). After the injection of Ca2+ and vesicles into the chamber (step 7), we detected different behaviours of the SVL in the presence of small and large NPs. Specifically, with large NPs a larger decrease in frequency was observed compared to small NPs. This indicates that more vesicles bind to the SVL in the presence of large NPs. A coherent behaviour is found for dissipation. The decrease in frequency corresponds to an increase in dissipation, suggesting increased viscoelasticity of the SVL system due to the interaction with water-filled vesicles; this effect is larger in the presence of large NPs. However, after the final rinse, we observed that in the presence of large NPs the frequency increased and dissipation decreased, indicating that some of the attached material was removed, as a consequence of weak interactions with the SVL, most likely not implying any hemifused or fused state. In contrast, no material was washed away in the presence of small NPs, revealing that attached vesicles remain stably bound. In both cases we observed that, after step 8, a fraction of vesicles stably interacts with the SVL, remaining bound to it and suggesting that either fusion or hemifusion events occurred.
Lipid mixing assays and dissipative quartz microbalance experiments provide significant insights into the interactions between vesicle membranes mediated by AuNPs. However, these methods do not distinguish between hemifusion and complete fusion states, as they do not detect the formation of a fusion pore.
Therefore, we employed content mixing assays based on the self-quenching fluorescent dye Sulforhodamine B (SRB) to probe the mixing of the vesicle aqueous contents. The use of this technique to detect fusion pore formation and test the extent of membrane fusion events is well established in vesicle studies with26,27 and without40,41 the presence of NPs. To this end, we prepared two vesicle populations with the same size and lipid composition. One vesicle population was loaded with SRB at a self-quenching concentration (50 mM),27,42 whereas the other was prepared without the dye. Upon fusion, the contents of loaded and unloaded vesicles mix, diluting the dye and thus inducing a de-quenching of SRB and a consequent increase in its fluorescence signal. Fig. 2 shows the time course of the fluorescence emission of SRB before and after the addition of 2 mM Ca2+ (dashed arrow) to LUVs and SUVs preincubated for 15 minutes with small or large AuNPs. Results are shown for the same two lipid/NP ratios used in lipid mixing experiments, i.e. R = 5800 for LUVS (Fig. 2a) and R = 2320 for SUVs (Fig. 2b). Small AuNPs (blue curves), both in the presence of LUVs and SUVs, induce a rapid and clear increase in the SRB signal within the first few seconds after Ca2+ injection. Then, the fluorescence intensity reaches a plateau within 30 minutes. This behaviour is consistent with the kinetics reported in our previous study focusing on small 2.4 nm MUS:OT AuNPs.26 However, the plateau values differ depending on the membrane curvature and correspond to ∼18% and ∼48% for vesicles with a low and high membrane curvature, respectively. Since the number of NPs per vesicle is comparable in both cases, the increase of fusion events with SUVs is primarily promoted by their higher membrane curvature. Conversely, large AuNPs do not exhibit fusogenic properties with low curvature membranes but show a tendency to induce fusion events with more curved membranes. Indeed, in Fig. 2b the SRB signal for large AuNPs (pink curve) is distinct from the control curve (green curve) recorded without vesicle preincubation with AuNPs.
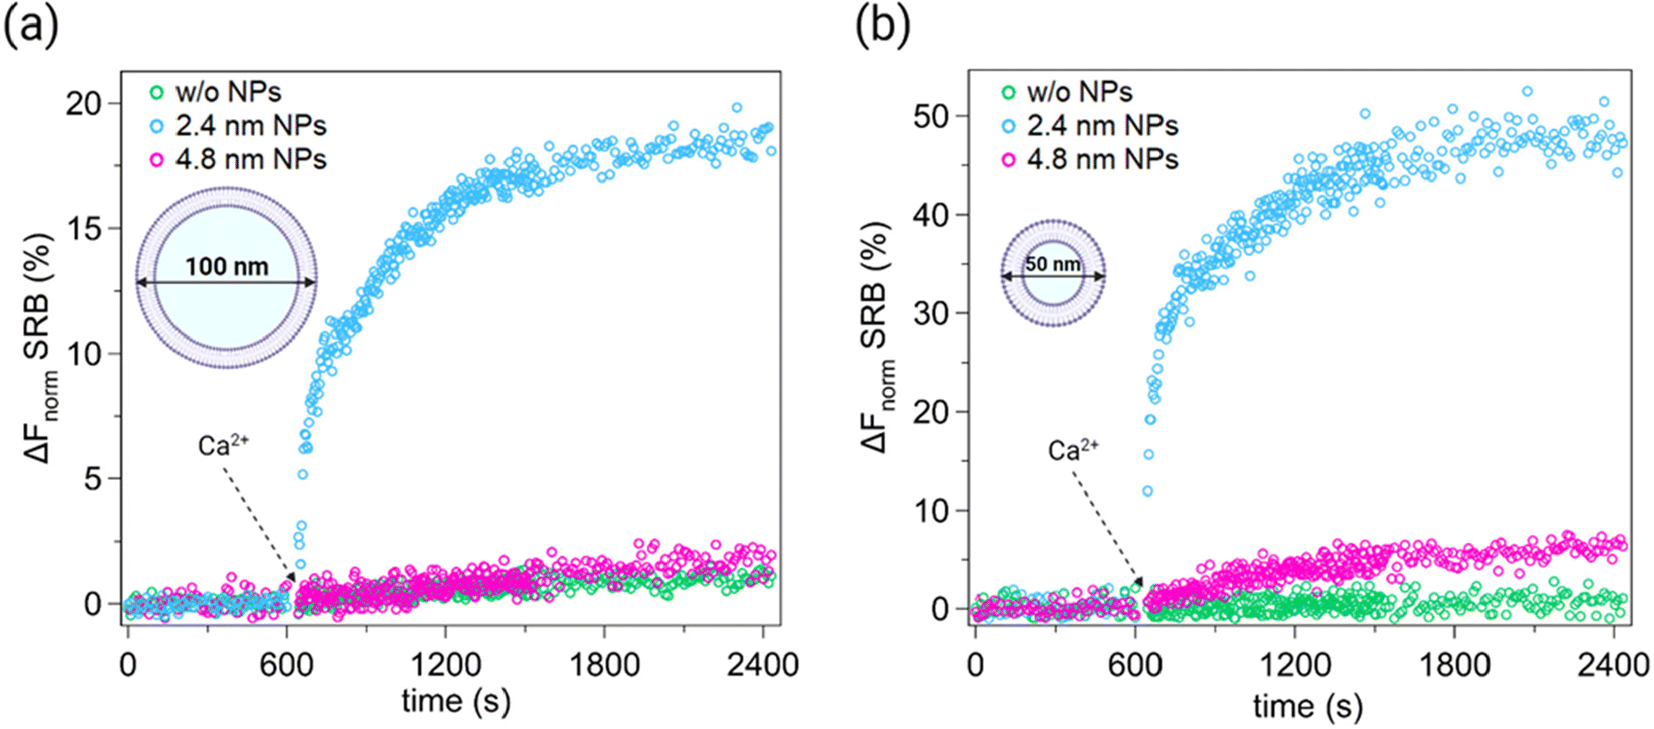 | ||
Fig. 2 Normalized increase (%) of real-time SRB fluorescence signal. Content mixing assay was performed with DOPC:chol 70:30 (mol%) vesicles of different membrane curvatures. LUVs and SUVs were incubated for 15 min with AuNPs at a molar ratio 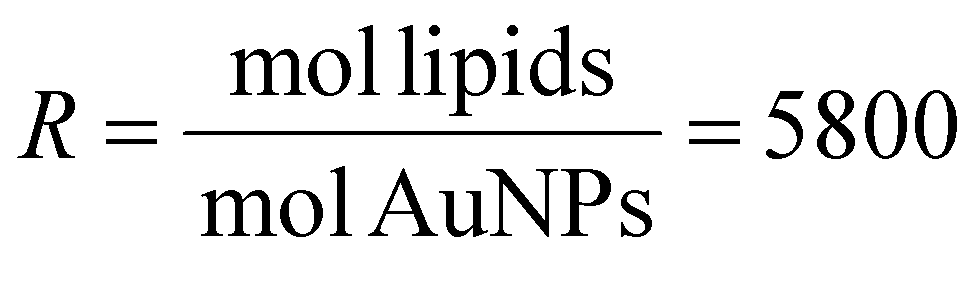 (∼13 AuNPs/vesicle) and (∼13 AuNPs/vesicle) and  (∼7 AuNPs/vesicle), respectively. Only the last 10 min of preincubation are shown in each plot. After 600 s, 2 mM Ca2+ were added (dashed arrows). (a) In the presence of vesicles with membranes of low curvature (i.e. LUVs), the fluorescence emission of SRB (%) increases significantly when vesicles are incubated with small AuNPs (blue curve), suggesting the mixing of vesicle contents. However, when large AuNPs are used (pink curve), an increase in SRB fluorescence emission is not observed and the signal overlaps that of the control without AuNPs (green curve). (b) In the presence of more curved membranes (i.e. SUVs), a significant increase in the SRB signal is observed with small NPs (blue curve), while, unlike the case with LUVs, even with large NPs a slight increase in fluorescence is observed (pink curve). The latter is indeed distinguished from the control experiment (green curve). Each experiment was performed in 2.5 mM Trizma® base and 50 mM NaCl (pH7.4) at 25 °C. See the ESI† for full details on the experimental setup and data analysis. (∼7 AuNPs/vesicle), respectively. Only the last 10 min of preincubation are shown in each plot. After 600 s, 2 mM Ca2+ were added (dashed arrows). (a) In the presence of vesicles with membranes of low curvature (i.e. LUVs), the fluorescence emission of SRB (%) increases significantly when vesicles are incubated with small AuNPs (blue curve), suggesting the mixing of vesicle contents. However, when large AuNPs are used (pink curve), an increase in SRB fluorescence emission is not observed and the signal overlaps that of the control without AuNPs (green curve). (b) In the presence of more curved membranes (i.e. SUVs), a significant increase in the SRB signal is observed with small NPs (blue curve), while, unlike the case with LUVs, even with large NPs a slight increase in fluorescence is observed (pink curve). The latter is indeed distinguished from the control experiment (green curve). Each experiment was performed in 2.5 mM Trizma® base and 50 mM NaCl (pH7.4) at 25 °C. See the ESI† for full details on the experimental setup and data analysis. | ||
In silico experiments
To add molecular details and help interpret the experimental results on the interplay between the NP and vesicle sizes, we employed MD simulations by exploiting sub-molecular resolution coarse-grained (CG) models. As done in previous studies,26,34 we modeled the lipid bilayers and the MUS:OT AuNPs with the Martini CG force-field43 and focused our initial in silico investigations on the first step of the fusion process: stalk formation. Unlike our previous work,26,34 where we adopted planar configurations for the membranes, we simulated the stalk formation between vesicles of different sizes (and thus membranes with different curvatures). Since stalk formation is a rare event, we employed umbrella sampling44 simulations to measure the free energy profile of NP-induced stalk formation. As a collective variable, we exploited a modified version34 of the chain coordinate, ξch, developed by Hub et al.45
We prepared and equilibrated four systems in which we varied the size of the vesicle (17 nm or 30 nm of diameter, with DOPC + 30% mol cholesterol composition) and the size of the NP core (2 nm or 4 nm of diameter). Even though the vesicle sizes do not match the experimental ones due to computational constraints, having two different sizes allows us to investigate curvature effects. The configuration of our simulation box is exemplified in Fig. 3a (details about the procedure to generate it can be found in the ESI†). The same setup has been successfully adopted in the literature to study vesicle fusion induced by carbon nanotubes.47 We paid particular attention to making the different systems comparable. We adjusted the box z dimension to have the NP surface in the pre-stalk state at approximately the same distance (∼2 nm) from the facing membrane. In all cases, in the initial configuration the NP interacted spontaneously with the top bilayer through the charged terminals of its MUS ligands. More details about the systems’ setup can be found in the ESI.†
 | ||
| Fig. 3 The effect of the interplay between vesicle and NP curvatures on the free energy profiles of stalk formation. (a) Setup of our simulation box: a single vesicle is interacting with itself in the region of the embedded NP thanks to periodic boundary conditions. Lipid heads are in cyan, lipid tails in blue, the NP core in yellow, and MUS ligands in red. We also represent the cylinder position used to define the chain coordinate. (b) Snapshot showing the typical arrangement of MUS ligands after stalk formation. (c) Free energy profiles of stalk formation for the 30 nm vesicle and both NP sizes. Here and in the following, error bars were calculated with the bootstrapping of trajectories by means of gmx wham tool. Bootstrapping relied on an estimation of the integrated autocorrelation time of the reaction coordinate in each window, as described in detail in ref. 46. (d) Free energy profiles of stalk formation for the 17 nm vesicle and both NP sizes. (e) Stability of the stalk state (quantified as |ΔG| = |Gmin,S − Gmin,A|) as a function of vesicle curvature (zero corresponds to flat membranes, low and high to vesicles with a diameter of 30 nm and 17 nm, respectively). Lines are just a guide to the eye. Results at zero curvature come from our previous work.34 | ||
In all four cases, we pulled the system along the chain coordinate to induce stalk formation and gather the initial configurations for the umbrella sampling windows. Technical details about the parameters adopted in these calculations can be found in the ESI.† The stalks that formed during pulling were characterized from the point of view of the NP ligands’ configuration, also in comparison with previous results obtained in flat membranes. We found that the hydrophobic surface exposed by the small and large NP embedded in the curved liposomes is comparable, within the error bars, to the one exposed when the NP was embedded in the flat membranes.34 Similarly to what happens in flat membranes, the process is triggered by the establishment of a hydrophobic contact between a lipid of the facing membrane and the hydrophobic ligands of the NP (as shown in Fig. S3 of ref. 34). The stalk formation mechanisms are also the same: the charged MUS terminals exposed by the NP to the water phase open up to accommodate the hydrophobic connection between the bilayers, as shown in Fig. 3b. As a result, the MUS ligands divide into two groups. One MUS ligand group is functional to anchoring the NP to the distal leaflet. The second MUS group surrounds the stalk circular edge, as shown in Fig. S7.†
Fig. 3c reports the free energy profiles obtained with the 30 nm vesicle (lowest curvature). We set at zero free energy the adsorbed state (A) and quantified the stalk stability by means of the absolute depth of the stalk minimum (S), namely |ΔG| = |Gmin,S − Gmin,A|. The stalk state is the most favorable state in all cases. While the barriers are comparable, the stalk minimum is deeper for the small NP core. Therefore, consistent with the case of flat membranes,34 the 2 nm NP core favors stalk formation compared to the 4 nm one. However, while the stalk configuration for the 4 nm NP was equally probable to the pre-stalk in flat membranes, the curvature makes the stalk more stable than the pre-stalk in both cases, and the effect of the NP core size is less critical. The same trend is found in the case of the 17 nm vesicle (Fig. 3d), where the stalk is still more stable with the smaller NP, but the difference between 2 nm and 4 nm NPs is even less pronounced.
In Fig. 3e, we report as a function of the vesicle curvature for all the simulated cases. It is clear that increasing the curvature favors stalk formation for both NP sizes, but the effect on the large NP is more dramatic than the effect on the small one.
To further interpret the interplay between the curvatures of the NP cores and of the vesicles, we produced density maps of the hydrophobic lipid tails (see Fig. 4) in the stalk state in the flat and curved (17 nm and 30 nm diameter vesicles) membranes. Fig. 4a–c show the stalk formed on top of the 2 nm NPs with varying membrane curvature. In all cases, a dense and thick stalk forms. The stalk thickness visibly increases as the curvature increases. The density of lipid tails never vanishes in proximity to the NP, which is always entirely wrapped by lipids, even in flat membranes. In contrast, Fig. 4d shows that the lipid connection between the two membranes is missing for 4 nm NPs in flat membranes. The stalk is not completely unstable because the hydrophobic moieties of the NP ligands bridge the gap between the lipid tails of the two membranes. Interestingly, when the curvature increases, the lipid connection starts appearing also around the 4 nm NP (Fig. 4e and f). At both vesicle sizes, we have a continuous connection only on one side of the NP, and it is less dense than the ones present in the case of the 2 nm NP.
 | ||
| Fig. 4 Density maps of hydrophobic tails in the stalk state for the different vesicle sizes. The densities are normalized by dividing by the maximum density achieved in each case. The position of the NP in each case is indicated with a partially transparent yellow circle. (a and d) Flat membranes; (b and e) 17 nm diameter vesicles; (c and f) 30 nm diameter vesicles. (a–c) 2 nm NPs; (d–f) 4 nm NPs. | ||
To investigate the cholesterol distribution in our systems, we produced maps of the local cholesterol molar percentage in all six systems in the stalk state (see Fig. S8†). Coherently with what is expected, cholesterol enriches the vesicle's inner leaflet, and the effect is more pronounced for the smaller, highly curved vesicles. However, interestingly, the regions where the enrichment is more pronounced are in the surroundings of the NPs and just above them in the stalk region. This effect is coherent with what was observed in our previous work26 and motivated by cholesterol being smaller and thinner than DOPC.
The different propensity for stalk formation of the 2 nm and 4 nm NPs predicted by simulations is consistent with the experimental data, which suggested a larger fusogenicity for the 2 nm NPs and the need for a pronounced membrane curvature to induce some fusogenicity by the 4 nm NPs. As stalk formation is only the first step along the fusion pathway, and not necessarily the rate-limiting one,26 we wondered how the different NPs could induce the subsequent transition to the hemifused state in a vesicle with a large curvature (17 nm). We constructed 2 new systems composed of two vesicles of 17 nm with a preformed stalk over a single NP of 2 nm or 4 nm in size (starting from the configurations used for the umbrella sampling). Then, we let them evolve freely in unbiased simulation runs for 2 μs. In the simulation containing the small NP, we could observe the system spontaneously going beyond the stalk stage and reaching the hemifused stage. In contrast, we could not observe the same spontaneous process with the large NP.
The snapshots highlighting the stalk-to-hemifusion transition for the small NP are reported in Fig. 5. The process starts from a stalk formed just over the NP (Fig. 5a). After a few tens of ns, we observe the connection between the two vesicles enlarging on one NP side (Fig. 5b). As soon as such a connection reaches a critical radius,48 the formation of the appropriate hemifusion diaphragm starts, with the NP more and more laterally displaced away from the hydrophobic connection region (Fig. 5c). At this point, the hemifusion diaphragm expands independently of the NP, which diffuses away from it (Fig. 5d and e). The formation of the hemifusion diaphragm is accompanied by the progressive reduction of the stalk height, hs, as exemplified in Fig. 5f. With the small NP, hs is around 7 nm in the stalk state and then decreases, reaching a value of 3 nm in a few hundred ns, corresponding to a bilayer's hydrophobic thickness.
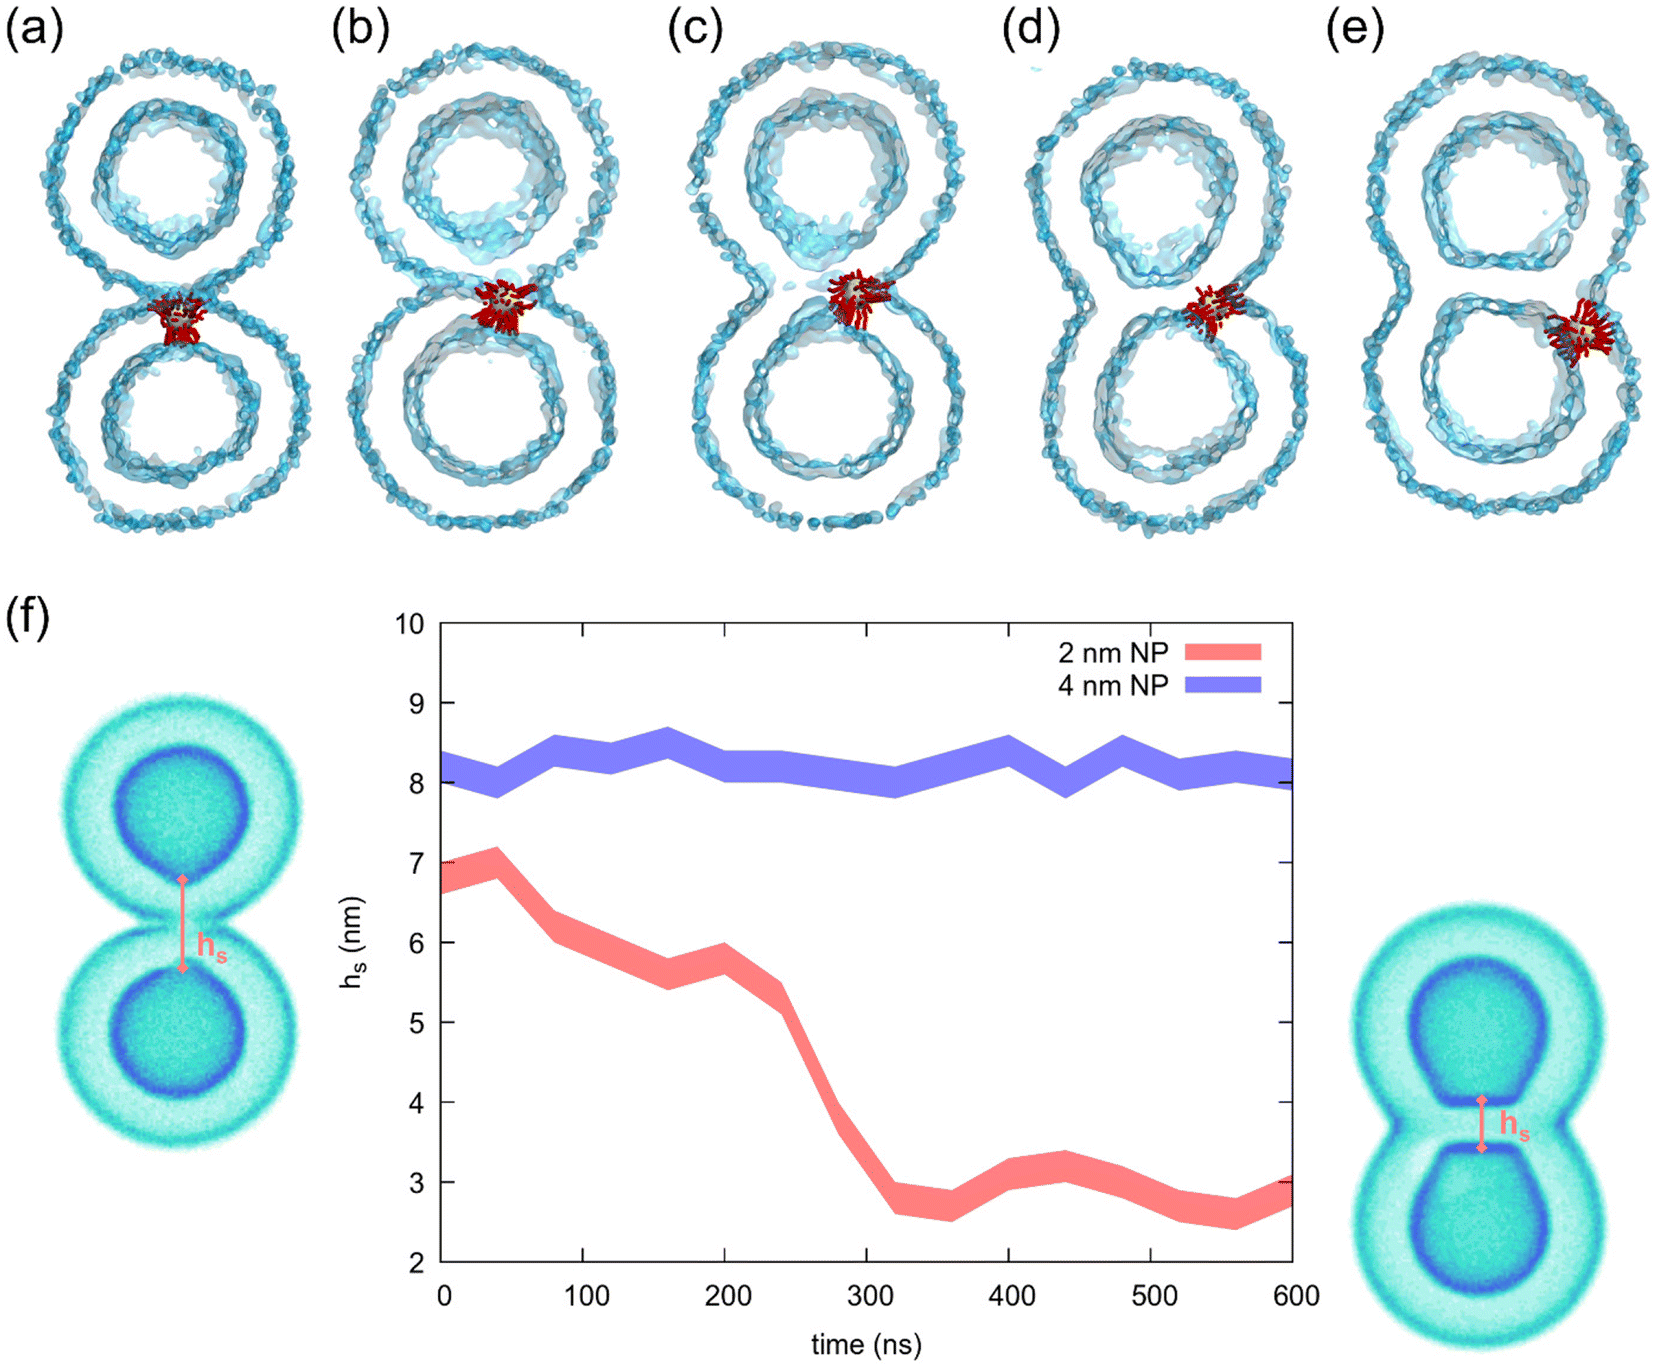 | ||
| Fig. 5 The molecular path from small AuNP-induced stalk to hemifusion, obtained from unbiased molecular dynamics simulations at 310 K. (a–e) Simulation snapshots that represent the different stages of the process. (f) The hydrophobic stalk height hs as a function of time obtained from the unbiased simulations of the free vesicles with the two different NP core sizes. The stalk thinning leading to hemifusion is observed only in the case of the smaller core. | ||
In contrast, when the stalk forms on top of the 4 nm NP, the NP's larger steric encumbrance sets hs to an initial value of 8 nm (1 nm larger) and no stable hydrophobic connection can be formed around the NP. Under these conditions, the lateral displacements of the NP cannot cause the enlargement of the stalk radius, the critical radius cannot be reached and the system does not complete the transition to the hemifused state (hs remains constant, as shown in Fig. 5f).
3. Conclusion
Wrapping up our results, we showed that amphiphilic AuNPs with a 2 nm core are more efficient than larger, 4 nm core NPs in promoting fusion between PC vesicles, and that the 4 nm NPs can promote fusion only in the presence of extreme vesicle curvatures. Molecular simulations indicate that this behavior can be attributed to two different physical effects. First, the NP size, and thus the NP curvature, determines a larger conformational flexibility of the ligands on the surface of the 2 nm NP. Such a conformational flexibility is responsible for the stabilization of a thick stalk, as previously shown and discussed.34 Second, the smaller steric encumbrance of the 2 nm NP determines the possibility to establish a continuous hydrophobic lipid connection between the facing membranes. The thickness of the hydrophobic connection increases with vesicle curvature. Such a connection is key to the transition from the stalk to the hemifused state. This transition happens upon lateral displacement of the NP core and consequent reduction of the stalk height until the hemifusion diaphragm is formed.As already observed in the case of the surfactant-associated protein B (SP-B),49 after the hemifusion diaphragm is formed, the fusogenic agent (here, the small NP) does not seem to play further roles in later stages of fusion, no longer directly participating in the process. Nevertheless, as in our simulations we included only a single NP in the vesicle membrane, we cannot exclude that cooperative effects may come into play in the presence of more, possibly clustering NPs.50
Author contributions
B. L. and D. B. contributed equally to this work, performing most of the experimental (B. L.) and computational (D. B.) work. P. V. contributed to the in silico simulations. A. R., E. C. and G. R. conceived the work and directed the experimental (A. R. and E. C.) and computational (G. R.) efforts. S. D. contributed to the supervision of QCM-D experiments. F. S. supervised the NP synthesis performed by E. C. and participated in the final discussion of the results. B. L., D. B. and E. C. wrote the manuscript with contributions from A. R. and G. R. All authors revised the manuscript.Data availability
Input data for Gromacs simulations (.mdp, .itp, .top, .gro) are freely available at https://bitbucket.org/biomembnp/biomembnp/src/master/fusion/.Conflicts of interest
The authors declare no conflicts of interest.References
- R. Jahn, T. Lang and T. C. Südhof, Cell, 2003, 112, 519–533 CrossRef CAS.
- R. Jahn and T. C. Südhof, Annu. Rev. Biochem., 1999, 68, 863–911 CrossRef CAS PubMed.
- J. Rizo and C. Rosenmund, Nat. Struct. Mol. Biol., 2008, 15, 665–674 CrossRef CAS PubMed.
- L. Cui, H. Li, Y. Xi, Q. Hu, H. Liu, J. Fan, Y. Xiang, X. Zhang, W. Shui and Y. Lai, Mol. Biomed., 2022, 3, 29 CrossRef CAS PubMed.
- S. Martens and H. T. McMahon, 2008, preprint, DOI:10.1038/nrm2417.
- R. Jahn and R. H. Scheller, 2006, preprint, DOI:10.1038/nrm2002.
- R. Jahn, D. C. Cafiso and L. K. Tamm, Nat. Res., 2024, 25, 101–118 CAS.
- S. Martens, M. M. Kozlov and H. T. McMahon, Science, 2007, 316, 1205–1208 CrossRef CAS PubMed.
- F. Mazur and R. Chandrawati, ChemNanoMat, 2021, 7, 223–237 CrossRef CAS.
- Y. Zeng, M. Shen, A. Singhal, G. J. A. Sevink, N. Crone, A. L. Boyle and A. Kros, Small, 2023, 19(37) DOI:10.1002/smll.202301133.
- J. Yang, A. Bahreman, G. Daudey, J. Bussmann, R. C. L. Olsthoorn and A. Kros, ACS Cent. Sci., 2016, 2, 621–630 CrossRef CAS PubMed.
- N. T. Ho, M. Siggel, K. V. Camacho, R. M. Bhaskara, J. M. Hicks, Y.-C. Yao, Y. Zhang, J. Köfinger, G. Hummer and A. Noy, Proc. Natl. Acad. Sci. U. S. A., 2021, 118 DOI:10.1073/pnas.2016974118.
- A. Witkowska, L. P. Heinz, H. Grubmüller and R. Jahn, Nat. Commun., 2021, 12, 3606 CrossRef CAS PubMed.
- M. Ma and D. Bong, Acc. Chem. Res., 2013, 46, 2988–2997 CrossRef CAS.
- G. A. Daudey, M. Shen, A. Singhal, P. van der Est, G. J. A. Sevink, A. L. Boyle and A. Kros, Chem. Sci., 2021, 12, 13782–13792 RSC.
- Y.-Y. Hsu, S. J. Chen, J. Bernal-Chanchavac, B. Sharma, H. Moghimianavval, N. Stephanopoulos and A. P. Liu, Chem. Commun., 2023, 59, 8806–8809 RSC.
- P. M. G. Löffler, O. Ries and S. Vogel, Methods Mol. Biol., 2020, 2063, 101–118 CrossRef PubMed.
- P. M. G. Löffler, A. H. Hansen, O. Ries, U. Jakobsen, A. Rabe, K. T. Sørensen, K. Glud and S. Vogel, Sci. Rep., 2019, 9, 13856 CrossRef.
- A. Rabe, P. M. G. Löffler, O. Ries and S. Vogel, Chem. Commun., 2017, 53, 11921–11924 RSC.
- D. Mukherjee, D. Paul, S. Sarker, Md. N. Hasan, R. Ghosh, S. E. Prasad, P. K. Vemula, R. Das, A. Adhikary, S. K. Pal and T. Rakshit, ACS Appl. Bio Mater., 2021, 4, 8259–8266 CrossRef CAS PubMed.
- N. Marušič, L. Otrin, J. Rauchhaus, Z. Zhao, F. L. Kyrilis, F. Hamdi, P. L. Kastritis, R. Dimova, I. Ivanov and K. Sundmacher, Proc. Natl. Acad. Sci. U. S. A., 2022, 119(20) DOI:10.1073/pnas.2122468119.
- M. Arribas Perez and P. A. Beales, Langmuir, 2021, 37, 13917–13931 CrossRef CAS PubMed.
- A. Bahadori, L. B. Oddershede and P. M. Bendix, Nano Res., 2017, 10, 2034–2045 CrossRef CAS.
- A. Rørvig-Lund, A. Bahadori, S. Semsey, P. M. Bendix and L. B. Oddershede, Nano Lett., 2015, 15, 4183–4188 CrossRef PubMed.
- S. Blasco, L. Sukeník and R. Vácha, Nanoscale, 2024, 16, 10221–10229 RSC.
- E. Canepa, D. Bochicchio, P. Henrique, J. Silva, F. Stellacci, S. Dante, G. Rossi and A. Relini, Small, 2023, 19, 2207125 CrossRef CAS PubMed.
- M. A. Tahir, Z. P. Guven, L. R. Arriaga, B. Tinao, Y.-S. S. Yang, A. Bekdemir, J. T. Martin, A. N. Bhanji, D. Irvine, F. Stellacci and A. Alexander-Katz, PNAS, 2020, 117(31), 18470–18476 CrossRef CAS PubMed.
- E. Canepa, S. Salassi, F. Simonelli, R. Ferrando, R. Rolandi, C. Lambruschini, F. Canepa, S. Dante, A. Relini and G. Rossi, Sci. Rep., 2021, 11, 1256 CrossRef CAS.
- E. Canepa, D. Bochicchio, M. Gasbarri, D. Odino, C. Canale, R. Ferrando, F. Canepa, F. Stellacci, G. Rossi, S. Dante and A. Relini, J. Phys. Chem. Lett., 2021, 12, 8583–8590 CrossRef CAS PubMed.
- E. Canepa, A. Relini, D. Bochicchio, E. Lavagna and A. Mescola, Membranes, 2022, 12, 673 CrossRef CAS PubMed.
- Y.-S. S. Yang, P. U. Atukorale, K. D. Moynihan, A. Bekdemir, K. Rakhra, L. Tang, F. Stellacci and D. J. Irvine, Nat. Commun., 2017, 8, 14069 CrossRef CAS PubMed.
- P. U. Atukorale, Y.-S. Yang, A. Bekdemir, R. P. Carney, P. J. Silva, N. Watson, F. Stellacci and D. J. Irvine, Nanoscale, 2015, 7, 11420–11432 RSC.
- R. P. Carney, T. M. Carney, M. Mueller and F. Stellacci, Biointerphases, 2012, 7, 3–11 CrossRef PubMed.
- G. Brosio, G. Rossi and D. Bochicchio, Nanoscale Adv., 2023, 5, 4675–4680 RSC.
- S. Takamori, M. Holt, K. Stenius, E. A. Lemke, M. Grønborg, D. Riedel, H. Urlaub, S. Schenck, B. Brügger, P. Ringler, S. A. Müller, B. Rammner, F. Gräter, J. S. Hub, B. L. De Groot, G. Mieskes, Y. Moriyama, J. Klingauf, H. Grubmüller, J. Heuser, F. Wieland and R. Jahn, Cell, 2006, 127, 831–846 CrossRef CAS.
- T. J. Greenwalt, Transfusion, 2006, 46, 143–152 CrossRef.
- E. Canepa, S. Salassi, A. L. De Marco, C. Lambruschini, D. Odino, D. Bochicchio, F. Canepa, C. Canale, S. Dante, R. Brescia, F. Stellacci, G. Rossi and A. Relini, Nanoscale, 2020, 12, 19746–19759 RSC.
- P. U. Atukorale, Z. P. Guven, A. Bekdemir, R. P. Carney, R. C. Van Lehn, D. S. Yun, P. H. Jacob Silva, D. Demurtas, Y. S. Yang, A. Alexander-Katz, F. Stellacci and D. J. Irvine, Bioconjugate Chem., 2018, 29, 1131–1140 CrossRef CAS PubMed.
- F. Mashali, C. M. Basham, X. Xu, C. Servidio, P. H. J. Silva, F. Stellacci and S. A. Sarles, Langmuir, 2023, 39, 15031–15045 CrossRef CAS PubMed.
- P. M. G. Löffler, O. Ries and S. Vogel, DNA-Mediated Liposome Fusion Observed by Fluorescence Spectrometry, in Nucleic Acid Detection and Structural Investigations. Methods in Molecular Biology, ed. K. Astakhova and S. Bukhari, Humana, New York, NY, 2020, vol. 2063 Search PubMed.
- M. Kyoung, Y. Zhang, J. Diao, S. Chu and A. T. Brunger, Nat. Protoc., 2013, 8, 1–16 CrossRef CAS PubMed.
- Y. Lai, J. Diao, Y. Liu, Y. Ishitsuka, Z. Su, K. Schulten, T. Ha and Y. K. Shin, Proc. Natl. Acad. Sci. U. S. A., 2013, 110, 1333–1338 CrossRef CAS PubMed.
- S. J. Marrink, H. J. Risselada, S. Yefimov, D. P. Tieleman and A. H. De Vries, J. Phys. Chem. B, 2007, 111, 7812–7824 CrossRef CAS PubMed.
- J. Kästner, Wiley Interdiscip. Rev.: Comput. Mol. Sci., 2011, 1, 932–942 Search PubMed.
- C. S. Poojari, K. C. Scherer and J. S. Hub, Nat. Commun., 2021, 12, 1–10 CrossRef PubMed.
- D. Bochicchio, E. Panizon, R. Ferrando, L. Monticelli and G. Rossi, J. Chem. Phys., 2015, 143(14) DOI:10.1063/1.4932159.
- R. M. Bhaskara, S. M. Linker, M. Vögele, J. Köfinger and G. Hummer, ACS Nano, 2017, 11, 1273–1280 CrossRef CAS PubMed.
- J. M. Warner and B. O'Shaughnessy, Phys. Rev. Lett., 2012, 108, 178101 CrossRef PubMed.
- S. Baoukina and D. P. Tieleman, Biophys. J., 2010, 99, 2134–2142 CrossRef CAS PubMed.
- E. Lavagna, D. Bochicchio, A. L. De Marco, Z. P. Güven, F. Stellacci and G. Rossi, Nanoscale, 2022, 14, 6912–6921 RSC.
Footnote |
| † Electronic supplementary information (ESI) available. See DOI: https://doi.org/10.1039/d4nr04851b |
| This journal is © The Royal Society of Chemistry 2025 |