
 Open Access Article
 This Open Access Article is licensed under a Creative Commons Attribution-Non Commercial 3.0 Unported Licence
X-ray photoelectron spectroscopy of metal oxide nanoparticles: chemical composition, oxidation state and functional group content†
Gregory P.
Lopinski
 *a,
Oltion
Kodra
b,
Filip
Kunc
a,
David C.
Kennedy
a,
Martin
Couillard
b and
Linda J.
Johnston
a
*a,
Oltion
Kodra
b,
Filip
Kunc
a,
David C.
Kennedy
a,
Martin
Couillard
b and
Linda J.
Johnston
a
aMetrology Research Centre, National Research Council Canada, Ottawa, ON K1A 0R6, Canada. E-mail: gregory.lopinski@nrc-cnrc.gc.ca
bClean Energy Innovation Research Centre, National Research Council Canada, Ottawa, ON K1A 0R6, Canada
First published on 23rd January 2025
Abstract
Surface chemistry drives the interaction of a material with its surroundings, therefore it can be used to understand and influence the fate of nanomaterials when used as functional materials or when released to the environment. Here we have used X-ray photoelectron spectroscopy (XPS) to probe the chemical composition, oxidation state and functional group content of the near surface region of four families of commercially available metal oxide nanoparticles from several different suppliers. The analyzed nanoparticles varied in size and surface functionalization (unfunctionalized vs. amine, stearic acid, and PVP-coated samples). Survey and high-resolution scans have provided information on the atomic composition of the samples, including an estimate of the stoichiometry of the metal oxide, the presence of functional groups and the identification and quantification of any impurities on the surface. The presence of significant impurities for some samples and the variation from the expected oxidation state in other cases are relevant to studies of the environmental and health impacts of these materials as well as their use in applications. The functional group content measured by XPS shows a similar trend to earlier quantitative nuclear magnetic resonance (qNMR) data for aminated samples. This indicates that XPS can be a complementary probe of surface functional group content in cases where the functional group contains a unique element not otherwise present on the nanoparticles.
1 Introduction
The importance of thorough characterization of the physical chemical properties of nanomaterials is increasingly recognized as an essential element for quality control during production, reproducible use in a variety of applications and investigations of potential environmental health and safety concerns.1 Despite the availability of validated methods that have been tested in round robin comparisons for many properties, there are still gaps in availability of standard protocols for assessing some measurands.2,3 For example, surface chemistry is widely recognized as a key parameter for assessment of nanomaterials since it is often the main factor that controls the interaction of the material with its environment, both for applications where the nanomaterial is part of a complex assembly with nano-enabled properties and in scenarios where release of the material results in localization in environmental samples or ingestion by organisms.4,5 Nanomaterial surfaces are frequently modified by adsorption or by covalent attachment of functional groups (FGs) in order to control the colloidal stability of the material, to ensure compatibility of the material with its surroundings for various applications and to allow for targeting of the material for biological applications. In addition, the surface composition may be different from the “bulk” due to the presence of surface impurities or changes in metal oxidation state at the surface.6 Thorough characterization is particularly important in the case of commercially available nanomaterials as data provided by the suppliers is not always complete and/or reliable.Detailed studies of surface chemistry are complicated by a number of factors.5 These include the wide range of compositions of the nanomaterial and possible surface modifications and impurities, the compatibility of methods with different material compositions, and the fact that some methods infer surface properties from bulk measurements while others interrogate a thin surface layer. Bulk methods include thermogravimetric analysis (TGA), which is most useful when combined with FT-IR or mass spectrometry of evolved gases to provide structural information, quantitative NMR (qNMR) in either solution or the solid state and ICP-MS of dissolved materials.7–11 Both qNMR and ICP-MS have the advantages of providing accurate and traceable measurements, information on the chemical identity of the surfaces or FGs and potentially also information on possible impurities. However they typically involve optimized extraction of surface groups or dissolution of the sample and are not surface specific, providing compositional information for the entire sample.11,12 Methods with more surface sensitivity include X-ray photoelectron spectroscopy (XPS) which provides atomic composition of the near surface region and avoids time-consuming sample preparation steps, as well as optical probe methods which give estimates of probe-accessible surface groups and conductometry which can be used to quantify acidic or basic FGs for some materials.4,8,9,13–15
Previous work from our group has used a combination of qNMR, XPS, TGA and optical probe methods to quantify surface coatings and FGs on a range of commercial silica and zinc oxide nanoparticles (NPs), providing a detailed evaluation of the relative merits and the range of applicability of the various methods.11,16,17 More recently we have carried out detailed physical chemical characterization of representative nanoparticles of four families of metal oxides prior to investigating their potential deleterious biological effects using assays to evaluate cytotoxicity and the role of reactive oxygen species.13,18,19 That work measured particle size using electron microscopy and dynamic light scattering, surface charge, specific surface area and, where relevant, qNMR measurement of surface coating or FG content. We have now completed a detailed XPS study of the same four families of commercial metal oxide nanomaterials from different suppliers and with varying sizes and surface chemistries. XPS is a valuable method for assessing the atomic composition of planar surfaces and is being increasingly applied to study the surface of nanomaterials.4,20–22 The XPS signal comes from the near surface region, with the probing depth limited by the mean free path of the photoelectrons (∼5 nm in the current work). Other advantages of this method are that it requires minimal sample preparation and is compatible with most material compositions. XPS can provide information on the metal oxidation state in the vicinity of the surface, which may differ considerably from the bulk, as well as the presence of impurities that are often related to the synthesis method or to the presence of adventitious contamination. XPS can also be used to quantify FG content, particularly for organic coatings or FGs that contain elements such as sulfur, nitrogen or halogens.
In this paper we report XPS results that examine the chemical composition and metal oxidation state for a total of 35 different CeO2, NiO, Fe2O3 and Mn2O3 nanomaterials that have been studied in earlier work. We also examine FG content for the 16 of these samples that have been modified to add a stearic acid or polymer coating or covalently modified with silane chemistry to attach an aminoalkyl functionality and correlate the results to those previously obtained by qNMR for some of the same samples. The types of metal oxide nanoparticles investigated here are currently being explored for a diverse range of applications including gas sensing, biomedicine, wastewater treatment and energy generation/storage.23–27 The surface chemical characterization of these nanoparticles provided by XPS contributes new information that is expected to help assess their suitability for these and other applications.
2 Materials and methods
2.1 Materials
Four series of bare and surface modified NiO, CeO2, Fe2O3 and Mn2O3 NPs were purchased from several commercial suppliers. A total of 33 materials, some unfunctionalized and some modified with amine, stearic acid or polyvinylpyrrolidone surface functional groups or coatings were purchased from eight suppliers (US Research Nanomaterials, mkNano, Sigma, Skyspring, American Elements, Lanxess, Nano and Amorphous Materials and Nanografi). Two additional functionalized samples were prepared in-house. In the tables, figures and discussion to follow, samples will be referred to by a sample code (i.e. Ni-01). Surface modifications are often described by abbreviations (SA = stearic acid, PVP = polyvinylpyrrolidone, NH2 = amine functionality resulting by modification with APTES (aminopropyl triethoxy silane) or another method). The set of materials and sample codes are summarized in Table 1 along with nominal particle sizes specified by the suppliers and equivalent diameters based on TEM measurements of the as-received particles. While the nominal sizes ranged from 10 to 100 nm, the TEM measurements indicated significant differences with the nominal values, typically showing smaller diameter values. For example, in the case of NiO, all the particles are in the 10–20 nm range rather than the 20–90 nm range indicated by the suppliers. The CeO2 particles range between 10 and 64 nm, whereas the Fe2O3 and Mn2O3 particles all exhibit average diameters in the 35–60 nm range. In general, the TEM measurements on these particles also indicate that the particles have rather broad size distributions as evidenced by the large standard deviations (∼25–40% of the average diameter).| Oxide/supplier | Size (nm) | Functionalization | ||||
|---|---|---|---|---|---|---|
| Nominal | TEM | None | PVP | SA | NH2 | |
| NiO | ||||||
| Skyspring | 50 | 15 ± 5 | Ni-01 | |||
| mkNano | 90 | 19 ± 8 | Ni-02 | |||
| Sigma | <50 | 12 ± 4 | Ni-03 | |||
| USRN | 18 | 21 ± 9 | Ni-04 | Ni-05 | Ni-06 | Ni-07 |
| Ni-04 NRC | ||||||
| USRN | 15–35 | 19 ± 6 | Ni-08 | |||
| CeO 2 | ||||||
| USRN | 50 | 27 ± 11 | Ce-01 | Ce-10 | ||
| USRN | 10–30 | 14 ± 5 | Ce-02 | |||
| USRN | 10 | 10 ± 2 | Ce-03 | Ce-04 | Ce-05 | Ce-09 |
| Ce-03 NRC | ||||||
| NAM | 50–105 | 20 ± 11 | Ce-06 | |||
| mkNano | 70 | 58 ± 25 | Ce-07 | |||
| mkNano | 35 | 64 ± 28 | Ce-08 | |||
| Fe 2 O 3 | ||||||
| Sigma | <50 | 35 ± 14 | Fe-01 | |||
| USRN | 30 | 34 ± 16 | Fe-02 | Fe-03 | Fe-06 | Fe-04 |
| Fe-05 | ||||||
| Lanxess | 90 | 57 ± 20 | Fe-07 | |||
| Mn 2 O 3 | ||||||
| USRN | 30 | 53 ± 17 | Mn-01 | Mn-02 | Mn-03 | Mn-04 |
| USRN | <100 | 47 ± 13 | Mn-05 | |||
| mkNano | 50 | 41 ± 17 | Mn-06 | |||
| Am. Element | <100 | 37 ± 14 | Mn-07 | |||
| Nanografi | 28 | 37 ± 15 | Mn-08 | |||
2.2 X-ray photoelectron spectroscopy
XPS was carried out using an Axis Ultra DLD spectrometer (Kratos Analytical, Manchester, UK) with monochromated Al Kα X-rays. The angle between the source and the spectrometer is 60°. As-received dry metal oxide nanopowders were mounted directly on the sample holder with adhesive tape and transferred into the XPS system. For measurements the samples were oriented normal to the spectrometer resulting in a take-off angle of 90°. Three distinct areas (300 × 700 μm) were measured on each sample. Survey spectra were first obtained in order to estimate the relative atomic composition of the sample and detect any impurities that may be present. High resolution (HR) spectra were subsequently acquired in regions corresponding to the strongest core level transitions for the major elements present on these samples. These HR scans were used for more accurate quantification of the major elements present with the detailed structure of the peaks also providing additional information on the chemical state of the elements. The spectrometer pass energy was set at 80 eV for the survey spectra and 20 eV for the HR scans. A charge neutralizer was employed to compensate for sample charging. The energy scale for all spectra was referenced by calculating the offset required to shift the main peak in the C 1s region to 284.8 eV and applying the same shift to the other spectra taken at the same point. Although the drawbacks of referencing spectra to the C 1s peak in this manner have been discussed,28,29 a recent review of a large experimental data set has shown that this method, when judiciously applied, can yield consistent results to an accuracy of ±0.2 eV.30 Data analysis was carried out with the CasaXPS software (Casa Software, Teignmouth, UK). The atomic compositions were obtained using the area under each peak after subtracting Shirley or linear backgrounds and applying Kratos relative sensitivity factors. Decomposition of the HR spectra into various components was carried out using mixed Gaussian–Lorentzian (GL30) lineshapes.Each sample was measured at three distinct points for both survey and HR scans, reporting both the average atomic composition and the associated standard deviation. This standard deviation generally reflects the homogeneity of the sample, with several other factors making larger contributions to the total uncertainty associated with quantitative determination of sample composition using XPS data.31 Measurement of the integrated peak intensities, background subtraction, transmission function corrections and use of relative sensitivity factors all contribute to the uncertainty budget. An interlab comparison using XPS to measure the composition of core–shell nanoparticles found agreement between multiple labs to within ∼10%.32
3 Results and discussion
XPS spectra were measured for all the samples summarized in Table 1. These same samples have been examined in previous studies that were directed at investigating several families of metal oxide nanomaterials for which extensive physical chemical characterization of their properties was obtained for correlation with biological assays that were aimed at understanding potential cytotoxicity, generation of reactive oxygen species and activation of apoptotic or immune response pathways.13,18,19 The selection of multiple samples of each metal oxide was intended to probe similarities and differences related to supplier, size and surface chemistry and to provide some of the data necessary for development of a regulatory framework for nanomaterial use within Canada. The physical chemical characterization consisted of size and specific surface area measurements by TEM and BET, respectively, dispersion and measurement of size and charge in solution by dynamic light scattering and zeta potential and characterization of surface functional groups by qNMR and TGA. It is important to note that detailed characterization is essential to ensure that one understands the material properties and can make comparisons with literature data for biological assays. It is also common to purchase commercial nanomaterials for use in biological assays without measuring their physical chemical properties which is essential to determine whether comparable materials are examined in various studies. As seen in Table 1, the TEM measurements indicate that the nominal values for size provided by the supplier were frequently different from values measured in our experiments. This generally had the effect of narrowing the range of sizes that were examined. It should be noted that, apart from the Mn2O3 samples, the agreement of our in-house measurements with the supplier data was reasonably good for the functionalized samples (and a bare sample of the same size) purchased from USRN. The size of the nanoparticles is potentially relevant to the quantitative interpretation of the XPS measurements. However, as the diameter of even the smallest (∼10 nm diameter) particles studied here are larger than the effective probing depth (3× the inelastic mean free path of the photoelectrons), curvature and other size effects are not expected to play a significant role.20Although XPS was not employed in the initial studies it became obvious that a consideration of the impurity content in the materials and the metal oxidation state were potentially important factors. XPS is also capable of assessing the surface functional groups directly on as received materials in powder form. Our previous work had indicated that qNMR is superior to TGA for measurement of total functional group content, providing adequate sensitivity, the ability to conclusively identify functional groups and the potential for traceable measurements with metrological rigor.33 TGA is generally only a semi-quantitative method and, unless combined with FTIR or mass spec measurements, often fails to elucidate the surface composition. However, qNMR does require removal of groups from the surface prior to analysis. The capability of XPS to measure dry powder samples directly, while providing quantitative information on the presence of impurities, metal oxidation state and surface composition, makes this technique an attractive addition to the surface chemistry tool box.
The XPS results are discussed in three different sections below. First, we discuss information obtained regarding the chemical composition for each of the four types of metal oxide nanomaterials. Then, we summarize what has been learned about the metal oxidation state in these materials. Finally, we compare XPS assessment of the functional group content on these particles with previous results obtained by qNMR.
3.1 Chemical composition
 | ||
| Fig. 1 Survey spectra for commercial samples of unmodified NiO nanoparticles from four different suppliers. The energy region between 520 and 130 eV is magnified at right to show the peaks assigned to various impurities present on the different samples. | ||
The atomic composition of all the NiO NPs derived from the XPS survey scans is summarized in Table 2. The TEM measured average diameters indicate that all the particles were in the 10–20 nm size range, with standard deviations ranging from 25 to 70% of the average. As expected, for the bare particles, Ni and O are the primary elements present making up 83 to 93 atomic% of the sample as probed by XPS. The standard deviation of the three measurements at different spots on each sample is typically less than 1%, indicating that the samples are fairly homogeneous. As discussed above, the uncertainties in atomic compositions extracted from measured XPS intensities are considerably greater and typically on the order of 10%. A significant amount of carbon is observed on all the samples, with the unmodified samples exhibiting carbon content of between 5 and 10% (C/Ni ratios of 0.1–0.24) due to adventitious contamination from handling in air and/or residual hydrocarbons left over from the nanoparticle synthesis. In addition to C, the other impurities observed in Fig. 1 are quantified in Table 2. Ni-01 shows a substantial amount of Mn (6.7%) and a smaller amount of Bi (0.6%), both of which have been detected by ICP-MS measurements of the bulk composition for this sample.19 Ni-04 and the related modified samples all show the presence of Br, while all five unmodified samples show small amounts (<0.7%) of Cl. A small amount of Na was detected on Ni-02.
| Diameter | Ni 2p | O 1s | C 1s | N 1s | Si 2p | Br 3p | Cl 2p | Mn 3p | Bi 4f | Na 1s | Ni/O | C/Ni | |
|---|---|---|---|---|---|---|---|---|---|---|---|---|---|
| Ni-01 Skyspring, bare | 15 ± 5 nm | 39.8 | 43.2 | 9.3 | 0.3 | 6.7 | 0.6 | 0.92 | 0.24 | ||||
| 0.6 | 0.8 | 0.6 | 0.1 | 0.2 | 0.04 | 0.03 | 0.02 | ||||||
| Ni-02 mkNano, bare | 19 ± 8 nm | 52.2 | 40.0 | 6.7 | 0.4 | 0.7 | 1.30 | 0.13 | |||||
| 1.0 | 0.5 | 0.5 | 0.04 | 0.1 | 0.04 | 0.01 | |||||||
| Ni-03 Sigma, bare | 12 ± 4 nm | 54.5 | 39.2 | 5.7 | 0.7 | 1.39 | 0.10 | ||||||
| 0.7 | 0.4 | 0.4 | 0.04 | 0.03 | 0.01 | ||||||||
| Ni-04 USRN, bare | 21 ± 9 nm | 49.9 | 37.9 | 9.5 | 0.3 | 2.2 | 0.2 | 1.32 | 0.19 | ||||
| 0.7 | 0.2 | 0.6 | 0.1 | 0.2 | 0.04 | 0.02 | 0.02 | ||||||
| Ni-04-NRC USRN, PVP@NRC | nd | 30.2 | 33.0 | 31.5 | 3.4 | 1.7 | 0.92 | 1.04 | |||||
| 0.8 | 1.4 | 1.5 | 0.4 | 0.1 | 0.04 | 0.07 | |||||||
| Ni-05 USRN, PVP | 17 ± 12 nm | 48.8 | 38.0 | 10.7 | 0.5 | 2.0. | 1.28 | 0.22 | |||||
| 1.0 | 0.5 | 0.6 | 0.04 | 0.04 | 0.04 | 0.02 | |||||||
| Ni-06 USRN, SA | 14 ± 6 nm | 15.6 | 22.0 | 61.4 | 1.1 | 0.71 | 3.96 | ||||||
| 1.1 | 0.2 | 0.9 | 0.05 | 0.06 | 0.32 | ||||||||
| Ni-07 USRN, APTES | 21 ± 14 nm | 20.5 | 35.4 | 30.8 | 6.1 | 1.9 | 0.58 | 1.52 | |||||
| 1.7 | 0.5 | 1.2 | 0.1 | 0.1 | 0.05 | 0.20 | |||||||
| Ni-08 USRN, bare | 19 ± 6 nm | 50.8 | 42.1 | 6.7 | 5.3 | 0.4 | 1.21 | 0.13 | |||||
| 0.3 | 0.4 | 0.3 | 0.6 | 0.05 | 0.01 | 0.01 |
On three of the four functionalized samples, the carbon atomic fraction increases significantly to 30–60%, with corresponding C/Ni ratios from 1 to 4. The increase in C/Ni ratio is expected for the modified samples due to the carbon associated with the APTES, SA and PVP coatings as well as a decreased Ni 2p signal due to attenuation by the coatings. In contrast, the Ni-05 PVP modified particles exhibit a carbon content (and C/Ni ratio) similar to that of the bare USRN sample of the same size (Ni-04) and only a small increase in nitrogen content, both of which indicate only a minimal PVP coating. On the other hand, the in-house PVP-modified sample (Ni-04-NRC, prepared from the bare USRN Ni-04 particles) exhibits three times more carbon than the USRN PVP sample (Ni-05) and a seven-fold increase in nitrogen content, consistent with a substantial PVP coating. The APTES modified sample shows substantially larger N 1s and Si 2p signals than the corresponding bare sample, as expected for amino-silane modification. The SA-coated NPs (Ni-06) exhibit a large increase in the C 1s fraction as well as a decrease in the Ni 2p signal, consistent with a substantial amount of functionalization. We note that the TEM size measurements for all the functionalized particles show no significant size increase due to the coating which is not surprising given the large distribution of diameters coupled with the fact that the functionalization layers are only expected to be 1–2 nm thick.
High resolution (HR) scans of the Ni 2p, O 1s, C 1s and N 1s regions were also recorded for all the NiO samples, with an additional scan of the Si 2p region for the APTES functionalized sample Ni-07. Atomic compositions derived from this data are summarized in Table S1† and are in reasonable agreement with those obtained from the survey scans with a few systematic differences. In comparing the atomic compositions from HR and survey data it is important to note that the contributions of impurities are ignored in the HR data although this is typically a small effect in most samples, as the total impurity content is usually less than a few percent. In general, the higher density of points in the HR scans (points every 0.1 eV as compared to every 1 eV in the survey scans) results in a better estimate of the background and a more accurate determination of the peak area. Comparing the data in Tables 2 and S1,† the HR data systematically yields lower relative values for the Ni 2p signal suggesting that the Shirley background fits to the survey scans typically lead to overestimation of the Ni fraction. The HR data allow the background to be fit more accurately, with the bare particles exhibiting Ni/O ratios of 0.74 for Ni-01 and ranging from 1 to 1.16 for the other four bare NiO particles. The lower value for Ni-01 is likely associated with the significant Mn contamination (likely in the form of MnOx based on the energy of the Mn core levels) on this sample. Apart from Ni-01 the Ni/O ratios are in reasonable agreement with the expected value of 1 based on the stoichiometry of NiO, considering the uncertainties in extracting relative compositions from XPS data. The HR data also improves the ability to quantify the N 1s signal. Two of the bare samples, Ni-03 and Ni-04 show N 1s levels just above the detection limit (0.1–0.2%) whereas the Ni-05 PVP sample shows a significantly larger, but still small (0.8%) signal. As observed in the survey scan data, the HR data for the NRC-prepared PVP sample (Ni-04-NRC) shows considerably larger N and C signals which are consistent with a good level of PVP modification (4.6× that of Ni-05). Ni-07, an APTES modified sample, showed an even larger N signal as well as a significant Si 2p signal. The measured Si/N ratio from the HR data is 1, as expected for an APTES functionalized sample which should have one Si atom for every N atom.
Examination of high-resolution spectra provides additional insight into the chemical composition of the samples as seen in Fig. 2, showing the C 1s and O 1s regions for four different unmodified NiO particles. As these particles have not been intentionally modified the features in the C 1s region are attributed to residual hydrocarbons from the synthesis process or resulting from exposure to the lab air. Interestingly the shape of the C 1s spectrum is similar for the four particles, and can be fit with three peaks at 284.8, 285.8 and 288.3 eV which are attributed to C–C, C–O and O![[double bond, length as m-dash]](https://www.rsc.org/images/entities/char_e001.gif) C–O species respectively.34 Fractions of these three species differ somewhat in the four samples but the C–C always dominates (65–80%), with smaller amounts of C–O (5–20%) and OC–O (10–15%) species. This implies that this adventitious contamination contributes an oxygen signal of ∼25–35% of the carbon fraction present on the particles. As the carbon fractions on the unmodified particles are <10% this means the oxygen fractions associated with the contamination are < 3%, much smaller than the total oxygen fraction observed on these samples (38–43%). The O 1s region, also shown in Fig. 2, is rather similar for all the unmodified samples exhibiting two peaks. Based on previous work for NiO nanoparticles, the stronger peak is attributed to the lattice oxygen within the metal oxide particles while the weaker feature can be assigned to hydroxyl groups on the surface.35 While for samples Ni-01 and Ni-04 the lattice oxygen peak is observed at 529.5 eV, as previously reported for NiO, this peak is observed to shift to 529.2 eV on Ni-02 and Ni-03. Blume et al.36 have identified an additional O 1s peak at 528.9 eV which they assign to oxygen vacancies in NiO1−x so this shift to lower binding energy may be due to an increase in oxygen vacancies in these two samples.
C–O species respectively.34 Fractions of these three species differ somewhat in the four samples but the C–C always dominates (65–80%), with smaller amounts of C–O (5–20%) and OC–O (10–15%) species. This implies that this adventitious contamination contributes an oxygen signal of ∼25–35% of the carbon fraction present on the particles. As the carbon fractions on the unmodified particles are <10% this means the oxygen fractions associated with the contamination are < 3%, much smaller than the total oxygen fraction observed on these samples (38–43%). The O 1s region, also shown in Fig. 2, is rather similar for all the unmodified samples exhibiting two peaks. Based on previous work for NiO nanoparticles, the stronger peak is attributed to the lattice oxygen within the metal oxide particles while the weaker feature can be assigned to hydroxyl groups on the surface.35 While for samples Ni-01 and Ni-04 the lattice oxygen peak is observed at 529.5 eV, as previously reported for NiO, this peak is observed to shift to 529.2 eV on Ni-02 and Ni-03. Blume et al.36 have identified an additional O 1s peak at 528.9 eV which they assign to oxygen vacancies in NiO1−x so this shift to lower binding energy may be due to an increase in oxygen vacancies in these two samples.
 | ||
| Fig. 2 High resolution spectra of the C 1s and O 1s regions for four unmodified NiO nanoparticle samples. Fits to the Ni-01 spectra are shown by the solid grey (components) and black (sum) lines. | ||
An interesting observation from both the survey scan and HR data (Tables 2 and S1†) is that the Ni/O ratio decreases for modified NPs. There appears to be an inverse correlation between the Ni/O ratio and the carbon content. Fig. 3 illustrates this correlation by plotting the Ni 2p and O 1s signals as a function of the C 1 s signal for the eight NiO samples. For samples with a low amount of carbon, the Ni and O fractions are approximately similar, as expected for NiO, but as the carbon fraction increases the Ni 2p signal is seen to decline faster than that of the O 1 s, leading to a decrease in the measured Ni/O ratio. This is consistent with the majority of the carbon residing on the surface of the particles and attenuating both the Ni and O signals from the particles, with the faster decrease of the Ni signal arising from the shorter inelastic mean free path of the lower kinetic energy Ni 2p photoelectrons as compared with the higher kinetic energy O 1s electrons. The data points indicated in the figure that are furthest from the linear trend line are cases in which there is a significant quantity of elements other than carbon (Mn in the case of Ni-01 and N and Si for Ni-07) on the surface of the particles that acts to attenuate the Ni and O photoelectrons.
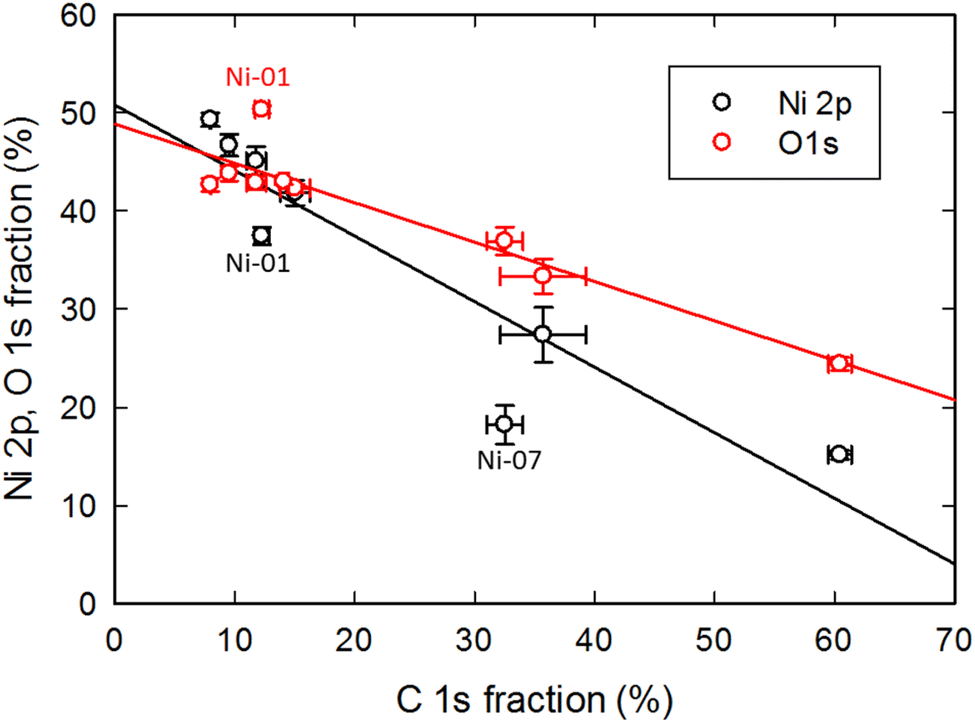 | ||
| Fig. 3 Correlation of Ni 2p and O 1s signal intensities with the C 1s signal (based on the HR data) for the eight NiO samples. Outlier points are labelled and discussed in the text. | ||
| Diameter | Fe 2p | O 1s | C 1s | N 1s | Si 2s | Cl 2p | Na 1s | Mg KLL | Ca 2p | Fe/O | C/Fe | |
|---|---|---|---|---|---|---|---|---|---|---|---|---|
| Fe-01 Sigma, bare | 35 ± 14 nm | 35.9 | 46.6 | 17.3 | 0.3 | 0.77 | 0.48 | |||||
| 0.7 | 1.0 | 0.7 | 0.04 | 0.03 | 0.02 | |||||||
| Fe-02 USRN, bare | 34 ± 16 nm | 32.8 | 47.2 | 17.3 | 0.4 | 1.4 | 0.6 | 0.4 | 0.69 | 0.53 | ||
| 0.4 | 0.1 | 0.4 | 0.1 | 0.02 | 0.1 | 0.01 | 0.01 | 0.02 | ||||
| Fe-03 USRN, PVP | 28 ± 8 nm | 31.2 | 47.4 | 19.3 | 0.4 | 0.7 | 0.6 | 0.3 | 0.66 | 0.62 | ||
| 0.4 | 0.4 | 0.7 | 0.1 | 0.1 | 0.02 | 0.02 | 0.01 | 0.03 | ||||
| Fe-04 USRN, NH2 | 27 ± 6 nm | 33.6 | 49.7 | 13.6 | 0.7 | 0.4 | 1.0 | 0.6 | 0.3 | 0.68 | 0.39 | |
| 0.6 | 0.7 | 1.2 | 0.1 | 0.2 | 0.1 | 0.1 | 0.02 | 0.004 | 0.04 | |||
| Fe-05 USRN, APTES | 26 ± 6 nm | 28.6 | 47.8 | 16.7 | 2.3 | 2.4 | 0.4 | 0.8 | 0.6 | 0.4 | 0.60 | 0.58 |
| 0.5 | 0.6 | 0.6 | 0.3 | 0.2 | 0.1 | 0.04 | 0.1 | 0.1 | 0.02 | 0.02 | ||
| Fe-06 USRN, SA | 24 ± 5 nm | 11.1 | 31.0 | 57.2 | 0.6 | 0.2 | 0.36 | 5.17 | ||||
| 0.1 | 0.8 | 0.9 | 0.03 | 0.05 | 0.01 | 0.14 | ||||||
| Fe-07 Lanxess | 57 ± 20 nm | 19.4 | 57.8 | 12.4 | 10.3 | 0.34 | 0.68 | |||||
| 0.7 | 0.8 | 1.3 | 0.6 | 0.01 | 0.08 |
High resolution spectra of all Fe2O3 samples were also recorded and the resulting atomic composition data summarized in Table S2.† There is good agreement between the atomic compositions obtained from survey and HR data with the differences smaller than observed for the NiO samples. For the PVP modified sample (Fe-03), the improved S/N in the HR scans allows a small peak in N 1s region to be detected, corresponding to 0.3 ± 0.1% atomic composition. This level is barely above the noise and indicative of only a small amount of PVP being detected. The measured Fe/O ratio is slightly higher from the HR scans (∼0.8 for the unmodified particles), but still close to the expected value of 0.66 for Fe2O3. As observed for the NiO particles, this ratio decreases for modified particles, attributed to greater attenuation of the Fe 2p signal compared to the O 1s due to the surface modification, as discussed for the NiO samples. This decrease in Fe/O ratio is particularly significant for the SA modified (Fe-06) and Lanxess (Fe-07) samples.
Additional insight into the chemical composition of some of these Fe2O3 particles is obtained by looking at the HR spectra of the O 1s region shown in Fig. 4. For Fe-01, the O 1s peak can be fit with two components a sharp peak centered at 529.9 eV and a broader weaker peak at 531.4 eV, consistent with previous observations for Fe2O3.37 As for NiO, the two peaks are assigned to lattice oxygen in the bulk of the particles and hydroxyl groups on the surface, respectively. For Fe-02, the basic peak structure is the same but the lattice oxygen peak is shifted to 529.4 eV. Fe-07 exhibits different structure in the O 1s region that can be fit with four peaks at 529.9, 530.5, 532.4 and 533.6 eV. The two higher binding energy features were not observed on the other Fe oxide particles and coincide with the expected energy of the O 1s in SiO2 (532.4 eV) and for adsorbed water (533–534 eV). The Si 2p peak in this sample is observed at 103.2 as in SiO2. This strongly suggests the Fe-07 particles are coated with a silica shell, which also accounts for the strong attenuation of the Fe signal observed on this sample. The other possibility for the presence of Si in these particles is that they consist of fayalite (Fe2SiO4). However, the Si 2p and O 1s binding energies in fayalite have been reported as 102 eV and 531.1 eV, respectively38 inconsistent with the peak positions observed here. TEM imaging of Fe-07 (see Fig. S2†) does not show any definitive evidence for the presence of a silica shell on these particles, but the presence of a thin (∼1 nm) shell cannot be ruled out. An EDX scan of the particles (also shown in Fig. S2†) shows the presence of Fe, O and C but no Si. Although EDX has good lateral spatial resolution, it probes the entire depth of the particles, effectively probing the “bulk” composition. Therefore, if the particles consisted of fayalite, the significant amount of Si (∼14%) expected based on the stoichiometry would be easily detected. However, if the observed Si signal comes from a thin ∼1 nm shell surrounding the particles it is likely too weak to be detected in EDX. Therefore, the electron microscopy data for Fe-07 is also consistent with the presence of a nm thick silica shell coating a Fe2O3 core.
 | ||
| Fig. 4 High resolution spectra of the O 1s region for three different Fe2O3 nanoparticle samples. Fits are shown by the solid grey lines with the overall fit shown by the solid black, blue and red lines. | ||
HR spectra of the C 1s and O 1s regions are also expected to provide insight into the chemical composition for the other modified Fe2O3 particles. While changes associated with the different modifications are observed in the C 1s spectra (as shown in Fig. S3†), the presence of adventitious carbon contamination observed on all the particles complicates the interpretation of these changes. In contrast the O 1s region for all the modified samples is very similar to that of the bare samples as the strong oxygen signal from the Fe2O3 particles dominates the spectra.
O species which also give rise to a C 1s feature in this range.34 As discussed above for NiO particles, most of the unmodified metal oxide samples studied here show a feature in this region due to adventitious carbon contamination, although it is typically less than 15% of the total carbon signal. All of the CeO2 samples (apart from the SA modified Ce-05) also contained halogen impurities, eight with Cl and three with F. Interestingly, the NAM sample (Ce-06) stands out with a large amount of P (>9%) along with some Na (∼2%) impurities. The P 2p peak is observed at ∼133 eV, consistent with the P being bound to oxygen. The carbon content is seen to increase for all the modified samples, with particularly large increases observed for the SA coated particles (Ce-05 and Ce-03 NRC). Significant Si and N fractions were observed for the APTES modified sample, Ce-09. As for the other PVP-coated metal oxide NPs, N was not detected in the survey scans of either of the two USRN PVP-coated samples (Ce-04 or Ce-10).
| Diameter | Ce 3d | O 1s | C 1s | N 1s | Si 2s | Cl 2p | F 1s | P 2s | Na 1s | Ce/O | C/Ce | |
|---|---|---|---|---|---|---|---|---|---|---|---|---|
| Ce-01 USRN, bare | 27 ± 11 nm | 30.1 | 55.8 | 12.2 | 1.9 | 0.54 | 0.41 | |||||
| 1.8 | 0.6 | 1.4 | 0.2 | 0.04 | 0.07 | |||||||
| Ce-02 USRN, bare | 14 ± 5 nm | 29.4 | 49.3 | 18.9 | 2.5 | 0.60 | 0.64 | |||||
| 0.8 | 1.1 | 1.6 | 0.04 | 0.02 | 0.07 | |||||||
| Ce-03 USRN, bare | 10 ± 2 nm | 36.3 | 55.0 | 6.2 | 0.2 | 2.3 | 0.66 | 0.17 | ||||
| 0.2 | 0.3 | 0.3 | 0.1 | 0.3 | 0.003 | 0.01 | ||||||
| Ce-03-NRC USRN, SA@NRC | nd | 10.2 | 24.6 | 65.2 | 0.41 | 6.38 | ||||||
| 0.3 | 0.2 | 0.5 | 0.01 | 0.22 | ||||||||
| Ce-04 USRN, PVP | 10 ± 2 nm | 33.2 | 54.3 | 9.6 | 0.3 | 2.6 | 0.61 | 0.29 | ||||
| 0.6 | 0.7 | 0.7 | 0.03 | 0.1 | 0.02 | 0.02 | ||||||
| Ce-05 USRN, SA | nd | 20.3 | 42.9 | 36.6 | 0.3 | 0.47 | 1.81 | |||||
| 0.6 | 1.2 | 1.7 | 0.1 | 0.01 | 0.14 | |||||||
| Ce-06 NAM, bare | 20 ± 11 nm | 22.4 | 53.5 | 12.6 | 9.1 | 2.4 | 0.42 | 0.56 | ||||
| 0.3 | 0.4 | 0.6 | 0.3 | 0.3 | 0.01 | 0.02 | ||||||
| Ce-07 mkNano, bare | 58 ± 25 nm | 26.2 | 51.3 | 20.9 | 0.2 | 1.4 | 0.51 | 0.80 | ||||
| 0.9 | 0.5 | 0.9 | 0.1 | 0.3 | 0.02 | 0.06 | ||||||
| Ce-08 mkNano, bare | 64 ± 28 nm | 32.1 | 55.7 | 8.3 | 2.5 | 1.4 | 0.58 | 0.26 | ||||
| 0.4 | 0.4 | 0.3 | 0.2 | 0.3 | 0.02 | 0.01 | ||||||
| Ce-09 USRN, APTES | nd | 15.5 | 43.3 | 25.0 | 6.9 | 8.3 | 1.0 | 0.36 | 1.61 | |||
| 0.4 | 0.9 | 1.3 | 0.5 | 0.7 | 0.2 | 0.01 | 0.09 | |||||
| Ce-10 USRN, PVP | nd | 29.8 | 55.3 | 13.5 | 1.5 | 0.54 | 0.45 | |||||
| 1.1 | 1.7 | 2.3 | 0.2 | 0.02 | 0.09 |
Atomic compositions derived from the HR scans for the CeO2 oxide samples (summarized in Table S3†) are in general agreement with the survey data, although there are significant differences on some samples, primarily due to the better ability to separate C 1s and Ce 4s contributions in the HR scans. The C/Ce ratios are generally higher in the HR data, except for Ce-03-NRC, indicating that the attempts to exclude the contributions of the Ce 4s peak to the C 1s region in the survey scans led to underestimating the C fraction. The Ce/O ratios are slightly lower based on the HR data, ranging from 0.39–0.53 for all but one of the unmodified samples, in agreement with the expected value of 0.5 for CeO2. Ce-06 exhibits a lower Ce/O ratio of 0.31, probably as a result of the phosphate contamination. On the modified samples the Ce/O ratio is observed to decrease to 0.28–0.4, consistent with the Ce 3d electrons suffering greater attenuation due to a shorter mean free path relative to O 1s electrons, as discussed above for Ni and Fe oxides. As for the Ni and Fe oxides the Ce 3d and O 1s fractions decrease linearly with the C 1s signal (see Fig. S4†). Interestingly, HR scans of the N 1s region show a small level of nitrogen signal for Ce-04 and Ce-10 that was not detected in the survey scans, consistent with a small amount of PVP functionalization.
| Diameter | Mn 2p | O 1s | C 1s | Si 2p | N 1s | Cl 2p | Mn/O | C/Mn | |
|---|---|---|---|---|---|---|---|---|---|
| Mn-01 USRN, bare | 53 ± 17 nm | 22.0 | 42.0 | 35.8 | 0.2 | 0.52 | 1.63 | ||
| 0.3 | 0.4 | 0.7 | 0.1 | 0.01 | 0.05 | ||||
| Mn-02 USRN, PVP | 54 ± 17 nm | 21.7 | 41.8 | 36.3 | 0.2 | 0.52 | 1.67 | ||
| 0.1 | 0.3 | 0.2 | 0.1 | 0.01 | 0.00 | ||||
| Mn-03 USRN, SA | 56 ± 27 nm | 14.7 | 26.8 | 58.5 | 0.55 | 3.98 | |||
| 0.4 | 0.3 | 0.6 | 0.01 | 0.15 | |||||
| Mn-04 USRN, APTES | 49 ± 21 nm | 20.2 | 43.2 | 34.3 | 1.1 | 1.0 | 0.3 | 0.47 | 1.71 |
| 1.1 | 0.9 | 2.0 | 0.0 | 0.1 | 0.04 | 0.02 | 0.19 | ||
| Mn-05 | 47 ± 13 nm | 23.3 | 43.1 | 33.5 | 0.2 | 0.54 | 1.44 | ||
| USRN, bare | 0.5 | 0.8 | 1.2 | 0.1 | 0.01 | 0.08 | |||
| Mn-06 | 41 ± 17 nm | 21.5 | 42.1 | 36.0 | 0.4 | 0.51 | 1.68 | ||
| mKNano, bare | 0.4 | 0.3 | 0.7 | 0.04 | 0.01 | 0.06 | |||
| Mn-07 | 37 ± 14 nm | 20.3 | 40.4 | 39.0 | 0.3 | 0.50 | 1.95 | ||
| Am. Elem., bare | 2.2 | 1.8 | 4.0 | 0.05 | 0.03 | 0.39 | |||
| Mn-08 | 37 ± 15 nm | 25.9 | 46.0 | 28.1 | 0.56 | 1.09 | |||
| Nanografi, bare | 1.0 | 0.2 | 1.1 | 0.02 | 0.09 |
Atomic compositions based on HR data (Table S4†) are in reasonable agreement with that from the survey scans. The Mn and O contents are slightly lower than from the survey data while the C fractions are somewhat higher. The Mn/O ratios are between 0.44 and 0.53, all smaller than the expected value of 0.66 for Mn2O3. This is likely due to the presence of additional oxygen associated with the high level of adventitious carbon contamination observed on these samples. The unmodified sample with the lowest level of carbon (Mn-08) exhibits the highest Mn/O ratio, consistent with this explanation.
Fig. 5 shows high resolution scans of the C 1s region for the unmodified USRN sample (Mn-01) along with two modified samples of the same size from the same supplier. The C 1s spectrum for Mn-01 is similar to that observed on the other unmodified metal oxide NPs. As for the NiO samples discussed above, the majority of the C 1s signal (∼78%) is assigned to aliphatic carbon, while the features at 286 eV and 288.5 eV arise from C–O (14%) and O–CO (8%) species respectively. For Mn-01 which exhibits a carbon content of ∼40% this suggests that ∼12% of the ∼39% oxygen fraction on this sample originates from the hydrocarbon contamination layer and not from the metal oxide particles. Reducing the oxygen fraction by removing the contribution from this contamination, yields a revised Mn/O ratio of ∼0.7, much closer to the expected value for Mn2O3. The C 1s region for Mn-03 and Mn-04 samples in Fig. 5 shows changes that can be attributed to the modifications. For the SA modified particles (Mn-03) the C–C feature is a greater fraction of the total signal (89%) with smaller amounts in the C–O (7%) and O–CO (4%) components, consistent with the presence of a long chain hydrocarbon. Note that for stearic acid the ratio of O–CO to C–C species should be 0.058, quite close to the 0.05 which is observed here. For the APTES modified sample (Mn-04) the feature at 286 eV is more prominent (24%) than in the other two samples. This feature can be attributed to both C–N (from the terminal amine) and C–O (from unhydrolyzed ethoxy groups) on APTES. This shows that even in samples with substantial amounts of adventitious carbon contamination, it is possible to observe differences due to surface modifications in HR spectra of the C 1s region.
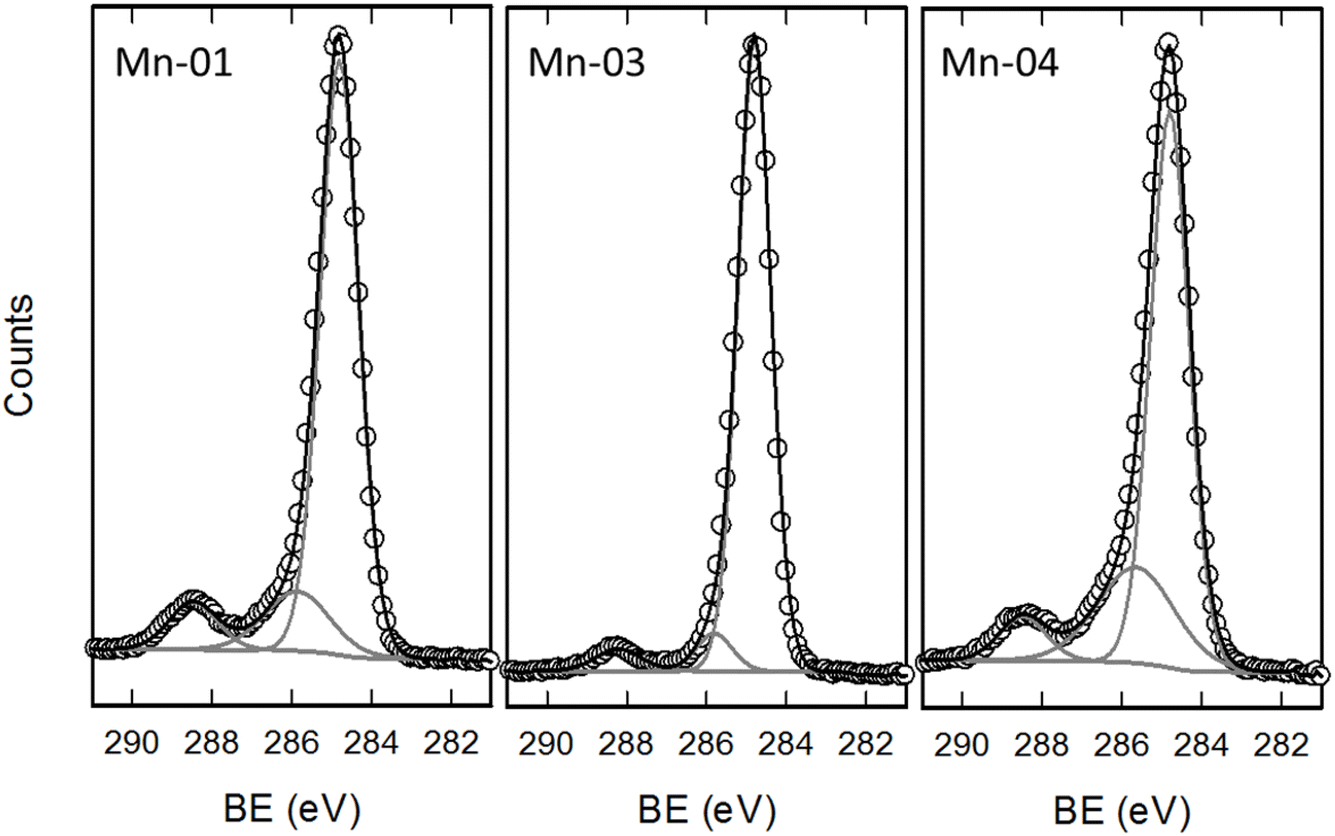 | ||
| Fig. 5 High resolution spectra of the C 1s region for three Mn2O3 samples. Fits are shown by the solid grey (components) and black (sum) lines. | ||
3.2 Oxidation state
The metal oxidation state plays an important role in the reactivity of metal oxide nanoparticles and their use in a variety of applications. While the oxidation state is generally determined by the metal/oxygen ratio, the stoichiometry (and hence the oxidation state) in the near surface region can differ from that in the bulk. While XPS data facilitates determination of the metal/oxygen ratio in the near surface region (the first ∼5 nm of material), the measured values can differ from the expected bulk stoichiometry due to attenuation effects of contaminants and functional layers, as well as additional oxygen contributions from these layers. Together with the inherent uncertainty of ∼10–15% for chemical compositions determined by XPS this means that the composition data alone is often insufficient to distinguish between closely related compositions (i.e. Mn2O3 with Mn/O = 0.66 as compared to MnO2 with Mn/O = 0.5). However, XPS can also provide direct information on the metal oxidation state in these particles through analysis of the detailed structure of selected metal core level emission features. While some studies attempt to assign and quantify oxidation states by associating each state with a single peak at a specific binding energy this approach has been shown to be invalid for all of the transition metals investigated here.37,40,41 Instead, in addition to spin–orbit splitting, the full extended multiplet, shake-up and plasmon loss structures for each oxidation state must be taken into account, recognizing that each oxidation state typically gives rise to multiple features in the experimental spectrum.For the NiO particles, high resolution scans of the Ni 2p region were examined in order to investigate potential variations in oxidation state. The Ni 2p emission envelope for the unmodified NiO particles is shown in Fig. 6 to exhibit a rather complex structure with multiple features visible. The envelope can be split into two parts associated with the two spin–orbit components. As seen in this figure the 2p3/2 segment can be fit with five peaks, following the approach of Biesinger et al.42 with the fitting parameters obtained here similar to parameters used for bulk NiO standard samples (see Table S5†). This is consistent with the nickel being primarily in the +2 oxidation state. While the fit is only shown for Ni-01, the other unmodified NiO samples exhibit the same structure, indicating the same oxidation state. No significant changes in this structure (see Fig. S5†) or required fitting parameters are observed for the modified particles, indicating that the various modifications do not appear to change the oxidation state.
 | ||
| Fig. 6 High resolution spectra of Ni 2p region for four unmodified NiO samples. Fits for Ni-01 are shown by the solid grey (components) and black (sum) lines. | ||
For the iron oxide nanoparticles the two unmodified (Fe-01 and Fe-02) and the silica coated Fe-07, all exhibit Fe 2p envelopes with a similar structure as shown in Fig. 7, with two main spin–orbit (2p1/2 and 2p3/2) peaks along with three additional less intense satellite features. Fitting the Fe 2p3/2 peak with multiplet components and comparing with similar fits to appropriate reference samples from the literature37 indicates these spectra are consistent with the expected stoichiometry of Fe2O3 in which the iron is present as Fe3+ (see Table S6†). The presence of the satellite feature at 719 eV (Sat I) is also indicative of Fe3+. Although the three spectra are quite similar, the 2p1/2 and 2p3/2 peaks and the Sat I feature for Fe-02 exhibit a slight shift to lower binding energy, suggesting the possible presence of a small amount of Fe2+ in this sample. Note that if Fe-07 contained fayalite the Fe would primarily be in the +2 oxidation state, inconsistent with spectrum and the fits for this sample, providing further evidence that this sample consists of silica coated Fe2O3 particles, as previously concluded.
 | ||
| Fig. 7 High resolution spectra of Fe 2p region after Shirley background subtraction for three Fe2O3 nanomaterials. | ||
For CeO2 particles, the Ce 3d envelope is quite complex with six peaks clearly resolved and additional features appearing as shoulders as seen in Fig. 8 which depicts Ce 3d spectra for two samples of unmodified NPs. The spectrum observed for Ce-01 is characteristic of samples which are primarily Ce4+,43,44 as expected for CeO2. All of the Ce samples studied here exhibit similar spectra to that of Ce-01 (upper figure), with the exception of Ce-06 (lower figure) in which the relative intensities of the various features are quite different. For cerium oxide samples, the presence of relatively distinct, non-overlapping features facilitates fitting XPS spectra in order to determine the Ce oxidation state as reviewed recently.43 For samples containing a mixture of Ce4+ and Ce3+, spectra can be fit with 10 peaks with six peaks from Ce4+ and four peaks corresponding to Ce3+. It is necessary to constrain the fitting parameters to reflect the physical origin and relationships between the various features. Adopting this approach to the current data, makes it possible to quantify the Ce4+ and Ce3+ fractions in these samples. As indicated by the fits shown in Fig. 8, for Ce-01 the Ce4+ fraction (red) is dominant while in Ce-06 the Ce3+ fraction (blue) increases. Quantifying the fractions based on these fits provides estimates of Ce4+ content of 81% for Ce-01 and 42% for Ce-06, with the remaining fraction assumed to be Ce3+. Ce4+ fractions for the other CeO2 samples are given in Table S4† with most of them ranging between 70 and 80% and Ce-09 (APTES modified) at 62%. Although the standard deviations on these fractions from the three different measurements on each sample is ∼2%, the absolute uncertainty in this quantitative oxidation state determination is likely considerably larger. Nonetheless, it is clear that the Ce-06 sample stands apart as having a larger Ce3+ content. This was also the sample that exhibited a significant fraction of P (see Table 4) which appeared to be in the form of phosphate. The increase in Ce3+ content on this sample may be explained by the presence of cerium phosphate (CeO4P) which contains Ce in the +3 oxidation state. It is interesting to note that an earlier study of the biological effects of CeO2 nanoparticles on aquatic organisms had observed that the presence of Ce3+ surface states was the main driver of toxicity.45 By contrast, our examination of the cytotoxicity of the same NPs examined here did not find an increased toxicity for Ce-06.18
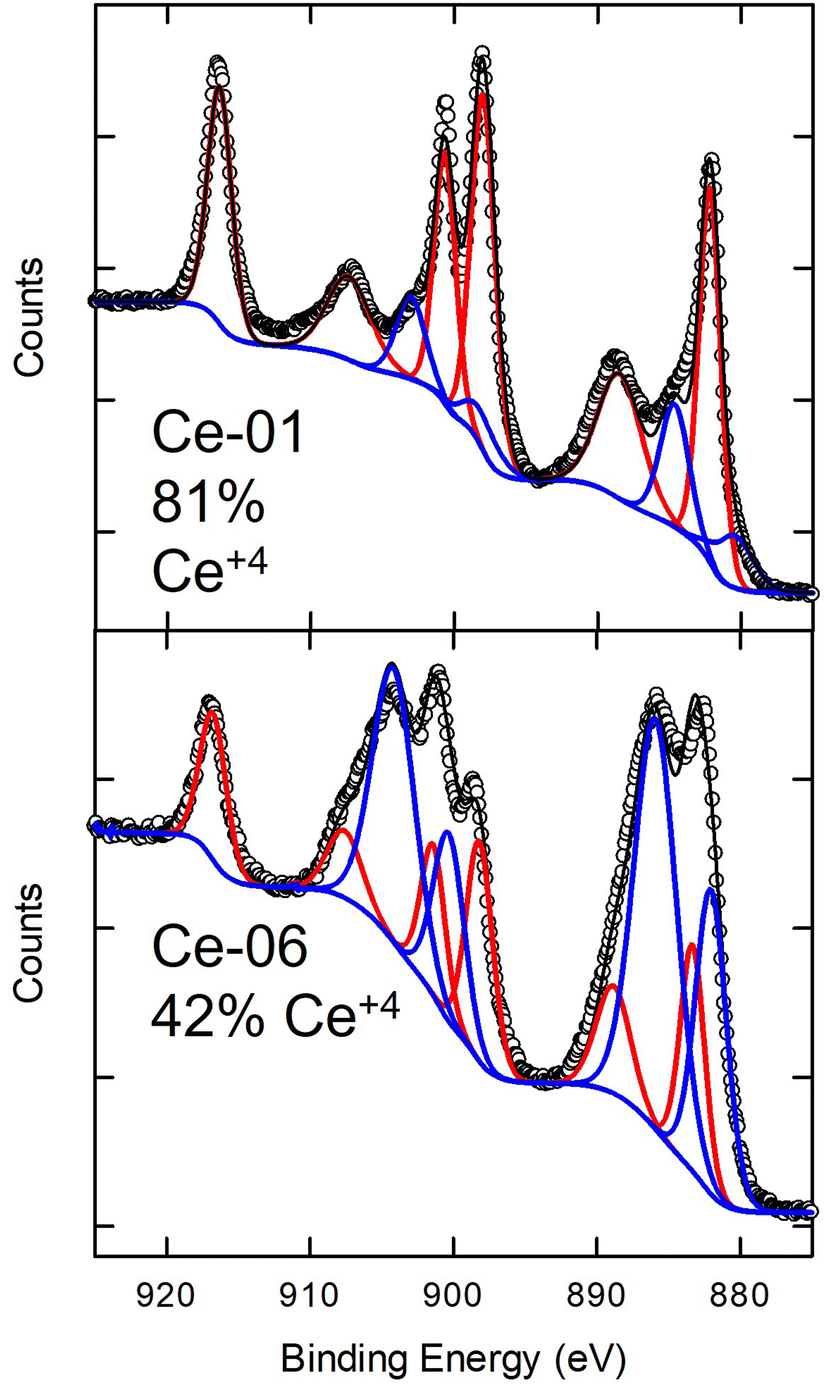 | ||
| Fig. 8 High resolution spectra of Ce 3d region for two different CeO2 nanoparticles. The hollow circles are the experimental data points while the solid black line represents the total fit to the data which is a sum of the contributions of two different oxidation states, represented by the red (+4) and blue (+3) lines. | ||
Compared with Ni, Fe and Ce, the Mn2p region exhibits less structure as seen in Fig. 9a. There are two peaks due to spin–orbit splitting but the width of the peaks (considerably larger than the spectrometer resolution) as well as the asymmetric peak shape suggests the presence of multiple unresolved features within each of these peaks. All the unmodified Mn oxide samples show this similar 2p structure, which is consistent with expectations for Mn3+. Mn-08 shows a subtle change in this structure with a sharper peak present on the lower binding energy side of the 2p3/2 envelope. By comparing the spectra with reference spectra for Mn oxides in the literature37,46 this feature suggests the presence of some Mn4+. Multiplet splitting of the Mn 3s is often used for oxidation state determination.46 HR spectra of the Mn 3s region are shown in Fig. 9b. All samples apart from Mn-08 exhibit Mn 3s splittings in the range 5.07–5.16, consistent with a Mn valence slightly larger than 3 (∼3.2). For Mn-08 this splitting is reduced to 4.64 eV which implies a higher valence (∼3.7). The O 1s region, shown in Fig. 9c also shows a slight downshift of ∼0.3 eV in the lattice oxygen peak. A similar downshift has been observed previously for MnO2 samples37 so this observation is consistent with the Mn-08 sample containing a significant fraction of Mn4+ as suggested by the Mn 2p and Mn 3s spectra.
 | ||
| Fig. 9 High resolution spectra of (a) Mn 2p, (b) Mn 3s and (c) O 1s regions for five unmodified Mn2O3 nanoparticles. | ||
3.3 Correlation of surface functional group content with qNMR data
As discussed above, XPS has provided information regarding the surface functional group content for the modified metal oxide NPs studied here. In previous work, thermogravimetric analysis (TGA) and qNMR were used to quantify the amount of functionalization on the Ni, Fe and Ce oxide samples investigated here, with general agreement found between those two methods.33 Here we compare the current XPS data with the previous qNMR results which were determined to be more reliable than the TGA data. XPS measures the atomic composition of the particles directly with the effective probing depth determined by the escape depth of the photoelectrons as discussed above. Photoelectrons from atoms on the surface are seen at full intensity while those emitted from deeper in the sample are subject to scattering and hence their response is attenuated. In contrast, qNMR typically measures the concentration of the functional group in solution after release from the particles, with the concentration being expressed in μmol g−1. To facilitate comparison with XPS data, the functional group concentration determined by qNMR can be converted to a coverage of molecules on the surface of the particles, based on the size and density of the particles. This surface coverage is expected to be correlated with XPS signals of these functional groups as demonstrated previously for aminated silica nanoparticles.17 This correlation is only expected in cases where the functional groups are all attached to the surface of solid (i.e. non-porous) particles and hence detectable by XPS with minimal attenuation and also for which these groups contain a unique chemical element that is not also present in the particles or as adventitious contamination. Unfortunately, this precludes the use of two common elements found in surface functional groups, carbon and oxygen, for quantitative analysis of functional group content as these are typically present as adventitious contamination for samples exposed to air. However, for surface modifications that contain nitrogen, as in the case of the aminated and PVP modified particles, we expect the N content to be correlated with the surface coverage of functional groups determined by qNMR.The relationship between XPS and qNMR data for the aminated metal oxide particles is shown in Fig. 10a. APTES modified samples (Ni-07, Ce-09 and Fe-05) all showed significant N 1s signals in the XPS measurements, corresponding to fractional atomic compositions of N of 2–6%. From the figure we can see a good correlation between the XPS %N and the molecules per nm2 based on the qNMR, suggesting that XPS can be used as a quantitative measure of the surface coverage of amine functional groups on the metal oxide nanoparticles. We note that the non-silane amine functionalized sample studied here (Fe-04) was investigated previously by qNMR and gave only a weak signal consistent with the presence of glycine that was not analyzed quantitatively.47 This is consistent with the XPS observations that indicate this sample exhibits approximately one third the nitrogen content seen for the APTES functionalized Fe2O3 sample of the same size (Fe-05).
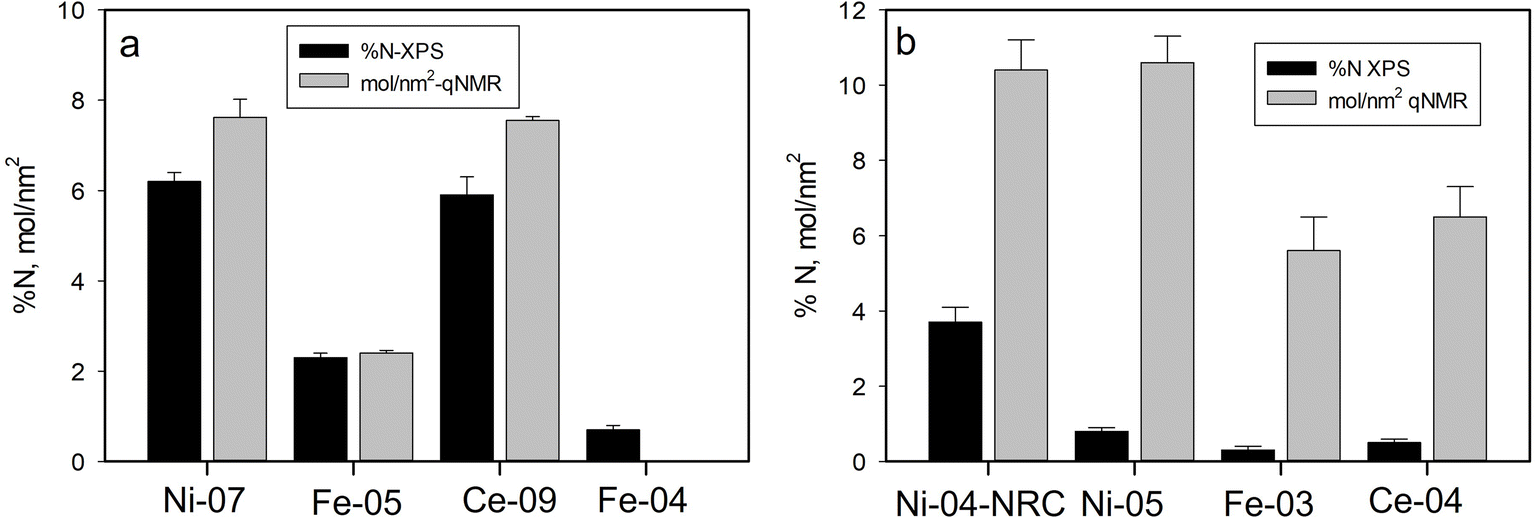 | ||
| Fig. 10 Comparison of %N measured by XPS with molecules per nm2 from qNMR for (a) aminated and (b) PVP modified metal oxide NPs. The qNMR signal for Fe-04 was weak and not quantified. | ||
The PVP modified particles also exhibit a nitrogen signal which can be used for XPS quantification. As seen in Fig. 10b, the XPS and qNMR data for these particles do not follow the same trend. While Ni-04-NRC, PVP modified in-house from the unmodified USRN NPs, showed substantial N content, the three commercial PVP modified NPs all exhibited much lower N fractions, suggesting a low level of PVP modification. In contrast, the qNMR data for Ce-04, Ni-05 and Fe-03 all indicated significant amounts of PVP, comparable to or exceeding the levels of amine functionalization measured on the APTES samples.33 Comparing N signals for the two PVP modified NiO samples, we see that the commercial Ni-05 sample exhibits only 20% of the %N content observed for the in-house sample, even though the qNMR results indicate these two samples exhibit the same level of functionalization. It is interesting to note that for the commercial samples, the XPS %N results suggest that Ni-05 exhibits the largest amount of PVP followed by Ce-04 and then Fe-03, the same trend indicated by the qNMR results. While the reason for the much lower N signal in the commercial samples is unclear, the differences suggest that the commercial PVP modification was likely prepared by a different method than used for the in-house modification. One possibility is that the commercial metal oxide samples were prepared in the presence of PVP48 rather than by coating synthesized particles. The former approach would likely lead to less PVP on the surface of the particles and hence a reduced N signal. TEM images of the in-house PVP modified NiO (Ni-04-NRC) particles did not show significant differences compared with the corresponding unmodified particles (Ni-04) (images provided in Fig. S6†). This is not surprising since the thin (∼1 nm) coating consisting of light elements (C, O and N) is not expected to generate significant contrast to be clearly distinguished in the images.
4. Conclusions
In this study we have used XPS to examine the chemical composition, oxidation state and surface functional group content of commercially available metal oxide nanoparticle samples from a number of different suppliers. Survey and high-resolution scans have provided information on the atomic composition of the samples, including estimates of the stoichiometry of the metal oxide, the presence of functional groups for modified samples as well as the identification and quantification of any impurities present on the samples. Surprisingly, many of the samples contained substantial amounts of impurities, considerably larger than expected from bulk measurements of impurity concentrations, suggesting these impurities are present at the surface of the particles. The presence of these contaminants may influence their performance in certain applications, and should be taken into account when considering the toxicity and environmental impact of these nanomaterials. The metal oxidation state in these particles is important for some applications and detailed analysis of the metal core level photoelectron spectra was used to provide information regarding the metal oxidation state in the near surface region. In general, the metal oxide particles studied here exhibited the expected oxidation state based on their specified stoichiometry, although a few exceptions were noted. The surface modifications generally did not appear to change the oxidation state. In terms of assessing functional group content, XPS can be complementary to other probes of chemical content such as qNMR. However, XPS is only suitable for functional groups on the surface of the nanoparticles and which contain unique elements not already present on the samples. Good correlation was observed between the nitrogen content observed by XPS and the functional group content obtained by qNMR for amine functionalized metal oxide nanoparticles.Data availability
Data supporting this article have been includes as part of the ESI.†Conflicts of interest
The authors declare no conflicts of interest.Acknowledgements
We wish to acknowledge helpful discussions on qNMR with Andreas Brinkman.References
- D. Comandella, S. Gottardo, I. M. Rio-Echevarria and H. Rauscher, Nanoscale, 2020, 12, 4695–4708 RSC.
- J. Labuda, J. Barek, Z. Gajdosechova, H. Goenaga-Infante, L. J. Johnston, Z. Mester and S. Shtykov, Pure Appl. Chem., 2023, 95, 133–163 CrossRef CAS.
- F. Loosli, K. Rasmussen, H. Rauscher, R. K. Cross, N. Bossa, W. Peijnenburg, J. Arts, M. Matzke, C. Svendsen, D. Spurgeon, P. A. Clausen, E. Ruggiero, W. Wohlleben and F. van der Kammer, NanoImpact, 2022, 25, 100375 CrossRef CAS PubMed.
- J. Radnik, X. Knigge, E. Andresen, U. Resch-Genger, D. J. H. Cant, A. G. Shard and C. A. Clifford, Anal. Bioanal. Chem., 2022, 414, 4331–4345 CrossRef CAS PubMed.
- D. Geißler, N. Nirmalananthan-Budau, L. Scholtz, I. Tavernaro and U. Resch-Genger, Microchim. Acta, 2021, 188, 321 CrossRef PubMed.
- D. R. Baer, M. H. Engelhard, G. E. Johnson, J. Laskin, J. Lai, K. Mueller, P. Munusamy, S. Thevuthasan, H. Wang, N. Washton, A. Elder, B. L. Baisch, A. Karakoti, S. V. N. T. Kuchibhatla and D. Moon, J. Vac. Sci. Technol., A, 2013, 31, 050820 CrossRef PubMed.
- P. A. Clausen, V. Kofoed-Sørensen, A. W. Nørgaard, N. M. Sahlgren and K. A. Jensen, Materials, 2019, 12, 3657 CrossRef CAS PubMed.
- A. Hennig, H. Borcherding, C. Jaeger, S. Hatami, C. Würth, A. Hoffmann, K. Hoffmann, T. Thiele, U. Schedler and U. Resch-Genger, J. Am. Chem. Soc., 2012, 134, 8268–8276 CrossRef CAS PubMed.
- I.-L. Hsiao, S. Fritsch-Decker, A. Leidner, M. Al-Rawi, V. Hug, S. Diabaté, S. L. Grage, M. Meffert, T. Stoeger, D. Gerthsen, A. S. Ulrich, C. M. Niemeyer and C. Weiss, Small, 2019, 15, 1805400 CrossRef PubMed.
- N. Kong, J. Zhou, J. Park, S. Xie, O. Ramström and M. Yan, Anal. Chem., 2015, 87, 9451–9458 CrossRef CAS PubMed.
- F. Kunc, V. Balhara, A. Brinkmann, Y. Sun, D. M. Leek and L. J. Johnston, Anal. Chem., 2018, 90, 13322–13330 CrossRef CAS PubMed.
- A. Hennig, P. M. Dietrich, F. Hemmann, T. Thiele, H. Borcherding, A. Hoffmann, U. Schedler, C. Jäger, U. Resch-Genger and W. E. S. Unger, Analyst, 2015, 140, 1804–1808 RSC.
- L. J. Johnston, X. Du, A. Zborowski and D. C. Kennedy, Nanomaterials, 2024, 14, 198 CrossRef CAS PubMed.
- H. J. H. Kang, R. F. Ali, M. T. Y. Paul, M. J. Radford, I. Andreu, A. W. H. Lee and B. D. Gates, Chem. Commun., 2019, 10452–10455 RSC.
- N. Nirmalananthan-Budau, B. Rühle, D. Geißler, M. Moser, C. Kläber, A. Schäfer and U. Resch-Genger, Sci. Rep., 2019, 9, 17577 CrossRef PubMed.
- F. Kunc, O. Kodra, A. Brinkmann, G. P. Lopinski and L. J. Johnston, Nanomaterials, 2020, 10, 678 CrossRef CAS PubMed.
- Y. Sun, F. Kunc, V. Balhara, B. Coleman, O. Kodra, M. Raza, M. Chen, A. Brinkmann, G. P. Lopinski and L. J. Johnston, Nanoscale Adv., 2019, 1, 1598–1607 RSC.
- M. Bushell, F. Kunc, X. Du, A. Zborowski, L. J. Johnston and D. Kennedy, International Journal of Translational Medicine, 2022, 2, 522–536 CrossRef.
- F. Kunc, M. Bushell, L. J. Johnston and D. Kennedy, Nanomaterials, 2022, 12, 1822 CrossRef CAS PubMed.
- D. R. Baer, J. Vac. Sci. Technol., A, 2020, 38, 031201 CrossRef CAS.
- D. R. Baer, D. J. Gaspar, P. Nachimuthu, S. D. Techane and D. G. Castner, Anal. Bioanal. Chem., 2010, 396, 983–1002 CrossRef CAS PubMed.
- A. Müller, T. Heinrich, S. Tougaard, W. S. M. Werner, M. Hronek, V. Kunz, J. Radnik, J. M. Stockmann, V.-D. Hodoroaba, S. Benemann, N. Nirmalananthan-Budau, D. Geißler, K. Sparnacci and W. E. S. Unger, J. Phys. Chem. C, 2019, 123, 29765–29775 CrossRef.
- M. S. Chavali and M. P. Nikolova, SN Appl. Sci., 2019, 1, 607 CrossRef CAS.
- U. Farooq, T. Ahmad, F. Naaz and S. ul Islam, Energy Fuels, 2023, 37, 1577–1632 CrossRef CAS.
- T. Naseem and T. Durrani, Environ. Chem. Ecotoxicol., 2021, 3, 59–75 CrossRef CAS.
- M. P. Nikolova and M. S. Chavali, Biomimetics, 2020, 5, 27 CrossRef CAS PubMed.
- Y. Yoon, P. L. Truong, D. Lee and S. H. Ko, ACS Nanosci. Au, 2022, 2, 64–92 CrossRef CAS PubMed.
- G. Greczynski and L. Hultman, ChemPhysChem, 2017, 18, 1507–1512 CrossRef CAS PubMed.
- G. Greczynski and L. Hultman, Prog. Mater. Sci., 2020, 107, 100591 CrossRef CAS.
- M. C. Biesinger, Appl. Surf. Sci., 2022, 597, 153681 CrossRef CAS.
- C. R. Brundle and B. V. Crist, J. Vac. Sci. Technol., A, 2020, 38, 041001 CrossRef CAS.
- N. A. Belsey, D. J. H. Cant, C. Minelli, J. R. Araujo, B. Bock, P. Brüner, D. G. Castner, G. Ceccone, J. D. P. Counsell, P. M. Dietrich, M. H. Engelhard, S. Fearn, C. E. Galhardo, H. Kalbe, J. W. Kim, L. Lartundo-Rojas, H. S. Luftman, T. S. Nunney, J. Pseiner, E. F. Smith, V. Spampinato, J. M. Sturm, A. G. Thomas, J. P. W. Treacy, L. Veith, M. Wagstaffe, H. Wang, M. Wang, Y.-C. Wang, W. Werner, L. Yang and A. G. Shard, J. Phys. Chem. C, 2016, 120, 24070–24079 CrossRef CAS PubMed.
- F. Kunc, M. Gallernault, O. Kodra, A. Brinkmann, G. P. Lopinski and L. J. Johnston, Anal. Bioanal. Chem., 2022, 414, 4409–4425 CrossRef CAS PubMed.
- T. R. Gengenbach, G. H. Major, M. R. Linford and C. D. Easton, J. Vac. Sci. Technol., A, 2021, 39, 013204 CrossRef CAS.
- M. A. Peck and M. A. Langell, Chem. Mater., 2012, 24, 4483–4490 CrossRef CAS.
- R. Blume, W. Calvet, A. Ghafari, T. Mayer, A. Knop-Gericke and R. Schlögl, ChemPhysChem, 2023, 24, e2023002 CrossRef PubMed.
- M. C. Biesinger, B. P. Payne, A. P. Grosvenor, L. W. M. Laua, A. R. Gerson and R. S. C. Smart, Appl. Surf. Sci., 2011, 257, 2717–2730 CrossRef CAS.
- P. Guo and C. Wang, RSC Adv., 2017, 7, 4437–4443 RSC.
- K. I. Maslakov, Y. A. Teterin, A. J. Popel, A. Y. Teterin, K. E. Ivanov, S. N. Kalmykov, V. G. Petrov, P. K. Petrov and I. Farnan, Appl. Surf. Sci., 2018, 448, 154–162 CrossRef CAS.
- M. C. Biesinger, B. P. Payne, B. R. Hart, A. P. Grosvenor, N. S. McIntryre, L. W. Lau and R. S. Smart, J. Phys.: Conf. Ser., 2008, 100, 012025 CrossRef.
- A. P. Grosvenor, B. A. Kobe, M. C. Biesinger and N. S. McIntyre, Surf. Interface Anal., 2004, 36, 1564–1574 CrossRef CAS.
- M. C. Biesinger, B. P. Payne, L. W. M. Lau, A. Gerson and R. S. C. Smart, Surf. Interface Anal., 2009, 41, 324–332 CrossRef CAS.
- E. Paparazzo, J. Phys.: Condens. Matter, 2018, 30, 343003 CrossRef PubMed.
- C. M. Sims, R. A. Maier, A. C. Johnston-Peck, J. M. Gorham, V. A. Hackley and B. C. Nelson, Nanotechnology, 2019, 30, 085703 CrossRef CAS PubMed.
- G. Pulido-Reyes, I. Rodea-Palomares, S. Das, T. S. Sakthivel, F. Leganes, R. Rosal, S. Seal and F. Fernández-Piñas, Sci. Rep., 2015, 5, 15613 CrossRef CAS PubMed.
- E. S. Ilton, J. E. Post, P. J. Heaney, F. T. Ling and S. N. Kerisit, Appl. Surf. Sci., 2016, 475–485 CrossRef CAS.
- F. Kunc and L. J. Johnston, unpublished results.
- K. M. Koczkur, S. Mourdikoudis, L. Polavarapu and S. E. Skrabalak, Dalton Trans., 2015, 44, 17883–17905 RSC.
Footnote |
| † Electronic supplementary information (ESI) available. See DOI: https://doi.org/10.1039/d4na00943f |
| This journal is © The Royal Society of Chemistry 2025 |