
 Open Access Article
 This Open Access Article is licensed under a
 Creative Commons Attribution 3.0 Unported Licence
High-porosity Pt–CeO2 nanosponges as oxidation catalyst†
Simon
Falkner
a,
Carina B.
Maliakkal
b,
Mareike
Liebertseder
a,
Joachim
Czechowsky
 c,
Maria
Casapu
c,
Jan-Dierk
Grunwaldt
cd,
Christian
Kübel
*b and
Claus
Feldmann
*a
c,
Maria
Casapu
c,
Jan-Dierk
Grunwaldt
cd,
Christian
Kübel
*b and
Claus
Feldmann
*a
aInstitute of Inorganic Chemistry (IAC), Karlsruhe Institute of Technology (KIT), Engesserstraße 15, D-76131 Karlsruhe, Germany. E-mail: claus.feldmann@kit.edu
bInstitute of Nanotechnology (INT), Karlsruhe Nano Micro Facility (KNMFi), Karlsruhe Institute of Technology (KIT), Hermann-von-Helmholtz-Platz 1, 76344 Eggenstein-Leopoldshafen, Germany
cInstitute for Chemical Technology and Polymer Chemistry (ITCP), Karlsruhe Institute of Technology (KIT), Engesserstraße 20, 76131 Karlsruhe, Germany
dInstitute of Catalysis Research and Technology (IKFT), Karlsruher Institute of Technology (KIT), Hermann-von-Helmholtz-Platz 1, 76344 Eggenstein-Leopoldshafen, Germany
First published on 30th December 2024
Abstract
Pt–CeO2 nanosponges (1 wt% Pt) with high surface area (113 m2 g−1), high pore volume (0.08 cm3 g−1) and small-sized Pt nanoparticles (1.8 ± 0.4 nm) are prepared by thermal decomposition of a cerium oxalate precursor and examined for catalytic oxidation of CO, volatile organic compounds (VOCs), and NH3. The cerium oxalate precursor Ce2(C2O4)3·10H2O is prepared by aqueous precipitation from Ce(NO3)3·6H2O and K2C2O4·H2O and thermally converted to CeO2 nanosponges by heating in air. Optimal conditions for decomposition in terms of surface area and porosity are observed at 350 °C for 20 min. Finally, the CeO2 nanosponges are decorated with small-sized Pt nanoparticles, using a wet-chemical impregnation with Pt(ac)2 in methanol. Electron microscopy with tomography, electron spectroscopy and further methods (TG, XRD, FT-IR, sorption analysis) are used to characterize the catalyst composition and especially the structure and porosity of the Pt–CeO2 nanosponges as well as the uniform distribution of the Pt nanoparticles. The Pt–CeO2 nanosponges show good thermal stability (up to 400 °C) and, already as a new, non-optimized catalyst, promising activity for catalytic oxidation of CO, VOCs, NH3 as indicated by high activities in terms of low and stable light-out and light-off temperatures as well as a high selectivity to N2 (for NH3 oxidation) with >80% at 170–250 °C.
Introduction
Ceria, in combination with a precious metal, is specifically interesting for oxidation catalysis as it combines several beneficial properties.1 Thus, the oxidation states Ce3+ and Ce4+ – specifically in the solid phases Ce2O3 and CeO2 – are of comparable stability,2 which promotes reversible redox reactions. Moreover, the structures of Ce2O3 (defect CaF2 type)3 and CeO2 (CaF2 type)4 are in close relation so that oxygen can be reversibly stored and released. With a Mars–van-Krevelen-like mechanism,5 oxygen at the interface of ceria and a noble metal (e.g., Pt, Pd, Ru) can be provided for a catalytic oxidation of species (e.g., CO, volatile organic compounds/VOCs, NH3) adsorbed on the precious metal.6 As a result, ceria is widely applied as a metal-oxide support in heterogeneous catalysis.1 Particularly important are emission control,7 reverse water–gas shift, electrocatalysis and fuel cells,7 direct synthesis of H2O2,8 or the detection of combustible gases.9To promote heterogeneous catalytic reactions with high activity at low temperatures, ceria with high surface area and high porosity is required.10 On the one hand, this guarantees a sufficient contact between the solid metal-oxide support and the gaseous reactants. On the other hand, a uniform distribution of small-sized noble metal particles is possible over the large surface of the metal-oxide support. Due to its high oxide-ion conductivity, specifically at elevated temperature (>200 °C), however, ceria is also known for limited thermal stability. Thus, sintering due to the high oxide-ion mobility can result in a rapid decrease of surface area and porosity.11 Currently, the highest surface areas for ceria are reported with about 100 m2 g−1 for mesoporous mixtures of ceria and zirconia, using the latter to stabilize ceria.12 Higher surface areas of 170 m2 g−1 and 250 m2 g−1 were yet only reported for very small (1–5 nm) massive CeO2 nanoparticles.13 Despite a high surface area as such, ceria nanoparticles are not suitable for establishing porous 3D-networks and tend to form close-packed particle arrays. Furthermore, the respective high-surface-area CeO2 materials are not stable at higher temperature or were not even examined in regard of sintering and/or thermal shrinkage of the surface area.
Aiming at ceria metal-oxide supports with high surface area and porosity, we previously focused on ceria hollow nanospheres using either water droplets14 or sodium-chloride templates.15 The resulting ceria hollow nanospheres exhibited surface areas up to 210 m2 g−1 and pore volumes up to 0.08 cm3 g−1.14,15 The preparation and removal of the respective template, however, resulted in additional process steps for synthesis and purification. To facilitate the synthesis and specifically to reproducibly realize higher quantities, we here suggest a novel concept to obtain high-porosity ceria based on a cerium-oxalate precursor, which is thermally decomposed to ceria at low temperature (350 °C). After wet-chemical impregnation with Pt(ac)2, Pt–CeO2 nanosponges with high surface area (113 m2 g−1), high pore volume (0.08 cm3 g−1), small-sized Pt nanoparticles (1.8 ± 0.4 nm) and good temperature stability (up to 400 °C) were obtained and examined in regard to the catalytic oxidation of CO, VOCs (volatile organic compounds), and NH3.
Results and discussion
Synthesis of Ce2(C2O4)3 precursor particles
The need of high surface area and high porosity of CeO2 for catalysis was most often addressed either by hydrothermal, solvothermal or sol-gel processes,16 template-based techniques,16,17 or the preparation of nanostructured ceria with certain size and shape (e.g., hollow spheres, nanorods, nanotubes).18 These approaches, on the one hand, require the presence of the respective porous host lattices and templates as well as a deep infiltration with CeO2 and/or a complete removal of the template. On the other hand, a sufficient thermal and chemical stability of the resulting material structure at the transient conditions occurring for catalysis (e.g., variable temperature and pressure, presence of moisture and/or catalyst poisons) is mandatory. Concepts to transfer a suitable ceria precursor into high-surface porous ceria are rare by now. Most comparable is the so-called Pechini method16,19 with, for instance, Ce(NO3)3 converted to CeO2via combustion, with e.g., glucose acting as a gelation agent.20 The temperature of reaction and the resulting surface area and porosity, however, are difficult to control via this approach.Aiming at a suitable ceria precursor, which can be thermally transferred to CeO2 at moderate temperature, we here use cerium oxalate (Fig. 1a). Metal oxalates are generally well-known for low-temperature decomposition to metal oxides with release of CO/CO2. In this regard, cerium oxalate was yet only described to obtain nanocrystalline ceria with rod-type shape.21 Since Ce2(C2O4)3 is insoluble in water, the precursor particles can be obtained by simple aqueous precipitation. Accordingly, a solution of Ce(NO3)3·6H2O in ethanol was injected with a solution of K2C2O4·H2O in water. Thereafter, the formation of Ce2(C2O4)3 is indicated by the instantaneous nucleation of particles and the formation of a suspension. The resulting colourless solid was then separated by centrifugation and purified by repeated redispersion/centrifugation in/from water.
 | ||
| Fig. 1 Scheme illustrating the synthesis of Pt–CeO2 nanosponges: (a) formation of rod- to platelet-shaped Ce2(C2O4)3·10H2O precursor particles, (b) thermal conversion of Ce2(C2O4)3·10H2O precursor particles to CeO2 nanosponges, (c) wet-chemical impregnation of the CeO2 nanosponges with a solution of Pt(ac)2 in methanol followed by Pt nanoparticle formation (at 25 °C). | ||
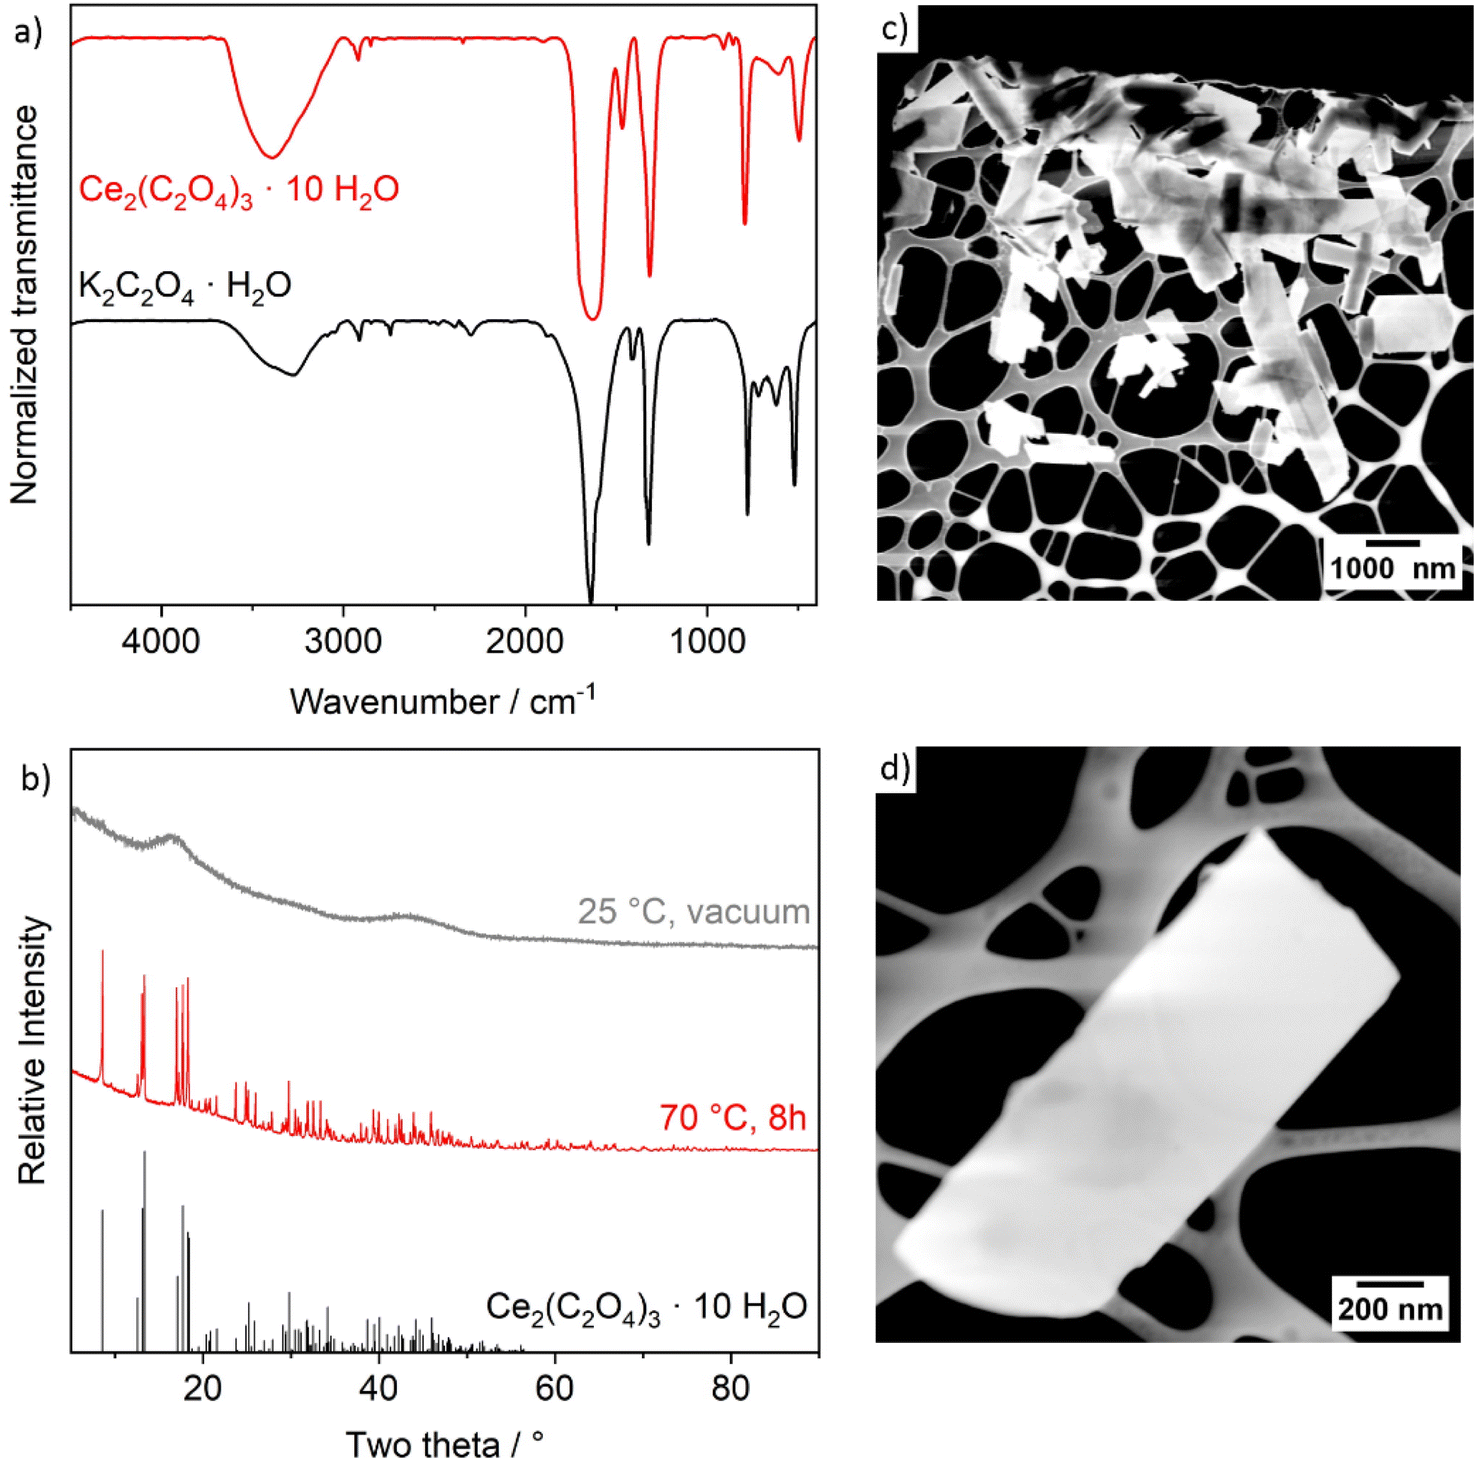
The as-prepared Ce2(C2O4)3 precursor particles were characterized by Fourier-transform infrared (FT-IR) spectroscopy, X-ray powder diffraction (XRD), scanning transmission electron microscopy (STEM), and sorption analysis. FT-IR spectra of the Ce2(C2O4)3 precursor particles clearly evidences the presence of the characteristic vibrations of [C2O4]2− (νas(C![[double bond, length as m-dash]](https://www.rsc.org/images/entities/char_e001.gif) O): 1630, νs(CO): 1315, δas(COO): 790, δs(COO): 495 cm−1), which are also in accordance with K2C2O4·H2O as the starting material (Fig. 2a). In addition, ν(O–H) (3600–3000 cm−1) indicates the presence of water. After drying at room temperature in vacuum, XRD only shows non-specific, broad reflexes of a predominately amorphous compound (Fig. 2b). Subsequent to heating (70 °C, 8 h), the precursor particles become crystalline and can be clearly identified as Ce2(C2O4)3·10H2O. Scanning transmission electron microscopy (STEM) shows rod- to platelet-shaped particles with a length of 0.5–3.5 μm and a diameter of 200–650 nm (Fig. 2c). Detail STEM images indicate the precursor particles to be non-porous (Fig. 2d). Finally, sorption analysis with nitrogen as the sorbent and an analysis via the Brunauer–Emmett–Teller (BET) approach confirms the presence of a dense material with a surface area of 14 m2 g−1 and a pore volume of 0.015 cm3 g−1 only (Table 1, Fig. 3c and S1†).
O): 1630, νs(CO): 1315, δas(COO): 790, δs(COO): 495 cm−1), which are also in accordance with K2C2O4·H2O as the starting material (Fig. 2a). In addition, ν(O–H) (3600–3000 cm−1) indicates the presence of water. After drying at room temperature in vacuum, XRD only shows non-specific, broad reflexes of a predominately amorphous compound (Fig. 2b). Subsequent to heating (70 °C, 8 h), the precursor particles become crystalline and can be clearly identified as Ce2(C2O4)3·10H2O. Scanning transmission electron microscopy (STEM) shows rod- to platelet-shaped particles with a length of 0.5–3.5 μm and a diameter of 200–650 nm (Fig. 2c). Detail STEM images indicate the precursor particles to be non-porous (Fig. 2d). Finally, sorption analysis with nitrogen as the sorbent and an analysis via the Brunauer–Emmett–Teller (BET) approach confirms the presence of a dense material with a surface area of 14 m2 g−1 and a pore volume of 0.015 cm3 g−1 only (Table 1, Fig. 3c and S1†).
 | ||
| Fig. 2 Characterization of the Ce2(C2O4)3·10H2O precursor particles: (a) FT-IR spectrum (K2C2O4·H2O as a reference), (b) XRD (Ce2(C2O4)3·10H2O as a reference, ICDD-No. C01-075-7101), (c) STEM overview image, (d) STEM detail image of a single precursor particle. | ||
| Conditions for thermal decomposition | Surface area (m2 g−1) | Pore volume (cm3 g−1) |
|---|---|---|
| Ce2(C2O4)3·10H2O (as-prepared) | 14 | 0.015 |
| 300 °C (2 h, 1 K min−1) | 86 | 0.057 |
| 350 °C (20 min) | 113 | 0.082 |
| 400 °C (20 min) | 93 | 0.100 |
 | ||
| Fig. 3 Characterization of the CeO2 nanosponges: (a) thermogravimetric analysis, (b) FT-IR spectra before and after thermal conversion, (c) volumetric sorption analysis after different thermal treatments, (d) XRD (CeO2 as a reference, ICDD-No. C00-034-0394). | ||
Thermal decomposition to CeO2 nanosponges
For the thermal conversion of the Ce2(C2O4)3 precursor particles to porous CeO2 nanosponges (Fig. 1b), first of all, suitable conditions for the thermal decomposition need to be identified. Accordingly, thermogravimetry (TG) was conducted (Fig. 3a). Here, thermal decomposition is observed in two steps. First, a mass loss of 22% is observed at 30–210 °C, which is followed by a second mass loss at 210–400 °C with 28%. Hereof, the first step can be related to the evaporation of water (calculated: 24.9%). The second step relates to the loss of CO and CO2 (calculated: 27.6%) according to the following reaction: Ce2(C2O4)3 → 2CeO2 + 4CO + 2CO2. Based on this thermal behaviour, in principle, there are several options for decomposition: (i) a fast decomposition putting a powder sample into the already hot oven at the upper temperature limit (≥350 °C) or (ii) a slow decomposition with a ramp (1 K min−1) from room temperature to the lower temperature limit of decomposition (≤300 °C). Aiming at high surface area and porosity, both measures may have disadvantages. Fast heating may lead to a gas evolution being too fast and, thereby, destroying the thin walls of the intended nanosponges. Slow heating may cause extensive sintering due to the significantly longer time of the decomposition reaction. Therefore, we have examined different conditions (Table 1, Fig. 3c). With a surface area of 113 m2 g−1 and a pore volume of 0.082 cm3 g−1, fast heating (350 °C, 20 min) and fast decomposition turn out to be optimal (Table 1, Fig. 3c and S2a†). When exceeding 350 °C, the pore volume increases due to the formation of larger pores but with the surface area decreasing at the same time (Table 1, Fig. 3c). In regard of the pore diameter, predominately mesopores (≥25 Å and ≤ 45 Å) were observed (ESI Fig. S2b†). With these values, the CeO2 nanosponges are among the highest surface areas reported for CeO2. The highest specific surface area was yet reported with 100 m2 g−1 for mesoporous zirconia-ceria mixtures12 or with 170 m2 g−1 for very small (3–5 nm) massive CeO2 nanoparticles.13 Higher values of 250 m2 g−1 were – to the best of our knowledge – only reported for microemulsion-made CeO2 nanoparticles, which, however, results in very small amounts of material.13The conversion of the Ce2(C2O4)3·10H2O precursor particles is validated by XRD, which only shows the Bragg reflexes of CeO2 (Fig. 3d). FT-IR spectra only exhibit very weak vibrations related to remains of oxalate (Fig. 3b). The width of the Bragg reflexes already points to the presence of small crystallite sizes (Fig. 3d). Based on the Scherrer approach, a mean crystallite size of 4.5 nm can be deduced. In fact, this is in good agreement with the mean wall thickness of 3.5 ± 0.5 nm observed for the CeO2 nanosponges on TEM images (Fig. 4, 5 and 6). On a larger scale, STEM images still show a rod- to platelet-type shape with a length of 0.5–3.5 μm and a diameter of 200–650 nm of the Ce2(C2O4)3·10H2O precursor particles (Fig. 4). High-resolution STEM images and electron diffraction confirm the conversion of the dense precursor nanoparticles to high-surface-area and highly porous CeO2 nanosponges (Fig. 4b–g). STEM-based tomography reconstructions of the 3D structure further confirm the high porosity with a bimodal 3-dimensional network of interconnected large (up to 300 nm) and small pores (starting at 1–3 nm) (Fig. 4; for volume rendering and reconstruction of Z-slices see ESI Videos S1–S4†). Aiming at a catalyst material, such an interconnected fractal porous structure is beneficial as a fast gas-phase transport is possible via larger pores to reactive sites in smaller pores without the need of high pressure gradients.
 | ||
| Fig. 4 Electron microscopy and tomography of CeO2 nanosponges: (a–d and f) HAADF-STEM images at different magnification (inset in (c) showing the crystallinity, ESI Fig. S4†), (e and g) examples of Z-slices obtained from 3D electron tomographic reconstructions of nanosponges shown in (d) and (f) (for volume rendering and reconstruction of Z-slices see ESI Fig. S5 and Videos S1–S4†). | ||
 | ||
| Fig. 5 EDXS elemental maps of Pt on CeO2 nanosponges: STEM images of Pt–CeO2 nanosponges at different magnification and corresponding Pt and Ce elemental maps. | ||
 | ||
| Fig. 6 Thermal stability of the Pt–CeO2 nanosponges: STEM images of Pt–CeO2 nanosponges at different magnification and corresponding Pt and Ce EDXS elemental maps. | ||
Decoration of CeO2 nanosponges with Pt nanoparticles
After the formation of the CeO2 nanosponges, the highly porous structure was impregnated with Pt precursors (1 wt% Pt) via a wet-chemical deposition process (Fig. 1c). To this concern, a solution of Pt(ac)2 in methanol was slowly dropped on a powder sample of the CeO2 nanosponges. Due to the low surface tension of methanol, the Pt(ac)2 solution was instantaneously distributed over the support surface due to capillary forces. Thereafter, the as-deposited Pt(ac)2 was reduced by reducing gas (N2![[thin space (1/6-em)]](https://www.rsc.org/images/entities/char_2009.gif) :H2 = 10:90) already at room temperature (25 °C). Due to the fine dispersion of Pt(ac)2 over the nanosponge surface prior to the reduction, a homogeneous distribution of small Pt nanoparticles is achieved. Accordingly, a uniform distribution of small Pt particles occurs with 1 wt% of Pt and a particle size of 1.0–2.5 nm (Fig. 5) and a mean size of 1.8 ± 0.4 nm (ESI Fig. S3 and S6†). This wet-chemical process with Pt(ac)2 is preferred here over the more often used aqueous solutions of platinum chloride or platinum nitrate22 as the latter require certain heating for reduction (100–300 °C), which promotes particle growth and leads to larger Pt nanoparticles than obtained here by reduction at room temperature.
:H2 = 10:90) already at room temperature (25 °C). Due to the fine dispersion of Pt(ac)2 over the nanosponge surface prior to the reduction, a homogeneous distribution of small Pt nanoparticles is achieved. Accordingly, a uniform distribution of small Pt particles occurs with 1 wt% of Pt and a particle size of 1.0–2.5 nm (Fig. 5) and a mean size of 1.8 ± 0.4 nm (ESI Fig. S3 and S6†). This wet-chemical process with Pt(ac)2 is preferred here over the more often used aqueous solutions of platinum chloride or platinum nitrate22 as the latter require certain heating for reduction (100–300 °C), which promotes particle growth and leads to larger Pt nanoparticles than obtained here by reduction at room temperature.
STEM images display the uniform size distribution of the Pt nanoparticles all over the inner surface of the Pt–CeO2 nanosponges with the bright spots indicating the presence of high-density Pt nanoparticles (Fig. 5a), which was confirmed by energy-dispersive X-ray spectroscopy (EDXS) elemental mapping (Fig. 5b). Beside high surface area and porosity of the CeO2 nanosponges and a small size of the Pt nanoparticles, a sufficient thermal stability of the Pt–CeO2 catalyst system is required for catalytic application. This includes the sintering stability of the cerium-oxide support as well as the size stability of the Pt nanoparticles. As the CeO2 nanosponges were prepared by thermal decomposition of Ce2(C2O4)3·10H2O at 350 °C, a sufficient thermal stability at least up to this temperature can be expected.
The thermal stability of the Pt–CeO2 nanosponges was examined by XRD, sorption analysis, and TEM up to a temperature of 400 °C. To this regard, XRD still indicates comparably broad Bragg reflections after heating (ESI Fig. S7†). Here, it should be noticed that no Bragg reflections of the Pt nanoparticles occur due to their low concentration and small size. Sorption analysis indicates a single drop of the surface area by about 5% to 107 m2 g−1 while the pore volume remains constant at 0.082 cm3 g−1 after heating to 400 °C for 24 h. For longer heating, both surface area and pore volume remain stable. Furthermore, STEM images of the Pt–CeO2 nanosponges point to the stability of the inner pore structure of the nanosponges as well as the stability of the size and distribution of the Pt nanoparticles. Thus, the structure and porosity of the CeO2 framework as well as a size and distribution of the Pt nanoparticles for the samples heated to 400 °C (Fig. 6) are quite similar to the as-prepared Pt–CeO2 nanosponges (Fig. 5).
Oxidation catalysis with Pt–CeO2 nanosponges
To evaluate the potential of the novel Pt–CeO2 nanosponges for oxidation catalysis, different reactants and reactions were tested, using standard conditions (e.g., applied temperature, pressure, concentration) without a further optimization of the nanosponge catalyst and/or the respective conditions of the reaction. Specifically, the catalytic oxidation of CO, volatile organic compounds (VOCs) and NH3 were studied with regard to activity and temperature range up to 250 °C for CO oxidation and 400 °C for NH3 oxidation. As a representative of VOCs, the oxidation of formaldehyde (HCHO) was investigated up to temperature of 250 °C.The CO, HCHO and NH3 conversion and the catalyst stability were monitored in three single experiments with three consecutive light-off/light-out cycles, while applying a ramp rate of 5 °C min−1 for CO and HCHO oxidation as well as a ramp rate of 10 °C min−1 for NH3 oxidation (Fig. 7). In this way, not only the initial activity was determined but also the performance after catalyst degreening under reaction conditions. When considering that the Pt–CeO2 nanosponges were exposed to ambient atmosphere prior to the catalytic tests, at least a partial oxidation of the Pt nanoparticle surface is to be expected. As a result, the CO, HCHO, and NH3 oxidation is anticipated to occur only at temperatures sufficiently high for the reduction of Pt nanoparticles under reaction conditions.23 A relatively high light-off temperature – the temperature at which 50% of activity were reached – of 159 °C during the heating phase, and a slow increase of the CO oxidation activity were observed for the 1st cycle (Fig. 7a). In contrast, 100% conversion was maintained during the cooling down step even at 135 °C, followed by a sharp decrease in activity and a light-out temperature of 114 °C (the temperature at which 50% activity are reached in the cooling cycle, Table 2). Despite the reducing treatment (N2:H2 = 10:90) applied at 25 °C for the sample, this behaviour can be ascribed to a certain catalyst degreening, including the removal of precursor traces and changes in the oxidation state during the reaction.24 Additionally, the noble metal structure is expected to change under reaction conditions due to the interaction with the CeO2 support, leading to sintering/redispersion processes depending on the temperature and CO concentration.5a The improved activity and the steep CO oxidation profile is then maintained during the 2nd and 3rd reaction cycle. In comparison to the 1st cycle, the light-off and light-out temperatures are very close in values (140 °C and 118 °C, Table 2), showing a good stability of the catalyst system (Fig. 7a). The hysteresis occurring between the light-off and light-out curves points to Pt particles with a size of 1–3 nm as previously reported for alumina-supported catalysts.24 This size is also in accordance with STEM images of the Pt–CeO2 nanosponges with Pt nanoparticles, 1.8 ± 0.4 nm in size (ESI Fig. S6†). In addition, the different CO oxidation mechanism involving perimeter sites at the interface between the noble metal and the CeO2 support can contribute as well to the variation between the heating and cooling curves.23 Thus, Ce3+ sites are generated at the interface between Pt and CeO2 support and in the topmost layer of ceria during CO oxidation.25 This availability of oxygen at the perimeter sites further minimizes the CO self-inhibition effect on Pt.24,26
 | ||
| Fig. 7 Evaluation of the catalytic properties of the Pt–CeO2 (1%) nanosponges: (a) CO oxidation (gas mixture: 50 mL min−1 of 1000 ppm CO, 10% O2 in He, temperature ramp rate: 5 °C min−1), (b) VOC oxidation (gas mixture: 50 mL min−1 of 260 ppm HCHO, 10% O2 in He, temperature ramp rate: 5 °C min−1), (c) NH3 oxidation (gas mixture: 50 mL min−1 of 1000 ppm CO, 10% O2 in He, temperature ramp rate: 10 °C min−1), (d) NH3 oxidation product selectivity at cycle 3 (for conversion >10%). | ||
| 1st cycle LoffT50/°C | 1st cycle LoutT50/°C | 2nd cycle LoffT50/°C | 2nd cycle LoutT50/°C | 3rd cycle LoffT50/°C | 3rd cycle LoutT50/°C | |
|---|---|---|---|---|---|---|
| CO | 159 | 114 | 141 | 117 | 140 | 119 |
| HCHO (VOCs) | 107 | 39 | 73 | 46 | 83 | 51 |
| NH3 | 241 | 207 | 261 | 210 | 272 | 215 |
A comparable behaviour as for the catalytic CO oxidation with Pt–CeO2 nanosponges is also observed for the 1st cycle of the catalytic HCHO oxidation with a light-off temperature of 107 °C but in combination with a very low light-out temperature of 39 °C (Fig. 7b). For the 2nd and 3rd cycle, the difference between light-off and light-out temperature becomes much smaller reaching 83 and 51 °C for the 3rd cycle (Table 2). For the catalytic NH3 oxidation, the Pt–CeO2 nanosponges show a light-off temperature of 241 °C and a light-out temperature of 207 °C in the 1st cycle (Fig. 7c), which are shifted after the 1st cycle to stable values in the 2nd and 3rd catalytic cycle. Due to the lower reactivity of NH3, both the light-off and light-out temperatures are higher compared to CO and HCHO oxidation (Table 2). Finally, the high selectivity of the Pt–CeO2 nanosponges for catalytic NH3 oxidation is remarkable with >80% of N2 at 220–250 °C (light off of 3rd cycle) and 170–200 °C (light out of 3rd cycle) (Fig. 7d).27 The selectivity to nitrogen is high up to 300 °C. At higher temperatures, both NO and NO2 are formed due to over-oxidation. Compared to the activity reported in the literature for small platinum species on non-interacting support, the Pt–CeO2 nanosponges show a high activity with comparable if not better selectivity to nitrogen and low selectivity towards N2O. The CeO2 nanosponges appears to significantly support the reaction.27
Although a reliable comparison with industrially applied catalyst systems or other Pt–CeO2 catalysts reported in the literature is difficult due to different types of materials and conditions, the novel Pt–CeO2 nanosponges show very promising catalytic performance regarding the oxidation of CO, HCHO, and NH3. This holds the more as the nanosponges were not yet optimized in regard of their surface area, pore size and volume, the Pt load and particle size or the specific conditions of the catalytic reaction.
Conclusions
Pt–CeO2 nanosponges with high surface area (113 m2 g−1), pore volume (0.08 cm3 g−1), small-sized Pt nanoparticles (1.8 ± 0.4 nm), and good thermal stability (up to 400 °C) are obtained by an optimised thermal decomposition of Ce2(C2O4)3·10H2O precursor particles. The latter are prepared by precipitation upon reaction of Ce(NO3)3·6H2O and K2C2O4·H2O in an ethanol–water mixture. The cerium oxalate precursor is then thermally converted to CeO2 nanosponges by heating to 350 °C in air (20 min). Finally, the CeO2 nanosponges are decorated with small-sized Pt nanoparticles using a wet-chemical process with Pt(ac)2 in methanol. The resulting Pt–CeO2 nanosponges (1 wt% Pt) show promising activity for the catalytic oxidation of CO, volatile organic compounds (VOCs), and NH3 with low light-out and light-off temperatures, and – in the case of the NH3 oxidation – good selectivity for N2 formation (>80% at 170–250 °C). Although the Pt–CeO2 nanosponges have not yet been optimized in detail, e.g., with respect to pore size and volume, the Pt loading and particle size or the specific conditions of the catalytic reactions, a further increase of the performance can be expected. The synthesis strategy using metal oxalates as precursors for high-surface-area metal oxides in the low-temperature conversion regime can be transferred also to other metal oxides. New material and catalyst concepts with promising results, finally, might also be transferable to other oxides and catalysts, supplemented by further screening in catalyst composition (e.g., variation in noble metal loading, testing under more realistic conditions, long-term durability tests).Experimental section
General
Ce(NO3)3·6H2O (extra pure, Merck), ethanol (99.9%, Seulberger), methanol (99.9%, Seulberger) K2C2O4·H2O (P. A., Merck) were handled as purchased. Pt(Ac)2 was prepared according to the literature.28Ce2(C2O4)3·10 H2O precursor particles
631 mg of Ce(NO3)3·6H2O were dissolved in 150 mL of ethanol. In addition, 442 mg of K2C2O4·H2O were dissolved in 15 mL of water. This latter solution was injected with intense stirring at room temperature to the Ce(NO3)3·6H2O solution. The immediate nucleation of the precursor particles was indicated by the formation of a suspension, which was stirred over night to yield crystalline Ce2(C2O4)3·10H2O. The as-prepared Ce2(C2O4)3·10H2O precursor particles were purified by centrifugation/resuspension twice from/in water. Finally, the Ce2(C2O4)3·10H2O precursor particles were dried at 70 °C over night.Thermal conversion of precursor particles to CeO2 nanosponges
The thermal conversion of the Ce2(C2O4)3·10H2O precursor particles to the CeO2 nanosponges with optimal performance was performed by heating at 350 °C for 20 min. Thereafter, the CeO2 nanosponges were redispersed/centrifuged twice in/from water to remove all remaining KNO3. Finally, the CeO2 nanosponges were dried at 70 °C over night.Modification with Pt nanoparticles
The CeO2 nanosponges were impregnated with Pt (1 wt%) by a wet-chemical process. To this concern, 4.2 mg of Pt(ac)2 were dissolved in 0.3 mL of methanol and dropped on 200 mg of a dried powder sample of the CeO2 nanosponges. This was conducted in two steps with addition of 0.15 mL for each and drying at 70 °C after each step. To obtain Pt nanoparticles, dried powder samples were treated in reducing-gas atmosphere (N2:H2 = 90:10) for 30 min at room temperature. The formation of Pt nanoparticles can be followed with the naked eye due to the color change from greenish-blue to grey.
CO oxidation
Sieved Pt–CeO2 nanosponge powders (5 mg, 125–250 μm grain size) were placed in quartz microreactors (Ø: 1.5 mm) with quartz-wool plugs in the front and at the back of the catalyst bed. A gas mixture of 50 mL min−1 with 1000 ppm CO and 10% O2 in He was dosed over that catalyst bed at ambient pressure. This corresponds to weight hourly space velocity (WHSV) of 30000 L gPt−1 h−1. The temperature was varied between 50–250 °C with a heating/cooling rate of 5 °C min−1. The outlet-gas composition was analyzed with an FT-IR spectrometer (Multigas 2030 Analyzer™, MKS Instruments) with a focus on the CO and CO2 concentration.
NH3 oxidation
For ammonia oxidation similar reaction conditions were used. Analogously, sieved Pt–CeO2 nanosponge powders (5 mg, 125–250 μm grain size) were used (quartz microreactors with Ø: 1.5 mm, WHSV of 30000 L gPt−1 h−1, FT-IR analysis with same analyzer as for CO-oxidation). For the experiments, a gas mixture of 50 mL min−1 with 1000 ppm NH3 and 10% O2 in He was dosed between 50–400 °C (heating/cooling rate of 10 °C min−1). The NH3 concentration together with that of possible reaction products (i.e., NO, N2O, NO2) was determined.
Formaldehyde oxidation
Analogously, sieved Pt–CeO2 nanosponge powders (5 mg, 125–250 μm grain size) were placed in the same quartz microreactors (Ø: 1.5 mm) and fixed in place using quartz-wool plugs. For the experiments, a gas mixture of 50 mL min−1 with 260 ppm formaldehyde and 10% O2 in He was dosed over that catalyst bed at ambient pressure (WHSV of 30000 L gPt−1 h−1). Formaldehyde was dosed using a gas saturator containing a commercial 16% formaldehyde solution in water (Science Services). The temperature was varied between 25–250 °C with a heating/cooling rate of 5 °C min−1. The outlet gas composition was analyzed by FT-IR determining the concentration of HCHO together with the possible reaction products (CO and CO2). Further details regarding the analytical equipment can be obtained from the ESI.†
Data availability
Additional data regarding experiments and methods can be obtained from the ESI† and on request from the authors.Conflicts of interest
The authors declare no competing financial interests.Acknowledgements
The authors acknowledge the Deutsche Forschungsgemeinschaft (DFG) for funding within the Collaborative Research Center 1441 “Tracking the Active Site in Heterogeneous Catalysis for Emission Control (TrackAct)” (Project-ID 426888090). C. B. M. and C. K. thank Dr Di Wang, INT, KNMFi, for discussions about the TEM based data acquisition and tomography. M. C., J. C. and J. D. G. furthermore thank Vasyl Marchuk for discussion on the catalytic results.References
- R. W. McCabe and A. Trovarelli, Appl. Catal., B, 2016, 197, 1 CrossRef CAS.
- A. F. Holleman and E. Wiberg, Anorganische Chemie, ed. de Gruyter, Berlin, 2017, vol. 1, p. 103 Search PubMed.
- S. N. Achary, S. K. Sali, N. K. Kulkarni, P. S. R. Krishna, A. B. Shinde and A. K. Tyagi, Chem. Mater., 2009, 21, 5848–5859 Search PubMed.
- (a) F. Maurer, J. Jelic, J. Wang, A. Gänzler, P. Dolcet, C. Wöll, Y. Wang, F. Studt, M. Casapu and J.-D. Grunwaldt, Nat. Catal., 2020, 3, 824–833 CrossRef CAS; (b) M. Yashima, Catal. Today, 2015, 253, 3–19 CrossRef CAS.
- (a) F. Maurer, A. Gänzler, P. Lott, B. Betz, M. Votsmeier, S. Loridant, P. Vernoux, V. Murzin, B. Bornmann, R. Frahm, O. Deutschmann, M. Casapu and J.-D. Grunwaldt, Ind. Eng. Chem. Res., 2021, 60, 6662–6675 CrossRef CAS; (b) Z. W. Chen, L. X. Chen, C. C. Yang and Q. Jiang, J. Mater. Chem. A, 2019, 7, 3492–3515 RSC; (c) G. C. Dhal, S. Dey, D. Mohan and R. Prasad, Catal. Rev., 2018, 60, 437–496 CrossRef CAS.
- P. Li, X. Chen, Y. Li and J. W. Schwank, Catal. Today, 2019, 327, 90–115 CrossRef CAS.
- (a) Y. Choi, S. K. Cha, H. Ha, S. Lee, H. K. Seo, J. Y. Lee, H. Y. Kim, S. O. Kim and W. C. Jung, Nat. Nanotechnol., 2019, 14, 245–251 CrossRef CAS PubMed; (b) J. Wang, X. Xiao, Y. Liu, K. Pan, H. Pang and S. Wei, J. Mater. Chem. A, 2019, 7, 17675–17702 RSC; (c) D. Zhao, Y. Pi, Q. Shao, Y. Feng, Y. Zhang and X. Huang, ACS Nano, 2018, 12, 6245–6251 Search PubMed.
- (a) S. Ranganathan and V. Sieber, Catalysis, 2018, 8, 379/1–379/22 CAS; (b) R. Dittmeyer, J.-D. Grunwaldt and A. Pashkova, Catal. Today, 2015, 248, 149–159 CrossRef CAS; (c) J. K. Edwards, S. J. Freakley, R. J. Lewis, J. C. Pritchard and G. J. Hutchings, Catal. Today, 2015, 248, 3–9 CrossRef CAS.
- Y. W. Hartati, S. N. Topkaya, S. Gaffar, H. H. Bahti and A. E. Cetin, RSC Adv., 2021, 11, 16216–16235 RSC.
- T. Montini, M. Melchionna, M. Monai and P. Fornasiero, Chem. Rev., 2016, 116, 5987–6041 CrossRef CAS.
- (a) D. Devaiah, L. H. Reddy, S.-E. Park and B. M. Reddy, Catal. Rev., 2018, 60, 177–277 CrossRef CAS; (b) D. M. Lyons, K. M. Ryan and M. A. Morris, J. Mater. Chem., 2002, 12, 1207–1212 RSC.
- M. Daturi, E. Finocchio, C. Binet, J.-C. Lavalley, F. Fally, V. Perrichon, H. Vidal, N. Hickey and J. Kaspar, J. Phys. Chem. B, 2000, 104, 9186–9194 CrossRef CAS.
- (a) X.-D. Zhou, W. Huebner and H. U. Anderson, Chem. Mater., 2003, 15, 378–382 Search PubMed; (b) A. Bumajdad, M. I. Zaki, J. Eastoe and L. Pasupulety, Langmuir, 2004, 20, 11223–11233 CrossRef.
- H. Gröger, F. Gyger, P. Leidinger, C. Zurmühl and C. Feldmann, Adv. Mater., 2009, 21, 1586–1590 Search PubMed.
- (a) M. Liebertseder, C. B. Maliakkal, M. Crone, G. Nails, M. Casapu, J.-D. Grunwaldt, M. Türk, C. Kübel and C. Feldmann, ChemCatChem, 2024, 16, e202301358 CrossRef; (b) M. Liebertseder, D. Wang, G. Cavusoglu, M. Casapu, S. Wang, S. Behrens, C. Kübel, J.-D. Grunwaldt and C. Feldmann, Nanoscale, 2021, 13, 2005–2011 Search PubMed.
- C. Fink, A. Hagemeyer, Z. Hogan, A. Volpe and J. Yoder, Curr. Catal., 2016, 5, 182–202 Search PubMed.
- (a) T. K. Kim, K. J. Lee, J. Y. Cheon, J. H. Lee, S. H. Joo and H. R. Moon, J. Am. Chem. Soc., 2013, 135, 8940–8946 Search PubMed; (b) D. Gu and F. Schüth, Chem. Soc. Rev., 2014, 43, 313–344 Search PubMed.
- (a) Z. Wang and R. Yu, Adv. Mater., 2019, 31, 1800592 Search PubMed; (b) C.-Y. Rao, Z.-M. Cui, C.-Q. Chen, W.-G. Song and W. Cai, J. Phys. Chem. C, 2010, 114, 9865–9870 CrossRef; (c) N. C. Strandwitz and G. D. Stucky, Chem. Mater., 2009, 21, 4577–4582 CrossRef.
- J. Lin, M. Yu, C. Lin and X. Liu, J. Phys. Chem. C, 2007, 111, 5835–5845 CrossRef.
- Y. Zhang, M. Chen, Z. Zhang, Z. Jiang, W. Shangguan and H. Einaga, Catal. Today, 2019, 327, 323–333 CrossRef.
- V. Typrpekl, P. Markova, M. Dopita, P. Brazd and M. A. Vacca, Inorg. Chem., 2019, 58, 10111–10118 CrossRef PubMed.
- C. Xie, Z. Niu, D. Kim, M. Li and P. Yang, Chem. Rev., 2020, 120, 1184–1249 CrossRef PubMed.
- A. M. Gänzler, B. Betz, S. Baier-Stegmaier, S. Belin, V. Briois, M. Votsmeier and M. Casapu, J. Phys. Chem. C, 2020, 124, 20090–20100 Search PubMed.
- A. M. Gänzler, M. Casapu, D. E. Doronkin, F. Maurer, P. Lott, P. Glatzel, M. Votsmeier, O. Deutschmann and J.-D. Grunwaldt, J. Phys. Chem. Lett., 2019, 10, 7698–7705 CrossRef PubMed.
- L. Artiglia, F. Orlando, K. Roy, R. Kopelent, O. Safonova, M. Nachtegaal, T. Huthwelker and J. A. van Bokhoven, J. Phys. Chem. Lett., 2017, 8, 102–108 CrossRef.
- N. Bosio, M. Di, M. Skoglundh, P.-A. Carlsson and H. Grönbeck, J. Phys. Chem. C, 2022, 126, 16164–16171 CrossRef.
- V. Marchuk, X. Huang, J. D. Grunwaldt and D. E. Doronkin, Catal. Sci. Technol., 2023, 13, 2946–2965 RSC.
- M. Basato, A. Biffis, G. Martinati, C. Tubaro, A. Venzo, P. Ganis and F. Benetollo, Inorg. Chim. Acta, 2003, 355, 399–403 CrossRef.
Footnote |
| † Electronic supplementary information (ESI) available: Details of the analytical techniques and equipment. See DOI: https://doi.org/10.1039/d4na00525b |
| This journal is © The Royal Society of Chemistry 2025 |