DOI:
10.1039/D5MA01096A
(Paper)
Mater. Adv., 2025,
6, 9761-9778
Investigation of electronic parameters, carrier transport mechanisms via the correlated barrier hopping model, electrothermal NTCR effects, and polarization contributions to the dielectric response of Ni3(PO4)2 orthophosphates synthesized by the sintering process
Received
23rd September 2025
, Accepted 3rd November 2025
First published on 10th November 2025
Abstract
Nickel orthophosphate, Ni3(PO4)2, was prepared through a conventional solid-state synthesis route and its crystal structure was verified by X-ray diffraction, confirming a monoclinic phase with space group P21/c. Optical studies using UV-Vis spectroscopy revealed strong absorption in the ultraviolet region, consistent with its semiconducting nature. The dielectric and electrical behaviors were systematically examined as functions of both temperature and frequency using impedance and electric modulus approaches, which allowed a clear distinction between grain and grain-boundary contributions, relaxation processes, and charge transport mechanisms. The temperature-dependent variation of the power-law exponent s(T) showed a decreasing trend, pointing to the correlated barrier hopping (CBH) mechanism as the dominant conduction process within the investigated temperature range (393–633 K). Based on this model, the maximum barrier energy was estimated as WM = 0.66 eV. Analysis of the impedance and modulus spectra confirmed a non-Debye type relaxation with well-resolved grain and grain-boundary contributions. The impedance data were successfully fitted using an equivalent R//C//CPE circuit, and the variation in resistance further confirmed the NTCR behavior. The material displays a notably high dielectric constant at low frequencies (ε′ ≈ 1.58 × 10⁴ at 633 K), reflecting effective polarization processes and thermally activated charge carrier motion. At higher frequencies, it preserves stable dielectric characteristics accompanied by moderate energy losses. Overall, these results establish a strong correlation between relaxation phenomena and hopping-based charge transport, highlighting Ni3(PO4)2 as a potential candidate for high-frequency dielectric and microelectronic device applications.
1. Introduction
Phosphate-based compounds have become a focal point of research due to their exceptional structural robustness, chemical adaptability, and versatile functional properties, making them suitable for a wide range of technological applications. These include solid-state electrolytes, high-performance dielectric components, energy storage devices, catalytic systems, and advanced communication technologies.1–5 Their crystal frameworks are built from PO43− tetrahedra, where strong covalent P–O bonds impart excellent thermal and chemical stability. This rigidity, combined with tuneable ionic and electronic transport properties, allows phosphate materials to be tailored for diverse functionalities, ranging from ceramic capacitors6 and microwave resonators7,8 to photovoltaic systems9,10 and emerging high-frequency devices for 5G/6G communications.11 Within this family, transition-metal phosphates stand out due to the synergy between the transition-metal cation's electronic configuration and the phosphate network. The A3(PO4)2 family, where A represents a divalent transition metal, has demonstrated remarkable potential, with examples including Mg3(PO4)2,12 Co3(PO4)2,13 and Cu3(PO4)2.7 It is well recognized that the integration of distinct compounds possessing superior electronic characteristics can give rise to advanced composite materials with enhanced functional performance. Such composites have garnered considerable technological interest in recent years due to their tenable physical properties and potential applications in electronics, energy storage, and catalysis.14 The introduction of a secondary phase can markedly improve key electronic parameters such as electrical conductivity, dielectric stability, and charge transport efficiency by promoting interfacial interactions and synergistic effects between the constituent phases.
In recent years, combining inorganic compounds with carbon-based materials such as graphene, carbon nanotubes, and carbon nanospheres has proven to be an effective approach for improving the electronic, dielectric, and catalytic properties of functional composites.15 The intrinsic high conductivity and large surface area of these carbon matrices enhance charge transport and strengthen interfacial polarization, thereby boosting the overall electronic performance of the hybrid systems. For example, the Na1.25Cr0.25Ti1.75(PO4)3/C anode material for sodium-ion batteries exhibited markedly enhanced electrochemical behavior and improved charge transport mechanisms.16 These findings highlight the considerable potential of carbon-based hybrid composites for the development of materials with optimized electronic and functional properties for advanced technological applications. The electronic properties of oxide- and transition-metal-based compounds are highly sensitive to stoichiometry, particularly the oxygen content.17 Deviations from ideal stoichiometry, including oxygen excess or deficiency, can alter the oxidation state of cations, thereby significantly affecting charge transport, dielectric response, and overall electronic behavior.
Nickel-based compounds have been widely studied due to their outstanding structural flexibility and diverse functional properties.18 For example, Ni2FeO419 and NiCo2O420 exhibit remarkable electrochemical performance and are extensively utilized in supercapacitors, gas sensors, and catalytic systems, attributed to their mixed-valence nature and high electrical conductivity. Nevertheless, metallic materials, hydroxides, and their alloys are often constrained by their limited resistance to aggressive environments, including elevated temperatures, oxidative atmospheres, and electromagnetic radiation. In contrast, oxide-based compounds display superior thermal and chemical stability, preserving their structural integrity and performance even at temperatures approaching 1000 °C.21 Moreover, metals, hydroxides, and their alloys typically suffer from substantial energy losses induced by eddy currents under alternating electromagnetic fields, which further restricts their use in high-frequency applications.22
Similarly, nickel phosphates such as Ni3(PO4)2,23 (NaNi4(PO4)3/GF),24 K2NiP2O7,25 and LiNiPO426 have attracted interest as potential candidates for dielectric, magnetic, and energy-storage applications. These compounds combine the stability of the phosphate framework with the redox activity of Ni2+ ions, favouring efficient charge transport and polarization phenomena. Furthermore, the incorporation of nickel ions into phosphate lattices can modulate the electronic structure and enhance relaxation processes through hopping or localized polaron mechanisms.23,27,28 Consequently, the study of Ni3(PO4)2 contributes not only to understanding the intrinsic dielectric and conduction behavior of nickel phosphates but also to exploring their potential for high-frequency and energy-related applications. Nickel orthophosphate (Ni3(PO4)2) crystallizes in the monoclinic space group P21/c with lattice parameters a = 5.8283(2) Å, b = 4.6931(1) Å, c = 10.0998(4) Å, and β = 91.1(2)°. In its crystal structure, Ni2+ ions are coordinated by oxygen atoms from phosphate groups, forming an extended three-dimensional framework.29 This arrangement offers potential pathways for polaron hopping and localized charge migration, making it an attractive candidate for both conduction and dielectric relaxation studies. Previous investigations on Ni3(PO4)2 have largely focused on its crystal chemistry, thermodynamic properties, and catalytic activity. However, comprehensive studies examining its dielectric performance, impedance behavior, and conduction mechanisms remain limited. Given the increasing demand for lead-free, thermally stable, and environmentally benign dielectric materials, a deeper understanding of the electrical transport and polarization mechanisms in Ni3(PO4)2 is both timely and essential. In particular, the influence of grain boundaries, defect states, and thermal activation on its AC and DC transport properties requires systematic exploration.
In phosphate frameworks containing PO4 units, electrical conduction often occurs via hopping mechanisms involving electron transfer between mixed-valence states such as P4+ and P5+.2,30,31 This process generates localized distortions in the lattice, giving rise to polarons quasiparticles formed by an electronic charge coupled with lattice deformation. The dynamics of these polarons are governed by factors such as temperature, bond length variations, lattice vacancies, and electron–phonon interactions, all of which influence the overall conductivity and dielectric relaxation behavior. Complex impedance spectroscopy (CIS) is a particularly powerful technique for probing such transport phenomena. By analysing frequency- and temperature-dependent impedance responses, CIS can separate the contributions of grains, grain boundaries, and electrode interfaces.32,33 It also allows for the determination of key dielectric and transport parameters such as relaxation frequencies, relaxation times, dielectric constants, conductivity, dielectric losses, and electric modulus and enables the construction of equivalent circuit models to simulate resistive and capacitive elements in polycrystalline ceramics under alternating electric fields.32–35
Numerous synthetic approaches have been reported for the preparation of oxide precursors, each providing control over the composition, particle size, morphology, and defect concentration of the final product.36 The choice of synthesis route plays a crucial role in determining the phase purity and functional performance of complex oxides, as demonstrated in systems such as Nd1−xBaxMnO3−δ.37 Phosphate ceramics can be synthesized through various routes, including solid-state reactions,35 sol–gel processing,38 hydrothermal synthesis,39 precipitation, and combustion methods.40 Among these, the conventional solid-state route is the most widely employed due to its simplicity, scalability, and cost-effectiveness. It relies on high-temperature diffusion between precursor powders to achieve complete phase formation, though it often requires extended heating to ensure full reaction and densification.39–41 In this work, Ni3(PO4)2 ceramic was synthesized via the solid-state reaction method and sintered at 900 °C. The optical band gap was determined using UV-Visible spectroscopy. A comprehensive investigation of its dielectric and transport properties was carried out over a wide temperature range (393–633 K) employing impedance (Z*), permittivity (ε*), electric modulus (M*), and electrical conductivity (σ*) formalisms. These findings offer valuable insights into the structure–property correlations in Ni3(PO4)2, underscoring its promise as a functional ceramic for energy storage, sensing, and frequency-dependent device applications.
2. Methodology
2.1 Solid-state process
Various synthesis methods have been developed for oxide precursors, enabling precise control over composition, particle size, morphology, and defect concentration.36 The selected synthesis route critically influences the phase purity and functional properties of complex oxides.37 In this study, Ni3(PO4)2 was synthesized using the conventional solid-state method. Eqn (1) illustrates the chemical reaction leading to the formation of the Ni3(PO4)2 compound.| | | 3NiO + 2NH4H2PO4 = Ni3(PO4)2 + 3H2O + 2NH3 | (1) |
Analytical-grade NiO, and NH4H2PO4 powders were accurately weighed in stoichiometric proportions and blended for 3 hours at ambient temperature using an agate mortar to ensure uniform mixing. The homogenized mixture was compacted into pellets with a diameter of 13 mm under a uniaxial load of 3 tons per cm2, followed by preheating on a hot plate at 350 °C for 10 hours to eliminate volatile species. The preheated material was subsequently ground for 1 hour and re-compacted into 8 mm pellets. These were sintered at 900 °C for 3 hours in an alumina crucible to facilitate phase formation and improve densification. The final sintered products reached approximately 97% of their theoretical density. A schematic representation of the synthesis steps is provided in Fig. 1.
 |
| | Fig. 1 Schematic illustration of the Ni3(PO4)2 synthesis process via the solid-state reaction method. | |
2.2 Instrumentation
Powder X-ray diffraction (PXRD) is a highly effective technique for assessing the crystallinity of the sample. Measurements were performed at room temperature using an 8D-Bruker Advance X-ray diffractometer, operating over a 2θ range of 10–80°, and equipped with a copper anode (CuKα, λ = 0.15406 Å).
A Shimadzu UV-3101PC spectrophotometer was employed to record the UV-Vis absorption spectrum of the powdered sample.
Electrical and dielectric measurements were performed using a Solartron 1260 impedance analyzer, covering a broad frequency range from 0.1 Hz to 1 MHz and a temperature range of 393–633 K. The dielectric characterization aimed to investigate grain and grain boundary contributions to the electrical properties of the prepared Ni3(PO4)2 pellets. The samples, fabricated in disc form with an 8 mm diameter and 1 mm thickness, were coated with a thin conductive layer (gold or silver) on both surfaces to ensure optimal and stable electrical contact. The pellets were placed between copper or platinum electrodes inside a temperature-controlled chamber equipped with a precision closed-loop feedback system, achieving a temperature resolution of 0.1 K and stability better than ±0.5 K. Measurements were carried out under standard atmospheric pressure with an applied AC voltage of 0.5 V, ensuring reproducible results over the entire frequency and temperature ranges.
3. Results with discussion
3.1. Experimental and theoretical structural studies
X-ray powder diffraction (XRPD) analysis confirmed that Ni3(PO4)2 crystallizes in the monoclinic system, adopting the P21/c space group. The diffraction pattern in Fig. 2 exhibits sharp and well-defined Bragg peaks, all of which are correctly indexed and precisely modelled, demonstrating the robustness of the structural refinement. Rietveld analysis of the room-temperature data yielded lattice parameters a = 5.843 Å, b = 4.692 Å, c = 10.088 Å, and β = 90.676°, in excellent agreement with literature values.29,42,43 The refinement quality, indicated by the agreement factors (RP = 5.46%, RWP = 7.33%, REXP = 2.62%, Table 1), confirms a high degree of correlation between the observed and calculated patterns. These results verify the successful synthesis of phase-pure Ni3(PO4)2.
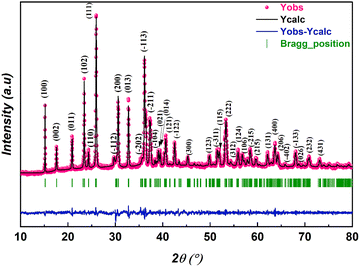 |
| | Fig. 2 Room-temperature Rietveld refinement of the X-ray powder diffraction pattern of Ni3(PO4)2 compound. | |
Table 1 Refined structural parameters of Ni3(PO4)2 compound at room temperature
| Formula |
Ni3(PO4)2 |
| Crystal system |
Monoclinic |
| Space-group |
P21/c |
| Cell parameters |
a = 5.843 Å |
|
b = 4.692 Å |
|
c = 10.088 Å |
|
β = 90.676° |
| Cell volume |
276.566 Å3 |
|
Z
|
2 |
| Atoms |
x
|
y
|
z
|
| Ni(1) |
0.5000 |
0 |
0 |
| Ni(2) |
0.2416 |
−0.0169 |
0.2751 |
| P |
0.2507 |
0.4200 |
0.0932 |
| O(1) |
0.2590 |
0.7416 |
0.1054 |
| O(2) |
0.2521 |
0.1964 |
0.4509 |
| O(3) |
0.0464 |
0.3013 |
0.1734 |
| O(4) |
0.4618 |
0.2671 |
0.1613 |
|
R-factors |
|
|
R
p/Rwp/Rexp (%) |
5.46/7.33/2.62 |
|
χ
2
|
1.06 |
The crystal structure of Ni3(PO4)2, shown in Fig. 3 and obtained from the Crystallographic Information File (CIF) of ICSD card no. 4269,43 consists of interconnected polyhedral units. Table 1 presents the fractional atomic coordinates of the atoms in the crystal structure. The positions of the oxygen atoms (O1–O4) indicate the arrangement of oxygen ions forming polyhedral units around Ni and P atoms, defining the overall crystal geometry, which consists of NiO6 octahedra and PO4 tetrahedra. These well-defined atomic positions also confirm the excellent stoichiometry of the Ni3(PO4)2 structure.44 Each [NiO6] octahedron shares oxygen edges with adjacent [NiO6] octahedra and is further linked to [PO4] tetrahedra through two common oxygen edges. Such connectivity may introduce O–O repulsion, which can weaken the [NiO6]–[PO4] interactions and influence the overall chemical stability of the lattice. However, the presence of strong covalent P–O bonds impart considerable structural integrity, ensuring that Ni3(PO4)2 remains chemically stable.
 |
| | Fig. 3 Crystal structure of Ni3(PO4)2 projected along the b-axis. | |
The crystallite size and its distribution typically increase with rising annealing temperature as a result of thermally activated grain growth.45 The enlargement of grains enhances intergranular connectivity, thereby facilitating charge transport through improved electronic and ionic pathways and consequently enhancing the capacitance behavior. In the present work, Ni3(PO4)2 was synthesized under optimized annealing conditions to achieve a single-phase structure with a homogeneous crystallite size distribution. Generally, elevated annealing temperatures promote further grain coarsening, which can improve transport characteristics; however, excessive thermal treatment may also trigger oxygen diffusion and mass transport, leading to the formation of vacancies or grain boundary defects that degrade dielectric and electrical performance.46–48
The average crystallite size of the Ni3(PO4)2 sample was determined from the most intense diffraction peak (2θ = 29.7959°) (Fig. 4(a)) using the Debye–Scherrer equation:46
| |  | (2) |
Here,
λ denotes the X-ray wavelength (1.54059 Å),
θ the diffraction angle, and
β the full width at half maximum (FWHM). Based on the above equation, the mean crystallite size is calculated to be around 48 nm. Furthermore, the Williamson–Hall (W–H) analysis was performed (
Fig. 4(b)). The procedure for constructing the W–H plot is described by
eqn (3):
47| | 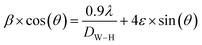 | (3) |
In the Williamson–Hall (W–H) method, 4
![[thin space (1/6-em)]](https://www.rsc.org/images/entities/char_2009.gif)
sin(
θ) was plotted along the
x-axis and
βcos(
θ) along the
y-axis. The average crystallite size obtained from the W–H plot is approximately 118 nm. It is noteworthy that the size calculated using the Scherrer equation is smaller than that estimated by the W–H model. This discrepancy arises from the fact that the Scherrer approach neglects the strain contribution (
ε), suggesting that the line broadening in the compound is influenced not only by crystallite size but also by lattice deformation.
48
 |
| | Fig. 4 (a) The Debye–Scherrer plot and (b) the Williamson–Hall plot for Ni3(PO4)2 compound. | |
3.2. Optical response by UV-Visible spectroscopy
The UV-Vis absorption and reflectance spectra of Ni3(PO4)2 (Fig. 5(a)) exhibit well-defined bands centred at 430, 474, 706, and 810 nm, along with a pronounced absorption edge below 300 nm in the ultraviolet range. This high-energy feature originates from charge transfer processes between O2− and Ni2+ ions, a phenomenon frequently observed in transition-metal phosphate systems.49,50 The peaks observed in the visible to near-infrared region are linked to intra-d electronic transitions of Ni2+ (3d8 configuration) under an octahedral crystal field. More precisely, the absorptions at ∼430 and 474 nm correspond to the 3A2g(F) → 3T1g(P) transition, whereas those near 706 and 810 nm are attributed to the 3A2g(F) → 3T1g(F) and 3A2g(F) → 3T2g(F) transitions, respectively.51–53 These optical signatures validate the octahedral environment of Ni2+ ions in the Ni3(PO4)2 lattice and align with reported spectra of related nickel-containing materials.54 The visible absorption is also responsible for the typical green appearance of nickel phosphates and highlights their promise for applications in optoelectronics and catalysis.
 |
| | Fig. 5 (a) UV-Visible absorption and reflectance spectra of Ni3(PO4)2. (b) Variation of the derivative of reflectance (dR/dλ) with respect to wavelength (λ). (c) Plots of (F(R)hν)1/2 and (F(R)hν)2 as functions of photon energy (hν). (d) Dependence of ln(αhν) on ln(hν-4.73). | |
The optical band gap is a fundamental parameter in many scientific domains, including photovoltaics, lasers, photocatalysis, light-emitting diodes, and photoluminescence.55 It represents the electronic transition at the absorption edge, corresponding to the energy difference between the highest occupied state of the valence band and the lowest unoccupied state of the conduction band.56 The band gap energy was evaluated using the Marotti method,57 which is based on plotting dR/dλ as a function of wavelength (λ). The band gap corresponds to the maximum point of this curve, as illustrated in Fig. 5(b), and was estimated using the relation Eg = 1240/262 ≈ 4.73 eV. To more accurately determine both the value and the nature of the optical band gap, the Schuster–Kubelka–Munk (SKM) model is often employed. This approach is widely used to analyse the absorption characteristics of semiconductors based on their diffuse reflectance spectra, as expressed by the following relation:58,59
| | 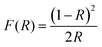 | (4) |
The optical band gap of the examined material can be estimated using Tauc's method, which is defined by the following equation:
60| | 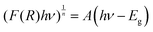 | (5) |
where “
hν” represents the photon energy, “
A” denotes the optical absorption coefficient, and “
n” takes the value of “1/2” for direct transitions or “2” for indirect transitions.
Fig. 5(c) presents the plots of (
F(
R)
hν)
2 and (
F(
R)
hν)
1/2 as a function of photon energy (
hν). From these curves, the optical band gap was extracted, yielding
Egd = 4.75 eV for the direct transition and
Egi = 4.36 eV for the indirect transition. To further verify the nature of the optical band gap (direct or indirect),
eqn (6) was rearranged, leading to the following expression:
| | | ln(F(R)hν) = ln(A) + nln(hν − Eg) | (6) |
From the linear fitting of the curve, a slope value of 0.53 was obtained (see
Fig. 5(d)), corresponding to
n ≈ 1/2, which confirms the direct nature of the optical transition in the Ni
3(PO
4)
2 compound. It is clear that there is only a slight difference between the band gap energy determined from the derivative method and that obtained from the Tauc plot, which can be attributed to the uncertainty Δ
Eg. These results further confirm that the compound possesses a well-defined direct band gap of 4.74 ± 0.01 eV. This nature of the band gap is consistent with those reported for other phosphate-based materials, such as α-KYP
2O
761 and K
2Ba
3(P
2O
7)
2.
62
Since the Ni3(PO4)2 compound shows direct band gap, we estimated the conduction band minimum (ECB) and valence band maximum (EVB) using the empirical formula:59
| | 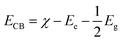 | (7) |
In this relation,
χ denotes the absolute electronegativity of the compound, whereas
Ee is a fundamental constant corresponding to the free-electron energy on the hydrogen scale, commonly taken as 4.5 eV. The electronegativity of the compound was estimated using the following relation:
59| |  | (9) |
In this framework,
α,
β, and
γ correspond to the atomic multiplicities of Ni, P, and O, respectively. From our calculations, the absolute electronegativity of the sample was found to be 6.5 eV. By combining this value with the calculated
EVB,
ECB, and
Egd, a schematic band structure was constructed, as shown in
Fig. 6(a).
 |
| | Fig. 6 (a) Schematic representation of the band structure. (b) Variation of ln(α) with incident photon energy. | |
The disorder in the material was evaluated by calculating the Urbach energy Eu, which is expressed as follows:63
| |  | (10) |
Based on the ln(
α)
versus hν plot (
Fig. 6(b)), the Urbach energy (
Eu) was found to be 0.47 eV. This relatively low value suggests that the material has minimal structural disorder.
3.3. Impedance spectral response analysis
3.3.1. Frequency dependence of the real and imaginary components of impedance.
Impedance spectroscopy (IS) is a powerful, non-destructive analytical method for examining phosphate-based electrolyte materials by monitoring their current response over a range of frequencies and temperatures. Since its first application in electrical engineering by Oliver Heaviside in 1880,64 IS has evolved to serve diverse domains such as dielectric, electrochemical, and bioelectrical analysis, with applications spanning biomaterials, photovoltaic devices, sensing, frequency-dependent device applications, and electrochemical systems.65,66 The technique enables separation of the electrical contributions from different regions of a material, including grain interiors (bulk), grain boundaries, and electrode–material interfaces, each characterized by distinct relaxation behaviors and resistive–capacitive properties.32 These features are identified through analysis of impedance spectra, which are often plotted in the complex plane to derive parameters such as resistance, capacitance, and relaxation time. Such parameters are determined using established theoretical models and impedance relations that link the real (Z′) and imaginary (Z′′) components of the complex impedance vector (Z*):Fig. 7(a) presents the variation of the real component of the complex impedance (Z′) with angular frequency for the Ni3(PO4)2 material over the temperature range of 393–633 K. The frequency response reveals two distinct regions. In the low-frequency range, Z′ remains almost constant, signifying DC conduction dominated by long-range charge migration, where carriers successfully hop between adjacent sites.2,67,68 At higher frequencies, Z′ displays a pronounced dispersion, which is associated with AC conduction arising from localized carrier motion and incomplete hopping events. This behavior indicates the coexistence of two conduction mechanisms: extended-range charge transport at low frequencies and localized relaxation processes at high frequencies, which contribute to AC conductivity.
 |
| | Fig. 7 (a) Temperature-dependent variation of the real component of complex impedance (Z′) with angular frequency in the range of 393–633 K. (b) Temperature-dependent variation of the imaginary component of complex impedance (Z′′) with angular frequency in the range of 393–633 K. | |
As the temperature increases, the frequency at which Z′ begins to deviate from its low-frequency plateau shifts toward higher values from around 18 rad s−1 at 393 K to approximately 800 rad s−1 at 633 K implying a thermally activated relaxation process. In the high-frequency region, Z′ approaches a minimum, nearly temperature-independent value, suggesting that thermal energy reduces barriers to charge movement. Conversely, in the low-frequency regime, Z′ decreases noticeably with rising temperature, reflecting a negative temperature coefficient of resistance (NTCR). This behavior is characteristic of semiconductors and confirms the material's NTC thermistor nature.32,35
The imaginary part of the impedance spectrum serves as a key indicator of the dielectric relaxation characteristics of the Ni3(PO4)2 material, which arise from either charge carrier motion or the reorientation of dipolar groups when subjected to an external electric field. In Fig. 7(b), the variation of −Z′′ with angular frequency is presented for temperatures between 393 K and 633 K, illustrating how relaxation dynamics evolve with increasing thermal energy. Each curve displays a distinct peak, marking the transition region between DC and AC conduction, consistent with the features observed in the Z′ spectra (Fig. 7(a)). This peak, known as the relaxation frequency, represents the crossover from extended charge transport to more localized carrier motion. The progressive broadening of these peaks with temperature suggests a deviation from the ideal Debye relaxation behavior,69 highlighting the intricate interplay between polarization and conduction mechanisms in the system. At frequencies below the peak, charge transport is dominated by long-range hopping processes, while frequencies above the peak are primarily associated with localized relaxation effects.
Fig. 8(a) presents the variation of relaxation time (τ), extracted from the Z′′ data, as a function of temperature. A noticeable decrease in τ with increasing temperature reveals a thermally activated relaxation mechanism. This behavior is primarily associated with ionic conduction, likely governed by polaron hopping facilitated by local lattice vibrations, often referred to as “rattling” motions. The reduction in τ reflects enhanced charge carrier mobility and progressive delocalization.70,71 Moreover, this evolution is accompanied by a tendency toward more uniform relaxation, approaching Debye-like behavior at higher temperatures, indicative of a narrowing relaxation time distribution.
 |
| | Fig. 8 (a) Temperature dependence of the relaxation time (τ). (b) Normalized variation of  as a function of ω/ωmax at different temperatures for the Ni3(PO4)2 compound. as a function of ω/ωmax at different temperatures for the Ni3(PO4)2 compound. | |
For further insight, the imaginary part of the electric impedance, Z′′(ω,T), was normalized by its maximum value,  , and plotted against the logarithm of the normalized angular frequency, log(ω/ωmax), where ωmax corresponds to the peak-loss frequency. Here, T denotes temperature. The convergence of impedance loss curves obtained at different temperatures into a single master curve suggests that the relaxation time distribution is temperature-independent. As depicted in Fig. 8(b), the nearly perfect overlap of the curves confirms that the relaxation dynamics remain unchanged over the investigated temperature range.72
3.3.2. Nyquist plot representation analysis (−Z′′ vs. Z′).
The Nyquist plot, serves as an effective tool for exploring the electrical response of materials. It enables the identification of surface layer formation due to undesirable chemical processes such as oxidation or hydration, and it reveals interfacial effects at the electrode–material interface. Furthermore, Nyquist analysis provides valuable information on the type and mobility of charge carriers, as well as on the separate contributions from the bulk (grain) and interfacial (grain boundary) regions of the material.32Fig. 9(a) presents the complex impedance spectra in Nyquist form, displaying depressed and asymmetric semicircular arcs whose diameters decrease progressively with increasing temperature. This trend reflects non-Debye relaxation, associated with a distribution of relaxation times arising from heterogeneous dipolar environments within the sample.73 A single arc in the plot may appear in two situations: (i) when grain boundaries are highly conductive, resulting in negligible impedance and no distinct arc, or (ii) when the bulk phase exhibits high conductivity, minimizing its impedance contribution and leaving only the grain boundary response visible. The shift of the real-axis intercept and the peak frequency of the semicircular arcs toward the origin with temperature rise indicates enhanced electrical conductivity.
 |
| | Fig. 9 (a) Nyquist plots (Z′′ vs. Z′) for Ni3(PO4)2 compound at various temperatures. (b) Schematic illustration along with the sample geometry for CIS measurement and the equivalent circuit model used to fit the data. | |
To quantitatively assess the grain boundary contribution, the depressed semicircular arcs were analyzed using an equivalent circuit model in ZView software,61,62 as illustrated in Fig. 9(b). This figure presents both the sample geometry used for complex impedance spectroscopy (CIS) measurements and the corresponding equivalent circuit, comprising a resistor (R), a capacitor (C), and a constant phase element (CPE) in parallel. This configuration effectively models the non-ideal dielectric behavior, allowing a clear distinction between bulk and grain boundary contributions. During the ZView fitting process, the constant phase element (CPE) is typically characterized by two parameters, CPE-T (Q) and CPE-P (α), and is mathematically defined as:
| | 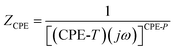 | (12) |
Here, CPE-
T is expressed in units of capacitance, while the angular frequency (
ω) is given in radians per second. The exponent CPE-
P takes values of 1, 0, and 0.5, corresponding to ideal capacitive, resistive, and Warburg-type behaviors, respectively.
74 The parameters obtained from the equivalent circuit fitting are summarized in
Table 2, which lists the calculated resistance (
R), capacitance (
C), and constant phase element (CPE) values for the Ni
3(PO
4)
2 compound. The high grain boundary resistance is likely due to structural defects such as voids or micro-gaps in these regions. The measured capacitance values, on the order of ∼10
−11 F for C and ∼10
−10 F for Q, suggest that at higher frequencies, conduction is predominantly confined to the grains, whereas at lower frequencies, it is mainly governed by grain boundary effects. The increase of both parameters with temperature suggests enhanced dielectric polarization and improved charge carrier mobility within the material.
Table 2 Electrical parameters extracted from ZView fitting at selected temperatures
|
T (K) |
R (107 Ω) |
C (10−11 F) |
CPE-T (10−10 F) |
CPE-P |
| 393 |
30.75 |
3.418 |
1.063 |
0.60456 |
| 413 |
23.99 |
3.424 |
1.091 |
0.57810 |
| 433 |
19.33 |
3.433 |
1.359 |
0.54744 |
| 453 |
14.82 |
3.441 |
1.711 |
0.61646 |
| 473 |
12.04 |
3.449 |
1.942 |
0.54243 |
| 493 |
9.492 |
3.466 |
2.146 |
0.53375 |
| 513 |
7.425 |
3.477 |
2.474 |
0.51353 |
| 533 |
5.710 |
3.488 |
2.699 |
0.53197 |
| 553 |
4.397 |
3.498 |
2.809 |
0.58448 |
| 573 |
3.545 |
3.512 |
3.145 |
0.56844 |
| 593 |
2.831 |
3.531 |
3.538 |
0.55779 |
| 613 |
2.365 |
3.546 |
4.052 |
0.54754 |
| 633 |
2.083 |
3.56 |
4.462 |
0.54283 |
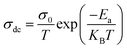
Fig. 10 illustrates the temperature dependence of the electrical resistivity of the prepared solid Ni3(PO4)2 over a wide temperature range (393–633 K). The results reveal an exponential decrease in resistivity with increasing temperature, confirming the semiconducting nature of the sample. This behavior is attributed to thermally activated charge carriers gaining higher mobility at elevated temperatures, which is characteristic of a negative temperature coefficient of resistance (NTCR) and reflects the thermal sensitivity of both resistive and capacitive components.32
 |
| | Fig. 10 Evolution of the resistivity against the temperature. | |
3.4. Electrical conduction: from DC to AC regimes
Analyzing the electrical conductivity (σ) as a function of frequency and temperature is crucial for understanding the sample's electrical response and identifying the dominant conduction mechanism. The conductivity is evaluated using the following relation:| | 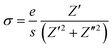 | (13) |
Where “e” and “s” refer to the thickness and area of the pellet, respectively.
Fig. 11(a) illustrates the frequency-dependent conductivity spectra of Ni3(PO4)2 measured over the temperature range 393–633 K. The spectra exhibit two main regions: a frequency-independent plateau at low frequencies and a dispersive region extending up to ∼100 rad s−1. Beyond this range, a slope-changing dispersive regime emerges, progressively shifting toward higher frequencies as the temperature increases. The low-frequency plateau reflects the long-range transport of charge carriers through hopping processes, corresponding to the DC conductivity of the material. In this regime, carrier motion can be approximated as hopping within an extended lattice of equivalent potential wells. The dispersive region up to 100 rad s−1 is attributed to short-range hopping between localized sites, confined to a double-well potential separated by large barriers, enabling forward–backward hopping.75,76 Under the influence of an AC electric field, this process becomes perturbed, resulting in an exponential rise in conductivity.76 At frequencies exceeding 100 rad s−1, the response is dominated by localized carrier dynamics, most likely associated with polaron hopping coupled with anharmonic lattice vibrations in the Ni3(PO4)2 framework. With increasing frequency, the conductivity continues to rise. At elevated temperatures, the DC plateau in the low-frequency region becomes more dominant compared to lower temperatures. The critical frequency at which the conductivity deviates from the DC plateau and begins to increase is identified as the hopping frequency (ωH). Hence, the conductivity response across the studied temperature interval can be accurately modeled by Jonscher's universal power law:75
| | 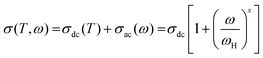 | (14) |
In this relation, the frequency exponent
s lies within the range 0 <
s < 1,
75 and its value is influenced by the degree of interaction among mobile ions. According to Jonscher's model, the frequency dependence of conductivity originates from relaxation processes driven by mobile charge carriers. When a charge carrier hops from one site to another, it resides transiently between two potential energy minima before completing the transition. To gain a deeper understanding of AC conduction, it is essential to analyze how the frequency exponent “
s” varies with both temperature and frequency. Various theoretical models such as Quantum Mechanical Tunneling (QMT), Correlated Barrier Hopping (CBH), Small Polaron Tunneling (SPT), and Overlapping Large Polaron Tunneling (OLPT) have been proposed to interpret these conduction processes.
77–80 In their work, Nowick and co-workers
81 suggested employing a normalized conductivity
versus frequency plot to minimize DC conductivity contributions when extracting the Jonscher exponent “
s”. The resulting plot (
Fig. 11(b)) demonstrates a clear linear region with slope “
s”, which characterizes the degree of interaction among charge carriers participating in the polarization and transport mechanisms.
 |
| | Fig. 11 (a) Frequency-dependent variation of the electrical conductivity of Ni3(PO4)2 at different temperatures. (b) Frequency dependence of (σ − σdc)/σdcvs. frequency plots at different temperatures. (c) variation of frequency exponent “s” against temperature. (d) Schematic model of the AC conduction mechanism in Ni3(PO4)2. | |
Fig. 11(c) illustrates the temperature dependence of the frequency exponent s for Ni3(PO4)2. A gradual decrease in s is observed within the 393–633 K range, indicating that the conduction mechanism in this compound is consistent with the Correlated Barrier Hopping (CBH) model.79,82 Within the framework of this model, the exponent “s” is expressed by the following relation:83
| |  | (15) |
The self-trapping energy (
WM), determined from
eqn (15) in
Fig. 11(c), is found to be 0.66 eV. The electrical transport in Ni
3(PO
4)
2 is mainly controlled by a small-polaron hopping process, in which charge carriers become localized on Ni sites and move between adjacent Ni ions through successive Ni
2+/Ni
3+ redox transitions. This hopping is accompanied by a local lattice distortion within the phosphate network, characteristic of polaronic conduction.
Fig. 11(d) depicts the carrier hopping process in Ni
3(PO
4)
2, which is predominantly governed by the Correlated Barrier Hopping (CBH) mechanism. In this model, electronic conduction originates from thermally activated hopping of localized electrons between neighboring Ni cation sites, with the phosphate framework playing a crucial role in modulating the potential barriers that control carrier motion. At high frequencies, the charge transport becomes increasingly restricted to short-range polaron hopping, reflecting localized carrier dynamics. As the temperature rises, the effective potential barriers decrease, thereby enhancing carrier mobility and facilitating more efficient charge transport. The dominance of the CBH mechanism in Ni
3(PO
4)
2 aligns well with observations in related phosphate systems such as K
2NiP
2O
7,
25 LiNi
1.5P
2O
7,
84 Na
3.6Ni
2.2(P
2O
7)
2,
85 and TlFeP
2O
72 (see
Table 3), confirming that thermally activated hopping between localized states governs the conduction behavior consistent with the non-Debye relaxation character of these materials.
Table 3 Reported activation energies (Ea), dielectric constants (ε′), and conduction models of phosphate-based compounds
| Compound |
Temperature range (K) |
Activation energy (eV) |
ε′ |
Conduction model |
Ref. |
| K2NiP2O7 |
603–728 |
1 |
≈103 |
CBH |
25
|
| LiNiPO4 |
423–573 |
0.68 |
≈2 × 10⁴ |
— |
26 and 86
|
| LiNi1.5P2O7 |
633–723 |
0.85 |
— |
CBH |
84
|
| Na3.6Ni2.2(P2O7)2 |
594–710 |
1.03 |
— |
CBH |
85
|
| SrNiP2O7 |
609–728 |
0.97 |
— |
OLPT |
87
|
| NaMn4(PO4)3 |
300–573 |
— |
≈90 |
— |
10
|
| TlFeP2O7 |
473–673 |
0.52–1.3 |
≈3 × 10⁴ |
CBH |
2
|
| CsFeP2O7 |
453–673 |
0.13–0.44 |
≈2 × 10³ |
— |
35
|
| Ni3(PO4)2 |
393–633 |
0.28 |
1.58 × 10⁴ |
CBH |
This work |
To assess the activation energy in Ni3(PO4)2, Fig. 12 displays the plot of ln(σdc × T) against 1000/T. The activation energy (Ea) was extracted from this relationship using the following equation:83
| |  | (16) |
Here,
Ea represents the activation energy,
kB is the Boltzmann constant, and
T is the absolute temperature in kelvin. The activation energy determined for Ni
3(PO
4)
2 is 0.28 eV, which is markedly lower than that of other Ni-based phosphate compounds, including LiNiPO
4,
86 LiNi
1.5P
2O
7,
84 and K
2NiP
2O
7,
25 and Ni-based other compounds listed in
Table 3. This relatively small value indicates that charge carriers in Ni
3(PO
4)
2 require significantly less thermal energy to surmount the potential barriers governing conduction. In alkali-containing nickel phosphates, the presence of Li
+ or K
+ ions introduces additional electrostatic interactions and structural constraints, which can restrict carrier mobility and raise the energy barriers for hopping or migration. By contrast, the simpler framework of Ni
3(PO
4)
2, composed only of Ni
2+ and phosphate groups, offers more open conduction pathways with reduced potential barriers, thus favoring charge transport at lower thermal energies.
 |
| | Fig. 12 Plot of ln(σdc × T) versus 1000/T. | |
3.5. Frequency-dependent dielectric polarization analysis
In recent years, inorganic phosphate materials have attracted considerable interest due to their remarkable dielectric properties.26,88,89 In this work, the dielectric behavior of the synthesized Ni3(PO4)2 ceramic was investigated by analyzing the effects of frequency and temperature on the real part of the dielectric permittivity (ε′) and the dielectric loss factor (tanδ). As shown in Fig. 13(a), ε′ exhibits a strong dependence on both frequency and temperature. At lower frequencies, the permittivity values are significantly higher and increase with temperature, reaching around 1.58 × 10⁴ at 633 K. In this work, the real part of the dielectric permittivity (ε′) was calculated from the complex impedance measurements using the following relation:35| | 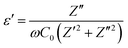 | (17) |
The capacitance (C0) is determined using the relation (C0 = (ε0A)/d)), where (ε0) is the permittivity of free space, “A” is the electrode area, and “d” is the thickness of the pellet.
 |
| | Fig. 13 (a) Frequency dependence of the real dielectric constant (ε′) for Ni3(PO4)2, with inset showing the grain and grain boundary structure. (b) Variation of tanδ with angular frequency at different temperatures for Ni3(PO4)2. | |
The real part of the dielectric constant (ε′) indicates how effectively a material can store electric energy under an applied field. As shown in Fig. 13(a), ε′ is relatively high at low frequencies but gradually decreases as the frequency increases. This behavior is attributed to the combined effects of various polarization processes, including interfacial (space charge) and dipolar polarization, which govern the material's electrical response.90,91 At higher frequencies, slower polarization mechanisms cannot follow the rapidly oscillating field, leading to a reduction in ε′. At low frequencies (Region I, <102 rad s−1), interfacial polarization dominates due to charge accumulation at grain boundaries and interfaces. At higher frequencies (Region II), dipolar polarization becomes more significant. Both contributions decrease as frequency continues to rise.92 Additionally, ε′ decreases with decreasing temperature because charge carriers become less mobile and respond more slowly to the applied field. The dielectric constant of Ni3(PO4)2 reaches approximately 1.58 × 10⁴ at 633 K, reflecting its strong ability to resist electric field penetration and sustain polarization.69 As shown in Table 3, most phosphate-based compounds exhibit comparably high dielectric constants in the range of 103–104, confirming their high polarizability and suitability for dielectric applications. Ni3(PO4)2 stand out for their pronounced dielectric responses, which may arise from efficient polarization processes involving defect dipoles, space charge accumulation, or localized hopping of charge carriers.
The pronounced dielectric response is primarily influenced by interfacial effects, particularly space charge polarization at grain boundaries, in line with the Maxwell–Wagner model.93,94 This occurs in heterogeneous materials where conductive grains are separated by less conductive boundaries (inset Fig. 13(a)). Under low-frequency electric fields, charges accumulate at these interfaces, enhancing polarization.94 The extent of this effect depends on differences in conductivity and permittivity between grains and boundaries, structural imperfections, and temperature. As the temperature rises, increased carrier mobility strengthens interfacial polarization, resulting in higher ε′. Unlike intrinsic dipolar contributions, this mechanism arises mainly from the microstructural arrangement of the material.
To further examine the stability of the dielectric response at high frequencies, the dielectric properties of the studied compound were analyzed over the temperature range of 393–633 K, as summarized in Table 4. At each temperature, the dielectric constant (ε′) shows a slight decrease with increasing frequency; for example, at 393 K, ε′ values are 75.2 (1 kHz), 71.6 (10 kHz), and 69.6 (100 kHz). Similarly, the dielectric loss (tanδ) diminishes with frequency, indicating that energy dissipation is somewhat higher at lower frequencies but remains low across the high-frequency range. At a fixed frequency, both ε′ and tanδ gradually increase with temperature for instance, at 10 kHz, ε′ rises from 71.6 at 393 K to 76.7 at 633 K, while tanδ increases from 0.0269 to 0.0695. This behavior reflects thermally activated dipolar motion, which enhances dielectric polarization as the temperature rises. Even at the highest measured temperature, dielectric losses remain moderate (e.g., tanδ = 0.309 at 1 kHz and 633 K), indicating good stability of the dielectric response. Overall, the material demonstrates consistent high-frequency dielectric behavior with moderate energy dissipation, suggesting its potential suitability for high-frequency electronic or dielectric applications.
Table 4 Dielectric constant (ε′) and loss tangent (tanδ) of the studied compound as a function of temperature at selected frequencies (1, 10, 100 kHz)
| Frequency (kHz) |
100 |
10 |
1 |
| Temperature (K) |
ε′ |
tanδ |
ε′ |
tanδ |
ε′ |
tanδ |
| 393 |
69.6 |
0.0182 |
71.6 |
0.0269 |
75.2 |
0.0633 |
| 413 |
69.8 |
0.0189 |
71.9 |
0.0268 |
75.5 |
0.0631 |
| 433 |
70.1 |
0.0198 |
72.3 |
0.0291 |
75.9 |
0.0709 |
| 453 |
70.4 |
0.0206 |
72.6 |
0.0303 |
76.3 |
0.0804 |
| 473 |
70.7 |
0.0210 |
72.9 |
0.0327 |
76.6 |
0.100 |
| 493 |
71 |
0.0219 |
73.4 |
0.0350 |
76.9 |
0.115 |
| 513 |
71.3 |
0.0222 |
73.7 |
0.0353 |
77.6 |
0.126 |
| 533 |
71.7 |
0.0237 |
73.8 |
0.0368 |
78.1 |
0.151 |
| 553 |
72.1 |
0.0248 |
74.7 |
0.0476 |
80.4 |
0.182 |
| 573 |
72.4 |
0.0258 |
75.2 |
0.0529 |
81.4 |
0.212 |
| 593 |
72.8 |
0.0269 |
75.7 |
0.0588 |
82.5 |
0.246 |
| 613 |
73.2 |
0.0281 |
76.3 |
0.0647 |
83.6 |
0.282 |
| 633 |
73.5 |
0.0287 |
76.7 |
0.0695 |
84.4 |
0.309 |
The dielectric loss factor (tanδ) characterizes the ratio between the energy dissipated (ε′′) and the energy stored (ε′) within the material.95 A larger tanδ value reflects stronger energy dissipation, typically associated with resistive contributions or relaxation processes caused by structural defects. Conversely, a smaller tanδ indicates lower dielectric losses, enhancing the suitability of the material for energy storage applications. Analyzing the variation of tanδ with frequency and temperature provides essential information about the balance between storage and dissipation mechanisms, thereby supporting the overall dielectric assessment. The dissipation factor can be expressed mathematically as:
| |  | (18) |
Fig. 13(b) illustrates that the loss tangent (tan
δ) for Ni
3(PO
4)
2 ranges from about 25 at low frequencies to nearly 0.02 at high frequencies. The variation of tan
δ with frequency reveals a consistent decrease across all investigated temperatures (393–633 K), accompanied by a dispersion in the low-frequency region. According to Koop's theory, imperfections within the material introduce potential barriers that hinder the mobility of charge carriers.
96 This behavior is characteristic of thermally activated dielectric relaxation, where the loss peak arises from energy dissipation associated with the dynamic hopping of charge carriers.
32,87 The dielectric loss increases progressively with temperature due to the higher thermal energy, which enhances both carrier mobility and the population of thermally excited charge carriers. At lower temperatures, the reduced carrier mobility suppresses conduction, leading to weaker dielectric losses. In contrast, at elevated temperatures, the combined effects of intensified hopping transport and interfacial polarization result in higher conductivity and a more pronounced dielectric loss response.
97,98
3.6. Analysis of electric modulus spectra and dielectric relaxation behavior
The complex electric modulus is a powerful tool for investigating the detailed electrical and dielectric characteristics of materials, providing deeper understanding of the underlying mechanisms. In phosphate-based systems, many studies have shown that modulus analysis effectively uncovers the key processes governing dielectric relaxation.2,4,35 This approach is especially useful for detecting secondary effects that may be difficult to resolve or that overlap in standard impedance spectroscopy due to differences in relaxation time constants.82,98 The complex modulus, M*, can be expressed in terms of the complex dielectric permittivity (ε*) as follows:98| | 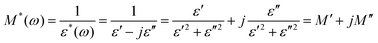 | (19) |
Fig. 14 displays the complex diagrams plots of the complex modulus over the investigated frequency and temperature ranges. Unlike Nyquist plots of complex impedance, which primarily emphasize the most resistive components of the material and thus provide limited sensitivity to the least capacitive contributions, the modulus representation proves particularly effective in separating electrode-related effects. In these plots, the frequency increases from left to right along the real axis (M′). All curves originate at zero, confirming the absence of electrode polarization effects.91 Across the studied temperature range, the semicircles observed on the right correspond to the high-frequency response of the grains, while those on the left are linked to the low-frequency response of grain boundaries. The appearance of these arcs clearly demonstrates that both grain and grain boundary capacitances play an active role in the conduction process of the material.
 |
| | Fig. 14 Complex diagrams of electric modulus, at various temperatures. | |
Fig. 15(a) shows the temperature- and frequency-dependent variation of the real part of the complex modulus (M′) for the synthesized Ni3(PO4)2 compound. At low frequencies, M′ remains nearly zero, indicating negligible electrode polarization. As the frequency increases, a noticeable dispersion emerges, which is associated with the localized motion of charge carriers.91,98 At higher frequencies, M′ reaches asymptotic values, reflecting the reduced influence of the external electric field on charge-carrier dynamics.
 |
| | Fig. 15 (a) Evolutions of real part M′ of complex electric modulus as a function of angular frequency. (b) Imaginary part (M′′) of the electric modulus versus angular frequency at various temperatures. | |
Fig. 15(b) shows the variation of the imaginary component of the electric modulus (M′′) with frequency for Ni3(PO4)2 ceramic across the studied temperature range. The spectra reveal a distinct relaxation peak (ωp) at each temperature, which is mainly attributed to grain boundary effects. The occurrence of these peaks confirms the existence of a relaxation process linked to the transition from localized (short-range) to extended (long-range) charge carrier dynamics.99 At frequencies lower than ωp, electrical conduction is governed by long-range hopping of charges, whereas at higher frequencies, carriers are restricted to localized states.100 The presence of short-range hopping contributions becomes evident above the relaxation frequency. With increasing temperature, the peaks gradually shift toward higher frequencies and display asymmetric broadening, indicating enhanced relaxation processes caused by thermally activated charge carriers. Such behavior highlights the non-Debye nature of relaxation in Ni3(PO4)2.101
To gain further insight into the dielectric relaxation mechanism from the frequency dependence of M′′, the modulus parameters  was evaluated using the following expression:98
| | 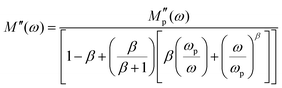 | (20) |
In this analysis, M′′(ω) denotes the imaginary part of the electric modulus, while  represents its maximum value. The angular frequency is expressed as ω, and ωp corresponds to the frequency at which M′′(ω) attains its peak. The parameter β describes the degree of broadening in the modulus spectrum and quantifies the deviation from ideal Debye-type relaxation (with 0 < β ≤ 1). Physically, the exponent β provides key insight into the relaxation dynamics of the material: for an ideal dielectric, β = 1, reflecting the abseznce of significant dipole–dipole interactions, typical of Debye relaxation. When β < 1, however, the system exhibits notable dipole–dipole interactions, signifying a non-Debye relaxation process. Table 5 presents the temperature dependence of the parameters obtained from fitting the results of eqn (20).
Table 5 Summarizes the parameters extracted from eqn (20) applied to the frequency-dependent modulus (M′′) data
|
T (K) |

|
ω
p
|
β
|
| 633 |
0.00526 |
1577.46 |
0.80568 |
| 613 |
0.00522 |
1467.86 |
0.80293 |
| 593 |
0.00523 |
1253.02 |
0.80410 |
| 573 |
0.00527 |
995.31 |
0.79981 |
| 553 |
0.00527 |
790.60 |
0.78362 |
| 533 |
0.00538 |
628 |
0.77562 |
| 513 |
0.00527 |
498.83 |
0.77161 |
| 493 |
0.00547 |
396.24 |
0.76025 |
| 473 |
0.00543 |
314.745 |
0.75853 |
| 453 |
0.00540 |
250.011 |
0.74804 |
| 433 |
0.00548 |
198.59 |
0.74204 |
| 413 |
0.00563 |
157.74 |
0.73236 |
| 393 |
0.00561 |
125.30 |
0.72626 |
For Ni3(PO4)2, the β parameter remains below 1 throughout the studied temperature range, confirming the non-Debye nature of the conduction mechanism (Table 5). Moreover, β increases gradually with rising temperature, which can be attributed to the thermal activation of charge carriers. As temperature increases, the mobility of these carriers improves and dipole–dipole interactions become less dominant, leading to a narrowing of the relaxation time distribution. This trend reflects a progressive shift toward more uniform relaxation dynamics, although still deviating from the ideal Debye behavior.
To determine the activation energies linked to electrical relaxation, the relaxation peak frequencies (ωp) were extracted from the high-frequency peaks observed in the modulus spectra. Fig. 16 shows the logarithmic variation of (ωp × T) as a function of 1000/T, confirming that the (ωp) peaks obey the Arrhenius law. The activation energy was determined to be Ea = 0.26 eV. This value, in close agreement with that obtained from DC conductivity measurements, highlights a strong correlation between the relaxation dynamics and the charge transport mechanism in the Ni3(PO4)2 system.
 |
| | Fig. 16 Variation of ln(ωp × T) as a function of 1000/T for the Ni3(PO4)2 sample. | |
4. Conclusion
With the increasing interest in inorganic phosphates, this work explores the structural, optical, electrical, and dielectric properties of Ni3(PO4)2 synthesized by a conventional solid-state reaction. The synthesis route employed is both cost-effective and scalable, enhancing the material's potential for industrial use. X-ray diffraction (XRD) confirmed the phase purity and revealed a monoclinic structure consistent with crystallographic calculations. Optical analysis revealed a wide band gap of 4.74 ± 0.01 eV, indicative of semiconducting behavior. Impedance spectroscopy demonstrated thermally activated electrical conduction with a non-Debye relaxation process, while DC conductivity followed the Arrhenius law with an activation energy of 0.28 eV, significantly lower than that of related Ni-based phosphates. The decrease of the frequency exponent s with temperature further confirms that charge transport is governed by the Correlated Barrier Hopping (CBH) mechanism. At low frequencies, the dielectric permittivity exhibits very high values (ε′ ≈ 1.58 × 10⁴ at 633 K), which increase with temperature due to interfacial polarization at grain boundaries, consistent with the Maxwell–Wagner model. The material also maintains stable high-frequency dielectric behavior with moderate energy dissipation, highlighting its efficient polarization response. Overall, the combination of structural stability, low activation energy, and strong dielectric performance positions Ni3(PO4)2 as a promising candidate for high-permittivity components, energy storage devices, and high-frequency electronic applications.
Conflicts of interest
The authors declare that they have no known competing financial interests or personal relationships that could have appeared to influence the work reported in this paper.
Data availability
All data relevant to this study are available from the corresponding author upon reasonable request.
References
- P. Lei and C. Wu, A novel Na3V1.5Al0.5(PO4)3/C cathode material for aqueous hybrid Zn/Na batteries, Ceram. Int., 2025, 51, 48920–48926, DOI:10.1016/j.ceramint.2025.08.036.
- I. Garoui,
et al., Dielectric relaxation and electrothermal charge carrier transport via correlated barrier hopping in the solid electrolyte TlFeP2O7: Experimental and theoretical modeling, Ceram. Int., 2025, 51(19), 29510–29525, DOI:10.1016/j.ceramint.2025.04.155.
- M. Fhoula and M. Dammak, Optical spectroscopy and Judd-Ofelt analysis of Eu3+ doped in Na2ZnP2O7 with high thermal stability for display applications, J. Lumin., 2020, 223, 117193, DOI:10.1016/j.jlumin.2020.117193.
- M. Karray, I. Garoui, M. Akermi, R. Djebali, A. Oueslati and M. Gargouri, Implementing a solid-state synthesis route to tune the functional properties of NaCdP3O9 metaphosphate: optical characteristics, ionic conductivity, and dielectric behavior, RSC Adv., 2025, 15(36), 29703–29719, 10.1039/d5ra04138d.
- D. Qu, Z. Chen, G. Xu, X. Liu, X. Wei and L. Yang, Mesoporous Mn-doped and carbon-coated NaTi2(PO4)3 nanocrystals as an anode material for improved performance of sodium-ion hybrid capacitors, J. Mater. Sci.: Mater. Electron., 2020, 31(20), 17550–17562, DOI:10.1007/s10854-020-04310-w.
- J.-J. Li,
et al., Advanced asymmetric supercapacitors based on Ni3(PO4)2@GO and Fe2O3@GO electrodes with high specific capacitance and high energy density, RSC Adv., 2015, 5(52), 41721–41728, 10.1039/c5ra06050h.
- Z. Feng,
et al., Sintering behavior, microwave dielectric properties, and chemical bond features of novel low-permittivity Cu3(PO4)2 ceramic with low-loss, Ceram. Int., 2022, 48(18), 26904–26910, DOI:10.1016/j.ceramint.2022.05.393.
- Z. Feng,
et al., Sintering behavior, microwave dielectric properties, and chemical bond features of novel low-loss monoclinic-structure Ni3(PO4)2 ceramic based on NiO-P2O5 binary phase diagram, Ceram. Int., 2022, 48(20), 30681–30686, DOI:10.1016/j.ceramint.2022.07.016.
- T. S. Dhapodkar, A. R. Kadam, N. Brahme and S. J. Dhoble, Efficient white light-emitting Mg21Ca4Na4(PO4)18: Dy3+, Tb3+, Eu3+ triple-doped glasses: a multipurpose glasses for WLEDs, solar cell efficiency enhancement, and smart windows applications, Mater. Today Chem., 2022, 24, 100938, DOI:10.1016/j.mtchem.2022.100938.
- E. E. N. Madila,
et al., Investigation of structural, optical, dielectric, and electrical properties of NaMn4(PO4)3 (NMP) with fillowite-type structure, J. Mol. Struct., 2025, 1322, 140418, DOI:10.1016/j.molstruc.2024.140418.
- C. Sun,
et al., Low permittivity LiGd(PO3)4 microwave dielectric ceramics and their application in C-band, J. Alloys Compd., 2025, 1033, 181163, DOI:10.1016/j.jallcom.2025.181163.
- R. Mahajan, R. Prakash, S. Kumar, V. Kumar, R. J. Choudhary and D. M. Phase, Surface and luminescent properties of Mg3(PO4)2:Dy3+ phosphors, Optik, 2021, 225, 165717, DOI:10.1016/j.ijleo.2020.165717.
- A. El Jaouhari,
et al., Charge redistribution induced by well-dispersed cobalt oxide nanoparticles on Co3(PO4)2 surfaces enhances OER catalytic activity, Mater. Adv., 2025, 6(9), 2956–2966, 10.1039/d5ma00276a.
- A. V. Trukhanov, V. G. Kostishin, V. A. Turchenko and S. V. Trukhanov, Functional binary and ternary nanocomposites based on spinels: Composition-structure-microwave properties, J. Indian Chem. Soc., 2025, 102(9), 101902, DOI:10.1016/j.jics.2025.101902.
- S. Manzoor,
et al., Facile synthesis of CeSe2@CNs nanostructure for enhanced water oxidation, Mater. Chem. Phys., 2023, 301, 127529, DOI:10.1016/j.matchemphys.2023.127529.
- Q. Wang, Y. Luo, F. Gu, M. Shui and J. Shu, The preparation, characterization, electro-chemical performance and transporting mechanism of Na1.25Cr0.25Ti1.75(PO4)3/C as anode material for SIBs, Solid State Ionics, 2020, 352, 115368, DOI:10.1016/j.ssi.2020.115368.
- S. V. Trukhanov, D. P. Kozlenko and A. V. Trukhanov, High hydrostatic pressure effect on magnetic state of anion-deficient La0.70Sr0.30MnOx perovskite manganites, J. Magn. Magn. Mater., 2008, 320(14), e88–e91, DOI:10.1016/j.jmmm.2008.02.021.
- T. Zubar,
et al., The Effect of Heat Treatment on the Microstructure and Mechanical Properties of 2D Nanostructured Au/NiFe System, Nanomaterials, 2020, 10(6), 1077, DOI:10.3390/nano10061077.
- Y. Moualhi, M. Javed, N. Akbar and H. Rahmouni, Carrier motion origins and dual-permittivity behavior in FeNi2O4: Dielectric resonance, epsilon-near-zero, polarization effects, and possible advanced electromagnetic applications, Mater. Sci. Semicond. Process., 2025, 200, 110000, DOI:10.1016/j.mssp.2025.110000.
- H. Pu and J. Ma, Research on the design and construction of Eu-doped NiCo2O4 nanoflower electrode materials and the enhancement of capacitive performance, Ionics, 2025 DOI:10.1007/s11581-025-06788-y.
- A. V. Trukhanov, V. O. Turchenko, I. A. Bobrikov, S. V. Trukhanov, I. S. Kazakevich and A. M. Balagurov, Crystal structure and magnetic properties of the BaFe12–xAlxO19 (x = 0.1–1.2) solid solutions, J. Magn. Magn. Mater, 2015, 393, 253–259, DOI:10.1016/j.jmmm.2015.05.076.
- A. V. Trukhanov,
et al., Control of electromagnetic properties in substituted M-type hexagonal ferrites, J. Alloys Compd., 2018, 754, 247–256, DOI:10.1016/j.jallcom.2018.04.150.
- M. Silambarasan,
et al., Oil bath approach of nickel phosphate (Ni3 (PO4)2) nanocrystal and their structural and functional properties, Chem. Pap., 2025, 79(3), 1811–1821, DOI:10.1007/s11696-025-03889-w.
- A. A. Mirghni, K. O. Oyedotun, O. Olaniyan, B. A. Mahmoud, N. F. Sylla and N. Manyala, Electrochemical analysis of Na–Ni bimetallic phosphate electrodes for supercapacitor applications, RSC Adv., 2019, 9(43), 25012–25021, 10.1039/c9ra04487f.
- R. B. Said, B. Louati and K. Guidara, Electrical conduction and thermodynamic properties of K2NiP2O7, Ionics, 2013, 20(2), 209–219, DOI:10.1007/s11581-013-0978-y.
- M. Prabu and S. Selvasekarapandian, Dielectric and modulus studies of LiNiPO4, Mater. Chem. Phys., 2012, 134(1), 366–370, DOI:10.1016/j.matchemphys.2012.03.003.
- J. Chen, S. Jayabal, D. Geng and X. Hu, Stable Water Oxidation Catalysts Based on in-situ Electrochemical Transition of Nickel Phosphate, Catal. Lett., 2021, 152(8), 2333–2341, DOI:10.1007/s10562-021-03816-0.
- J. Yuan,
et al., Amorphous mesoporous nickel phosphate/reduced graphene oxide with superior performance for electrochemical capacitors, Dalton Trans., 2018, 47(37), 13052–13062, 10.1039/c8dt02304b.
- V. Correcher,
et al., Structural and luminescence characterization of synthetic Cr-doped Ni3(PO4)2, J. Phys. Chem. Solids, 2013, 74(12), 1678–1682, DOI:10.1016/j.jpcs.2013.05.029.
- N. F. Mott, Conduction in glasses containing transition metal ions, J. Non-Cryst. Solids, 1968, 1(1), 1–17, DOI:10.1016/0022-3093(68)90002-1.
- W. H. Shah,
et al., Correlated barrier hopping transport and non-Debye type dielectric relaxation in Zn2V2O7 pyrovanadate, Ceram. Int., 2024, 50(23), 50965–50981, DOI:10.1016/j.ceramint.2024.10.008.
- S. B. Yahya, I. Garoui, N. Abid, R. Barillé and B. Louati, K2MgGeO4 orthogermanate: A promising material for optoelectronic applications – Insights from optical absorption, NTCR behavior, and dielectric polarization analysis, Ceram. Int., 2025 DOI:10.1016/j.ceramint.2025.07.291.
- S. Ben Yahya, I. Garoui, M. Zaghrioui, A. Oueslati and B. Louati, Solid-state synthesized Li4GeO4 germanate: an exploration of its structure, vibrational characteristics, electrical conductivity, and dielectric properties, RSC Adv., 2025, 15(12), 9295–9304, 10.1039/d5ra01165e.
- P. Ganguly and A. K. Jha, Impedance spectroscopy analysis of Ba5NdTi3Nb7O30 ferroelectric ceramic, Phys. B, 2010, 405(15), 3154–3158, DOI:10.1016/j.physb.2010.04.035.
- M. Karray, I. Garoui, S. Nasri, S. Znaidia, A. Mahmoud and A. Oueslati, Cesium Iron (III) Pyrophosphate Prepared Using a Solid-State Process: Structure, Mössbauer Spectroscopy,
and Relaxation Dynamics, ChemistrySelect, 2025, 10(2) DOI:10.1002/slct.202404727.
- T. I. Zubar,
et al., Features of Galvanostatic Electrodeposition of NiFe Films with Composition Gradient: Influence of Substrate Characteristics, Nanomaterials, 2022, 12(17), 2926, DOI:10.3390/nano12172926.
- S. V. Trukhanov, I. O. Troyanchuk, D. D. Khalyavin, I. M. Fita, H. Szymczak and K. Bärner, Investigation of magnetic phase transformations in a system of Nd1−xBaxMnO3−δ (0 ≤ x ≤ 0.50) depending on the conditions of preparation, J. Exp. Theor. Phys., 2002, 94(2), 329–335, DOI:10.1134/1.1458482.
- X. J. Zhu, Y. X. Liu, L. M. Geng and L. B. Chen, Synthesis and performance of lithium vanadium phosphate as cathode materials for lithium ion batteries by a sol–gel method, J. Power Sources, 2008, 184(2), 578–582, DOI:10.1016/j.jpowsour.2008.01.007.
- A. E. V. Italiano, R. L. Tranquilin, D. O. M. Marin, M. L. dos Santos and L. G. Vaz, Synthesis of Calcium Phosphate by Microwave Hydrothermal Method, Int. J. Biomater., 2024, 2024(1) DOI:10.1155/2024/2167066.
- A. V. Babkin, A. V. Kubarkov, E. A. Styuf, V. G. Sergeyev, O. A. Drozhzhin and E. V. Antipov, Preparation of battery-grade LiFePO4 by the precipitation method: a review of specific features, Russ. Chem. Bull., 2024, 73(1), 14–32, DOI:10.1007/s11172-024-4119-8.
- K. Laziri,
et al., Kinetics of formation, microstructure, and properties of monolithic forsterite (Mg2SiO4) produced through solid-state reaction of nano-powders of MgO and SiO2, Ceram. Int., 2024, 50(22), 45179–45188, DOI:10.1016/j.ceramint.2024.08.357.
- M. Pérez-Estébanez and J. Isasi-Marín, Relationship between the microstructure, structure and magnetic properties in Ni3(XO4)2 orthophosphate and orthovanadate obtained by two different preparation methods, J. Sol–Gel Sci. Technol., 2008, 47(3), 326–334, DOI:10.1007/s10971-008-1766-4.
- A. A. Mirghni,
et al., A high energy density asymmetric supercapacitor utilizing a nickel phosphate/graphene foam composite as the cathode and carbonized iron cations adsorbed onto polyaniline as the anode, RSC Adv., 2018, 8(21), 11608–11621, 10.1039/c7ra12028a.
- A. V. Trukhanov,
et al., The origin of the dual ferroic properties in quasi-centrosymmetrical SrFe12−xInxO19 hexaferrites, J. Alloys Compd., 2021, 886, 161249, DOI:10.1016/j.jallcom.2021.161249.
- S. V. Trukhanov, V. V. Fedotova, A. V. Trukhanov, S. G. Stepin and H. Szymczak, Synthesis and structure of nanocrystalline La0.50Ba0.50MnO3, Crystallogr. Rep., 2008, 53(7), 1177–1180, DOI:10.1134/s1063774508070158.
- M. K. Anupama, B. Rudraswamy and N. Dhananjaya, Investigation on impedance response and dielectric relaxation of Ni-Zn ferrites prepared by self-combustion technique, J. Alloys Compd., 2017, 706, 554–561, DOI:10.1016/j.jallcom.2017.02.241.
- J. Massoudi,
et al., Magnetic and spectroscopic properties of Ni–Zn–Al ferrite spinel: from the nanoscale to microscale, RSC Adv., 2020, 10(57), 34556–34580, 10.1039/d0ra05522k.
- S. B. Yahya, R. Barillé and B. Louati, Investigation of the structural, morphological, electrical and dielectric properties of Li2CaGeO4 compound, Ionics, 2024, 30(9), 5325–5340, DOI:10.1007/s11581-024-05670-7.
- N. Weslati, I. Gharbi, M. Hamdi, A. Oueslati, M. Gargouri and K. Khirouni, Investigation of optical and electrical conduction mechanism of AgYP2O7 prepared by solid state process, Mater. Res. Bull., 2021, 143, 111444, DOI:10.1016/j.materresbull.2021.111444.
- A. Douzi,
et al., Photoluminescence characteristics and optical temperature sensing of orange-red emitting oxyapatite phosphor Ca3La7(SiO4)5(PO4)O2:Sm3+, Mater. Adv., 2025, 6(11), 3634–3647, 10.1039/d5ma00128e.
- Y. Gao,
et al., Optical properties and magnetic properties of antisite-disordered Ni1–xCoxCr2O4 spinels, Trans. Nonferrous Met. Soc. China, 2017, 27(4), 863–867, DOI:10.1016/s1003-6326(17)60099-2.
- B. Johnson, N. R. K. Chand, B. K. Sudhakar and G. Srinivasa Rao, Chemical durability, thermal stability and spectroscopic studies of the influence of Ni2+ ions in oxyfluorophosphate glasses, J. Mater. Sci.: Mater. Electron., 2016, 27(8), 8833–8847, DOI:10.1007/s10854-016-4909-3.
- A. B. A. Hajji, M. Wali, R. Dhahri, E. Dhahri, J. F. M. L. Mariano and M. Jemmali, A comprehensive study of the structural, magnetic and optoelectronic behavior of Ni0.6Mn0.4Cr2O4 chromite for magneto optical devices, Ceram. Int., 2025, 51(14), 18369–18383, DOI:10.1016/j.ceramint.2025.02.050.
- N. A. M. Alsaif,
et al., Synthesis, structural, optical properties and dielectric spectroscopy of nickel-doped lead borate glasses, Opt. Quantum Electron., 2024, 56(3) DOI:10.1007/s11082-023-06059-y.
- A. B. A. Hajji,
et al., MnCr2O4: A suitable material with significant optical response for optoelectronic devices, Opt. Mater., 2025, 162, 116951, DOI:10.1016/j.optmat.2025.116951.
- S. A. Khan, F. S. Al-Hazmi, S. Al-Heniti, A. S. Faidah and A. A. Al-Ghamdi, Effect of cadmium addition on the optical constants of thermally evaporated amorphous Se–S–Cd thin films, Curr. Appl. Phys., 2010, 10(1), 145–152, DOI:10.1016/j.cap.2009.05.010.
- O. Taktak,
et al., Optical investigations and theoretical simulation of organic-inorganic hybrid: TPA-CoCl4, Opt. Mater., 2024, 150, 115251, DOI:10.1016/j.optmat.2024.115251.
- P. Kubelka, New Contributions to the Optics of Intensely Light-Scattering Materials Part II: Nonhomogeneous Layers, J. Opt. Soc. Am., 1954, 44(4), 330, DOI:10.1364/josa.44.000330.
- A. B. A. Hajji,
et al., Exploring the structural, optoelectronic behavior and non-linear optical response of BaFe12O19 M-type hexaferrite material as a promising solar cell absorber, Mater. Chem. Phys., 2026, 347, 131472, DOI:10.1016/j.matchemphys.2025.131472.
- J. Tauc and A. Menth, States in the gap, J. Non-Cryst. Solids, 1972, 8–10, 569–585, DOI:10.1016/0022-3093(72)90194-9.
- M. Ajili, A. Oueslati, M. B. Gzaiel and M. Gargouri, Investigation of optical and transport properties of the semiconducting α-KYP2O7 compound, Opt. Quantum Electron., 2021, 53(5), 209, DOI:10.1007/s11082-021-02889-w.
- M. Ajili and B. Louati, Studies on structural, Optical and electrical properties of K2Ba3(P2O7)2, Appl. Phys. A: Mater. Sci. Process., 2021, 128(1), 73, DOI:10.1007/s00339-021-05200-6.
- G. D. Cody, T. Tiedje, B. Abeles, B. Brooks and Y. Goldstein, Disorder and the Optical-Absorption Edge of Hydrogenated Amorphous Silicon, Phys. Rev. Lett., 1981, 47(20), 1480–1483, DOI:10.1103/physrevlett.47.1480.
- J. R. Macdonald, Impedance spectroscopy, Ann. Biomed. Eng., 1992, 20(3), 289–305, DOI:10.1007/bf02368532.
- F. Ciucci, Modeling electrochemical impedance spectroscopy, Curr. Opin. Electrochem., 2019, 13, 132–139, DOI:10.1016/j.coelec.2018.12.003.
- H. S. Magar, R. Y. A. Hassan and A. Mulchandani, Electrochemical Impedance Spectroscopy (EIS): Principles, Construction, and Biosensing Applications, Sensors, 2021, 21(19), 6578, DOI:10.3390/s21196578.
- N. Ortega,
et al., Multiferroic properties of Pb(Zr,Ti)O3/CoFe2O4 composite thin films, J. Appl. Phys., 2006, 100(12) DOI:10.1063/1.2400795.
- S. Karmakar, S. Varma and D. Behera, Investigation of structural and electrical transport properties of nano-flower shaped NiCo2O4 supercapacitor electrode materials, J. Alloys Compd., 2018, 757, 49–59, DOI:10.1016/j.jallcom.2018.05.056.
- I. Garoui, M. Mallek, F. N. Almutairi, W. Rekik and A. Oueslati, Synthesis, Structural characterization and complex impedance analysis of a novel organic-inorganic hybrid compound based on Mercury (II) chloride, J. Mol. Struct., 2024, 1315, 138881, DOI:10.1016/j.molstruc.2024.138881.
- S. Nasri, A. Jraba, I. Garoui, A. Oueslati and E. Elaloui, Potassium tin chloride (K2SnCl6) as a lead-free perovskite: anti-solvent synthesis, structural characterization, and charge transport properties, RSC Adv., 2025, 15(7), 5369–5380, 10.1039/d5ra00090d.
- M. ben gzaiel, I. Garoui, F. N. Almutairi, I. Mbarek and A. Oueslati, Lead-Free halide perovskites for optoelectronic application: Investigation of structural, optical, electric and dielectric behaviors, Opt. Mater., 2024, 154, 115664, DOI:10.1016/j.optmat.2024.115664.
- I. Garoui,
et al., Synthesis, crystal structure, BFDH morphology, Hirshfeld surface analysis and electrical characterization of the new bi-(2-amino-5-methylpyridinium) hexa-chlorostannate compound, Phys. E, 2024, 158, 115897, DOI:10.1016/j.physe.2024.115897.
- A. Ghoudi,
et al., Optical and electric properties of the organic-inorganic hybrid bis(2-amino-5-picolinium) Tetrachlorocobaltate(II) [(C6H9N2)2CoCl4, Inorg. Chem. Commun., 2024, 168, 112925, DOI:10.1016/j.inoche.2024.112925.
- M. Javed,
et al., Investigation on electrical transport and dielectric relaxation mechanism in TbCrO3 perovskite orthochromite, J. Alloys Compd., 2023, 955, 170181, DOI:10.1016/j.jallcom.2023.170181.
- M. Rani, R. C. Pawar and N. Panwar, Exploring the comparison of optical, dielectric and photocatalytic performance of Yb3+ and Gd3+ half-doped DyCrO3 nanostructures, Mater. Chem. Phys., 2024, 314, 128848, DOI:10.1016/j.matchemphys.2023.128848.
- M. Ghosh, P. Pal, T. Paul, S. Maiti, S. Bhattacharjee, K. Sardar, A. Sahoo, A. Ghosh and K. K. Chattopadhyay, Charge-Carrier Dynamics and Relaxation in Cs2SnI6 Perovskite for Energy Storage: Existence of Anharmonic Rattling-Assisted Polaron Dynamics, Phys. Rev. Appl., 2023, 20(5), 054032, DOI:10.1103/PhysRevApplied.20.054032.
- A. Ghosh and D. Chakravorty, AC conduction in semiconducting CuO-Bi2O3-P2O5 glasses, J. Phys.: Condens. Matter, 1990, 2(24), 5365–5372, DOI:10.1088/0953-8984/2/24/009.
- X. Le Cleac’h, Lois de variations et ordre de grandeur de la conductivité alternative des chalcogénures massifs non cristallins, J. Phys., 1979, 40(4), 417–428, DOI:10.1051/jphys:01979004004041700.
- G. E. Pike, ac Conductivity of Scandium Oxide and a New Hopping Model for Conductivity, Phys. Rev. B, 1972, 6(4), 1572–1580, DOI:10.1103/physrevb.6.1572.
- S. R. Elliott, Temperature dependence of a.c. conductivity of chalcogenide glasses, Philos. Mag. B, 1978, 37(5), 553–560, DOI:10.1080/01418637808226448.
- A. S. Nowick, B. S. Lim and A. V. Vaysleyb, Nature of the ac conductivity of ionically conducting crystals and glasses, J. Non-Cryst. Solids, 1994, 172–174, 1243–1251, DOI:10.1016/0022-3093(94)90649-1.
- S. Chkoundali, I. Garoui, W. Trigui and A. Oueslati, Crystal structure, Hirshfeld surface analysis, conduction mechanism and electrical modulus study of the new organic–inorganic compound [C8H10NO]2HgBr4, RSC Adv., 2024, 14(13), 8971–8980, 10.1039/d4ra00689e.
- I. Garoui,
et al., New organic–inorganic chloride (2-amino-4-methylpyridinium hexachlorostannate): Crystal structure, BFDH morphology, and electrical conduction mechanism, J. Phys. Chem. Solids, 2025, 206, 112840, DOI:10.1016/j.jpcs.2025.112840.
- R. B. Said, B. Louati, K. Guidara and S. Kamoun, Thermodynamic properties and application of CBH model in the ac conductivity of LiNi1.5P2O7 ceramic, Ionics, 2014, 20(8), 1071–1078, DOI:10.1007/s11581-013-1060-5.
- R. B. Said, B. Louati and K. Guidara, Electrical properties and conduction mechanism in the sodium nickel diphosphate, Ionics, 2013, 20(5), 703–711, DOI:10.1007/s11581-013-1027-6.
- M. B. Bechir, A. B. Rhaiem and K. Guidara, A.c. conductivity and dielectric study of LiNiPO4 synthesized by solid-state method, Bull. Mater. Sci., 2014, 37(3), 473–480, DOI:10.1007/s12034-014-0685-y.
- M. Megdiche, C. Perrin-pellegrino and M. Gargouri, Conduction mechanism study by overlapping large-polaron tunnelling model in SrNiP2O7 ceramic compound, J. Alloys Compd., 2014, 584, 209–215, DOI:10.1016/j.jallcom.2013.09.021.
- R. Baies, O. Pérez, V. Caignaert, V. Pralong and B. Raveau, A new sodium cobaltophosphate with a tunnel structure, ionic conductor, J. Mater. Chem., 2006, 16(25), 2434–2438, 10.1039/b516383h.
- S.-H. Moon,
et al., Sodium ion transport in polymorphic scandium NASICON analog Na3Sc2(PO4)3 with new dielectric spectroscopy approach for current-constriction effects, Solid State Ionics, 2016, 289, 55–71, DOI:10.1016/j.ssi.2016.02.017.
- H. Dhahri,
et al., Advanced characterization of the structural and electrical properties of La0.6Ce0.2Ba0.2FeO3 synthesized via the sol–gel method, J. Korean Phys. Soc., 2025, 87, 201–212, DOI:10.1007/s40042-025-01402-w.
- Y. Moualhi, M. Smari, H. Nasri and H. Rahmouni, Combined transport and dielectric models and experimental characterization based on impedance spectroscopy for studying the microstructural and transport properties of electro-ceramic perovskites, Mater. Today Commun., 2024, 38, 108529, DOI:10.1016/j.mtcomm.2024.108529.
- K. Guettiti,
et al., The study of structural, dielectric, impedance and modulus properties of La0.8Pb0.2FeO3 doped by 25% Mg into the B-site, Phys. B, 2023, 655, 414771, DOI:10.1016/j.physb.2023.414771.
- A. Rashid and M. Ikram, Dielectric behavior, Complex modulus, and conduction mechanism studies of Ni-doped La2SrFe2−xNixTiO9 triple perovskite for high-frequency electronic applications, Mater. Sci. Eng., B, 2025, 319, 118332, DOI:10.1016/j.mseb.2025.118332.
- M. Javed, Y. Moualhi, N. Akbar, A. Masood, T. Alomayri and S. A. Muhammed Ali, Electrical dynamics and Havriliak-Negami dielectric relaxation behavior of FeNi2O4 electromagnetic spinel nickelate, Ceram. Int., 2025, 51(19), 28109–28121, DOI:10.1016/j.ceramint.2025.04.025.
- K. S. Chikara, A. K. Bera, A. Kumar and S. M. Yusuf, Role of Crystal Structure on the Ionic Conduction and Electrical Properties of Germanate Compounds A2Cu3Ge4O12 (A = Na, K), ACS Appl. Electron. Mater., 2023, 5(5), 2704–2717, DOI:10.1021/acsaelm.3c00176.
- P. Nayak, T. Badapanda, A. K. Singh and S. Panigrahi, An approach for correlating the structural and electrical properties of Zr4+-modified SrBi4Ti4O15/SBT ceramic, RSC Adv., 2017, 7(27), 16319–16331, 10.1039/c7ra00366h.
- B. B. Arya and R. N. P. Choudhary, Structural, dielectric and electrical properties of BaSnO3 and BaSeO3 modified Bi0.5Na0.5TiO3 ceramics, Ceram. Int., 2020, 46(4), 4222–4234, DOI:10.1016/j.ceramint.2019.10.141.
- I. Ibrahmi,
et al., Synthesis and trigonal structure of a new lead-free zero-dimensional perovskite (CH3NH3)2[SnBr6] with multifunctional optical and electrical properties, J. Phys. Chem. Solids, 2025, 207, 112909, DOI:10.1016/j.jpcs.2025.112909.
- S. Sharma, K. Shamim, A. Ranjan, R. Rai, P. Kumari and S. Sinha, Impedance and modulus spectroscopy characterization of lead free barium titanate ferroelectric ceramics, Ceram. Int., 2015, 41(6), 7713–7722, DOI:10.1016/j.ceramint.2015.02.102.
- R. Gerhardt, Impedance and dielectric spectroscopy revisited: Distinguishing localized relaxation from long-range conductivity, J. Phys. Chem. Solids, 1994, 55(12), 1491–1506, DOI:10.1016/0022-3697(94)90575-4.
- M. Bharathi, K. N. Anuradha and M. V. Murugendrappa, Structural, DC Conductivity and Electric Modulus Studies of Polypyrrole Praseodymium Manganite Nanocomposites, Indian J. Pure Appl. Phys., 2023, 61(3) DOI:10.56042/ijpap.v61i3.70065.
|
| This journal is © The Royal Society of Chemistry 2025 |
Click here to see how this site uses Cookies. View our privacy policy here. 
 Open Access Article
 This Open Access Article is licensed under a Creative Commons Attribution-Non Commercial 3.0 Unported Licence
 *a,
Noweir Ahmad
Alghamdi
b,
Iskandar
Chaabane
a,
Abderrazek
Oueslati
*a,
Noweir Ahmad
Alghamdi
b,
Iskandar
Chaabane
a,
Abderrazek
Oueslati


 as a function of ω/ωmax at different temperatures for the Ni3(PO4)2 compound.
 , and plotted against the logarithm of the normalized angular frequency, log(ω/ωmax), where ωmax corresponds to the peak-loss frequency. Here, T denotes temperature. The convergence of impedance loss curves obtained at different temperatures into a single master curve suggests that the relaxation time distribution is temperature-independent. As depicted in Fig. 8(b), the nearly perfect overlap of the curves confirms that the relaxation dynamics remain unchanged over the investigated temperature range.72


 was evaluated using the following expression:98
 represents its maximum value. The angular frequency is expressed as ω, and ωp corresponds to the frequency at which M′′(ω) attains its peak. The parameter β describes the degree of broadening in the modulus spectrum and quantifies the deviation from ideal Debye-type relaxation (with 0 < β ≤ 1). Physically, the exponent β provides key insight into the relaxation dynamics of the material: for an ideal dielectric, β = 1, reflecting the abseznce of significant dipole–dipole interactions, typical of Debye relaxation. When β < 1, however, the system exhibits notable dipole–dipole interactions, signifying a non-Debye relaxation process. Table 5 presents the temperature dependence of the parameters obtained from fitting the results of eqn (20).
