
 Open Access Article
 This Open Access Article is licensed under a Creative Commons Attribution-Non Commercial 3.0 Unported Licence
From steel waste to energy storage: kish graphite derived graphene electrodes for high performance supercapacitors†
Ankitha
Rao
 a,
Somashekara
Bhat
*a,
Shounak
De
a,
Adarsh
Rag
S
b and
Vipin
Cyriac
c
a,
Somashekara
Bhat
*a,
Shounak
De
a,
Adarsh
Rag
S
b and
Vipin
Cyriac
c
aDepartment of Electronics and Communication Engineering, Manipal Institute of Technology, Manipal Academy of Higher Education, Manipal, 576104, India. E-mail: soma.bhat@manipal.edu
bDepartment of Data Science and Computer Applications, Manipal Institute of Technology, Manipal Academy of Higher Education, Manipal, 576104, India
cDepartment of Physics, Manipal Institute of Technology, Manipal Academy of Higher Education, Manipal, Karnataka 576104, India
First published on 7th July 2025
Abstract
Graphite is a critical mineral, and its recovery from blast furnace dust is essential for sustainable resource utilization. Extracting graphite from industrial waste reduces the dependence on mining natural graphite, thus minimizing the environmental impact and meeting the rising demand for energy storage and advanced materials. This study extracts kish graphite (KG) from blast furnace area dust particles (BFADP) using a simple and cost-effective purification process involving magnetic separation, magnetic stirring, decantation, and acid leaching, achieving 96% carbon recovery-a significant improvement over conventional methods. X-ray diffractometer analysis confirmed an interplanar spacing of 0.34 nm at 2θ = 26.2°, resembling natural graphite, while Raman spectroscopy, high-resolution transmission electron microscopy (HRTEM), and selected area electron diffraction (SAED) results validated a highly ordered hexagonal crystal structure. Furthermore, reduced graphene oxide (rGO) was synthesized from purified KG and then chemically activated with KOH at high temperatures to enhance its specific surface area (SSA). The electrochemical performance of KG-derived graphene was evaluated in electric double-layer capacitors (EDLCs), demonstrating excellent properties, making it a promising supercapacitor electrode material. This study highlights the effectiveness of KG purification and its potential in energy storage, offering a sustainable solution for repurposing industrial byproducts.
1 Introduction
In 2023, the Government of India released a list of 30 critical minerals for India, including graphite, and in response the Ministry of Mines has intensified its efforts towards the exploration of these minerals within the country, leveraging the Geological Survey of India (GSI) and other relevant agencies for this purpose. Graphite, a naturally occurring allotropic form of carbon with a crystalline structure, exhibits a range of fascinating properties, many of which are remarkable. Notably, its low specific gravity, softness, inertness, and exceptional heat resistance make it stand out in the realm of materials science. These exceptional attributes position it as a highly sought-after mineral for various industrial applications.1Graphite has been widely used in industries such as paints, lubricants, pencils, electrodes, aerospace applications, carbon brushes, and foils for years; however, it has recently gained recognition as a key strategic asset. This change is due to the growing importance of sectors such as electric vehicle (EV) manufacturing, where graphite is essential in battery anode construction, and the extensive exploration of graphene, an advanced material derived from graphite. In the battery sector alone, graphite demand is forecasted to double within six years.1 This increased demand underscores the apparent risk to the supply chain given that most of the world's graphite comes from a small number of countries.2 According to the World Bank, graphite has the highest demand share (approximately 53.8%) among the minerals required for battery manufacturing. As the demand for graphite surges across various industries, and natural graphite reserves dwindle, compounded by the significant time, energy, and expense involved in producing synthetic graphite, the vulnerability of the supply chain becomes more evident. Hence, there is an urgent need to identify widely accessible and cost-effective graphite to replace natural graphite.3
Steel slag, a by-product of steelmaking, consists of a complex solution of silicates and oxides that solidifies as it cools. Kish graphite (KG), a distinctive material found in steel slag, is a unique form of highly crystalline graphite closely resembling natural graphite and has garnered increased research interest in recent years, particularly due to the supply risks associated with natural graphite flakes. As outlined in previous work,4 during the steel making process, carbon solubility decreases as molten iron cools, leading to the precipitation of carbon exceeding the solubility limit in the form of graphite flakes, known as KG. It has been observed that different zones of steelmaking facilities, including desulfurization zones, dust collection, and waste disposal areas, consist of KG in large concentrations.5 Despite its widespread presence in the iron and steel industry, the underutilization of KG has resulted in significant resource loss and environmental degradation. Incidents in Taiwan have highlighted the environmental risks associated with uncollected KG dispersion from steelmaking plants.4
Numerous research groups are currently investigating techniques for recovering KG flakes. For example, one study revealed that mechanochemical ball-milling in the presence of iodine can effectively purify and functionalize KG. This process yields iodinated kish graphite (I-Kish-G), which is characterized by low impurity levels and outstanding electrocatalytic activity.6 In a study conducted by J. C. An et al., KG flakes were purified and found to exhibit high levels of graphitization. The primary objective of the research was to evaluate the sorption properties of these recycled flakes for various types of oil.7 Wang et al., recovered KG flakes, which had properties like those of natural flake graphite and showed potential for use as a cathode material for batteries.8 Laverty et al., demonstrated that synthetic KG can be utilized in AlCl3–graphite batteries and demonstrated high capacities.9 Study by Jeon et al., highlighted that the carbon content of samples varied from location to location in a steel-making facility.5
To date, various complex and elaborate physical beneficiation and chemical purification techniques have been used to extract and refine KG flakes. Some of the processes under physical beneficiation include air elutriation, magnetic separation, froth flotation, foam elutriation, and hydraulic classification.10 Few have reported the use of pneumatic separation accompanied by the froth flotation technique to remove impurities associated with KG flakes.7 The froth flotation technique widely used for KG purification has several disadvantages. The selectivity of froth flotation is limited, leading to the recovery of undesired minerals along with the target minerals, which compromises the purity and quality of the final product. Froth flotation is a complex process that requires skilled operators to optimize conditions for effective separation. In addition, the use of chemical reagents in froth flotation is expensive and may be harmful to the environment. This process also consumes a significant amount of energy, particularly for grinding and agitation, thereby escalating the operational expenses and environmental impacts.
Further research is needed to refine and reclaim KG flakes using simple and efficient purification techniques, with the goal of achieving a high degree of crystallinity. This study addresses this gap by focusing on recycling the industrial by-product KG flakes using a cost-effective method. This study employs a simple separation process involving magnetic separation to isolate magnetic impurities, water washing, decantation for dust removal, and an acid-leaching process to eliminate metallic impurities. These procedures contributed to the enrichment and purification of KG flakes. Furthermore, the impact of the separation and purification conditions on the KG flakes was explored. Few studies have focused on the recovery and material application of purified KG flakes as electrode materials for next-generation high-performance aluminum-ion batteries.3 While some research has investigated the use of purified KG flakes in batteries, its potential as a precursor for synthesizing graphene for supercapacitor electrodes remains largely unexplored. Recently, graphene, with its sp2 network of one-atom thickness, has garnered significant attention as an electrode material in batteries, supercapacitors and dye sensitized solar cells due to its exceptional electrical, thermal, optical, and mechanical properties, along with its high surface area (theoretical value: ∼2600 m2 g−1).11,12
This study introduces a cost-effective approach for purifying KG flakes from blast furnace dust, yielding a graphite with a highly crystalline structure comparable to natural graphite. This approach offers a scalable and eco-friendly solution for KG recovery, promoting waste management, industrial recycling, and environmental sustainability. The purified KG was successfully converted into reduced graphene oxide (rGO) using L-ascorbic acid, and GO was also chemically activated with KOH at high temperatures to enhance SSA. The feasibility of using KG-derived graphene was investigated, and the performance of the supercapacitor fabricated using this is reported in this work.
2 Experimental
2.1 Materials and method
Dust particles, referred to as blast furnace area dust particles (BFADP), were collected from the blast furnace area of Kudremukh Iron Ore Company Limited (KIOCL, Mangaluru) and used in this experiment. HCl was purchased from Merck for the acid washing process. For the synthesis of GO and rGO, potassium permanganate, sulfuric acid, hydrogen peroxide, and ascorbic acid (AA) were procured from Merck and Kanton laboratories and used as is. Deionized (DI) water was used throughout the experiment. The purified graphite samples derived from BFADP are designated KG or KG flakes throughout this paper. | ||
| Fig. 1 Scheme for the cleaning process of BFADP. | ||
As shown in step 1, dust particles were collected from the blast furnace area for purification. Five grams of BFADP was placed in a large Petri dish. Round magnetic discs were hovered over to remove metal impurities present in the BFADP sample, as shown in step 2. Next, to eliminate any remaining fine metal impurities, the samples were transferred to a beaker containing DI water and magnetically stirred at room temperature using a magnetic bead. All the remaining fine metal particles in the sample adhere to the magnetic bead and hence can be separated easily, as shown in step 3. The magnetic beads were then slowly removed, and the remaining particles were dried in an oven. The dried samples were added to another beaker containing DI water. This process helps to separate heavier soil and other impurities from lighter KG flakes. The KG flakes started floating on the top and were slowly decanted into another beaker, as shown in step 4. This process was repeated until all the KG flakes were separated. Once the heavier sand and other impurities were separated, the KG flakes were thoroughly washed with water and dried in an oven to remove water. After undergoing the physical process of mineral (graphite) extraction, HCl leaching was employed to effectively eliminate iron oxide, iron, magnesium hydroxide, calcium hydroxide, and other trace minerals present along with the KG flakes. In this process, 2 g of KG flake concentrate was combined with 100 mL of 5% HCl, stirred at 50 °C for 2 h, and then filtered, as described in step 5. After filtration, the KG flakes were thoroughly cleaned with DI water and dried in an oven at 60 °C overnight. To break down the bulk KG flakes, horn sonication was employed for 6 h, as shown in step 6, and then the remnant was filtered and dried overnight in an oven to remove all the water content, as shown in step 7.
![[thin space (1/6-em)]](https://www.rsc.org/images/entities/char_2009.gif) :1 volume ratio, was prepared. This mixture was then heated to 70 °C on a heating plate and stirred for 30 min, resulting in a color change from brownish-yellow to black. Subsequently, the product was centrifuged for 20 min at 3500 rpm to separate the supernatant, which was subsequently decanted. The solid residue was subjected to triple washing with ethanol and water to further eliminate the impurities and was oven-dried at 120 °C.15 The obtained samples were denoted as C-rGO.
:3 ratio, followed by sonication for 15 minutes to ensure uniform dispersion as outlined in the literature.20 The mixture was then dried overnight in a hot air oven at 50 °C. The dried sample was transferred to a crucible and placed inside a muffle furnace under a flowing N2 atmosphere (50 mL min−1), where it was heated to 550 °C. Once the maximum temperature was reached, the sample was maintained for 30 min. After heat treatment, the sample was washed with 1 M HCl and rinsed with distilled water until the pH reached 6. This procedure was repeated at different temperatures in the 650–850 °C range. The products activated by KOH at different temperatures were named KrGO-550, KrGO-650, KrGO-750, and KrGO-850. Normally, more KOH quantity generates more pores on GO, resulting in a bigger mass loss.18
:1 volume ratio, was prepared. This mixture was then heated to 70 °C on a heating plate and stirred for 30 min, resulting in a color change from brownish-yellow to black. Subsequently, the product was centrifuged for 20 min at 3500 rpm to separate the supernatant, which was subsequently decanted. The solid residue was subjected to triple washing with ethanol and water to further eliminate the impurities and was oven-dried at 120 °C.15 The obtained samples were denoted as C-rGO.
:3 ratio, followed by sonication for 15 minutes to ensure uniform dispersion as outlined in the literature.20 The mixture was then dried overnight in a hot air oven at 50 °C. The dried sample was transferred to a crucible and placed inside a muffle furnace under a flowing N2 atmosphere (50 mL min−1), where it was heated to 550 °C. Once the maximum temperature was reached, the sample was maintained for 30 min. After heat treatment, the sample was washed with 1 M HCl and rinsed with distilled water until the pH reached 6. This procedure was repeated at different temperatures in the 650–850 °C range. The products activated by KOH at different temperatures were named KrGO-550, KrGO-650, KrGO-750, and KrGO-850. Normally, more KOH quantity generates more pores on GO, resulting in a bigger mass loss.18
Reaction 1: this forms potassium carbonate (K2CO3)
| 6KOH + 2C → 2K + 3H2 + 2K2CO3 |
Reaction 2: formation of carbon dioxide (CO2)
| K2CO3 → K2O + CO2 |
Reaction 3: formation of carbon monoxide
| CO2 + C → 2CO |
Reaction 4: formation of metallic potassium
| 2KOH + C → 2K + H2 + CO2 |
Reaction 5: further reduction
| K2O + C → 2K + CO |
 | (1) |
 | (2) |
 | (3) |
 | (4) |
| Cs = 4C | (5) |
Furthermore, the energy and power densities26 were calculated using, where ΔV is the effective discharge voltage and Δt is discharge time.
 | (6) |
 | (7) |
3 Results and discussion
3.1 BFADP cleaning process analysis
A simple yet effective cleaning process was employed in this study, which consisted of magnetic separation, decantation, and acid leaching. The atomic wt% of most impurities reduced after the samples underwent these processes as seen from the XRD and EDS analysis. The initial carbon content in BFADP before the cleaning process was 61%, signifying its importance for recycling because of its substantial annual production. Two types of impurities were found in these materials: non-metallic and metallic particles. Non-metallic impurities are composed of silicon and oxides. On the other hand, metallic particles predominantly comprise alkaline metals like Na, Al, K, and Fe. Metal particles tend to establish stronger bonds with KG flakes than nonmetallic particles. Additionally, most impurities were finer than the KG flakes. During the separation process, such as decantation, these impurity particles tended to settle, leading to a notable increase in the percentage of KG flakes. This suggests that a simple screening process can effectively eliminate most free impurity particles. Furthermore, magnetic separation was effective in removing most of the iron particles attached to the KG flakes. DI water was used for repeated washing to reduce impurities. In contrast to earlier studies, our process involves employing sonication post-magnetic separation to release impurities from the KG flakes. This step enhances the effectiveness of the subsequent acid leaching process. Our data demonstrates that this approach reduces magnetic and non-magnetic impurities, such as SiO2, while substantially minimizing KG loss. By discarding most of the iron particles during magnetic beneficiation and horn sonication, the carbon content of KG increased to approximately 75%. HCl acid leaching was further employed to eliminate metallic impurities present in the KG, such as Al, Fe, Na, Ca, Si, and K. After this process, the carbon content of purified KG exceeded 95%. The metallic impurities present along with KG flakes might have dissolved during the acid leaching process as follows:21| Fe2O3 + 6HCl → 2FeCl3 + 3H2O | (8) |
| Fe3O4 + 8HCl → 2FeCl3 + FeCl2 + 4H2O | (9) |
| Al2O3 + 6HCl → 2AlCl3 + 3H2O | (10) |
| 2NaOH + 2HCl → 2NaCl + 2H2O | (11) |
| Ca(OH)2 + 2HCl → CaCl2 + 2H2O | (12) |
| 2KOH + 2HCl → 2KCl + 2H2O | (13) |
The SEM images of BFADP shown in Fig. 2(a) and (b) reveal a plate-like structure showing closely packed flake layers with a morphology similar to that of natural flake graphite, which confirms that KG can indeed be a good raw material for the synthesis of graphene. The primary elements in the sample were determined from EDS analysis of the steel slag, including C, O, Na, Si, Al, K, Fe, and Ca. The atomic wt% of the elements present is as shown in Table 1. It can be observed that the atomic weight of carbon increased with every cleaning step. The main components of BFADP were identified as iron oxides along with graphite (carbon) through XRD and EDS analyses. Notably, the initial carbon content of the BFADP sample was 61%, indicating its importance for recycling. Further atomic wt% of most impurities reduced after the samples underwent magnetic separation, the decantation process, and acid leaching processes. After magnetic separation and decantation, the carbon content of KG increased to ∼75%. After acid leaching, the carbon content of the purified KG exceeded 95%. EDS analysis indicated that the leached KG concentrates consisted mainly of elemental carbon with only minor traces of oxygen detected. Impurity elements, such as calcium (Ca) and aluminum (Al), were undetected, and other impurities were present in small traces.
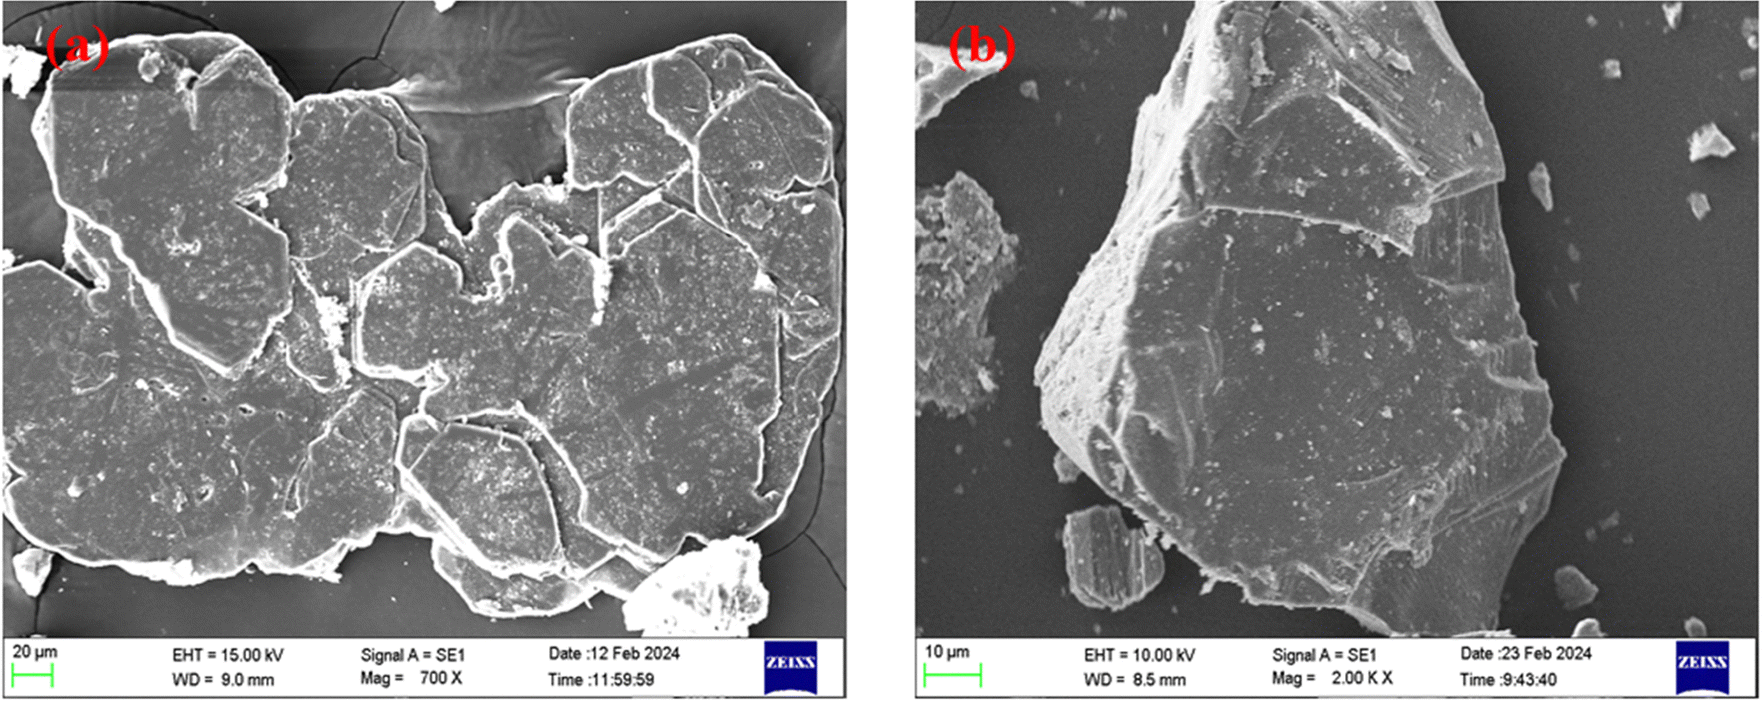 | ||
| Fig. 2 Scanning electron microscope images (a) and (b) of BFADP before purification. | ||
| Elements | Atomic wt% of elements at different cleansing steps | ||
|---|---|---|---|
| BFADP (%) | After magnetic separation and decantation (%) | After acid leaching (%) | |
| C | 61.85 | 75.11 | 96.17 |
| O | 29.6 | 22.72 | 3.70 |
| Na | 0.15 | 0.28 | 0.02 |
| Si | 4.91 | 0.88 | 0.04 |
| Al | 0.77 | 0.11 | 0.00 |
| K | 0.10 | 0.10 | 0.01 |
| Ca | 0.28 | 0.09 | 0.00 |
| Fe | 2.34 | 0.53 | 0.03 |
Table 2 lists the purification steps, carbon recovery rates, and applications of the recovered graphite, as reported in the literature for comparison. The purification steps employed in our method successfully achieved high carbon recovery. This study introduces a cost-effective and straightforward approach to recycling industrial by-product KG flakes, addressing the limitations of traditional methods, such as froth flotation, air elutriation, foam elutriation, and pneumatic separation, which are costly, energy-intensive, and environmentally hazardous. These techniques rely on complex setups, skilled operators, and hazardous reagents such as surfactants and frothing agents, resulting in chemical waste and ecological risks, while offering low selectivity and compromised product purity. Our approach uses a simplified process involving magnetic separation to remove magnetic impurities, water washing and decantation to remove dust, and acid leaching to eliminate metallic contaminants. This method achieves a carbon recovery rate of 96.17%, comparable to established techniques, while reducing energy consumption, avoiding complex setups, and minimizing reliance on harmful reagents. These results demonstrate an efficient, sustainable, and practical alternative to conventional purification methods.
| # | Purification steps | % recovery | Applications | Ref. |
|---|---|---|---|---|
| 1 | Air elutriation–magnetic separation–froth flotation–foam elutriation–hydraulic classification | 95.00 | — | 10 |
| 2 | Sieving–flotation–crushing–magnetic separation–HCl acid etching | 97.00 | Graphene was synthesized using microwave irradiation | 35 |
| 3 | Pneumatic separation–flotation–sonication–magnetic separation–acid leaching | 99.00 | KG-based expanded graphite was prepared, and it exhibited superior oil absorption properties | 7 |
| 4 | Water washing–magnetic separation–acid leaching | 99.38 | Cathode material for aluminum ion battery | 3 |
| 5 | Floating–acid leaching | 95.50 | Anode materials for lithium-ion batteries | 21 |
| 6 | Magnetic separation–decantation–acid leaching | 96.17 | rGO synthesis for supercapacitor applications | This work |
3.2 Analysis of products following cleaning and reduction processes
The surface area, phase composition, carbon structure, surface morphology, and elemental distribution of the products (KG flakes, C-rGO, and TKrGO) were analyzed at various stages including cleaning, oxidation via Hummers' method, and reduction using ascorbic acid (AA). These findings are discussed in detail below.| Graphite source | Specific surface area (m2 g−1) | Ref. |
|---|---|---|
| Natural flake graphite | 2.34 | 3 |
| Petroleum coke-derived graphite | 1.50 | 28 |
| Bamboo-derived graphite | 2.50 | 28 |
| Pitch-based graphite | 3.00 | 28 |
| Birch-derived graphite | 3.20 | 28 |
| Oak-derived graphite | 3.30 | 28 |
| Anthracite-based graphite | 3.36 | 29 |
| KG flakes recovered from BFADP | 4.00 | This work |
Furthermore, BET analysis was also performed on GO, C-rGO and TKrGO samples to determine SSA, pore volume, and pore diameter and the summarized results are presented in Table 4. The SSA and pore volume significantly influence the electrochemical behaviours of these materials. Chemical activation, physical activation, template approach, and self-assembly of graphene nanosheets are a few techniques used to develop carbon materials with high SSA.30 The SSA of GO was initially 3.8 m2 g−1. The SSA of C-rGO, produced by reducing GO with ascorbic acid, was measured at 102.6 m2 g−1.
| Sample | SSA SBET (m2 g−1) | Total pore volume (cm3 g−1) | Micro pore volume (cm3 g−1) | Mesopore volume (cm3 g−1) | Avg. pore diameter (nm) |
|---|---|---|---|---|---|
| KG | 4.0 | 0.023 | 0.001 | 0.022 | 11.50 |
| GO | 3.8 | 0.038 | 0.005 | 0.033 | 17.70 |
| C-rGO | 102.6 | 0.189 | 0.009 | 0.180 | 3.51 |
| TKrGO-550 | 154.3 | 0.131 | 0.004 | 0.126 | 1.69 |
| TKrGO-650 | 235.9 | 0.204 | 0.028 | 0.176 | 1.72 |
| TKrGO-750 | 148.7 | 0.148 | 0.009 | 0.139 | 1.99 |
| TKrGO-850 | 63.3 | 0.155 | 0.003 | 0.151 | 4.90 |
Further in this study, GO was chemically activated using KOH at different temperatures to improve SSA. At 550 °C, it increased significantly to 154.3 m2 g−1, about a 40-fold improvement over GO. The highest SSA, 235.9 m2 g−1, was achieved at 650 °C, showing a nearly 60 times increase over GO owing to maximum exfoliation at this temperature; however, it remained significantly below the theoretical maximum of 2630 m2 g−1. This limitation arises from restacking the material during synthesis, which effectively reduces the available surface area. This is also evident from the N2 adsorption isotherms shown in Fig. 3. Beyond 650 °C, a decline in SSA was observed, attributed to the release of CO2 and CO from the carbon lattice and partial combustion of the carbon skeleton, further decreasing surface area.31
 | ||
| Fig. 3 N2 adsorption–desorption isotherms. | ||
The pore diameters are categorized by the International Union of Pure and Applied Chemistry (IUPAC) based on their sizes: micropores with diameters smaller than 2 nm, mesopores ranging from 2 to 50 nm, and macropores larger than 50 nm. Macropores support the penetration and wetting of electrolyte ions. On the other hand, mesopores offer a substantial accessible surface area for ion movement and charge storage, and micropores contribute by increasing the SSA of the material.32
Porous structures are typically characterized by the physical adsorption of inert gases such as nitrogen or argon at low pressures. The shapes of the resulting adsorption–desorption isotherms reveal information about the pore sizes, which are categorized into micropores, mesopores, and macropores. Fig. 3 presents the N2 adsorption–desorption isotherms of the C-rGO and TKrGO samples, which correspond to Type IV isotherms with an H4-type hysteresis loop. Type IV isotherms are characteristic of mesoporous materials, featuring a hysteresis loop and saturation plateau at relative pressures (p/p0) between 0.6 and 0.95. The hysteresis loop arose from capillary condensation within the mesopores as the relative pressure increased. At lower pressures, the isotherm resembles that of macroporous materials, in which the surface is initially covered by a monolayer. As the pressure increases to intermediate levels, multilayer adsorption occurs, and beyond a certain threshold, capillary condensation leads to a rapid increase in the adsorbed volume. Once the mesopores are filled, additional adsorption occurs on the limited external surface area. The H4 hysteresis at higher relative pressures (P/P0) is attributed to the capillary condensation filling the mesopores and is typically associated with narrow, slit-like pores.33 The hysteresis loops present in the desorption isotherms confirm the presence of slit-like micropores and mesopores within the sample structure, indicating a well-defined porous framework.34
The investigation revealed that carbonization temperature plays a crucial role. Among the thermally activated samples, the highest micropore and mesopore volumes were achieved with TKrGO-650. This sample exhibited the highest BET surface area (SBET) of 235.9 m2 g−1, making it the optimal candidate for further detailed characterization. Typically, an increase in SSA is closely associated with the development of micropores, as materials with high SSA often feature substantial micropore volumes. Conversely, samples with reduced micropore volumes, such as TKrGO-750 and TKrGO-850, demonstrated lower SSA, as shown in Table 4. The micropore size distribution plot is shown in Fig. S1 (ESI†).
 | ||
| Fig. 4 XRD patterns of (a) BFADP and (b) KG flakes after purification. | ||
After undergoing the series of purification processes described in the Experimental section, several peaks related to impurities were eliminated, as shown in Fig. 4(b), suggesting the successful removal of impurities and effectiveness of the purification process employed in our work. In BFADP, the primary phase components were iron oxide, quartz, and graphite. Following the purification process, graphite emerged as the dominant phase, suggesting that the magnetic separation, decantation, and HCl acid leaching employed in our work effectively eliminated the impurities. Additionally, both before and after purification, the XRD data exhibited similarity, with the (002) diffraction peak near 26.3° displaying a sharp peak, indicative of the high crystallinity of KG. After purification, a slight shift in the (002) diffraction peak position to 26.2° was observed, as shown in Fig. 4(b). The d-spacing (d002) values before and after purification were calculated using eqn (1) and were found to be 0.349 and 0.340 nm, respectively. Although the acid-leaching treatment caused a slight expansion in the layer spacing, it remained near the interlayer spacing of graphite (0.335 nm). The crystallite sizes of the KG flakes before and after purification were calculated using eqn (2) and were found to be 51.72 nm and 47.35 nm, respectively.
The identification of the lattice planes was performed using JCPDS file no. 65-1528 and 75-1621.35 Upon oxidizing KG flakes, XRD analysis revealed a sharp diffraction peak corresponding to GO at approximately 2θ = 9.72° with an interlayer spacing of 0.886 nm, indicating the complete oxidation of the KG flake precursor, as shown in Fig. 5. This increased interlayer spacing in GO compared to KG is ascribed to the inclusion of functional groups such as hydroxyl, epoxy, and carboxyl groups related to oxygen between the layers. Furthermore, the XRD pattern of GO (Fig. 5(b)) showed a weak diffraction peak at around 2θ = 42.3°, suggesting the presence of a turbostratic band of disordered carbon materials.27,36–38 The XRD analysis also validated the reduction of GO. As shown in Fig. 5(b), the diffraction peak of GO (2θ = 9.72°) shifted to 2θ = 26.65°, and the intensity decreased after reduction to C-rGO with the aid of a reduction agent. This shift was correlated with a reduced layer-to-layer distance of 0.334 nm. The reduction process involved the removal of functional groups related to oxygen, as evidenced by the decrease in the interlayer distance from 0.886 nm to 0.334 nm. Similar results are observed for the GO samples that were thermally reduced at 650 °C seen in Fig. 5(c). The data obtained from the XRD analysis of the KG, GO, C-rGO, and TKrGO-650 are shown in Table 5.
 | ||
| Fig. 5 XRD of (a) GO, (b) C-rGO and (c) TKrGO-650. | ||
| Sample | 2θ peak (°) | d-Spacing (nm) | Crystallite size (nm) |
|---|---|---|---|
| KG | 26.20 | 0.340 | 47.350 |
| GO | 9.72 | 0.886 | 9.54 |
| C-rGO | 26.65 | 0.334 | 7.23 |
| TKrGO-650 | 26.21 | 0.339 | 1.24 |
![[double bond, length as m-dash]](https://www.rsc.org/images/entities/char_e001.gif) C group, was observed in the GO samples. In GO, a strong peak was detected at approximately 1717 cm−1, corresponding to the stretching vibration of carboxyl groups (–COOH). The presence of these oxygen-containing groups indicated the oxidation of graphite.40 GO is characterized by the presence of oxygen functional groups in its basal plane. These groups, which include epoxide, hydroxyl, carbonyl, and carboxyl moieties, contribute to high oxygenation levels.41 The characteristic peaks of GO either vanished or exhibited significantly lower intensities after reduction. These findings strongly indicated a substantial reduction in GO.
C group, was observed in the GO samples. In GO, a strong peak was detected at approximately 1717 cm−1, corresponding to the stretching vibration of carboxyl groups (–COOH). The presence of these oxygen-containing groups indicated the oxidation of graphite.40 GO is characterized by the presence of oxygen functional groups in its basal plane. These groups, which include epoxide, hydroxyl, carbonyl, and carboxyl moieties, contribute to high oxygenation levels.41 The characteristic peaks of GO either vanished or exhibited significantly lower intensities after reduction. These findings strongly indicated a substantial reduction in GO.
 | ||
| Fig. 6 FTIR spectra of (a) KG, GO and C-rGO, and (b) TKrGO samples. | ||
| Sample | O–H hydroxyl | C–H bending | O–H carboxyl | CO stretching |
CC stretching |
O–H bending | C–O stretching |
|---|---|---|---|---|---|---|---|
| KG | 3752 | — | — | — | — | — | 1089 |
| GO | 3255 | 2812 | 2358 | 1717 | 1583 | 1394 | 1046 |
| C-rGO | 3369 | 2780 | 2346 | 1719 | 1561 | 1420 | 1043 |
The FTIR spectrum of GO exhibited several distinct peaks: a faint band at 2812 cm−1 corresponding to symmetric C–H bond vibrations, a carbonyl CO stretching vibration at 1717 cm−1, a CC stretching vibration of unoxidized graphitic domains at 1583 cm−1, O–H bending at 1394 cm−1, C–O stretching of epoxy groups at 1165 cm−1, and C–O stretching vibration of alkoxy groups at 1046 cm−1. These results validated the presence of various oxygen-containing functional groups, including epoxy, hydroxyl, carbonyl, and carboxyl groups, within the GO structure. Furthermore, the FTIR analysis corroborated the findings of prior research.39,42,43 The detection of oxygen-containing functional groups, notably CO and C–O, in the FTIR spectra of GO provided additional evidence supporting the transformation of graphite into GO through oxidation.43 FTIR spectroscopy also helps analyze the reduction process of GO. The graph demonstrates a significant reduction in the intensities of the peaks associated with oxygen-containing functionalities in C-rGO compared to those in GO, indicating the successful reduction of GO by ascorbic acid.44
The IR spectrum of TKrGO did not contain any absorption bands corresponding to oxygen functional groups, indicating complete reduction, as shown in Fig. 6(b).
 | ||
| Fig. 7 Raman spectra of (a) KG, GO, and C-rGO, and (b) TKrGO samples. | ||
The minimal intensity of the D-band at 1360 cm−1 in the Raman spectra of the KG flakes shown in Fig. 7(a) indicates the highest level of structural perfection. The G peak was observed at 1581 cm−1, indicating the in-plane vibrational mode of graphitic carbon. The ratio of the intensity of the D peak to that of the G peak (ID/IG) is a widely employed measure for evaluating the prevalence of graphite structures within the carbon matrix. A lower ID/IG value indicates a greater abundance of ordered graphite structures within the carbon matrix and a higher perfection of the sp2 hybridized structure. For KG, the ID/IG ratio was 0.04. Another characteristic feature observed in the Raman spectra of KG flakes after purification is the 2D peak around 2700 cm−1, which indicates a highly ordered graphite lattice and the existence of a graphene-like morphology within the carbon matrix.21 After oxidation, a distinct D band emerged at 1353 cm−1 for GO, while the G band broadened and shifted to a higher wavenumber at 1587 cm−1, as illustrated in Fig. 7(a). The increased intensity of the D band indicates the formation of defect-like domains in the graphene structure due to the presence of oxidative functional groups, leading to a significant rise in the ID/IG ratio to 0.94. Furthermore, after reduction with ascorbic acid, the Raman spectrum of C-rGO revealed an even higher defect density, with the ID/IG ratio increasing to 1.19, as detailed in Table 7.
| Sample | D band (cm−1) | G band (cm−1) | I D/IG | 2D band (cm−1) |
|---|---|---|---|---|
| KG | 1363 | 1581 | 0.04 | 2717 |
| GO | 1353 | 1587 | 0.94 | 2677.5, 2931.0 |
| C-rGO | 1353 | 1596 | 1.19 | 2688.6, 2949.8 |
Additionally, a significant feature of graphite in the Raman spectrum appears around 2700 cm−1, which is used to assess the structural properties related to c-axis orientation. This band is highly sensitive to the number of layers (fewer than five monolayers) and the stacking order of graphite along the c-axis. For KG, a distinct 2D peak at 2717 cm−1 confirms the presence of stacked graphitic multilayers. However, after undergoing chemical oxidation, GO exhibits a weak 2D band, attributed to significant structural modifications in the graphite lattice. The incorporation of oxygen-containing functional groups between the graphitic layers at both the basal plane and edges disrupts the stacking order, resulting in a more disordered structure.33,34
The Raman spectra shown in Fig. 7(b) of the TKrGO samples revealed two primary characteristic bands between 1300 cm−1 and 1600 cm−1. The G band is indicative of sp2-bonded carbon atoms in the structure, and the D band signifies disorder in the form of defects or amorphous carbon species. The intensity ratio of the D and G bands (ID/IG) provides valuable information about graphitization quality. According to the Raman spectra, this ratio increased slightly with higher annealing temperatures, from 0.97 in TKrGO-550 to 1.47 in TKrGO-850, alongside a significant increase in the D band, as shown in Table 8. This trend suggests enhanced graphitization accompanied by an increase in structural defects. While some sp2 domains were partially restored, oxygen reduction introduced additional defects, resulting in smaller and more dispersed sp2 domains. Higher degrees of thermal shock promote more effective reduction, yet functional groups such as carbonyl and epoxy are removed as CO2 and CO, leading to defect formation within the lattice structure.31
| Sample | D band (cm−1) | G band (cm−1) | I D/IG |
|---|---|---|---|
| TKrGO-550 | 1350 | 1600 | 0.97 |
| TKrGO-650 | 1346 | 1590 | 0.99 |
| TKrGO-750 | 1346 | 1594 | 1.34 |
| TKrGO-850 | 1350 | 1590 | 1.47 |
 | ||
| Fig. 8 FESEM images of (a) KG, (b) GO, and (c) C-rGO. | ||
Unlike KG, graphite oxide depicted in Fig. 8(b) exhibits a surface with irregular wrinkles, which might result from the numerous functional groups introduced by the oxidation process. The image reveals a curtain-like porous three-dimensional overlapped structure, which is formed by the exfoliation and restacking of GO. Moreover, the distance between the two layers became larger than that of KG, which supports the XRD results.47 These results confirm the successful oxidation conversion of KG to GO. Fig. 8(c) illustrates the highly wrinkled structure of C-rGO compared with that of GO. These wrinkles are attributable to distortions in the honeycomb lattice, which contribute to the topographical features of the material.48 Upon the reduction of GO to C-rGO, the abundant functional groups present were removed, consequently reducing their stability and resulting in a wrinkled structure.49
 | ||
| Fig. 9 (a) XPS spectrum of KG, GO and C-rGO (top row), and (b) deconvoluted XPS spectra of C 1s for KG, GO and C-rGO (bottom row). | ||
| Sample | C | O | C/O |
|---|---|---|---|
| GO | 74.6 | 24.3 | 3.1 |
| C-rGO | 81.7 | 12.5 | 6.5 |
Detailed information about the functional groups obtained from the deconvoluted high-resolution C 1s XPS spectra for KG, GO and C-rGO is shown in Fig. 9(b). The C 1s peak of KG was deconvoluted into four distinctive peaks: C–H/C–C (284.5 eV), C–O (285.0 eV), CO (284.1 eV), and –COOH (285.82 eV), with respective contents of 60%, 26%, 19%, and 14.00%. Similar findings have been previously reported in the literature.6 The C 1s spectrum of GO (Fig. 9(b)) shows a saddle-like shape, indicating a high level of oxidation. It is also an indication that GO consists of atomically thin carbon sheets with sp2 and sp3 hybridized carbon atoms, bonded to functional groups.50 The deconvoluted XPS spectra of the GO and C-rGO spectrum have five distinct peaks at binding energies of 283.6, 284.2, 284.8, 286.1, and 286.5 eV, corresponding to CC, C–C, C–O (hydroxyl and epoxy), CO (carbonyl), and O–CO (carboxyl) functional groups, respectively.51
Initially, during the reduction process, we observed that the carbonyl groups were first converted into C–O bonds. This transformation is evident when comparing the C-rGO sample with the GO sample; there is a rapid decrease in the peak around 284.8 eV. In contrast, the O–CO peak was absent after reduction in the C-rGO sample, as shown in Fig. 9(b). It can also be seen that the hydroxyl and epoxy peaks are very weak in C-rGO compared to GO. It can be interpreted that these functional groups were reduced. This change generally indicates the transformation of GO to C-rGO, resulting in enhanced electrical conductivity and improved material properties.52 It is also observed that for the C-rGO sample, the high-resolution C 1s spectra revealed a shift from the double peak observed in pristine GO to a single sharp peak, signaling the restoration of sp2 bonding in the graphene structure. Additionally, the peaks associated with the oxygen functional groups diminished in intensity in the deconvoluted C 1s spectra for C-rGO.
 | ||
| Fig. 10 TEM image (top), HRTEM images depicting the fringe pattern (middle), and SAED pattern (bottom) of KG, GO, C-rGO, and TKrGO-650. | ||
Selected-area electron diffraction (SAED) patterns of KG, GO, C-rGO and TKrGO-650 are shown in Fig. 10 (bottom row). The SAED pattern of KG demonstrates an ideal hexagonal-phase crystal structure, indicating a highly crystalline structure, which is consistent with the results obtained from XRD and Raman spectroscopy.7 The SAED pattern of GO shows the polycrystalline nature of the sample, attributed to the presence of sp3 carbon atoms formed during the oxidation process.56 The diffused, continuous, and thick circular rings observed in the SAED pattern confirm the disordered structure of C-rGO and TKrGO-650.57,58 The distinction between crystalline KG, and amorphous TKrGO-650 is evident from the SAED patterns.
3.3 Electrochemical characterization
The C-rGO and TKrGO samples were used to fabricate the electrodes of EDLCs. They were then characterized by CV, EIS, and GCD tests to assess the relationship between their structural characteristics and EDLC performance. These tests present a valuable method for assessing capacitive behavior, electrochemical stability, and specific capacitance of a device. Cyclic voltammetry (CV) is a widely used technique for evaluating capacitive behavior and differentiating between non-faradaic and faradaic reactions. Initially, CV measurements for C-rGO were performed at a scan rate of 5 mV s−1 across multiple voltage windows, as illustrated in Fig. S2 (ESI†). The cell demonstrated stable performance up to 1 V, beyond which distortions were observed, leading to the selection of 0–1 V as the optimal voltage window.Fig. 11(a) shows the CV profiles of all EDLCs in the potential window of 0 V to 1 V at 5 mV s−1 scan rate. The CV curve of the EDLC incorporating the C-rGO sample exhibited a larger enclosed area, indicating an enhanced charge storage capability. Using eqn (3), the specific capacitance from CV analysis at 5 mV s−1 was calculated for the C-rGO and TKrGO samples, and the data are presented in Table 10. The data highlights a significant improvement in the specific capacitance of the EDLC fabricated with C-rGO compared with that of the TKrGO samples. Remarkably, the C-rGO sample produced through ascorbic acid reduction exhibited a two-fold increase in specific capacitance. This improvement is likely due to better ion adsorption behavior, which is influenced by its optimal pore size (between 2 and 5 nm). When an electric field is applied, oppositely charged external ions are electrostatically adsorbed onto the pore surfaces, forming an electric double layer (EDL). When the pore size is comparable to the thickness of the EDL, the layers begin to overlap.59 If the micropores are smaller than 2 nm, this overlapping effect disrupts the EDLC behavior, leading to a loss of capacitance. Furthermore, previous research has shown that the presence of mesopores, particularly those in the 2–5 nm range, significantly enhances capacitance by facilitating better ion diffusion and charge storage.60,61 Furthermore, the low defect ratio of C-rGO, as confirmed by Raman analysis, played a crucial role in preserving its structural integrity and enhancing the performance of the EDLC. In contrast, while TKrGO samples achieve a higher SSA, they compromise the critical functional surface properties and pore accessibility, which are essential for efficient EDLC applications. This underscores the importance of structural and functional optimization in achieving outstanding electrochemical performance.62
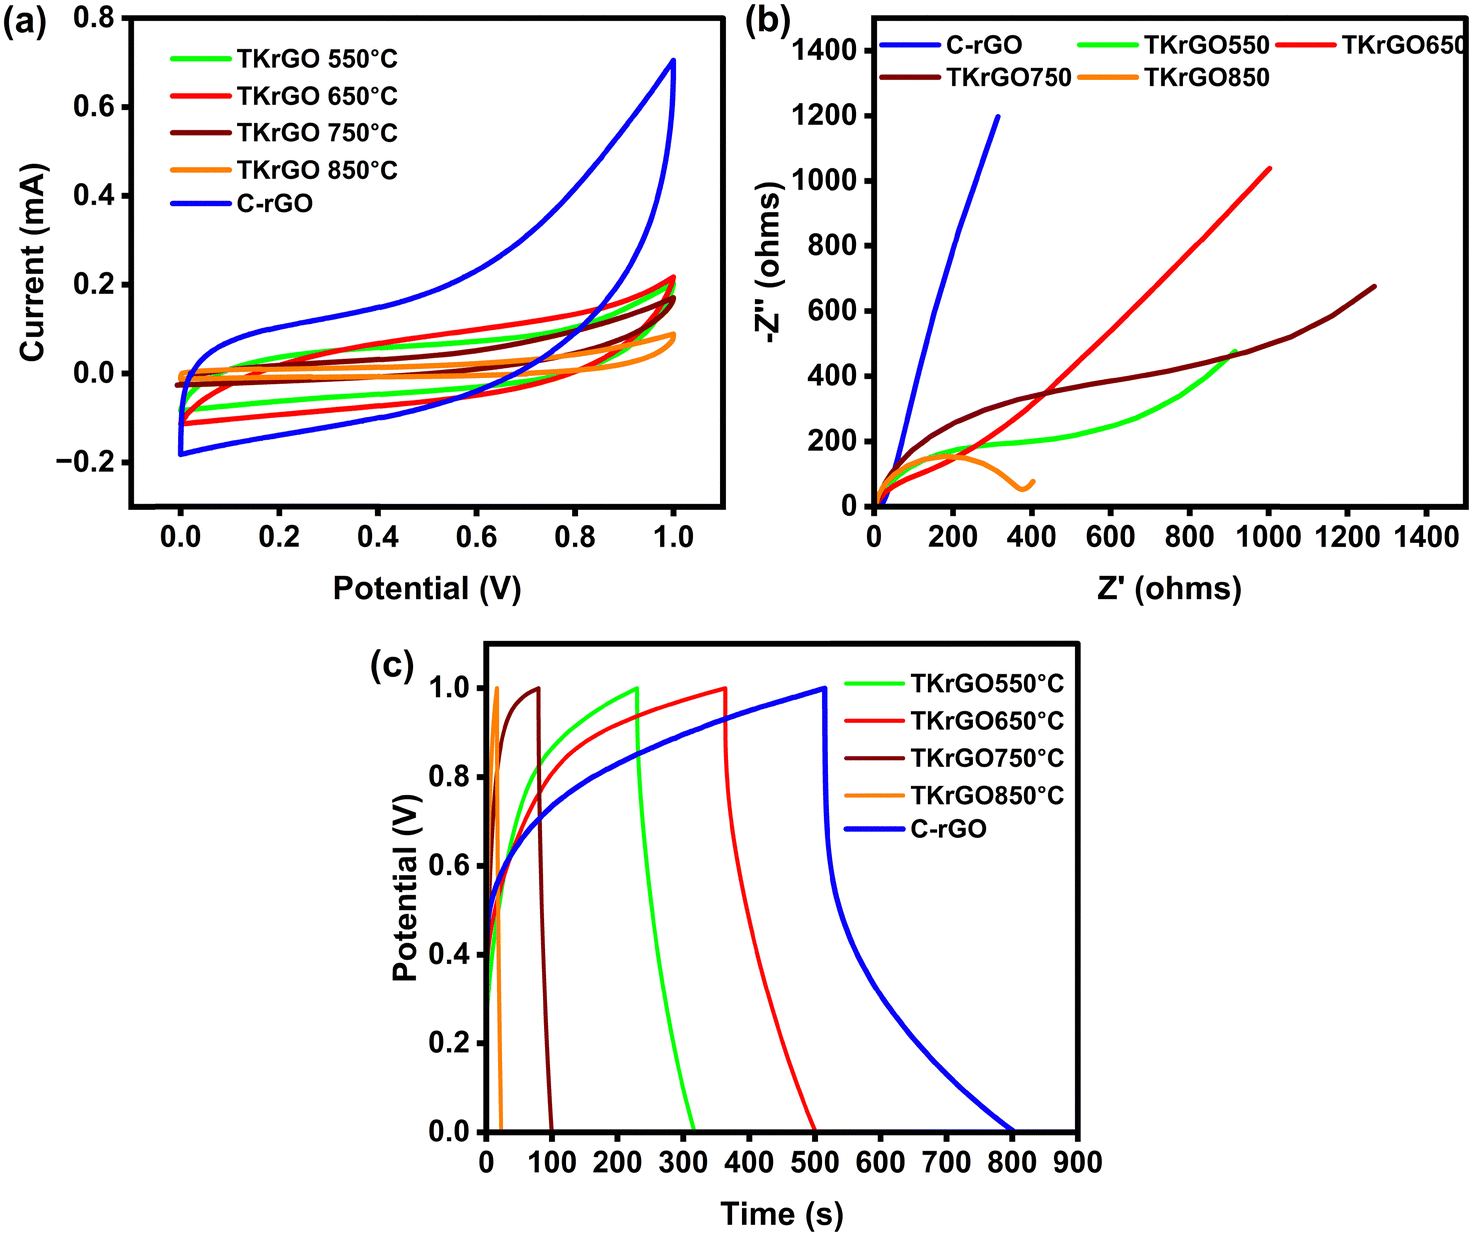 | ||
| Fig. 11 (a) CV, (b) EIS and (c) GCD graphs of C-rGO and TKrGO samples. | ||
| Device | Specific capacitance (F g−1) |
|---|---|
| C-rGO | 112 |
| TKrGO550 | 36 |
| TKrGO-650 | 46 |
| TKrGO-750 | 12 |
| TKrGO-850 | 10 |
Fig. 11(b) shows the Nyquist plots produced using the C-rGO and TKrGO samples paired with the KOH electrolyte. These spectra indicate that the cells do not exhibit the characteristic behavior of ideal capacitors (i.e., a vertical response at low frequencies). However, the response of the EDLC with the C-rGO sample approached ideal behavior, which can be attributed to its pore size being within the optimal range of 2–5 nm. In contrast, the other samples with pore sizes smaller than 2 nm deviated further from the ideal capacitive behavior. It is evident that the increased pore width of the C-rGO sample affects the diameter of the semicircle observed in the high-frequency region of the Nyquist plot, which is known as the charge-transfer resistance. This semicircle arises from the interfacial impedance between the electrode and electrolyte. The diameter, which is influenced by ionic mobility, serves as a measure of ionic resistance. As the pore size increased, both the ionic resistance and equivalent series resistance (ESR) decreased. This reduction signifies enhanced ion transport between the electrode and electrolyte, as well as a lower overall resistance for the EDLC utilizing the C-rGO sample. In contrast, for the TKrGO samples, the resistance to ion movement was significantly higher because of the restricted pore sizes, which were smaller than 2 nm. These smaller pores hinder efficient ion transport, increasing ionic resistance and giving less favorable electrochemical performance.63
The charge–discharge process of the EDLC in this study was evaluated using the GCD technique. Fig. 11(c) presents the charge–discharge profiles of the EDLC with C-rGO and TKRGO-650 electrodes. The linearity of the discharge slope confirms the characteristic capacitive behavior of the EDLCs. The specific capacitance (Cs), energy, and power density of the EDLC were determined from the charge–discharge curves using eqn (5)–(7), and are tabulated in Table 11.
| Device | C s (F g−1) | E (Wh kg−1) | P (W kg−1) |
|---|---|---|---|
| C-rGO | 85.3 | 7.7 | 97 |
| TKrGO-550 | 37.1 | 4.4 | 186 |
| TKrGO-650 | 61.9 | 6.5 | 176 |
| TKrGO-750 | 8.8 | 1.1 | 184 |
| TKrGO-850 | 2.8 | 0.3 | 180 |
Further detailed electrochemical analysis was performed on the C-rGO sample, which exhibited the highest specific capacitance. The analysis included CV, GCD, EIS, and cycling stability tests. Fig. 12(a) shows the CV pattern of the fabricated EDLC with C-rGO electrodes. The investigations were conducted under ambient conditions at different 5, 10, 20, 50, and 100 mV s−1. The CV curves show a typical quasi-rectangular shape, which is characteristic of EDLC devices with good symmetry, even at higher scan rates. The specific capacitance of the devices was calculated at various scan rates and is tabulated in Table 12. Since the electrolyte ions have ample time to penetrate the active sites on the electrode surface at low scan rates, the specific capacitance is high. Conversely, at higher scan rates, the limited migration of electrolyte ions hampers diffusion activity, rendering many active surfaces of the electrode inaccessible for charge storage, which leads to a lower specific capacitance. The highest specific capacitance calculated for the device was 112 F g−1 at 5 mV s−1.
 | ||
| Fig. 12 Electrochemical characterization of the EDLC device with the C-rGO electrodes: (a) cyclic voltammogram, (b) GCD and (c) EIS plots. | ||
| Scan rate (mV s−1) | Specific capacitance (F g−1) |
|---|---|
| 5 | 112 |
| 10 | 76 |
| 20 | 53 |
| 50 | 30 |
| 100 | 18 |
Fig. 12(b) shows the GCD curves at different current densities. This test was performed in the potential range of 0–1 V. This observation revealed an almost linear discharge slope, indicating capacitive behavior at the electrode surfaces.64 The specific capacitance was determined by analyzing the slope of the discharge curve. GCD curves provide the necessary data for calculating the specific capacitance, energy density, and power density values. These calculations are performed using eqn (5)–(7), and the results are shown in Table 13.
| Current density (mA g−1) | C s (F g−1) | E (Wh kg−1) | P (W kg−1) |
|---|---|---|---|
| 0.1 | 85.3 | 7.7 | 97 |
| 0.2 | 73.2 | 6.5 | 112 |
| 0.3 | 64.8 | 5.8 | 128 |
| 0.4 | 59.1 | 4.9 | 140 |
| 0.5 | 49.7 | 4.6 | 164 |
The internal resistance of the SC device was assessed by EIS analysis and Nyquist plots. Fig. 12(c) shows the Nyquist plot, where the starting point represents the bulk electrolyte resistance, denoted as Rs, whereas the semicircle observed at high frequencies corresponds to the charge-transfer resistance, denoted as RCT. At low frequencies, the steep slope indicates significant charge accumulation at the electrode/electrolyte interface caused by the presence of free ions, indicating EDLC formation and capacitive behavior of the SC. The equivalent circuit of the impedance spectra (shown in the inset of Fig. 12(c)) comprises an ohmic serial resistance Rs in series with a parallel combination of charge transfer resistance (RCT) and a constant phase element (CPE1) followed by another constant phase element (CPE2) in series. The Rs is determined from the intersection of the Nyquist plot with the real axis at the highest frequency, representing the internal resistance of the system, including contributions from the electrolyte, connecting wires, and their junctions. The RCT which arises at the electrode/electrolyte interface, is inferred from the diameter of the depressed semicircle observed on the real axis of the Nyquist plot. According to this model, the SC device displayed the lowest internal resistance of 0.56 Ω and a notably small semicircle, with an RCT value of 18.53 Ω, which is potentially attributed to enhanced electrode–electrolyte contact, as depicted in Fig. 12(c).
The stability of the electrode material is a critical factor in assessing the performance of an energy storage device (ESD). Fig. 13(a) shows the cycling stability of the assembled EDLC over 1000 cycles at a current density of 0.2 mA g−1. Because charge storage in this EDLC occurs through a physical process involving the reversible adsorption and desorption of ions at the electrode/electrolyte interface, it does not undergo chemical charge transfer reactions or phase changes during charge–discharge cycles. Consequently, the capacitance remained highly stable over extended cycling, with minimal degradation.
 | ||
| Fig. 13 Plots of (a) efficiency and specific capacitance, (b) energy and power density values of EDLC with two electrodes containing 1 mg cm2 of CrGO at a current density of 0.2 mA g−1 for 1000 cycles. | ||
Another essential parameter for evaluating the cycling stability of an EDLC is the coulombic efficiency (η), which is calculated using the formula:  where td and tc represent the discharge and charge times, respectively. The coulombic efficiency of the EDLC over 1000 cycles, as illustrated in Fig. 13(a), remained consistent, indicating stable performance during extended cycling. A higher coulombic efficiency typically indicates strong electrode–electrolyte interactions and minimal energy loss, demonstrating the electrochemical reliability and durability of the device.
Ragone plots, shown in Fig. 13(b), were utilized to illustrate the relationship between energy density and power density of the EDLC device. These plots provide valuable insights into the trade-off between the amount of energy stored and the rate at which it can be delivered, helping evaluate the efficiency of the device in real-world applications. The energy density and power density of an EDLC are determined using eqn (6) and (7), which quantify the storage and delivery capabilities of the system, enabling direct comparison of the performance of the EDLC with other energy storage technologies, such as batteries and conventional capacitors. The EDLC demonstrated a maximum energy density of 7.7 Wh kg−1 and a power density of 97 W kg−1. These energy density values are comparable to those of commercially available EDLCs, which typically range from 5 to 8 Wh kg−1.65 These values indicate the device's capability to store and deliver energy efficiently, making it suitable for high-power applications.
3.4 Effect of specific surface area and porosity of C-rGO and TKrGO samples on EDLC capacitance
The correlation between the specific capacitance and BET results reveals that samples with smaller pore diameters, particularly micropores less than 2 nm, exhibit reduced specific capacitance due to limited ion accessibility. For example, although TKrGO-650 has the highest SBET owing to its larger micropore volume, its specific capacitance remains low because of the predominance of smaller pores ∼1.72 nm (<2 nm), which restricts ion transport. Additionally, the results indicate that pores within the 2–5 nm range are optimal for enhancing the capacitance, as seen in the C-rGO sample, which has a pore diameter of 3.51 nm. This finding is consistent with those of previous studies.59,66 Despite its low SSA, C-rGO exhibited a higher capacitance than TKrGO-650. To investigate this, the pore size distributions of all the samples obtained from the BET analysis were analyzed (see Table 4). The results indicated that all samples with a lower specific capacitance had a pore size of <2 nm. Micropores (<2 nm) in carbon materials hinder charge transfer and reduce conductivity, while also lowering electrode density. When an electric field is applied, oppositely charged external ions are electrostatically adsorbed onto the pore surfaces, forming an electric double layer (EDL). When the pore size approaches the electric double-layer (EDL) thickness, overlapping occurs. In micropores smaller than 2 nm, this overlap disrupts the EDLC mechanism, leading to reduced capacitance.59 Although a higher surface area can improve capacitance in EDLCs, excessive microporosity limits conductivity and overall performance. Compared to the other samples, the C-rGO sample showed more pores that developed around 4 nm.67 These findings underscore the importance of balanced pore size distribution and optimal pore diameters for achieving superior performance in EDLCs, a conclusion supported by several prior studies.59,664 Conclusion
The study demonstrated a simple, cost-effective, and scalable approach to retrieving KG flakes from blast furnace dust using magnetic separation, decantation, and acid leaching, yielding highly crystalline flakes comparable to natural graphite.• Repurposing KG flakes provides a sustainable alternative to natural graphite, advancing waste utilization and minimizing ecological impacts.
• KG-derived graphene oxide was successfully synthesized and reduced to C-rGO using an eco-friendly ascorbic acid method. KOH activation of this sample at 650 °C (TKrGO-650) further enhanced its porosity and specific surface area.
• C-rGO exhibited the highest specific capacitance (112 F g−1), while TKrGO-650, despite higher pore volume and specific surface area, showed lower capacitance (46 F g−1) due to excessive microporosity (<2 nm) limiting ion accessibility.
• This study emphasizes the critical role of optimizing pore size distribution in electrode materials for improving electrochemical performance in supercapacitor applications.
Conflicts of interest
Somashekara Bhat has a patent #202441102005 pending to Manipal Academy of Higher Education. Other authors declare that they have no known competing financial interests or personal relationships that could have appeared to influence the work reported in this paper.Data availability
The data supporting this article have been included as part of the ESI.†Acknowledgements
The research is partly supported by Vision Group of Science and Technology (VGST), No. VGST/SMYSR (2014-15)/GRD-448/2015-16 from Govt. of Karnataka, India. The authors would also like to acknowledge Central Research Facility, NITK for providing Compact Raman Spectrometer for Raman Analysis. Ankitha Rao, one of the authors, expresses gratitude for the scholarship support received from the Manipal Academy of Higher Education, Manipal.References
- A. K. Ghosh, Literature quest and survey on graphite beneficiation through flotation, Renewable Sustainable Energy Rev., 2024, 189, 113980, DOI:10.1016/J.RSER.2023.113980.
- R. Frost, The recovery of kish graphite from secondary sources, Doctoral dissertation, University of Birmingham, 2015.
- Z. Wang, X. Bao, D. Zhang, Z. Sun, X. Lu and R. Hong, Application of purified kish flake graphite as a potential cathode material for high-performance aluminum ion batteries, J. Alloys Compd., 2023, 954, 170197, DOI:10.1016/J.JALLCOM.2023.170197.
- R. Naraghi, M. Selleby and J. Ågren, Thermodynamics of stable and metastable structures in Fe–C system, CALPHAD, 2014, 46, 148–158, DOI:10.1016/J.CALPHAD.2014.03.004.
- S. Liu and C. R. Loper, Kish, a source of crystalline graphite, Carbon, 1991, 29(8), 1119–1124, DOI:10.1016/0008-6223(91)90029-I.
- I. Y. Jeon, S. H. Shin, S. M. Jung, H. J. Choi, J. Xu and J. B. Baek, One-Pot Purification and Iodination of Waste Kish Graphite into High-Quality Electrocatalyst, Part. Part. Syst. Charact., 2017, 34(9), 1600426, DOI:10.1002/PPSC.201600426.
- J. Li, et al., Combining Multiple Methods for Recycling of Kish Graphite from Steelmaking Slags and Oil Sorption Performance of Kish-Based Expanded Graphite, ACS Omega, 2021, 6(14), 9868–9875, DOI:10.1021/ACSOMEGA.1C00591/ASSET/IMAGES/LARGE/AO1C00591_0009.JPEG.
- J. C. An, H. J. Kim and I. Hong, Preparation of Kish graphite-based graphene nanoplatelets by GIC (graphite intercalation compound) via process, J. Ind. Eng. Chem., 2015, 26, 55–60, DOI:10.1016/J.JIEC.2014.12.016.
- S. Wang, K. V. Kravchyk, F. Krumeich and M. V. Kovalenko, Kish Graphite Flakes as a Cathode Material for an Aluminum Chloride-Graphite Battery, ACS Appl. Mater. Interfaces, 2017, 9(34), 28478–28485, DOI:10.1021/ACSAMI.7B07499.
- P. D. Laverty, L. J. Nicks and L. A. Walters, Recovery of flake graphite from steelmaking kish, Rep. Invest., 1994 Search PubMed , https://stacks.cdc.gov/view/cdc/10221.
- S.-J. Lee and S.-J. Park, Facile mass production of thermally reduced graphene oxide, Carbon Lett., 2012, 13(1), 48–50, DOI:10.5714/CL.2012.13.1.048.
- S. Park and R. S. Ruoff, Chemical methods for the production of graphenes, Nat. Nanotechnol., 2009, 4(4), 217–224, DOI:10.1038/nnano.2009.58.
- M. Soni, T. Arora, R. Khosla, P. Kumar, A. Soni and S. K. Sharma, Integration of Highly Sensitive Oxygenated Graphene with Aluminum Micro-Interdigitated Electrode Array Based Molecular Sensor for Detection of Aqueous Fluoride Anions, IEEE Sens. J., 2016, 16(6), 1524–1531, DOI:10.1109/JSEN.2015.2505782.
- M. Palomba, G. Carotenuto and A. Longo, A Brief Review: The Use of L-Ascorbic Acid as a Green Reducing Agent of Graphene Oxide, Materials, 2022, 15(18), 6456, DOI:10.3390/MA15186456.
- S. Farah, A. Farkas, J. Madarász and K. László, Comparison of thermally and chemically reduced graphene oxides by thermal analysis and Raman spectroscopy, J. Therm. Anal. Calorim., 2020, 142(1), 331–337, DOI:10.1007/S10973-020-09719-3.
- A. Sandaruwani and H. Sitinamaluwa, Preparation of porous graphene with ultra-high surface area from Sri-Lankan graphite, MERCon 2021 – 7th International Multidisciplinary Moratuwa Engineering Research Conference, Proceedings, 178–183, Jul. 2021 DOI:10.1109/MERCON52712.2021.9525768.
- B. Xu, et al., Highly mesoporous and high surface area carbon: a high capacitance electrode material for EDLCs with various electrolytes, Electrochem. Commun., 2008, 10(5), 795–797, DOI:10.1016/J.ELECOM.2008.02.033.
- J. Kim, J.-H. Eum, J. Kang, O. Kwon, H. Kim and D. Woo Kim, Tuning the hierarchical pore structure of graphene oxide through dual thermal activation for high-performance supercapacitor, Sci. Rep., 2021, 11, 2063, DOI:10.1038/s41598-021-81759-7 123AD.
- J. Wang and S. Kaskel, KOH activation of carbon-based materials for energy storage, J. Mater. Chem., 2012, 22(45), 23710–23725, 10.1039/C2JM34066F.
- R. M. Firdaus, A. Desforges, M. Emo, A. R. Mohamed and B. Vigolo, Physical and chemical activation of graphene-derived porous nanomaterials for post-combustion carbon dioxide capture, Nanomaterials, 2021, 11(9), 2419, DOI:10.3390/NANO11092419/S1.
- T. Rong, et al., Investigation of the enrichment-purification process and electrochemical performance of kish graphite in dust from blast furnace tapping yard, Waste Manage., 2024, 175, 121–132, DOI:10.1016/J.WASMAN.2023.12.055.
- N. Kumar and V. C. Srivastava, Simple Synthesis of Large Graphene Oxide Sheets via Electrochemical Method Coupled with Oxidation Process, ACS Omega, 2018, 3(8), 10233–10242, DOI:10.1021/ACSOMEGA.8B01283/ASSET/IMAGES/LARGE/AO-2018-01283W_0008.JPEG.
- M. D. Stoller and R. S. Ruoff, Best practice methods for determining an electrode material's performance for ultracapacitors, Energy Environ. Sci., 2010, 3(9), 1294–1301, 10.1039/C0EE00074D.
- A. Iakunkov, et al., Activated graphene as a material for supercapacitor electrodes: effects of surface area, pore size distribution and hydrophilicity, Phys. Chem. Chem. Phys., 2019, 21(32), 17901–17912, 10.1039/C9CP03327K.
- B. Andres, A. C. Engström, N. Blomquist, S. Forsberg, C. Dahlström and H. Olin, Electrode Mass Balancing as an Inexpensive and Simple Method to Increase the Capacitance of Electric Double-Layer Capacitors, PLoS One, 2016, 11(9), e0163146, DOI:10.1371/JOURNAL.PONE.0163146.
- M. F. Shukur, R. Ithnin and M. F. Z. Kadir, Electrical characterization of corn starch-LiOAc electrolytes and application in electrochemical double layer capacitor, Electrochim. Acta, 2014, 136, 204–216, DOI:10.1016/J.ELECTACTA.2014.05.075.
- V. Paranthaman, K. Sundaramoorthy, B. Chandra, S. P. Muthu, P. Alagarsamy and R. Perumalsamy, Investigation on the Performance of Reduced Graphene Oxide as Counter Electrode in Dye Sensitized Solar Cell Applications, Phys. Status Solidi A, 2018, 215(18) DOI:10.1002/PSSA.201800298.
- O. Fromm, et al., Carbons from biomass precursors as anode materials for lithium ion batteries: new insights into carbonization and graphitization behavior and into their correlation to electrochemical performance, Carbon, 2018, 128, 147–163, DOI:10.1016/J.CARBON.2017.11.065.
- J. Tu, J. Wang, H. Zhu and S. Jiao, The molten chlorides for aluminum-graphite rechargeable batteries, J. Alloys Compd., 2020, 821, 153285, DOI:10.1016/J.JALLCOM.2019.153285.
- X. Zhang, H. Zhang, C. Li, K. Wang, X. Sun and Y. Ma, Recent advances in porous graphene materials for supercapacitor applications, RSC Adv., 2014, 4(86), 45862–45884, 10.1039/C4RA07869A.
- I. Sengupta, S. Chakraborty, M. Talukdar, S. K. Pal and S. Chakraborty, Thermal reduction of graphene oxide: How temperature influences purity, J. Mater. Res., 2018, 33(23), 4113–4122, DOI:10.1557/JMR.2018.338.
- M. S. Sayed, D. Aman, M. G. Fayed, M. M. Omran, T. Zaki and S. G. Mohamed, Unravelling the role of pore structure of biomass-derived porous carbon in charge storage mechanisms for supercapacitors, RSC Adv., 2024, 14(34), 24631–24642, 10.1039/D4RA04681A.
- S. Yurdakal, C. Garlisi, L. Özcan, M. Bellardita and G. Palmisano, (Photo)catalyst Characterization Techniques: Adsorption Isotherms and BET, SEM, FTIR, UV-Vis, Photoluminescence, and Electrochemical Characterizations, Heterog. Photocatal., 2019, 87–152, DOI:10.1016/B978-0-444-64015-4.00004-3.
- Z. N. Garba and A. A. Rahim, Process optimization of K2C2O4-activated carbon from Prosopis africana seed hulls using response surface methodology, J. Anal. Appl. Pyrolysis, 2014, 107, 306–312, DOI:10.1016/J.JAAP.2014.03.016.
- I. Sengupta, S. Chakraborty, M. Talukdar, S. K. Pal and S. Chakraborty, Thermal reduction of graphene oxide: How temperature influences purity, J. Mater. Res., 2018, 33(23), 4113–4122, DOI:10.1557/JMR.2018.338/FIGURES/9.
- C. Nethravathi, J. T. Rajamathi, N. Ravishankar, C. Shivakumara and M. Rajamathi, Graphite oxide-intercalated anionic clay and its decomposition to graphene-inorganic material nanocomposites, Langmuir, 2008, 24(15), 8240–8244, DOI:10.1021/LA8000027/ASSET/IMAGES/MEDIUM/LA-2008-000027_0005.GIF.
- P. Kokmat, P. Surinlert and A. Ruammaitree, Growth of High-Purity and High-Quality Turbostratic Graphene with Different Interlayer Spacings, ACS Omega, 2022, 8(4), 4010, DOI:10.1021/ACSOMEGA.2C06834/SUPPL_FILE/AO2C06834_SI_001.PDF.
- T. F. Emiru and D. W. Ayele, Controlled synthesis, characterization and reduction of graphene oxide: a convenient method for large scale production, Egypt. J. Basic Appl. Sci., 2017, 4(1), 74–79, DOI:10.1016/J.EJBAS.2016.11.002.
- M. Bera, P. Gupta and P. K. Maji, Facile One-Pot Synthesis of Graphene Oxide by Sonication Assisted Mechanochemical Approach and Its Surface Chemistry, J. Nanosci. Nanotechnol., 2017, 18(2), 902–912, DOI:10.1166/JNN.2018.14306.
- S. N. Alam, N. Sharma, L. Kumar, S. N. Alam, N. Sharma and L. Kumar, Synthesis of Graphene Oxide (GO) by Modified Hummers Method and Its Thermal Reduction to Obtain Reduced Graphene Oxide (rGO)*, Graphene, 2017, 6(1), 1–18, DOI:10.4236/GRAPHENE.2017.61001.
- J. Du and H. M. Cheng, The Fabrication, Properties, and Uses of Graphene/Polymer Composites, Macromol. Chem. Phys., 2012, 213(10–11), 1060–1077, DOI:10.1002/MACP.201200029.
- D. Roy Chowdhury, C. Singh and A. Paul, Role of graphite precursor and sodium nitrate in graphite oxide synthesis, RSC Adv., 2014, 4(29), 15138–15145, 10.1039/C4RA01019A.
- J. Song, X. Wang and C. T. Chang, Preparation and characterization of graphene oxide, J. Nanomater., 2014, 2014(1), 276143, DOI:10.1155/2014/276143.
- T. F. Emiru and D. W. Ayele, Controlled synthesis, characterization and reduction of graphene oxide: a convenient method for large scale production, Egypt. J. Basic Appl. Sci., 2017, 4(1), 74–79, DOI:10.1016/J.EJBAS.2016.11.002.
- J. Jiang, W. Yang, Y. Cheng, Z. Liu, Q. Zhang and K. Zhao, Molecular structure characterization of middle-high rank coal via XRD, Raman and FTIR spectroscopy: implications for coalification, Fuel, 2019, 239, 559–572, DOI:10.1016/J.FUEL.2018.11.057.
- S. Wang, K. V. Kravchyk, F. Krumeich and M. V. Kovalenko, Kish Graphite Flakes as a Cathode Material for an Aluminum Chloride-Graphite Battery, ACS Appl. Mater. Interfaces, 2017, 9(34), 28478–28485, DOI:10.1021/ACSAMI.7B07499/ASSET/IMAGES/LARGE/AM-2017-07499T_0003.JPEG.
- Y. Huang, M. Zeng, J. Ren, J. Wang, L. Fan and Q. Xu, Preparation and swelling properties of graphene oxide/poly(acrylic acid-co-acrylamide) super-absorbent hydrogel nanocomposites, Colloids Surf., A, 2012, 401, 97–106, DOI:10.1016/J.COLSURFA.2012.03.031.
- A. Kröner and T. Hirsch, Current Trends in the Optical Characterization of Two-Dimensional Carbon Nanomaterials, Front. Chem., 2020, 7, 927, DOI:10.3389/FCHEM.2019.00927.
- S. Bai, et al., The influence of wrinkling in reduced graphene oxide on their adsorption and catalytic properties, Carbon, 2013, 60, 157–168, DOI:10.1016/J.CARBON.2013.04.009.
- Y. E. Shin, et al., An ice-templated, pH-tunable self-assembly route to hierarchically porous graphene nanoscroll networks, Nanoscale, 2014, 6(16), 9734–9741, 10.1039/C4NR01988A.
- J. Zhang, Y. Xu, Z. Liu, W. Yang and J. Liu, A highly conductive porous graphene electrode prepared via in situ reduction of graphene oxide using Cu nanoparticles for the fabrication of high performance supercapacitors, RSC Adv., 2015, 5(67), 54275–54282, 10.1039/C5RA07857A.
- W. Zhang, et al., Insight into the capacitive properties of reduced graphene oxide, ACS Appl. Mater. Interfaces, 2014, 6(4), 2248–2254, DOI:10.1021/AM4057562/ASSET/IMAGES/MEDIUM/AM-2013-057562_0006.GIF.
- M. Ikram, A. Raza, M. Imran, A. Ul-Hamid, A. Shahbaz and S. Ali, Hydrothermal Synthesis of Silver Decorated Reduced Graphene Oxide (rGO) Nanoflakes with Effective Photocatalytic Activity for Wastewater Treatment, Nanoscale Res. Lett., 2020, 15(1), 1–11, DOI:10.1186/S11671-020-03323-Y/FIGURES/9.
- B. B. Palei, T. Dash and S. Kumar Biswal, Reduced graphene oxide synthesis by dry planetary ball milling technique under hydrogen atmosphere, IOP Conf. Ser.:Mater. Sci. Eng., 2020, 872(1), 012158, DOI:10.1088/1757-899X/872/1/012158.
- Y. Quan, Q. Liu, K. Li, H. Zhang and L. Yuan, Highly efficient purification of natural coaly graphite via an electrochemical method, Sep. Purif. Technol., 2022, 281, 119931, DOI:10.1016/J.SEPPUR.2021.119931.
- M. A. Ceniceros-Reyes, et al., Reduction of graphene oxide by in-situ heating experiments in the transmission electron microscope, Surf. Interfaces, 2022, 35, 102448, DOI:10.1016/J.SURFIN.2022.102448.
- T. Arya, K. S. Rawat, B. S. Bohra, K. Garwal, P. B. Negi, C. Tewari, Y. C. Jung and N. G. Sahoo, Influence of ethylene diamine functionalized waste plastic derived reduced graphene oxide as filler on the mechanical and thermal properties of low-density polyethylene, Polym. Compos., 2024, 45(13), 12289–12306, DOI:10.1002/PC.28636.
- S. Immanuel and R. Sivasubramanian, Fabrication of two-dimensional chemically reduced graphene oxide nanosheets for the electrochemical determination of epinephrine, Bull. Mater.Sci., 2020, 43(1), 1–11, DOI:10.1007/S12034-019-2034-7/TABLES/3.
- C. H. Kwak, D. Kim and B. C. Bai, Correlation of EDLC Capacitance with Physical Properties of Polyethylene Terephthalate Added Pitch-Based Activated Carbon, Molecules, 2022, 27(4), 1454, DOI:10.3390/MOLECULES27041454.
- K. L. Yang, T. Y. Ying, S. Yiacoumi, C. Tsouris and E. S. Vittoratos, Electrosorption of Ions from Aqueous Solutions by Carbon Aerogel: An Electrical Double-Layer Model, Langmuir, 2001, 17(6), 1961–1969, DOI:10.1021/LA001527S.
- L. Zhang and X. S. Zhao, Carbon-based materials as supercapacitor electrodes, Chem. Soc. Rev., 2009, 38(9), 2520–2531, 10.1039/B813846J.
- Y. He, et al., Capacitive mechanism of oxygen functional groups on carbon surface in supercapacitors, Electrochim. Acta, 2018, 282, 618–625, DOI:10.1016/J.ELECTACTA.2018.06.103.
- A. Noofeli, P. J. Hall and A. J. R. Rennie, Ionic liquid based EDLCs: influence of carbon porosity on electrochemical performance, Faraday Discuss., 2014, 172, 163–177, 10.1039/C4FD00057A.
- S. B. Aziz, M. H. Hamsan, R. M. Abdullah and M. F. Z. Kadir, A Promising Polymer Blend Electrolytes Based on Chitosan: Methyl Cellulose for EDLC Application with High Specific Capacitance and Energy Density, Molecules, 2019, 24(13), 2503, DOI:10.3390/MOLECULES24132503.
- M. Pathak, et al., High Energy Density Supercapacitors: An Overview of Efficient Electrode Materials, Electrolytes, Design, and Fabrication, Chem. Rec., 2024, 24(1), e202300236, DOI:10.1002/TCR.202300236.
- R. T. Mayes, C. Tsouris, J. O. Kiggans, S. M. Mahurin, D. W. Depaoli and S. Dai, Hierarchical ordered mesoporous carbon from phloroglucinol-glyoxal and its application in capacitive deionization of brackish water, J. Mater. Chem., 2010, 20(39), 8674–8678, 10.1039/C0JM01911A.
- C. Ma, et al., Sustainable recycling of waste polystyrene into hierarchical porous carbon nanosheets with potential applications in supercapacitors, Nanotechnology, 2020, 31(3), 035402, DOI:10.1088/1361-6528/AB475F.
Footnote |
| † Electronic supplementary information (ESI) available. See DOI: https://doi.org/10.1039/d5ma00399g |
| This journal is © The Royal Society of Chemistry 2025 |