DOI:
10.1039/D4MA01288G
(Paper)
Mater. Adv., 2025,
6, 2677-2690
Rectification of charges on r-TiO2via Pd-cocatalysts and Schottky junctions to produce H2 for green energy systems†
Received
27th December 2024
, Accepted 15th March 2025
First published on 18th March 2025
Abstract
For a long-term and sustainable energy system, hydrogen has been considered as one of the ideal and carbon-free fuels. A significant advantage is that it exists abundantly in the form of water, natural gas and biomass. However, the drawback is that it exists in the form of compounds and is not available in a free state. Current study was designed to produce hydrogen via catalytic water-splitting reactions. The advantage of the catalytic water-splitting approach is that it is an economical, controllable and more feasible technology. The efficiency of water-splitting reactions can be enhanced by various factors, such as (i) the use of more selective and effective catalysts, (ii) extending the photon absorption capability, (iii) optimizing or predicting the ideal conditions where hydrogen production rates should be maximum, (iv) controlling the charge transfer and (v) increasing the surface active sites by employing metal cocatalysts. For this purpose, stable metal oxides, such as TiO2, were used as semiconductor supports to promote catalytic hydrogen generation. TiO2 surfaces were tuned with Pd-cocatalysts via controlled hydrothermal reactions, followed by chemical reduction. Catalysts synthesized by this method were found to be more effective in term of water-splitting. The structural and optical properties of the catalysts were assessed via XRD, UV-Vis/DRS, SEM, TEM, AFM, Raman, FTIR, PL, and EIS analytical tools. The phase purity and elemental compositions of the catalysts were confirmed by EDX and XPS techniques. Under similar conditions, photoreactions were performed in a quartz reactor (MICQ/US-150 mL). Hydrogen evolution activities and catalytic performances revealed that the Pd/r-TiO2 catalyst delivers almost ten times higher hydrogen (i.e., 23.19 mmol g−1 h−1) compared to pristine r-TiO2, which delivers only 2.15 mmol g−1 h−1 of hydrogen. The higher catalytic performance of Pd/r-TiO2 were attributed to the development of Schottky junctions that escalate and rectify the charge transfer on active sites (i.e., Pd-cocatalysts). Based on the results, it is concluded that the catalysts reported herein hold potential to replace the conventional catalysts used in hydrogen generation technologies.
Introduction
To date, fossil fuels have been the main sources of energy. Although their usage is more prominent in automobiles, conventional power sources and industries, they have several drawbacks.1 Consumption of fossil fuels is the main source of greenhouse gas emissions. These greenhouse gases are poisonous and unacceptable to our atmosphere and healthy environment. The world is facing number of environmental issues associated with the excessive use of fossil fuels. To reduce the aforementioned problems more quickly, there is an urgent need to develop alternative fuels. Among all the alternative sources/options, the use of hydrogen is more economical and feasible for green energy technologies. Solar light and catalysts can play an important role in the transformation of chemical energy into sustainable energy (i.e., hydrogen).2 The significant advantage is that hydrogen has high energy density and can potentially replace costly and conventional fuels.3 The use of hydrogen can significantly protect our atmosphere and fulfill energy demands, along with achieving the goal of zero emissions. Although there are many approaches to produce hydrogen, getting it from water-splitting reactions is a more reliable and cheaper option.4
Due to excellent stability and suitable band potentials, titanium dioxide (TiO2) has been widely used as a photocatalyst.5 Although it appears black in mineral form, it is a white and highly crystalline solid insoluble in water. Notably, It exists in three crystalline forms, i.e., rutile, anatase and brookite.6 Among all phases, rutile TiO2 (r-TiO2) is most favourable due to its high chemical resistance, thermal stability, and suitable band gap (i.e., 2.9 eV).7 It can be coupled with other semiconductor systems to enhance the catalytic efficiencies. For example, the synthesis of r-TiO2 heterojunctions with g-C3N4/r-TiO2, CdS/TiO2, MXene/TiO2, rGO/TiO2, and Cu2O/TiO2 have been found to be effective for water-splitting reactions.8–13 Another advantage is that r-TiO2 can be potentially tuned with metal cocatalysts (i.e., Pd in the current work) in order to escalate and rectify the photoinduced charges (e−/h+).
As indicated in the literature, pristine r-TiO2 is a direct band gap semiconductor, and charge recombination is relatively high due to overpotential.14 Thus, different strategies can be utilized to reduce its overpotential. These strategies include (i) metal or non-metal doping, (ii) noble metal loading, (iii) surface modifications, (iv) alteration in band potentials, (v) formation of heterojunctions and (vi) extending the absorption capability of the photon.15 The deposition of catalytically active metals, i.e., Pt, Ni, Cu, Au, and Ag, can be successfully achieved to reduce and mimic charge recombination. Many reports have indicated that catalytic performances can be enhanced by loading metal cocatalysts, i.e., Au@Zn3V2O8, Cu@CdS, Pd@gC3N4, and metal-loaded CeVO4.16–18 Additionally, metal or non-metal doping can also improve catalytic performances. It has been reported that the presence of cocatalysts on r-TiO2 lattices alter its optical and structural characteristics.17,19
It is worth mentioning that the presence of palladium (Pd) on the r-TiO2 surfaces increases catalytic performances during the photoreaction. Another important factor is that the dispersion of Pd-cocatalysts on the surface is quite important for water-splitting reactions.20,21 It has been predicted that a high dispersion of metal particles can be successfully achieved via the chemical reduction approach.22 Catalysts that have been developed via the chemical reduction approach exhibit higher catalytic performances than those prepared by other methods.23 Normally, r-TiO2 absorbs UV radiation, but its absorbance is shifted to the visible region after Pd loading. It has been reported that r-TiO2 exhibits a higher refractive index and scatters more light, promoting photon absorption.24,25 Another significant advantage is that r-TiO2 has excellent commercial potential due to its non-hazardous nature.
Currently, hydrogen fuel is receiving much interest as a sustainable energy source.26 Several methods, such as thermal combustion, biomass, photocatalysis and steam reforming, can be used for hydrogen generation. However, all the aforementioned approaches have numerous drawbacks, for example, (i) less stability and photocorrosion, (ii) low quantum yield and efficiencies, (iii) relatively higher costs, (iv) excessive use of land and labour, (v) storage and transportation, and (vi) extra burden of expert engineers.27 However, obtaining hydrogen via catalytic water splitting is the most suitable and reliable method to carry out the reaction on sunlight.28 Challenges associated with water-splitting reactions can be successfully overcome by developing Schottky junctions via metal cocatalysts. Thus, developing the Schottky barrier at the interface, rectifies the charge transfer to the active centres (metal cocatalysts).29,30
In the current work, we designed Pd/r-TiO2 catalysts (i.e., having various Pd ratios on r-TiO2), which were assessed for the hydrogen generation reactions. Results indicated that the hydrogen generation rates of Pd-loaded catalysts were quite higher than that of pristine r-TiO2. The catalytic activities and performances are discussed in the latter section. It is found that higher activities were due to the Schottky junctions and relatively higher active sites in the case of Pd/r-TiO2. Various factors, such as the pH, temperature, light intensity, and photocatalyst dose, affecting the hydrogen generation performances were assessed and discussed.
Experimental
Chemicals
Chemicals used in this work are listed in the ESI.†
Synthesis of photocatalysts
In the current study, r-TiO2 was synthesized using a recently reported approach.31 However, to produce Pd/r-TiO2, 200 mg of r-TiO2 was added to 40 mL of distilled water and magnetically stirred for 30 min to obtain a homogeneous slurry. To deposit the Pd-cocatalyst on r-TiO2 surfaces, nominal amounts of the Pd precursor were used to prepare a series of photocatalysts. For this purpose, the solution precursor of palladium (Pd) was transferred to the above slurry. After 10 min sonication, metal ions were reduced using the freshly prepared cold sodium borohydride solution. The reaction mixture was stirred for 1 h and sonicated for about 20 minutes. Subsequently, the reaction mixture was transferred into the Teflon vessel, which was placed in the stainless steel autoclave reactor for hydrothermal reactions and treatments.32 Upon completion of the hydrothermal reaction, the catalyst precipitates were collected via a vacuum filtration assembly. The protocol and synthesis schematic are illustrated in Fig. 1. The as-synthesized catalysts were dried directly in sunlight to evaporate/eliminate the moisture contents. A similar procedure was adapted for the synthesis of other catalysts of the series with various Pd/r-TiO2 (i.e. 0.4 to 1%) metal contents on the r-TiO2 support.
 |
| | Fig. 1 Synthesis scheme for the preparation of Pd/r-TiO2 catalysts. | |
Characterization of catalysts
For the structural, optical and electrical assessment of catalysts, various advanced techniques like XRD, FTIR, Raman, TGA, SEM, EDX, AFM, XPS, PL, UV-Vis/DRS and EIS were used. The detailed descriptions of these analytical tools are given in the ESI.†
Hydrogen generation experiment
To generate hydrogen, the photoreaction was carried out in a MICQ/US-150 mL vessel and UV lamp (100 W, 360 nm) that was used as an irradiation source. About 6.5 mW cm−2 of photon flux, which is comparable to the UV flux in daylight, was used for exposure on reactor walls. 6 mg of the catalyst was added to 30 mL of distilled water in the reactor, along with 5% ethanol as a sacrificial reagent. In order to eliminate the dissolved oxygen contents, nitrogen gas was continuously bubbled through the reaction mixture at a flow rate of 10 mL min−1 for 30 minutes. To evaluate the hydrogen production, 0.5 mL of gas from the headspace of the reactor was taken at various intervals and injected into a gas chromatograph (GC-Shimadzu 2014), which was outfitted with a thermal conductivity detector (TCD). Ar gas was used as the carrier gas in the gas chromatography. The amount of H2 generated via the photoreaction was measured in relation to an internal calibration curve. For each of the as-synthesized catalysts, the photocatalytic experiments were repeated thrice. The H2 gas evolution rate was measured in both mmol g−1 and mmol g−1 h−1 units, allowing for a quantifiable comparison of various activities of the Pd/r-TiO2 catalysts. The quantum efficiencies of hydrogen generation were calculated using the following equation:| |  | (i) |
Results and discussion
XRD analyses
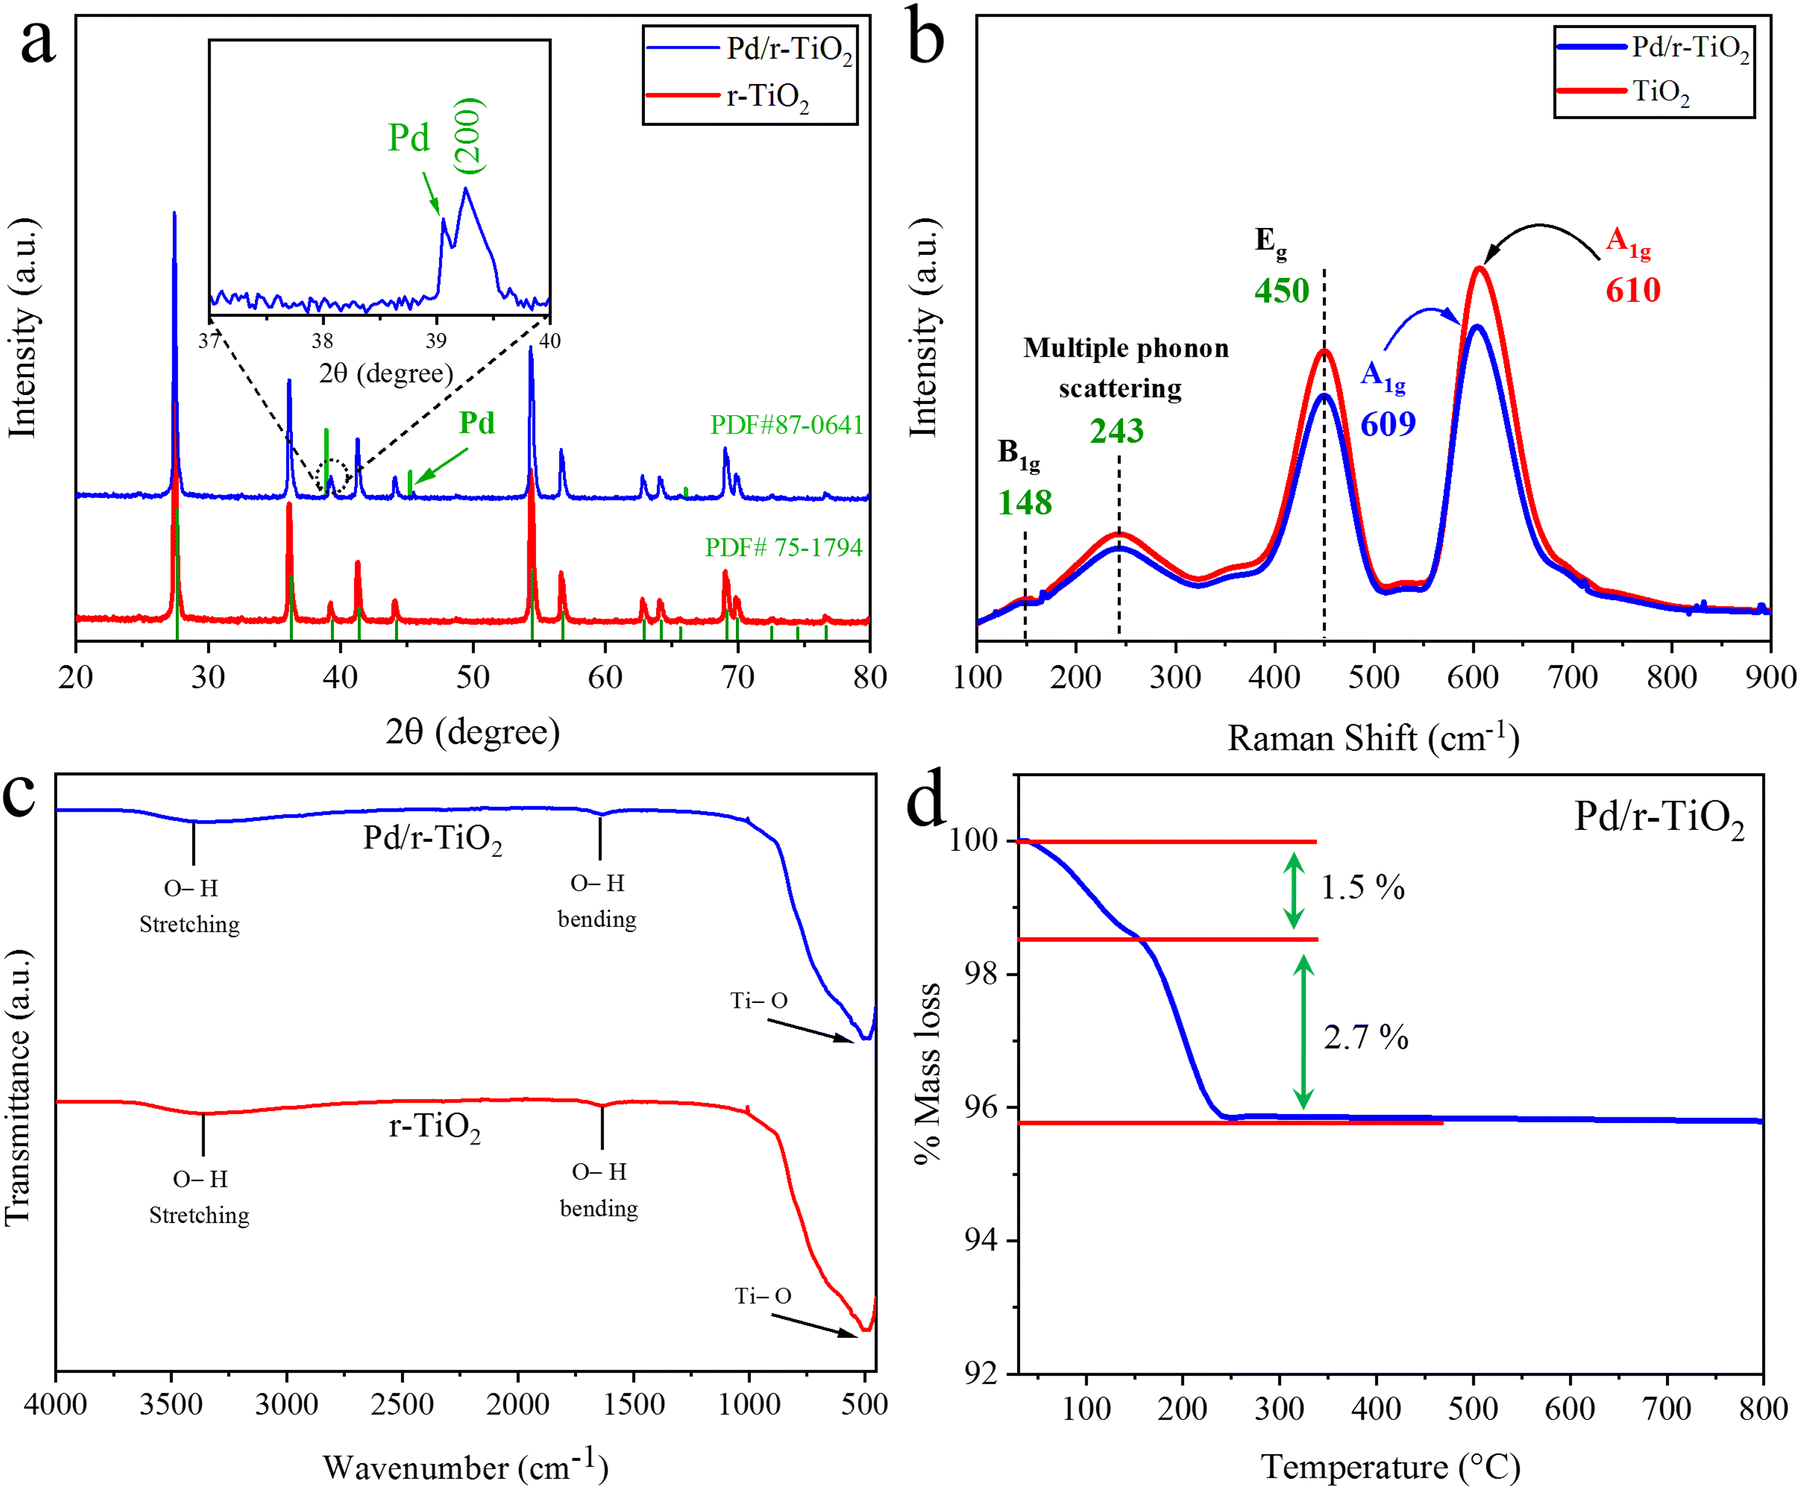
The XRD patterns of r-TiO2 and Pd/r-TiO2 are shown in Fig. 2a. The results indicated that the XRD peaks appeared at the two theta (2θ) values of 27.43°, 36.07°, 41.23°, 44.04°, 54.31°, 56.62°, 62.75°, 64.04°, 69.00° and 69.80°, corresponding to the (110), (101), (111), (210), (211), (220), (002), (310), (301) and (112) crystal planes. These results prove the purity of catalysts, as per our synthesis protocol. The XRD pattern can be justified by comparing it with the JCPDS card (PDF#75-1748). The XRD patterns of Pd/r-TiO2 remained unchanged; however, a small characteristic diffraction peak appeared at 39.18° (200), corresponding to the Pd-cocatalysts present on the r-TiO2 surface. The JCPDS card PDF#87-0641 provides further evidence for this.33
 |
| | Fig. 2 (a) XRD patterns (inset: zoomed view of Pd diffraction), (b) Raman spectrum, (c) FTIR results r-TiO2 and Pd/r-TiO2 and (d) TGA analysis of Pd/r-TiO2. | |
Raman analyses
In the catalysts, namely r-TiO2 and Pd/r-TiO2, intermolecular bonding and rotational and vibrational modes were investigated using Raman spectroscopy.34 These analyses provide valuable information on the chemical structure and composition of the material. Results indicated that TiO2 exhibits distinct vibrational modes at 148 cm−1 (B1g), 243 cm−1, 450 cm−1 (Eg), and 610 cm−1 (A1g), corresponding to the O–Ti–O vibrations in the rutile phase of TiO2, as depicted in Fig. 2b. The 450 cm−1 Eg vibrational mode corresponds to the oxygen bond vibrations in O–Ti–O, whereas the vibrations at 148 cm−1 and 610 cm−1 correspond to the B1g and A1g symmetric and anti-symmetric vibration modes, respectively. A vibration at 243 cm−1 was due to the typical multiple phonon scattering.35 It is worth mentioning that a slight shift was observed in the Raman spectrum of Pd/r-TiO2 catalysts. This minute shift was indicated in the 610 cm−1 to 609 cm−1 range due to the presence of Pd-cocatalysts (low metal contents) on the r-TiO2 surfaces.36
Fourier transform infrared (FTIR) analyses
The FTIR results of r-TiO2 and Pd/r-TiO2 are illustrated in Fig. 2c. The range for identification of functional groups on the catalyst is 4000 cm−1 to 500 cm−1. In the FTIR results of Pd/r-TiO2, no obvious change was observed due to the low metal loading. A strong peak was observed at 503 cm−1 due to the O–Ti bond in the r-TiO2. Two peaks at 1600 cm−1 and 3400 cm−1 were attributed to the bending and stretching vibrations of the –OH group, respectively.37,38 Hydroxyl groups were detected due to the presence of moisture content in the interstices of the ascribed catalysts.
Thermogravimetric analysis (TGA) assessment
Thermogravimetric analysis was conducted to ensure the catalyst stability at higher temperatures.39 TGA calculates the sample mass changes in relation to temperature and time.40 The thermal breakdown of catalyst particles was determined from the information provided by TGA. TGA is not suitable to directly identify the gases released from the sample when it is heated in a controlled furnace. Up to 150 °C thermal temperature, a 1.5% weight loss was attributed to the loss of water contents. Similarly, up to 240 °C, another 2.7% weight loss was due to residual oxides, as shown in Fig. 2d. After this temperature, catalysts remained stable and no further weight loss was observed even at higher temperatures. The TGA results revealed that the as-synthesized catalysts, i.e., Pd/r-TiO2, exhibit enough stability and have the potential for application under extreme conditions.
SEM and EDX analysis
SEM is a widely used technique in which an electron beam scans a sample and provides a magnified image. This technique is highly useful for the morphological studies of solid inorganic materials. Catalyst morphology has a significant influence on the performance of the catalysts for photoreactions.41 The surface morphology of Pd/r-TiO2 catalysts was assessed by SEM analysis, and the results are presented in Fig. 3(a) and (b). The SEM images of r-TiO2 confirm the spherical homogeneous morphology. As indicated in Fig. 3b, at 500 nm resolution, Pd-cocatalysts were clearly observed on the r-TiO2 surfaces. Cocatalysts (i.e., Pd) at the semiconductor support interface showed that the loading of cocatalysts is successfully achieved. According to Fig. 3(a) and (b), r-TiO2 particles have spherical morphology with uniform size and shape. The homogeneous deposition of Pd over the r-TiO2 surface is not discernible as independent entities due to the low concentration of the metal. Furthermore, the purity and elemental composition of the as-prepared catalysts were determined by EDX analysis.42 All essential elements of the catalysts, such as Ti, O and Pd, were detected in the EDX spectrum, as shown in Fig. 3e. The analysis also revealed the presence of other elements, such as carbon from the instrument grid and Au from the gold coating.
 |
| | Fig. 3 SEM results (a) 5 μm and (b) 500 nm. (c) TEM results at 100 nm and (d) 50 nm. (e) EDX of Pd/r-TiO2 catalysts. | |
TEM analysis
TEM results demonstrate the dispersion of Pd nanoparticles over the r-TiO2 catalyst. As illustrated in Fig. 3(c) and (d), these results indicate a low concentration of Pd particles dispersed on r-TiO2 surfaces. The presence of low metal contents is attributed to the low metal loading. Thus, it can be seen that Pd nanoparticles are stable and cannot be converted into oxides.41
Atomic force microscopy (AFM)
In the current study, atomic force microscopy (AFM) is used to investigate the surface topography, precise sizes and texture morphology of catalysts.43 The analysis was carried out on an atomic scale, and images of the catalysts are displayed in Fig. 4. The AFM images revealed a uniform distribution of Pd/r-TiO2 catalyst particles, as presented in the 2D and 3D images in Fig. 4(a), (b) and (d), (e), respectively. The scanning area for the measurement of thickness was 2 × 2 μm, and the catalyst height was 44.8 nm. The average particle size of the catalyst was noted to be 44.5 nm, as shown in Fig. 4c.
 |
| | Fig. 4 (a) and (b) 2D AFM images, (c) average height and (d) and (e) 3D AFM images of Pd/r-TiO2 catalysts. | |
UV-Vis/DRS and photoluminescence (PL)
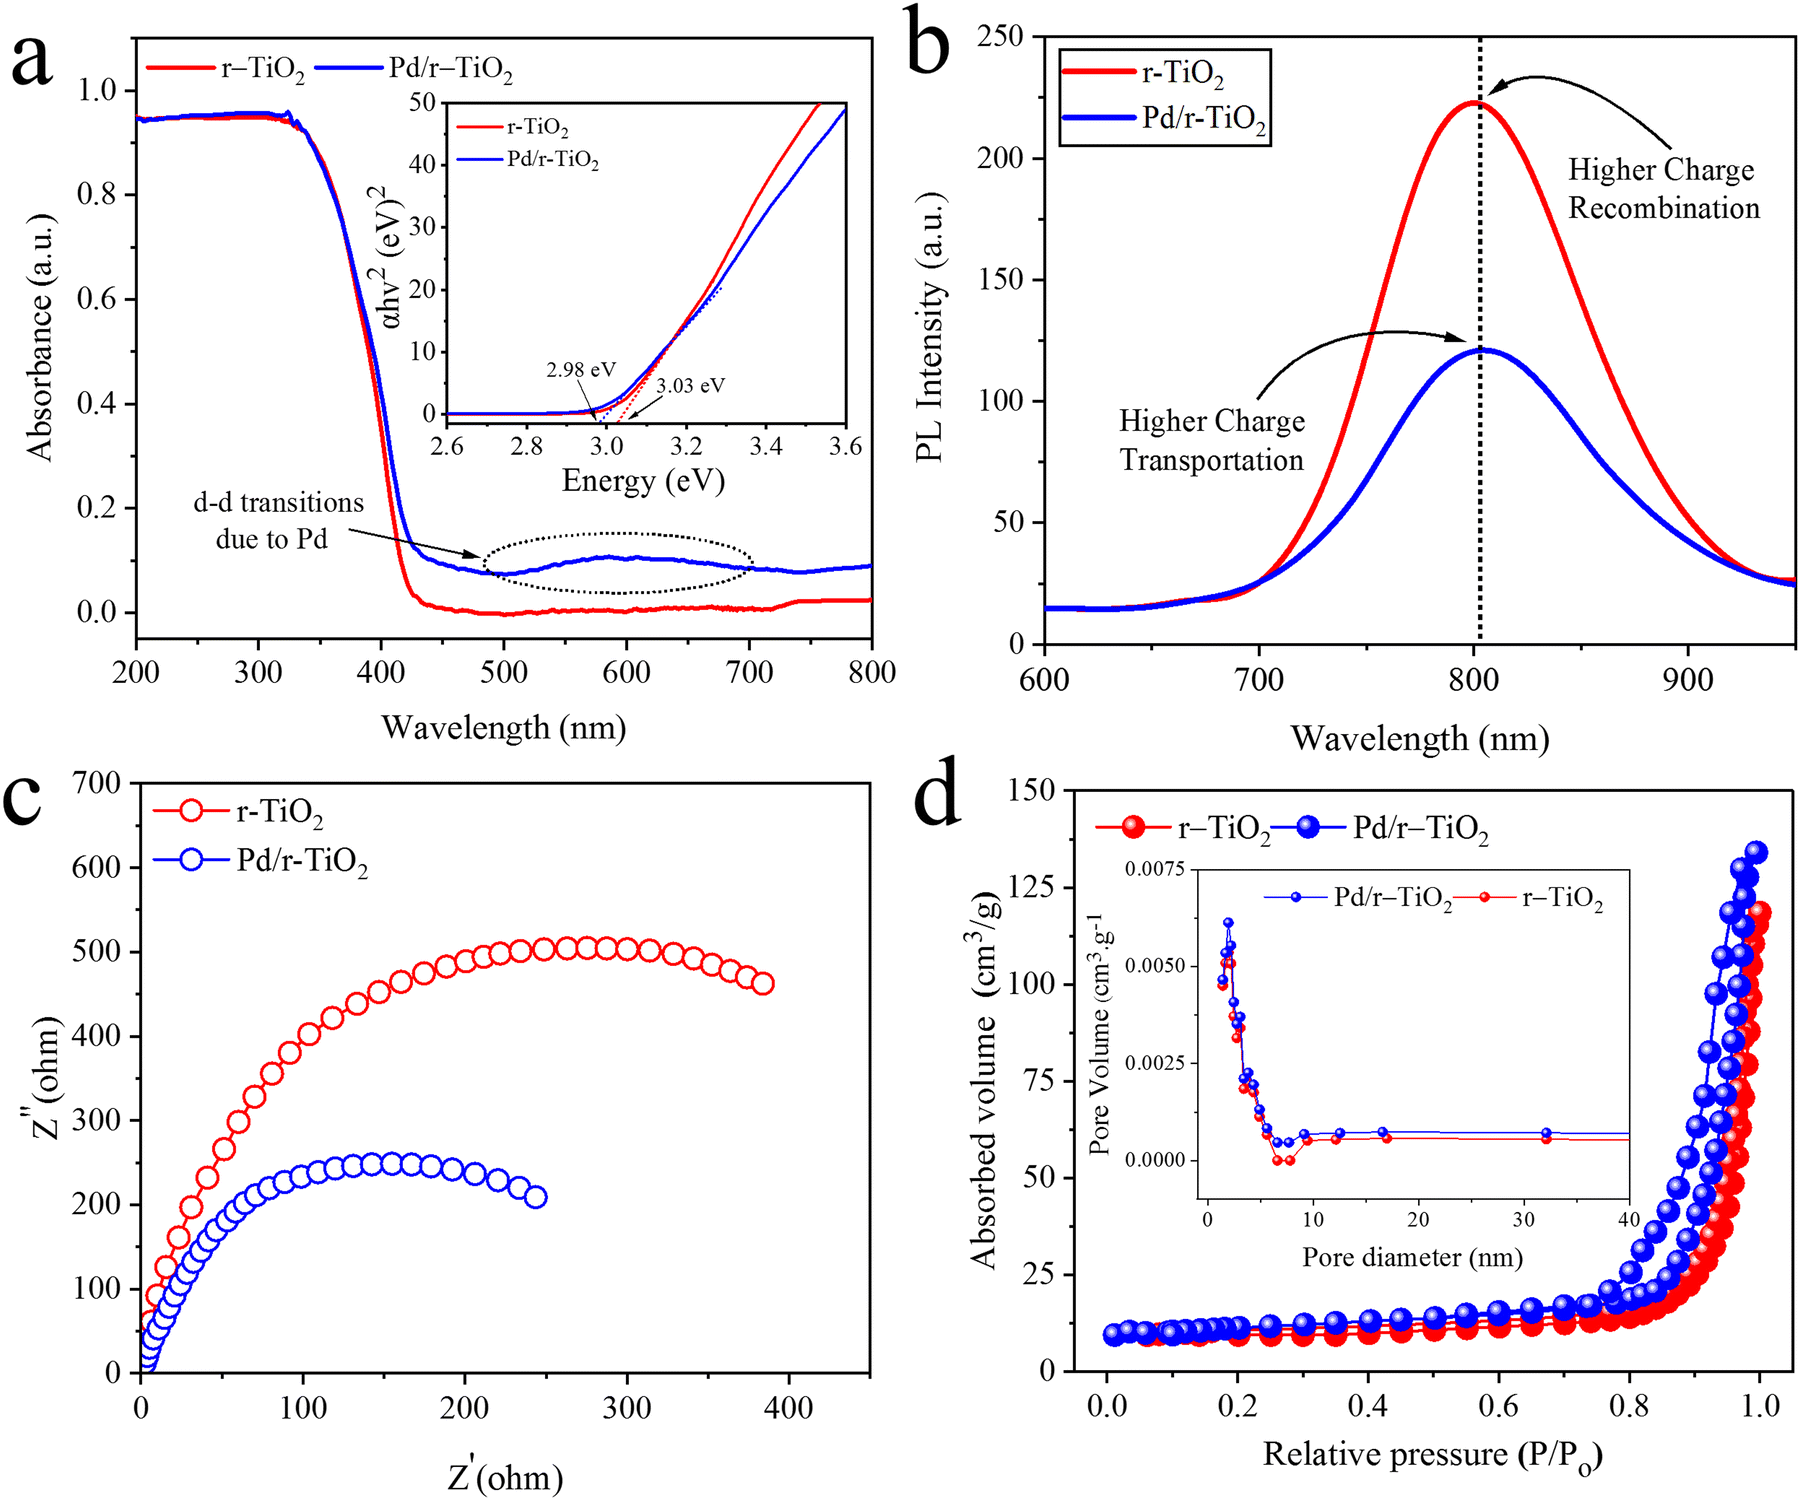
UV-Vis/DRS is a useful technique for examining the optical characteristics of catalysts. In Fig. 5a, the UV-Vis/DRS results of r-TiO2 and Pd/r-TiO2 are illustrated. Due to its large band gap (i.e., 3.03 eV), r-TiO2 exhibits absorption in the ultraviolet region.44 It has been found that Pd metal loaded over the r-TiO2 surfaces enhances the absorption and affects the band edge. Thus, Pd/r-TiO2 catalysts exhibit extended absorption (redshift) and exhibit promising absorption in the visible region. Moreover, Pd-cocatalysts exhibit absorption at 545 nm due to the d–d transitions of electrons. The band gap energy diagrams of r-TiO2 and Pd/r-TiO2 are illustrated in the inset of Fig. 5a. Pristine r-TiO2 exhibits a band gap of 3.03 eV, whereas Pd/r-TiO2 exhibits a reduced band gap, i.e., 2.98 eV.
 |
| | Fig. 5 (a) UV-Vis/DRS results, inset: band gap energy diagrams, (b) PL results, (c) EIS analysis, and (d) BET analysis, inset: pore volume/size distribution of r-TiO2 and Pd/r-TiO2. | |
Photoluminescence reveals insights into the excitations, charge transfer and recombination during the photoreaction.45Fig. 5b illustrates the PL emission because of de-excitation in the r-TiO2 and Pd/r-TiO2. The results reveal that a back reaction or charge recombination is high in the case of pristine r-TiO2 due to its overpotential. However, in the case of Pd/r-TiO2 catalysts, charge recombination is suppressed due to the transfer of electrons to the active sites. Thus, as per synthesis, Pd-cocatalysts enhance the charge transportation and contribute to higher hydrogen generation activities during the photoreactions. Hence, the low intensity of Pd/r-TiO2 is due to a relatively higher charge transfer. These results support the XRD, Raman and UV-Vis/DRS results.
Electron impedance spectroscopy (EIS)
To assess the charge transfer and charge resistance dynamics, the EIS analysis of pristine r-TiO2 and Pd/r-TiO2 was conducted and discussed. In accordance with the PL analysis, the Pd/r-TiO2 sample has a smaller diameter than r-TiO2, suggesting a minimal charge transfer resistance and reasonably quick charge transfer kinetics. Fig. 5c displays the EIS results. It is worth mentioning that the presence of Pd-cocatalysts on the r-TiO2 surfaces accelerates the charge transfer to active sites. Moreover, a higher work function of Pd-cocatalysts suppresses the charge recombination by developing Schottky junctions. These Schottky junctions promote the catalytic performances by rectifying the charges.46
BET
The surface area and pore sizes of r-TiO2 and Pd/r-TiO2 catalysts were examined by the nitrogen gas adsorption and desorption studies. For both catalysts, the H1-type hysteresis loop and type-IV isotherm were observed (Fig. 5d). These results indicate the mesoporous nature of the catalysts. On the other hand, using the standard multi-point BET method, the surface area of r-TiO2 and Pd/r-TiO2 was determined to be 15.12 m2 g−1 and 18.26 m2 g−1, respectively. The inset diagram of Fig. 5d confirmed the narrow pore-size distribution centred at 4.29 nm for both catalysts.
X-ray photon spectroscopy (XPS)
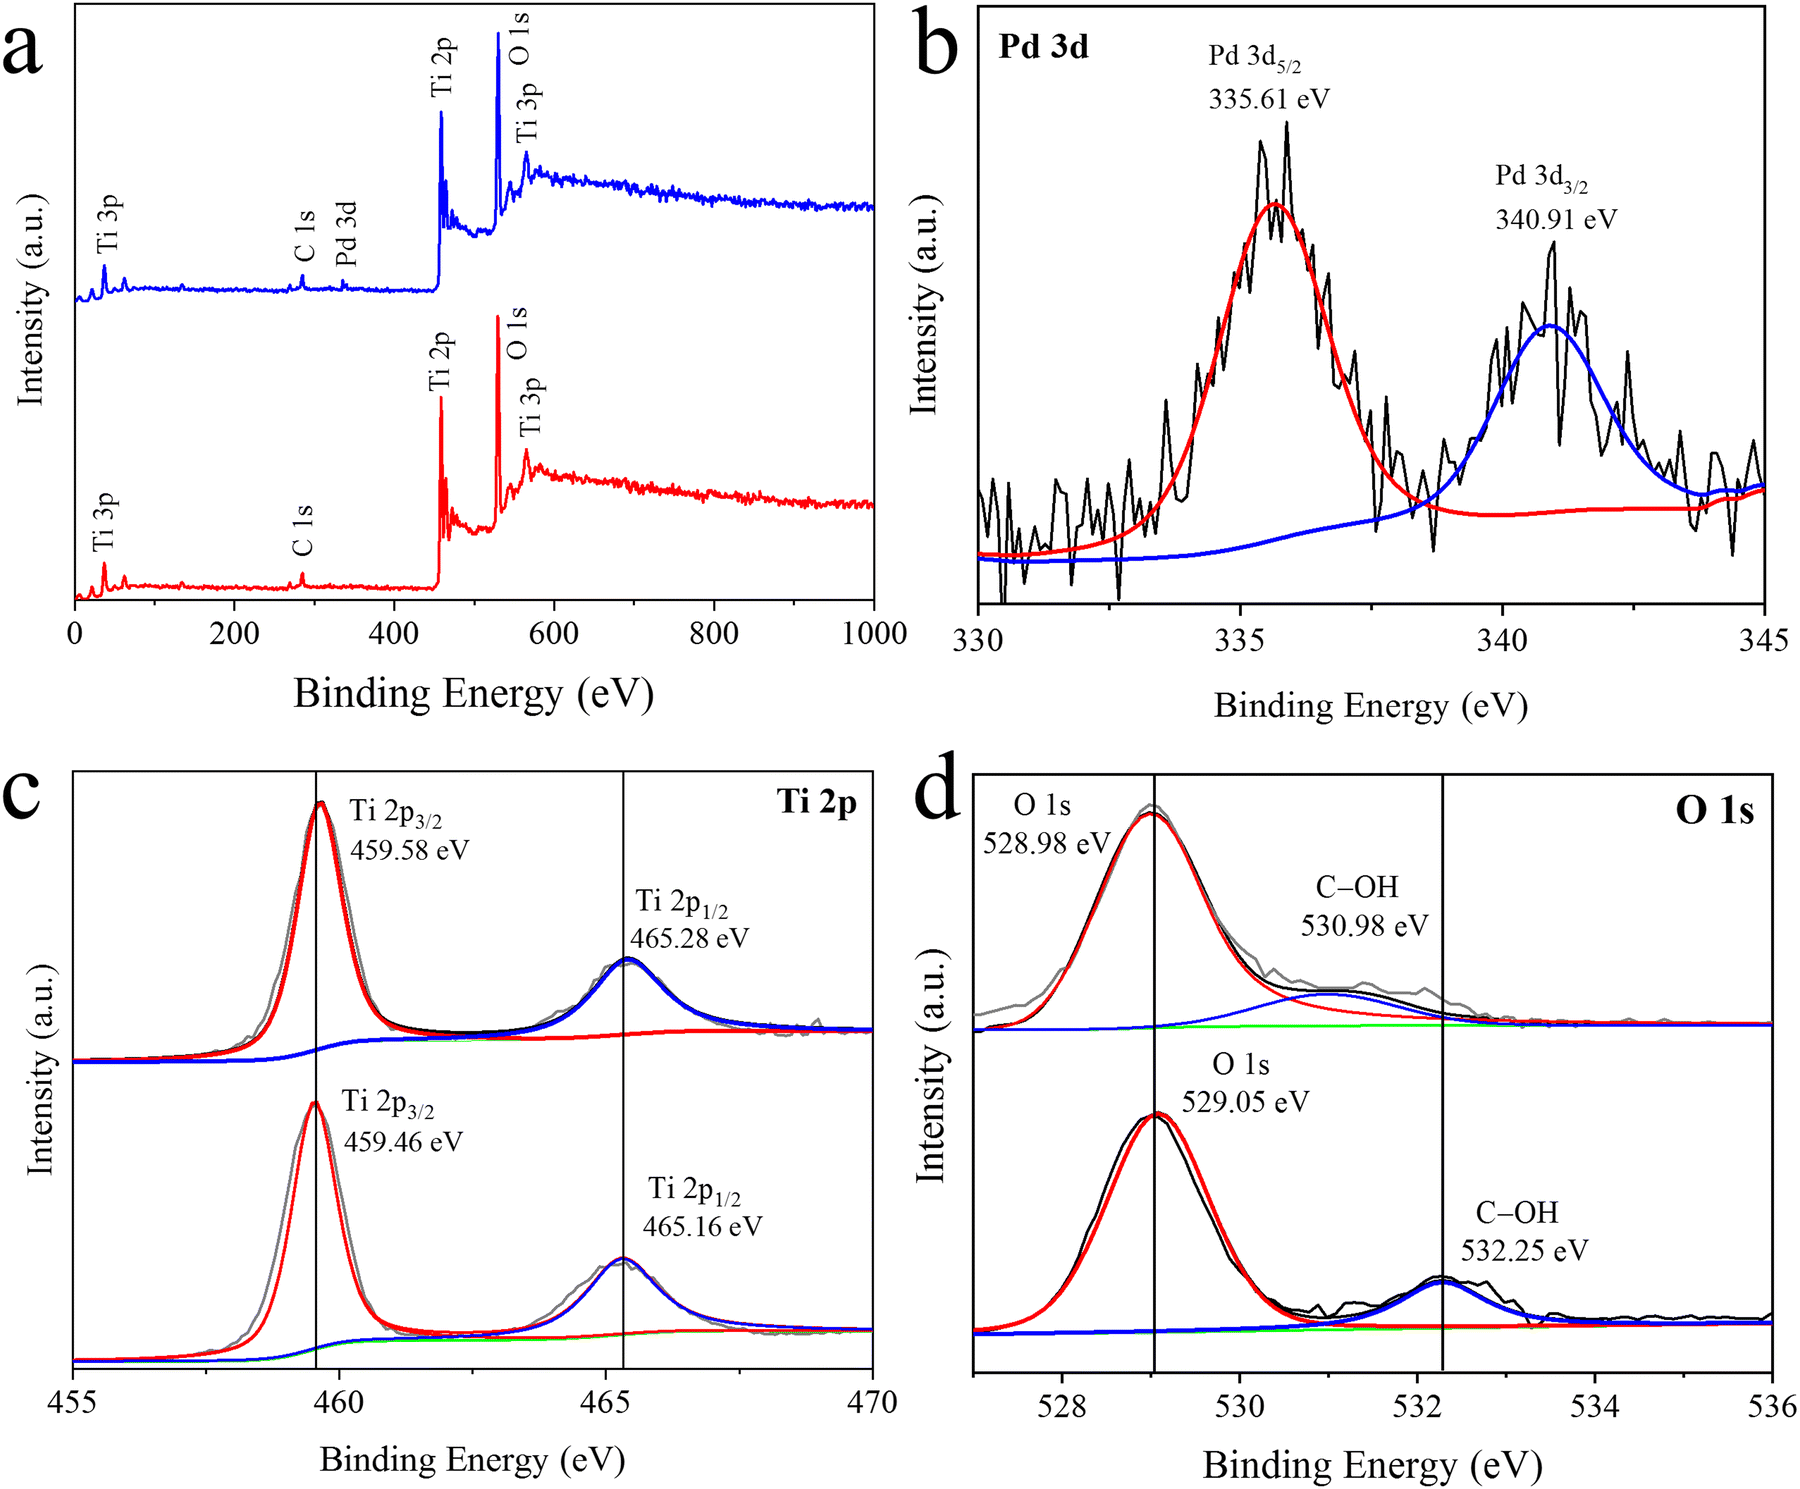
To assess the oxidation states of the constituents and composition of r-TiO2 and Pd/r-TiO2 catalysts, the XPS technique was employed.47 The XPS results are shown in Fig. 6. The survey scan (see Fig. 6a) exhibited all essential elements (i.e., Pd, Ti and O), which are the main constituents of the catalyst. However, carbon was detected as an adventitious element commonly from instrumental grids. XPS results also support the EDX results. Fig. 6b presents the XPS results of Pd metal, with two major peaks appearing at the binding energies of 335.61 eV and 340.91 eV, corresponding to Pd 3d5/2 and Pd 3d3/2, respectively.48 The Ti 2p XPS results were compared for pristine r-TiO2 and Pd/r-TiO2. In the case of pristine r-TiO2, two Ti peaks appeared at the binding energies of 459.46 eV and 465.16 eV, corresponding to Ti 2p3/2 and Ti 2p1/2, respectively.49 However, after loading Pd over r-TiO2, a small shift towards higher binding energies was observed, as shown in Fig. 6c. This shift is attributed to the electron transfer between Pd and r-TiO2. Similarly, two peaks for oxygen appeared at 529.05 eV and 532.25, corresponding to the O2− and –OH of r-TiO2 structures. However, after the incorporation of Pd, the peaks shifted towards lower binding energies, as shown in Fig. 6d.50 The binding energies and peak positions of O 1s and Ti 2p slightly changed after Pd deposition. Furthermore, the XPS results of pristine r-TiO2 or Pd/r-TiO2 revealed the purity and crystalline morphology that is important for the photoreactions.
 |
| | Fig. 6 (a) Survey scans XPS of Pd/r-TiO2 catalysts. XPS of (b) Pd, (c) Ti and (d) oxygen (O). | |
Hydrogen generation activities
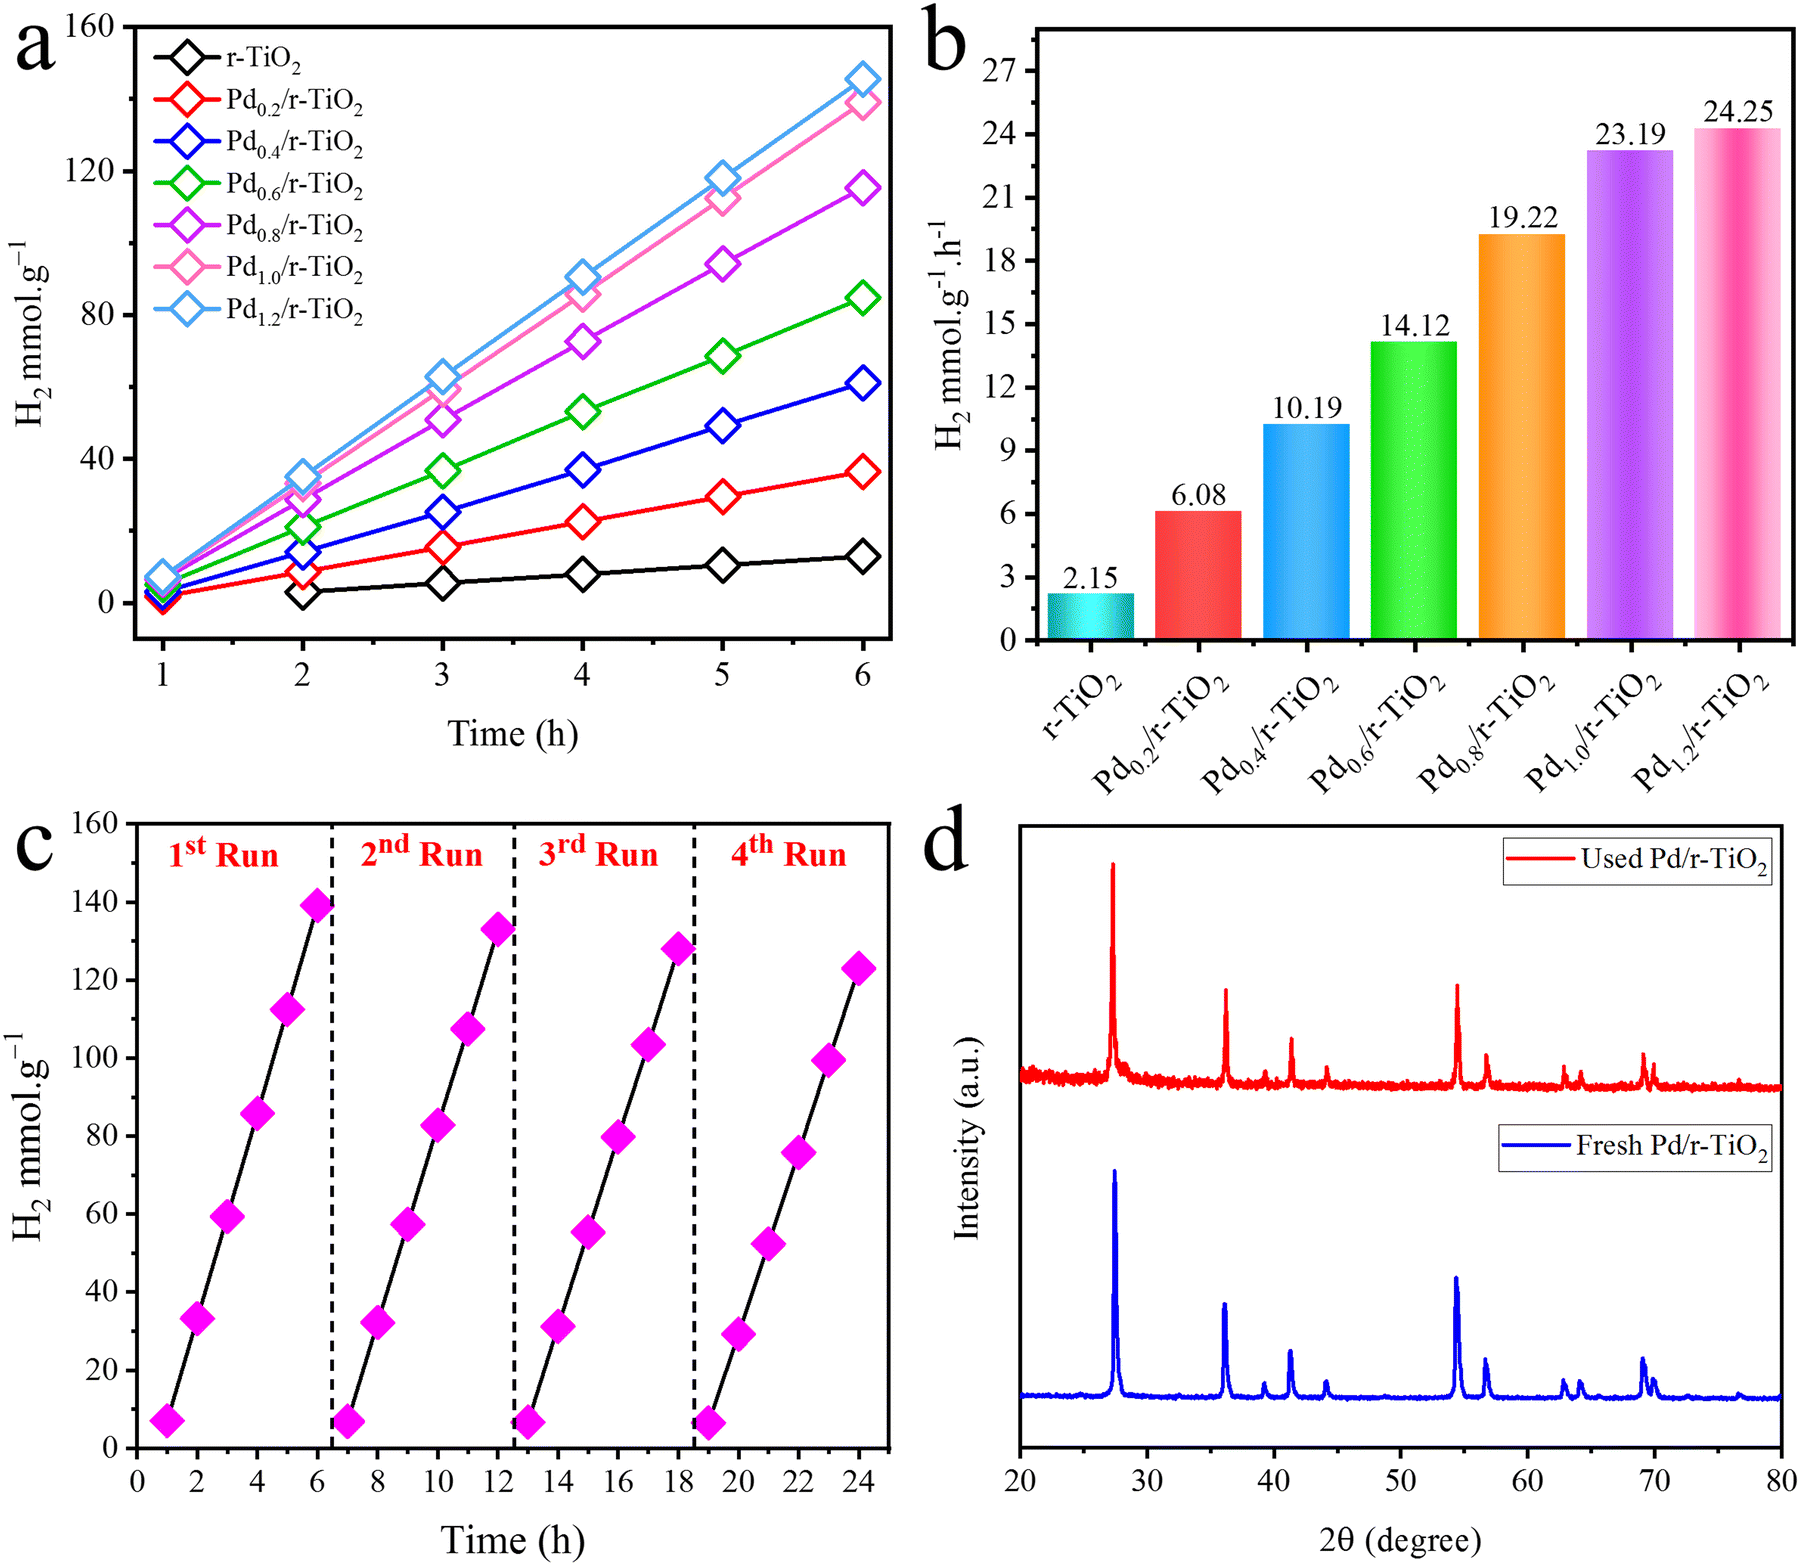
The photoreactions were carried out in a quartz reactor, and the comparative performances of catalysts are illustrated in Table 1 and Fig. 7. Results revealed that pristine r-TiO2 delivers 2.15 mmol g−1 h−1 of hydrogen. This activity is lower than the catalysts having Pd-cocatalysts on r-TiO2. The significant reason for the lower activity is the overpotential of r-TiO2 and relatively higher charge recombination. However, catalysts having Pd-cocatalysts over the r-TiO2 surfaces deliver more hydrogen under similar conditions. Thus, the existence of Pd-cocatalysts on the surfaces of the r-TiO2 semiconductor creates a Schottky junction at the point of contact between the semiconductor and cocatalysts.51 The Schottky junctions act as a barrier and stop the back flow of electrons.52 Moreover, the high metallic character of Pd-cocatalysts makes the semiconductor more conducive to the promotion of electrons to the active centres.53 For the sake of convenience, a series of catalysts were prepared to optimize the Pd loading onto the r-TiO2 surfaces. Pd with different ratios, i.e., 0.2, 0.4, 0.6, 0.8 and 1.0 wt%, was deposited on r-TiO2 and evaluated for catalytic performances. The catalytic performances indicated that Pd0.2/r-TiO2, Pd0.4/r-TiO2, Pd0.6/r-TiO2, Pd0.8/r-TiO2 and Pd1.0/r-TiO2 deliver 6.08, 10.19, 14.12, 19.22 and 23.19 mmol g−1 h−1 of hydrogen, respectively. It can be clearly seen that the Pd1.0/r-TiO2 catalyst is the most active catalyst of the series that delivers relatively higher hydrogen (i.e., 23.19 mmol g−1 h−1) than the other catalysts in this study. Overall, 1.0 wt% loading over the r-TiO2 surfaces was found to be the optimum; however, increasing the Pd content beyond the optimized ratio was not very effective for hydrogen generation.54 This is because the higher metal contents enhance the shadowing effect that blocks the exposure/penetration of photons onto the semiconductor system.55 Fig. S2 (ESI†) compares the hydrogen generation activities of a Pd/r-TiO2 catalyst with ethanol and methanol as sacrificial reagents. The results show the relative effectiveness of ethanol and methanol as sacrificial reagents in this catalytic hydrogen production system. It is worth mentioning that using methanol gives slightly higher activities than ethanol.56 A comparison of the H2 generation activities of different reported photocatalysts is shown in Table 2.
Table 1 Comparison of H2 evolution and optimization Pd wt% on r-TiO2 surfaces
| Sr. no. |
Catalysts |
Pd/r-TiO2 ratio (wt%) |
Water/ethanol ratio |
Photon flux (mW cm−2) |
Volumea M/H |
H2 evolution |
QE (%) |
| mmol g−1 |
mmol g−1 h−1 |
|
Represents the ratio of mixture to headspace volume of the reactor.
|
| 1 |
Pristine r-TiO2 |
0.0![[thin space (1/6-em)]](https://www.rsc.org/images/entities/char_2009.gif) :100 :100 |
95:5 |
6.5 |
30:120 |
12.92 |
2.15 |
0.633 |
| 2 |
Pd0.2/r-TiO2 |
0.2:99.80 |
95:5 |
6.5 |
30:120 |
36.53 |
6.08 |
1.790 |
| 3 |
Pd0.4/r-TiO2 |
0.4:99.60 |
95:5 |
6.5 |
30:120 |
61.58 |
10.19 |
3.001 |
| 4 |
Pd0.6/r-TiO2 |
0.6:99.40 |
95:5 |
6.5 |
30:120 |
84.74 |
14.12 |
4.159 |
| 5 |
Pd0.8/r-TiO2 |
0.8:99.20 |
95:5 |
6.5 |
30:120 |
115.33 |
19.22 |
5.662 |
| 6 |
Pd1.0/r-TiO2 |
1.0:99.00 |
95:5 |
6.5 |
30:120 |
139.14 |
23.19 |
6.831 |
| 7 |
Pd1.2/r-TiO2 |
1.2:98.80 |
95:5 |
6.5 |
30:120 |
145.55 |
24.25 |
7.140 |
 |
| | Fig. 7 (a) and (b) H2 generation activities of catalysts, (c) recyclability test and (d) XRD analysis of used catalysts. | |
Table 2 Comparison of H2 generation activities of catalysts reported in the literature
| Catalyst |
Light source |
Catalyst amount (mg) |
Sacrificial reagent |
H2 production (mmol g−1 h−1) |
Ref. |
| Pd/r-TiO2 |
Hg Lamp |
7.5 |
5% Ethanol |
23.15 |
Present study |
| Au–BaO@TiO2/CdS |
Xe Lamp |
10 |
5% Ethanol |
13.54 |
47
|
| TiO2/CdS |
UV-LED |
50 |
Na2SO3 |
0.051 |
57
|
| F-TiO2/CdS |
Visible light |
5 |
EDTA |
8.342 |
58
|
| TiO2@BaTiO3/CdS |
Visible light |
20 |
NaH2PO2 |
0.03 |
59
|
| T-CZS |
NIR solar light |
10 |
0.25 M Na2S/0.35 M Na2SO3 |
0.497 |
60
|
| ZnS–CdS |
300 W Xe lamp |
100 |
0.1 M Na2SO3/Na2S |
5.5 |
61
|
| Ce–ZnCdS |
Microwave irradiation |
50 |
0.1 Mol Na2S·9H2O and Na2SO3 |
2.03 |
62
|
| Ti3C2Tx/TiO2 (P25) |
200 W Hg (285–325 nm) |
30 |
25% Methanol |
79.5 |
63
|
| TiO2/C composite |
300 W Xe arc (>420 nm) |
50 |
10 vol% (TEOA) |
0.863 |
64
|
| MXene–TiO2 |
300 W xenon |
50 |
10 vol% (TEOA) |
390.92 |
65
|
Mechanism and catalytic reactions
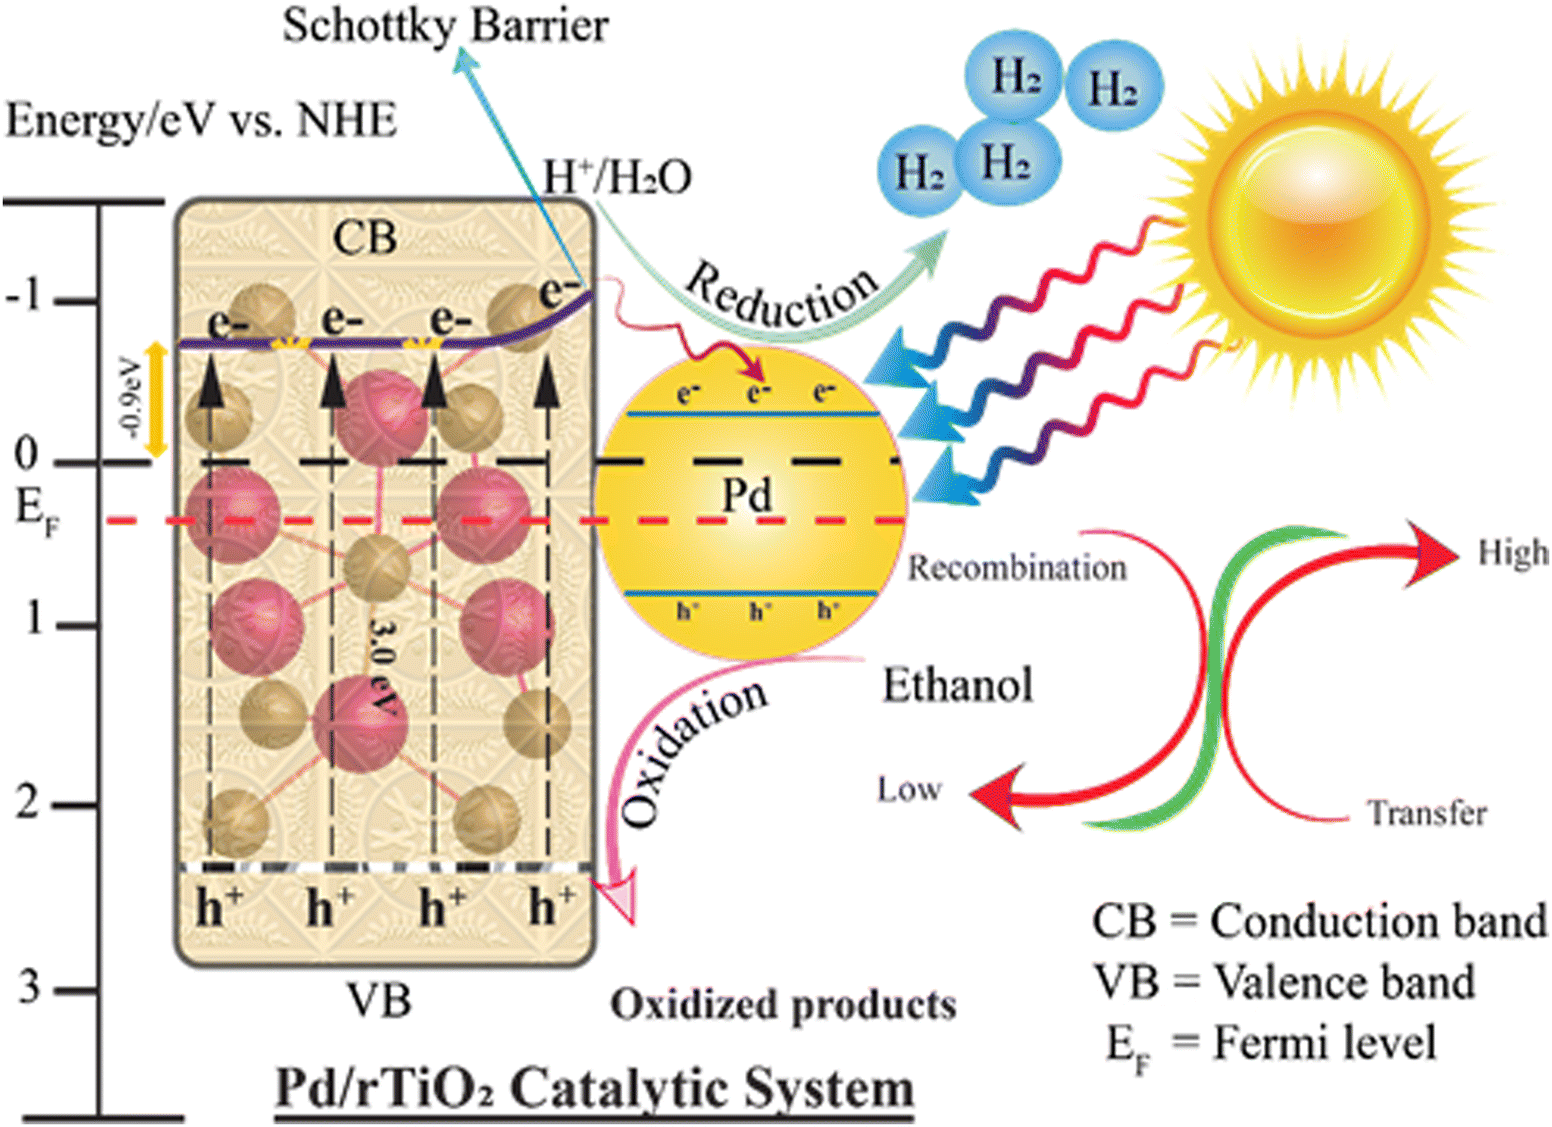
Understanding the photocatalytic water-splitting reaction mechanism is crucial and important for researchers. Fig. 9 illustrates the mechanism of hydrogen evolution on the catalysts reported herein. The water-splitting reaction occurs in three steps: (i) photon absorption by the catalyst particles for the excitation of electrons, (ii) separation of charges and transfer of these charges to the active sites, and (iii) utilization of charges (electrons/holes) on the redox sites.66 It is worth mentioning that the bandgap and redox potentials of the catalysts are responsible for the photoreaction.67 For example, to split water molecules, the oxidation potential of the catalyst must be greater than 1.23 eV, whereas the reduction potential must be lower than the redox potential of hydrogen (0.0 eV).68 The major drawback associated with r-TiO2 is its low charge transfer ability due to overpotential. Hence, it cannot control the backflow of electrons to recombine with holes. However, this drawback can be successfully eliminated by the use of cocatalysts with relatively higher work functions (i.e., Pd in this work). Although r-TiO2 has a 3.03 eV band gap, its band gap can be successfully decreased by using Pd-cocatalysts.69 The Mott Schottky analysis of Pd/r-TiO2 revealed the CB level at −0.12 eV (Fig. S1, ESI†). The VB level was calculated using eqn (ii)70 and was found to be 2.91 eV.
Similarly, the light source must be of greater energy than the energy required for the excitation of electrons.71 When photons fall on the catalyst surface, charge carriers (e−/h+) are generated and electrons absorb the energy and are transferred to the conduction band of the semiconductor.72 It is worth noting that the work function of r-TiO2 is 4.2 eV, which is lower than that of Pd metal (5.5 eV). Hence, the electrons can easily transfer to the Pd-cocatalysts where they are consumed/utilized for the reduction reaction.73 The other significant advantage is that the Pd-cocatalysts generate Schottky junctions at the metal/semiconductor interfaces that readily restrict the backflow of electrons.52 Similarly, due to these Schottky junctions, the flow of electrons to the active sites is easier and rationalized during the photoreaction. On the active sites, the excited electrons are progressively consumed by the aqueous H+ ions to produce H2 on the reduction centres. Meanwhile, the sacrificial reagents consume the holes on the semiconductor surfaces.47,74 Ethanol is oxidized by scavenging the holes and is readily converted into oxidized products (H2O & CO2).75,76 The higher hydrogen generation rates were attributed to the development of the Schottky junctions that suppress charge recombination by rectifying the flow of electrons on the active sites. Excellent metallic characteristics and relatively higher work function of Pd make the steady flow of electrons to be utilized for hydrogen generation.77
The scheme that represents the photoreaction for hydrogen evolution reactions is as follows:
| | | Pd/r–TiO2 + hv → (VB) + (CB)e− | (iii) |
| | | Pd/r–TiO2 + H2O → H+ + OH− ΔG° = 237.2 kJ mol−1 | (iv) |
| | | (CB)2e− + 2H+ → H2 ECB = 0.0 eV | (v) |
| | | (VB)h+ + OH− → (OH˙) EVB = 1.23 eV | (vi) |
CB and VB represent the conduction and valence bands, respectively.
Recyclability test
The catalyst stability during photoreaction is an important factor that affects the activity of the catalyst for hydrogen generation.78 In this work, a recyclability test was conducted to check the stability or reusability of the catalyst. For this purpose, the most active catalyst of the series (Pd/r-TiO2) was chosen for the recyclability test, and four consecutive runs were performed. It was found that the Pd/r-TiO2 catalysts exhibit no significant loss in the activity of the catalyst for H2 generation. Results obtained from the recyclability test revealed that our as-synthesized catalysts are highly stable for the photoreaction, as shown in Fig. 7c. To examine the structural changes in the catalysts after photoreaction, XRD and SEM equipped with elemental maps for Pd/r-TiO2 catalysts were performed. In the XRD results (see Fig. 7d), no major change was observed, implying that catalysts remain stable after the photoreaction. Fig. 8 illustrates the SEM results with EDX maps of the used Pd/r-TiO2 catalyst. Fig. 8(a) and (b) reveals the catalyst morphology, showing a rough, textured surface with potential porosity, indicative of a high surface area, and bright, dispersed particles of Pd on the r-TiO2 support. The EDX maps in Fig. 8(c)–(e) confirm the distribution of Ti, O, and Pd.79 Pd is distributed evenly on the catalysts even after being used four times. Based on these results, Pd is highly dispersed on the r-TiO2 support, maximizing the active sites for hydrogen production reactions.
 |
| | Fig. 8 SEM results of the used Pd/r-TiO2 catalysts, (a) 10 μm, (b) 1 μm, elementals maps (c) Ti-K (d) O-K and (e) Pd-K. | |
 |
| | Fig. 9 Mechanism of the water splitting reaction for H2 generation. | |
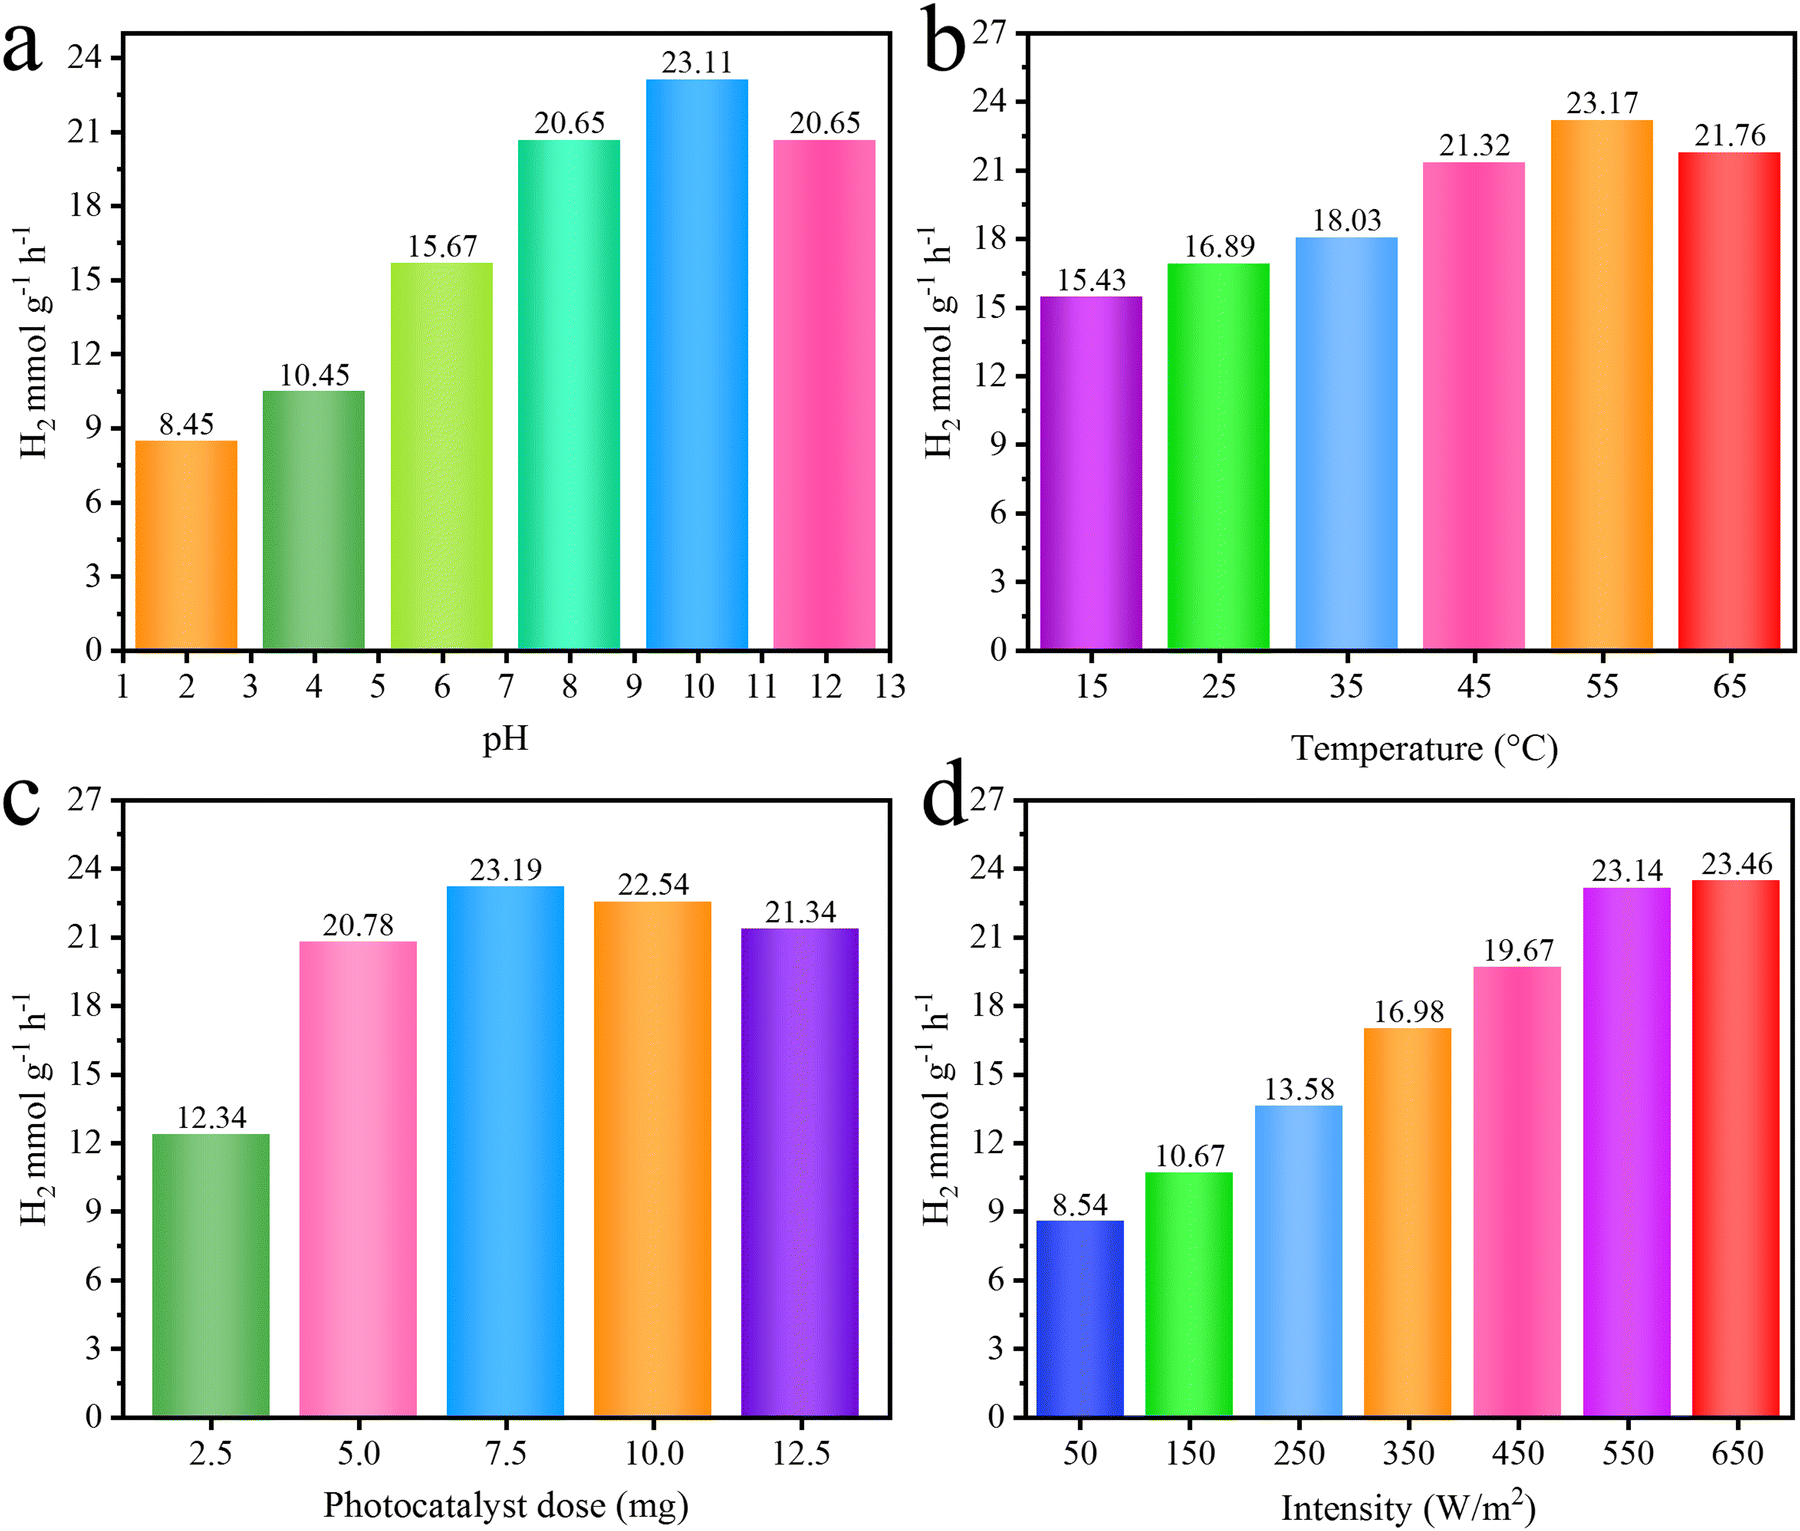
Factors affecting the H2 generation activities
To evaluate the efficiency of the photoreaction (catalytic activities), various factors have been investigated to predict the ideal conditions for hydrogen generation on the most active catalysts, i.e., Pd1.0/r-TiO2. The results obtained for various factors, i.e., pH, temperature, dose of catalysts and intensity of light, are exhibited in Fig. 10a–d, whereas the details and description of these factors are given in the ESI.†
 |
| | Fig. 10 Effect of (a) pH, (b) temperature, (c) catalyst dose and (d) light intensity on the activity of catalysts. | |
Conclusion
In this study, various catalysts, namely Pd/r-TiO2 (where Pd = 0.2–1.2%), were prepared and evaluated for hydrogen generation reactions/activities. The deposition of Pd-cocatalysts on the r-TiO2 surfaces was achieved by chemical reduction and hydrothermal treatments. The morphology, optical characteristics and compositions were examined via XRD, FTIR, Raman, UV-Vis/DRS, PL, SEM, TEM, AFM, EDX and XPS analytical approaches. Photoreactions were conducted using the quartz photoreactor MICQ/US-150 mL and a UV lamp (100 W, 360 nm) for the UV source, whereas hydrogen activities were monitored using GC-TCD (Shimadzu/Japan). The results revealed the superior performances of catalysts with Pd-cocatalysts on r-TiO2 surfaces. To get more insights, various factors, such as the pH, temperature, catalyst dose, and light intensity, were optimized and discussed. It was observed that Pd/r-TiO2 catalysts deliver 23.19 mmol g−1 h−1 hydrogen under the optimized conditions, 10 times higher than that of the pristine r-TiO2. The higher hydrogen generation activities were accredited to the presence of Pd-cocatalysts that restrict charge recombination by developing Schottky junctions. It is worth mentioning that the higher work function of Pd relative to the pristine r-TiO2 facilitates more electron transfer to the active sites. Thus, higher charge transfer results in more hydrogen evolution efficiencies. Based on the results and catalytic performances, it has been concluded that the ascribed approach holds promise to replace the costly and conventional approaches used for hydrogen production.
Data availability
The data and necessary protocols for this study are included in the ESI.†
Conflicts of interest
There are no conflicts of interest to declare.
Acknowledgements
This study was financially supported by the Higher Education Commission of Pakistan award No. 377/IPFP-II/Batch-I/SRGP/NAHE/HEC/2020/27 and ASIP/R&D HEC/2023/5/22696/124 grants. Experimental work was conducted at the Inorganic Material Laboratory (52s), Institute of Chemistry, The Islamia University of Bahawalpur.
References
- R. M. Navarro, M. Pena and J. Fierro, Chem. Rev., 2007, 107, 3952–3991 CrossRef CAS.
- N. Armaroli and V. Balzani, Chem. – Eur. J., 2016, 22, 32–57 CrossRef CAS.
- E. Hussain, I. Majeed, M. A. Nadeem, A. Badshah, Y. Chen, M. A. Nadeem and R. Jin, J. Phys. Chem. C, 2016, 120, 17205–17213 CAS.
- P. Hota, A. Das and D. K. Maiti, Int. J. Hydrogen Energy, 2023, 48, 523–541 CAS.
- J. Nowotny and T. N. Veziroglu, Int. J. Hydrogen Energy, 2011, 36, 13218–13224 CAS.
- L. Preethi, T. Mathews, M. Nand, S. Jha, C. S. Gopinath and S. Dash, Appl. Catal., B, 2017, 218, 9–19 CAS.
- M. Padmini, T. Balaganapathi and P. Thilakan, Mater. Res. Bull., 2021, 144, 111480 CAS.
- R. Ranjithkumar, P. Lakshmanan, P. Devendran, N. Nallamuthu, S. Sudhahar and M. K. Kumar, Mater. Sci. Semicond. Process., 2021, 121, 105328 CAS.
- E. Kozlova, A. Rempel’, A. Valeeva, T. Gorbunova, N. Kozhevnikova, S. Cherepanova, E. Y. Gerasimov, A. Saraev, E. Y. Korovin and V. Parmon, Kinet. Catal., 2015, 56, 515–522 CAS.
- L. Biswal, R. Mohanty, S. Nayak and K. Parida, J. Environ. Chem. Eng., 2022, 10, 107211 CrossRef CAS.
- H. Yu, P. Xiao, J. Tian, F. Wang and J. Yu, ACS Appl. Mater. Interfaces, 2016, 8, 29470–29477 CAS.
- M. E. Aguirre, R. Zhou, A. J. Eugene, M. I. Guzman and M. A. Grela, Appl. Catal., B, 2017, 217, 485–493 CAS.
- M. Z. Abid, K. Rafiq, A. Rauf and E. Hussain, Nanoscale Adv., 2024, 6, 5861–5873 CAS.
- R. Lu, X. Xu, J. Chang, Y. Zhu, S. Xu and F. Zhang, Appl. Catal., B, 2012, 111, 389–396 Search PubMed.
- H. Huang, Y.-X. Li, G.-J. Jiang, H.-L. Wang and W.-F. Jiang, Inorg. Chem., 2021, 60, 17325–17338 CAS.
- M. Jalil, K. Rafiq, M. Z. Abid, A. Rauf, S. Wang, S. Iqbal and E. Hussain, Nanoscale Adv., 2023, 5, 3233–3246 RSC.
- F. Saleem, M. Z. Abid, K. Rafiq, A. Rauf, K. Ahmad, S. Iqbal, R. Jin and E. Hussain, Int. J. Hydrogen Energy, 2023, 52, 305–319 CrossRef.
- M. Jalil, K. Rafiq, M. Z. Abid, M. Rafay, A. Rauf, R. Jin and E. Hussain, Catal. Sci. Technol., 2024, 14, 850–862 CAS.
- A. Nasir, S. Khalid, T. Yasin and A. Mazare, Energies, 2022, 15, 6248 CAS.
- T. Haq, M. Pasha, Y. Tong, S. A. Mansour and Y. Haik, Appl. Catal., B, 2022, 301, 120836 CAS.
- W. Li, X.-s Chu, F. Wang, Y.-y Dang, X.-y Liu, T.-h Ma, J.-y Li and C.-y Wang, Appl. Catal., B, 2022, 304, 121000 CAS.
- J. Huo, P. Duan, H. N. Pham, Y. J. Chan, A. K. Datye, K. Schmidt-Rohr and B. H. Shanks, Catal. Sci. Technol., 2018, 8, 3548–3561 CAS.
-
Ş. Sungur, Handbook of nanomaterials and nanocomposites for energy and environmental applications, 2021, pp. 713–730 Search PubMed.
- Q. Mao, D. Zeng, K. Xu and C. Xie, RSC Adv., 2014, 4, 58101–58107 CAS.
- L. E. Oi, M.-Y. Choo, H. V. Lee, H. C. Ong, S. B. Abd Hamid and J. C. Juan, RSC Adv., 2016, 6, 108741–108754 CAS.
- E. Hussain, M. Jalil, M. Z. Abid, J. Mansab, R. H. Althomali, S. Wang, A. Rauf and K. Rafiq, Mater. Adv., 2024, 5, 6572–6585 CAS.
- A. Ishaq, K. Rafiq, M. Z. Abid, U. Aiman and E. Hussain, Renewable Energy, 2024, 237, 121817 CAS.
- T. Ishaq, M. Yousaf, I. A. Bhatti, A. Batool, M. A. Asghar, M. Mohsin and M. Ahmad, Int. J. Hydrogen Energy, 2021, 46, 39036–39057 CrossRef CAS.
- A. J. Cowan and J. R. Durrant, Chem. Soc. Rev., 2013, 42, 2281–2293 RSC.
- Y. Liu, J. Guo, E. Zhu, L. Liao, S.-J. Lee, M. Ding, I. Shakir, V. Gambin, Y. Huang and X. Duan, Nature, 2018, 557, 696–700 CAS.
- X. Tang, A. Yu, Q. Yang, H. Yuan, Z. Wang, J. Xie, L. Zhou, Y. Guo, D. Ma and S. Dai, J. Am. Chem. Soc., 2024, 146, 3764–3772 CAS.
- Z. Khan, T. R. Chetia, A. K. Vardhaman, D. Barpuzary, C. V. Sastri and M. Qureshi, RSC Adv., 2012, 2, 12122–12128 CAS.
- M. Hazarika, P. K. Boruah, M. Pal, M. R. Das and C. Tamuly, ChemistrySelect, 2019, 4, 1244–1250 CAS.
- M. Z. Abid, A. Ilyas, K. Rafiq, A. Rauf, M. A. Nadeem, A. Waseem and E. Hussain, Environ. Sci.: Water Res. Technol., 2023, 9, 2238–2252 CAS.
- C. Rani, D. K. Pathak, M. Tanwar, S. Kandpal, T. Ghosh, M. Y. Maximov and R. Kumar, Mater. Adv., 2022, 3, 1602–1608 CAS.
- E. Hussain, S. Khan, M. Jalil, M. Z. Abid, A. Rauf, N. N. Riaz, A. Hashem, A. Kumar, E. F. Abd_Allah and K. Rafiq, Fuel, 2025, 382, 133672 CrossRef CAS.
- R. Panigrahi and S. K. Srivastava, RSC Adv., 2014, 4, 53055–53059 RSC.
- M. Z. Abid, K. Rafiq, A. Rauf, S. S. Ahmad Shah, R. Jin and E. Hussain, Nanoscale Adv., 2023, 5, 3247–3259 RSC.
- O. A. Baturina, S. R. Aubuchon and K. J. Wynne, Chem. Mater., 2006, 18, 1498–1504 CrossRef CAS.
- A. Skreiberg, Ø. Skreiberg, J. Sandquist and L. Sørum, Fuel, 2011, 90, 2182–2197 CrossRef CAS.
- M. Z. Abid, K. Rafiq, A. Rauf, R. H. Althomali and E. Hussain, Mater. Adv., 2024, 5, 2238–2252 CAS.
- S. C. Mali, A. Dhaka, C. K. Githala and R. Trivedi, Biotechnol. Rep., 2020, 27, e00518 Search PubMed.
- M. R. Nellist, F. A. Laskowski, J. Qiu, H. Hajibabaei, K. Sivula, T. W. Hamann and S. W. Boettcher, Nat. Energy, 2018, 3, 46–52 CAS.
- H. Tang, S. Chang, K. Wu, G. Tang, Y. Fu, Q. Liu and X. Yang, RSC Adv., 2016, 6, 63117–63130 CAS.
- Y. Ma, T.-W. Choi, S. H. Cheung, Y. Cheng, X. Xu, Y.-M. Xie, H.-W. Li, M. Li, H. Luo and W. Zhang, Nanoscale, 2019, 11, 8736–8743 CAS.
- A. Ter Heijne, O. Schaetzle, S. Gimenez, F. Fabregat-Santiago, J. Bisquert, D. P. Strik, F. Barriere, C. J. Buisman and H. V. Hamelers, Energy Environ. Sci., 2011, 4, 5035–5043 CAS.
- M. Sabir, K. Rafiq, M. Z. Abid, U. Quyyum, S. S. A. Shah, M. Faizan, A. Rauf, S. Iqbal and E. Hussain, Fuel, 2023, 353, 129196 CrossRef CAS.
- K. Rafiq, K. U. Sahar, M. Z. Abid, S. Attique, U. U. Rehman, A. Rauf and E. Hussain, Energy Adv., 2024, 3, 983–996 CAS.
- M. Z. Abid, K. Rafiq, A. K. Buzdar, M. Z. Waleed and E. Hussain, J. Cleaner Prod., 2025, 490, 144680 CAS.
- L. Wang, Y. Lin, W. Guo, Y. Yang, R. Zhang, Y. Zhai and Y. Liu, New J. Chem., 2021, 45, 14458–14468 CAS.
- X.-H. Li and M. Antonietti, Chem. Soc. Rev., 2013, 42, 6593–6604 CAS.
- T. Shan, L. Luo, T. Chen, L. Deng, M. Li, X. Yang, L. Shen and M.-Q. Yang, Green Chem., 2023, 25, 2745–2756 CAS.
- Z. Liang, B. Sun, X. Xu, H. Cui and J. Tian, Nanoscale, 2019, 11, 12266–12274 CAS.
- E. Hussain, M. Idrees, M. Jalil, M. Z. Abid, K. Aljohani and K. Rafiq, Nanoscale, 2025, 17, 3436–3450 RSC.
- B. A. Pinaud, J. D. Benck, L. C. Seitz, A. J. Forman, Z. Chen, T. G. Deutsch, B. D. James, K. N. Baum, G. N. Baum and S. Ardo, Energy Environ. Sci., 2013, 6, 1983–2002 RSC.
- F. Guzman, S. S. Chuang and C. Yang, Ind. Eng. Chem. Res., 2013, 52, 61–65 CAS.
- A. Meng, B. Zhu, B. Zhong, L. Zhang and B. Cheng, Appl. Surf. Sci., 2017, 422, 518–527 CAS.
- K. Dai, J. Lv, J. Zhang, G. Zhu, L. Geng and C. Liang, ACS Sustainable Chem. Eng., 2018, 6, 12817–12826 CAS.
- C. Yang, Y. Chen, T. Chen, S. Rajendran, Z. Zeng, J. Qin and X. Zhang, Fuel, 2022, 314, 122758 CAS.
- H. Zhao, H. Liu, L. Guo, C. Xing and X. Li, Int. J. Hydrogen Energy, 2019, 44, 24559–24571 CAS.
- J. Xu, Int. J. Electrochem. Sci., 2017, 12, 2253–2261 CAS.
- Y. Wang, H. Jin, Y. Li, J. Fang and C. Chen, Int. J. Hydrogen Energy, 2022, 47, 962–970 CAS.
- T. Su, Z. D. Hood, M. Naguib, L. Bai, S. Luo, C. M. Rouleau, I. N. Ivanov, H. Ji, Z. Qin and Z. Wu, ACS Appl. Energy Mater., 2019, 2, 4640–4651 CrossRef CAS.
- J. Wang, Y. Shen, S. Liu and Y. Zhang, Appl. Catal., B, 2020, 270, 118885 CrossRef CAS.
- S. Zong, J. Liu, Z. Huang, L. Liu, J. Liu, J. Zheng and Y. Fang, J. Alloys Compd., 2022, 896, 163039 CAS.
- Q. Wang and K. Domen, Chem. Rev., 2019, 120, 919–985 Search PubMed.
- S. Hu, F. Li, Z. Fan, F. Wang, Y. Zhao and Z. Lv, Dalton Trans., 2015, 44, 1084–1092 CAS.
- D. Singh, S. K. Gupta, Y. Sonvane, A. Kumar and R. Ahuja, Catal. Sci. Technol., 2016, 6, 6605–6614 CAS.
- K. Rafiq, K. U. Sahar, M. Z. Abid, S. Attique, U. Rehman, A. Rauf and E. Hussain, Energy Adv., 2024, 3, 983–996 CAS.
- M. Z. Abid, K. Rafiq, A. Rauf, R. H. Althomali, R. Jin and E. Hussain, Renewable Energy, 2024, 225, 120223 CAS.
- J. W. Lichtman and J.-A. Conchello, Nat. Methods, 2005, 2, 910–919 CAS.
- P. R. Chowdhury and K. G. Bhattacharyya, RSC Adv., 2015, 5, 92189–92206 Search PubMed.
- S. N. Habisreutinger, L. Schmidt-Mende and J. K. Stolarczyk, Angew. Chem., Int. Ed., 2013, 52, 7372–7408 CAS.
- C. Joyce-Pruden, J. K. Pross and Y. Li, J. Org. Chem., 1992, 57, 5087–5091 CAS.
- K. U. Sahar, K. Rafiq, M. Z. Abid, A. Rauf, U. Rehman, M. A. Nadeem, R. Jin and E. Hussain, Colloids Surf., A, 2023, 674, 131942 CAS.
- M. Wang, J. Ioccozia, L. Sun, C. Lin and Z. Lin, Energy Environ. Sci., 2014, 7, 2182–2202 RSC.
- S. Sarkar and S. C. Peter, Inorg. Chem. Front., 2018, 5, 2060–2080 RSC.
- K. A. Connelly and H. Idriss, Green Chem., 2012, 14, 260–280 CAS.
- S. Jung, N. Reed, G. Yablonsky and P. Biswas, Catal. Sci. Technol., 2021, 11, 4763–4775 RSC.
|
| This journal is © The Royal Society of Chemistry 2025 |
Click here to see how this site uses Cookies. View our privacy policy here. 
 Open Access Article
 This Open Access Article is licensed under a
  *a,
Muhammad
Jalil
a,
Mehreen
Qurban
a,
Muhammad Zeeshan
Abid
*a,
Muhammad
Jalil
a,
Mehreen
Qurban
a,
Muhammad Zeeshan
Abid