
 Open Access Article
 This Open Access Article is licensed under a
 Creative Commons Attribution 3.0 Unported Licence
Promising wound healing activity of Saussurea costus loaded PCL–gelatin nanofibers†
Jude Majed
Lababidi
 a,
Mostafa
Fytory
ab,
Abd Elrahman
Abouzid
c,
Jihad
El-Qassas
cd,
Aya T.
Gad
e,
Osama M.
Ahmed
e,
Nagwa
El-Badri
*c and
Hassan Mohamed El-Said
Azzazy
*a
a,
Mostafa
Fytory
ab,
Abd Elrahman
Abouzid
c,
Jihad
El-Qassas
cd,
Aya T.
Gad
e,
Osama M.
Ahmed
e,
Nagwa
El-Badri
*c and
Hassan Mohamed El-Said
Azzazy
*a
aDepartment of Chemistry, School of Sciences & Engineering, The American University in Cairo, AUC Avenue, P.O. Box 74, New Cairo 11835, Egypt. E-mail: hazzazy@aucegypt.edu; Tel: 00 202 2615 2559
bMaterial Science and Nanotechnology Department, Faculty of Postgraduate Studies for Advanced Sciences (PSAS), Beni-Suef University, 62511 Beni-Suef, Egypt
cCenter of Excellence for Stem Cells and Regenerative Medicine, Zewail City of Science and Technology, Giza, 12578, Egypt. E-mail: nelbadri@zewailcity.edu.eg
dZoology Department, Faculty of Science, Zagazig University, 4541519 Zagazig, Egypt
ePhysiology Division, Zoology Department, Faculty of Science, Beni-Suef University, Beni-Suef 62521, Egypt
First published on 25th March 2025
Abstract
Wound healing is a complex process, including inflammation, tissue formation, and remodeling. Saussurea costus (Sc) is reported to possess antimicrobial and anti-inflammatory activities. In this study, we manufactured polycaprolactone–gelatin nanofibers loaded with 6% Sc extract (PCL–GL-6% Sc) for wound healing applications. Comprehensive characterization confirmed the structural integrity and functionality of the prepared nanofibers. SEM results showed an increase in diameter of PCL–GL upon encapsulation of Sc. FTIR and XRD verified chemical bonding and crystallinity of the nanofibers, respectively. TGA demonstrated thermal stability, while tensile strength testing confirmed durability, and both parameters are critical for wound dressing applications. The Sc release profile showed controlled bioactive release, which supports sustained healing effects. Lastly, contact angle measurements indicated hydrophilicity, supporting cellular adhesion, which is necessary for wound recovery. Antimicrobial assessments showed significant activities of PCL–GL-6% Sc nanofibers against Pseudomonas aeruginosa, Staphylococcus aureus, and Escherichia coli, with a log reduction of around 7 in the PCL–GL-6% Sc group. Cytotoxicity tests on human skin fibroblasts revealed no significant difference between PCL–GL-6% Sc treated cells vs. untreated cells. In vivo studies in albino rats showed enhanced epithelial regeneration and collagen deposition, with significant downregulation of interleukin-6 (IL-6) (p ≤ 0.05) and upregulation of B-cell lymphoma protein 2-associated X (BAX) (p ≤ 0.0001) and matrix metalloproteinase-3 (MMP-3) (p ≤ 0.01). Immunohistochemistry supported these findings with moderate expression of vascular endothelial growth factor (VEGF) and transforming growth factor beta-1 (TGF-β1), alongside high BAX expression. In conclusion, PCL–GL-Sc 6% Sc holds potential as an effective dressing for wound healing applications.
1. Introduction
Wound healing is a complex biological process which aims to recover the functional and structural integrity of injured skin. Upon skin injury, hemostasis is activated to stop bleeding by the formation of blood clots. This is then followed by an inflammatory response with the mobilization of white blood cells to the site of injury to combat the invading pathogens and prevent microbial infections. Subsequently, the proliferation phase takes over which involves new tissue formation, collagen synthesis, and angiogenesis.1 While the body has a remarkable ability to heal itself, several challenges could disturb normal wound healing. Microbial infection is one of the most significant concerns because it could delay healing and increase tissue damage, leading to systemic problems including sepsis in some severe cases.2 Guan et al. reported a significant prevalence of microbial infections (63.9%) in skin wounds in their study.3 Furthermore, the wound environment, including moisture balance, can significantly impact the healing process.4 Identifying the specific bacteria in the wound microbiota is suggested to help tailor treatment and successful wound healing.5 Common bacteria causing wound infections include Escherichia coli (E. coli), Pseudomonas aeruginosa (P. aeruginosa), and Staphylococcus aureus (S. aureus).2Wound dressings serve as the frontline intervention in wound care, and are applied immediately after injury because they provide a physical barrier to the wound and reduce the risk of infection.6 Additionally, antibiotics play a crucial role in combating bacteria that attempt to invade wounds. Given the rise of bacterial resistance to antibiotics, alternative strategies have been developed for managing wound infections, including the use of antimicrobial agents derived from natural sources to promote wound healing while minimizing the risk of antimicrobial resistance.7
Natural products such as Curcuma longa L play an important role in wound healing, offering a variety of therapeutic benefits. Extracts of Blumea balsamifera and Aloe vera have been reported to stimulate collagen synthesis, essential for wound closure. Additionally, herbal extracts of Cordia verbenacea DC and honey promote angiogenesis and increase the expression of growth factors. Natural extracts that possess anti-inflammatory and antioxidant properties help modulate inflammatory responses and oxidative stress.8,9 Moreover, many herbal extracts, such as Matricaria chamomilla, Astragalus membranaceus, Cinnamomum cassia, and Blumea balsamifera exhibit antibacterial properties, crucial for preventing infections in wounds. It is of note that around 80% of the population worldwide primarily relies on plant-derived substances to treat various health conditions.10 The Indian Himalayan region represents a remarkable repository of botanical diversity.11 One of the important species in this region is Saussurea costus (Sc), a member of the Asteraceae family, which is known for its powerful healing properties and has been central to Chinese and Ayurvedic medicine for many years.12 The examination of the phytochemical composition of Sc unveiled diverse types of bioactive elements such as steroids, flavonoids, lignans, monoterpenes, triterpenes, and glycosides.13 For instance, the ethanolic extract of Sc is reported to have powerful natural antioxidant,13–15 anti-urolithiasis,15 anti-microbial,16–20 anti-viral,16,18 anti-inflammatory,18 nephroprotective,21 anti-cancer,19,22 and anti-obesity23 activities.
Electrospun nanofibers exhibit unique advantages making them suitable for wound healing applications.24 Their structure closely resembles the extracellular matrix (ECM) of natural tissue, providing a supportive environment for wound healing. With a high surface area to volume ratio, nanofibers maintain a moist gas environment through promoting gas exchange.25 Additionally, the materials commonly used in electrospinning are biocompatible and biodegradable polymers that serve as carriers for bioactive natural molecules, enabling sustained and direct delivery of loaded drugs to the wound site.26 Poly-ε-caprolactone (PCL), a synthetic biodegradable polymer, and gelatin (GL) have emerged as prominent choices among the diverse selection of natural and synthetic biodegradable polymers for wound dressing applications.27 Exploration of these materials has highlighted their resemblance to the ECM. Additionally, PCL offers excellent mechanical strength and biocompatibility. Its slow degradation rate ensures prolonged support and controlled drug release, and thus enhanced therapeutic outcomes.28 On the other hand, GL, derived from collagen, promotes cell attachment and tissue regeneration.29 When combined with natural antimicrobial products, PCL–GL composite fibers exhibit a synergistic wound healing effect, which promotes skin tissue repair and enables controlled release of the loaded antimicrobial agents. The synergy of these materials has proven to be effective in many studies. For example, PCL–GL nanofibrous mats loaded with a bark extract of Pinus radiata showed promising activity of these nanofibers, suggesting their efficacy as dressings for wound healing.30 Likewise, another group loaded Calendula officinalis extract in electrospun PCL–GL nanofibers, which showed suitable attributes for application as wound dressings.31
This study aimed to develop PCL–GL nanofibers incorporating varying concentrations of Sc extract, intended as an antimicrobial wound dressing. Morphological characteristics, diameter, physical properties, thermal stability, and wettability, as well as tensile properties of the electrospun nanofibers were elucidated. Additionally, the release of Sc extract from the PCL–GL nanofibers and their kinetics was investigated together with their cytotoxicity profiles to ensure biocompatibility. In vitro assessments of the antimicrobial efficacy, as well as in vivo assessment of wound healing efficacy in a rat model were conducted. Furthermore, immunostaining and molecular studies to shed light on the relevant wound healing mechanisms promoted by the Sc extract-loaded PCL–GL nanofibers were performed.
2. Material and methods
2.1. Materials
![[thin space (1/6-em)]](https://www.rsc.org/images/entities/char_2009.gif) 000 g mol−1) was obtained from Spectrum Chemical Mfg. Corp. (Gardena, USA). Formic acid and acetic acid were acquired from Chem-Lab NV (Belgium), and absolute ethanol from CARLO ERBA Reagents (Val de Reuil, France). Phosphate buffered saline (PBS) tablets were obtained from Genetix Biotech Asia Pvt. Ltd (India), and 1,1-diphenyl-2-picrylhydrazyl (DPPH) was purchased from Sigma-Aldrich (Germany). DMEM was acquired from Gibco (Thermo-scientific, Regensburg, Germany), while streptomycin–penicillin mix was obtained from Lonza (Basel, Switzerland). AlamarBlue was sourced from Merck (KGaA, Darmstadt, Germany). Sc roots used in this study were obtained from Rajab-Alattar (Cairo, Egypt). All chemicals were of ultra-pure grade and commercially available. The following kits were acquired: HERA PLUS SYBR® Green Kit (Willowfort, UK), cDNA Synthesis Kit (Thermo Fisher, Carlsbad, CA, USA), VEGF kit (GServicebio®, China), TGF-β1 kit (ABClonal, Germany), BAX kit (ABClonal, Germany), and DAB (Thermo Scientific, USA).
000 g mol−1) was obtained from Spectrum Chemical Mfg. Corp. (Gardena, USA). Formic acid and acetic acid were acquired from Chem-Lab NV (Belgium), and absolute ethanol from CARLO ERBA Reagents (Val de Reuil, France). Phosphate buffered saline (PBS) tablets were obtained from Genetix Biotech Asia Pvt. Ltd (India), and 1,1-diphenyl-2-picrylhydrazyl (DPPH) was purchased from Sigma-Aldrich (Germany). DMEM was acquired from Gibco (Thermo-scientific, Regensburg, Germany), while streptomycin–penicillin mix was obtained from Lonza (Basel, Switzerland). AlamarBlue was sourced from Merck (KGaA, Darmstadt, Germany). Sc roots used in this study were obtained from Rajab-Alattar (Cairo, Egypt). All chemicals were of ultra-pure grade and commercially available. The following kits were acquired: HERA PLUS SYBR® Green Kit (Willowfort, UK), cDNA Synthesis Kit (Thermo Fisher, Carlsbad, CA, USA), VEGF kit (GServicebio®, China), TGF-β1 kit (ABClonal, Germany), BAX kit (ABClonal, Germany), and DAB (Thermo Scientific, USA).
2.2. Saussurea costus (Sc) extract preparation
Plant roots were crushed into a fine powder using an electric mixer grinder. The extraction followed the maceration method, in which the fine powder was mixed separately with ethanol. In a tightly sealed dark container, these mixtures were left in a shaking incubator at 37 °C and a 100 rpm shaking speed for 3 days. Following incubation, the mixture was filtered using Whatman filter paper No. 1. The obtained filtrates underwent solvent evaporation using a rotary evaporator to obtain the extract, which was stored at 4 °C until needed.322.3. Characterization of the Sc extract
2.4. Fabrication of free and Sc extract loaded-PCL–GL (PCL–GL-Sc) nanofibers
Several experiments were undertaken to determine the ideal quantities of PCL and GL, as well as the most suitable solvent or solvent mixture, to produce nanofibers characterized by a smooth, well-defined shape with no beads. The use of acetic acid alone as a solvent did not yield optimal results. However, incorporating 10% formic acid with acetic acid as the solvent for PCL–GL resulted in the formation of bead-free nanofibers.34 Fabrication of the nanofibers began with the dissolution of GL (1.5%, w/v) and PCL (13.5%, w/v) in acetic acid:formic acid (9:1), and the mixture was left overnight on a stirrer at room temperature, maintaining a total polymer concentration of 15% (w/v). Different concentrations of Sc extract (2%, 4%, and 6%, w/v) were added separately to the PCL–GL solution based on the results of the initial antimicrobial tests. The polymer solution was loaded into a 5 mL glass syringe (SK-500II, Shenzhen Mindray Scientific Co., Ltd, China) for electrospinning at a rate of 0.6 mL h−1. An electrospinning voltage in the range of (20.5–24 kV) was applied between the aluminum collector and the needle. The collected nanofibers were left to dry overnight.
2.5. Characterization of the nanofibers
To perform FFT analysis on free and loaded nanofibers, ImageJ software was utilized where SEM images exhibited dimensions of 2048 × 2048 pixels (8-bit depth) in grayscale format. The resulting FFT spectrum displayed spatial frequency components, with the central region representing low frequencies (large structures) and the periphery representing high frequencies (fine structures). Isotropic patterns appeared as uniform circular features, while streaks or directional features indicated alignment.35 The alignment of PCL–GL, PCL–GL-2% Sc, PCL–GL-4% Sc, and PCL–GL-6% Sc nanofibers was analyzed with the directionality plugin in ImageJ/Fiji. The spatial arrangement of features in the entire SEM images was analyzed and processed using fast Fourier transform (FFT), converting the image from the spatial domain to the frequency domain (structural orientation is represented in terms of directional patterns). A histogram of angles (0°–180°) vs. normalized frequencies was generated. Flat regions in the histogram represent isotropic random distributions, while sharp peaks represent dominant orientation.35,36
 | (1) |
Zero-order model
| [A]t = [A]0 − k0t | (2) |
First-order model
 | (3) |
Higuchi model
| At = kHC(t1/2) | (4) |
Hixson–Crowell model
 | (5) |
Korsmeyer–Peppas model
| At/A∞ = kkptn | (6) |
2.6. In vitro biological activity
For antimicrobial assessment of PCL–GL and PCL–GL- (2, 4, and 6%) Sc nanofibers, the ISO 20743:2021 protocol was followed. Triplicates of nanofibers were cut with an average surface area of 1 cm2 equivalent to approximately 10 mg, sterilized under UV light, and placed in 50 mL Falcon tubes. Following this, the bacterial cultures of P. aeruginosa, S. aureus, and E. coli were adjusted to 0.5 McFarland standard using an Omega FLUOstar microplate reader. Further dilutions to reach log5 per mL were made, and 50 μL of the inoculum was applied to the fabrics under sterile conditions for 24 h incubation. Afterward, the nanofibers were washed with 10 mL PBS, and then 100 μL of them was spread on sterile nutrient agar. The agar plates were incubated overnight for colony counting. For both, free PCL–GL nanofibers and control samples, dilutions were performed to facilitate accurate colony counting.43
 | (7) |
2.7. In vivo wound healing
For the experimental setup, rats were anesthetized with xylazine and ketamine at 7 mg kg−1 and 60 mg kg−1, respectively. Subsequently, two wounds were created on the left and right sides of the shaved dorsum of each rat using a surgical sterile punch, each measuring 1.5 cm in diameter. The wound sizes on days 7 and 14 were determined. Wound closure was measured by calculating the reduction in wound area as compared to its initial size over time. Additionally, the weight change of rats was tracked by comparing their starting weight to their weight at the end of the study.
The rats were divided into 3 groups: normal group without wounds, negative control group injured but not treated, and treatment group using PCL–GL-6% Sc nanofibers. To minimize chance bias, each experimental group received treatments in different sequences across the dorsal surfaces of seven rats, each presenting with two wounds. After 14 days, the rats were euthanized using diethyl ether and sacrificed. Tissue and blood samples, for further analysis, were obtained.
Blood samples from the carotid artery were allowed to coagulate followed by centrifugation to separate the serum. The clear serum was subsequently stored at −20 °C until further analysis. Neutral buffered formalin was used to fix wound tissues for blocking, sectioning, and staining.
| Gene (protein) | Primer | Sequence (5′ to 3′) |
|---|---|---|
| β-actin | Forward | CACCATTGGCAATGAGCGGTTC |
| Reverse | AGGTCTTTGCGGATGTCCACGT | |
| Bax | Forward | CAAACTGGTGCTCAAGGCCC |
| Reverse | GAGACAGGGACATCAGTCGC | |
| P53 | Forward | GGAAGAGAATCTCCGCAAGAA |
| Reverse | AGCTCTCGGAACATCTCGAAG | |
| Bcl-2 | Forward | GGATAACGGAGGCTGGGATG |
| Reverse | TGACTTCACTTGTGGCCCAG | |
| MMP2 | Forward | ACTGCCTTCGATACACCGGG |
| Reverse | TATTCTTGGGCACCGGGAGG | |
| MMP3 | Forward | CACTCACAGACCTGACTCGGTT |
| Reverse | AAGCAGGATCACAGTTGGCTGG | |
| MMP13 | Forward | TTCGGCTTAGAGGTGACTGGC |
| Reverse | TTCACCCACATCAGGAACCCC | |
| TNF-α | Forward | TCTTCTCGAACCCCGAGTGA |
| Reverse | CCTCTGATGGCACCACCAG | |
| IL-1 | Forward | CGCCAATGACTCAGAGGAAG |
| Reverse | AGGGCGTCATTCAGGATCAA | |
| IL-6 | Forward | GTAGCCGCCCCACACAGACAGCC |
| Reverse | GCCATCTTTGGAAGGTTC | |
| IL-12 | Forward | TGGAGTGCCAGGAGGACAGT |
| Reverse | TCTTGGGTGGGTCAGGTTTG |
2.8. Statistical analysis
Each formulation was replicated three times, and the results along with the data were reported as the mean ± standard deviation (SD). Comparisons were conducted using one-way ANOVA followed by Tukey's multiple comparison test. The significance was considered at 4 levels as follows: p ≤ 0.05, p ≤ 0.01, p ≤ 0.001, and p ≤ 0.0001.3. Results and discussion
3.1. GC-MS of the ethanolic extract
A comprehensive GC-MS analysis of ethanolic extract identified a total of 43 chemical compounds. The top most abundant compounds were eremanthine (63.13%), followed by dehydro-saussurea lactone (11.61%), dihydrodehydrocostus lactone (5.49%), octadecatrien-1-ol (5.22%), 5-hydroxy-4-methyl 6-hepten-3-one (2.84%), β-costol (1.87%), and costunlide (0.337%). This study highlighted the presence of compounds categorized as sesquiterpenes, oxygenated sesquiterpenes, lactones, and fatty acid derivatives. These results are consistent with earlier published reports, providing validation for the known properties and composition of Sc root extract.46,47 The gas chromatogram and the compounds present in the ethanolic root extract of Sc with the corresponding percentage are shown in the ESI† (Fig. S1 and Table S1), respectively.3.2. Characterization of the nanofibers
 | ||
| Fig. 1 SEM images, diameter distribution curves, FFT analysis, and directionality plots of various nanofiber samples. The SEM images are taken at a scale of 1 μm and illustrate the morphology of the following (A-1) PCL–GL (151± 28 nm), (B-1) PCL–GL-2% Sc (230.8 ± 28.4 nm), (C-1) PCL–GL-4% Sc (236.9 ± 35.35 nm), and (D-1) PCL–GL-6% Sc (253.07 ± 44.54 nm). In the lower-right corners of each SEM image, FFT spectra are presented. A-1, lower right corner shows a diffuse circular feature of PCL–GL, reflecting an isotropic pattern, while B-1, C-1, and D-1, in the lower right corner show the FFT spectra of PCL–GL-2% Sc, PCL–GL-4% Sc, and PCL–GL-6% Sc, respectively, having moderate elongated streaks that indicate fiber alignment. Below each SEM image, the diameter distribution curves are shown, representing the size distribution for the respective samples: (A-2) PCL–GL, (B-2) PCL–GL-2% Sc, (C-2) PCL–GL-4% Sc, and (D-2) PCL–GL-6% Sc. Below each distribution curve are directionality plots of nanofiber orientations (0°–180°). (A-3) shows random alignment with low dispersion and moderate coherency of PCL–GL, while PCL–GL-2% Sc (B-3) displays moderate alignment. PCL–GL-4% Sc (C-3) achieves the strongest alignment with high directionality, larger dispersion, and improved coherency. PCL–GL-6% Sc (D-3) exhibits reduced alignment due to heterogeneity. | ||
The FFT analysis of the SEM images of the free and loaded nanofibers was conducted using ImageJ, and the corresponding FFT spectra are displayed in the bottom-right corner of each SEM image (Fig. 1(A-1)–(D-1)). For isotropic patterns (random orientation), the FFT spectrum appeared with uniform bright circular features. In contrast, streaks or elongated bright features in the FFT spectrum indicated that the nanofibers have a degree of alignment along specific directions.35 PCL–GL (Fig. 1(A-1), lower right corner) exhibited a diffuse, circular pattern, indicating an isotropic distribution of fibers. In the lower right corner of Fig. 1(B-1), PCL–GL-2% Sc revealed a slightly less diffuse pattern with elongated features, suggesting a minor degree of fiber alignment. For PCL–GL-4% (Fig. 1(C-1), lower right corner), the FFT spectrum showed pronounced streaks, reflecting a higher degree of directional alignment in the fibers. In Fig. 1(D-1), lower right corner, a similar pattern was observed as the previous image, confirming strong directional alignments in the nanofiber network.
To further quantify the alignment of PCL–GL, PCL–GL-2% Sc, PCL–GL-4% Sc, and PCL–GL-6% Sc, the directionality plugin in ImageJ/Fiji was used. The distribution of fiber orientations within the angle range of 0° to 180° was plotted against the frequency domain.54 All nanofibers exhibited multidirectional patterns, and we focused in our analysis on the most dominant direction.35,55 In PCL–GL (Fig. 1; A-3), the dominant direction value was 17.798 with low dispersion (1.13°) and moderate coherency (0.199). This indicated that while some nanofibers are aligned along the dominant direction, the overall structure is largely isotropic with random fiber orientation. In contrast, a sharper peak with a dominant direction of 21.02° was noted in PCL–GL-2% Sc (Fig. 1; B-3). It exhibited an increase in dispersion (2.98°), and a slight reduction in coherency (0.164), reflecting moderate alignment with some variability. With an increased concentration of Sc in PCL–GL-4% Sc (Fig. 1; C-3), a larger dispersion (10.40°) and improved coherency (0.191) were noted. The sharp dominant peak at 28.00° in the frequency plot indicated a strong fiber alignment, mimicking the anisotropic extracellular matrix (ECM) structure.56 On the other hand, PCL–GL-6% Sc (Fig. 1; D-3), with a dominant direction of 15.38°, reduced dispersion (2.91°), and lower coherency (0.169), exhibited some loss of alignment consistency. Secondary peaks in the frequency plot suggested the emergence of structural heterogeneity due to fiber aggregation or overloading.57 While still better aligned than PCL–GL, it is less consistent than the PCL–GL-4% Sc nanofiber due to its lower coherency and increased structural heterogeneity, as indicated by secondary peaks in the frequency plot.57
On the other hand, the FTIR spectrum of the PCL–GL nanofibers showed characteristic peaks for PCL at 1733 cm−1 (C![[double bond, length as m-dash]](https://www.rsc.org/images/entities/char_e001.gif) O stretching), 1105 cm−1 (C–O stretching), and 2923 cm−1 (H–C–H stretching).59 Furthermore, it exhibited characteristic GL peaks at 1646 cm−1 (CO stretching of primary amide I), 1561 cm−1 (C–N stretching of amide II and III), and 1572 cm−1 (N–H bending).59
O stretching), 1105 cm−1 (C–O stretching), and 2923 cm−1 (H–C–H stretching).59 Furthermore, it exhibited characteristic GL peaks at 1646 cm−1 (CO stretching of primary amide I), 1561 cm−1 (C–N stretching of amide II and III), and 1572 cm−1 (N–H bending).59
Upon incorporating the Sc extract into the PCL–GL nanofibers, the FTIR spectrum exhibited overlapping, shifting, and variations in peak intensities. These changes could be attributed to hydrogen-bonding interactions between the carbonyl groups in the Sc extract and the amine groups in GL.59 This aligns with the findings of Azizi et al., who demonstrated that incorporating Calendula officinalis extract into the PCL–GL nanofibers resulted in the emergence of new peaks or shifts in existing peaks in the FTIR spectra, indicating the presence of various functional groups from the extract.31Fig. 2A presents the FTIR spectrum of free Sc extract, PCL–GL, and PCL–GL-6% Sc.
 | ||
| Fig. 2 Comprehensive characterization of the PCL–GL nanofibers via assessment of their chemical, physical, and thermal characteristics. (A) FTIR spectra of the Sc extract, PCL–GL, and PCL–GL-6% Sc nanofibers, displaying the characteristic functional groups and bonding interactions. (B) XRD plot of the PCL pellets, GL powder, PCL–GL, and PCL–GL-6% Sc nanofibers. (C) DTG thermogram of the PCL pellets, GL powder, Sc extract, PCL–GL, and PCL–GL-6% Sc nanofibers to illustrate the decomposition behavior. | ||
The PCL pellets exhibited a single degradation stage from 297–500 °C, resulting in an 86.4% weight loss. On the other hand, GL displayed a dual-stage degradation process: an initial stage (49–100 °C) involving water loss and a subsequent stage (240–425 °C) with protein chain and peptide bond breakage, reaching peak degradation at 322 °C. PCL–GL nanofibers exhibited a singular degradation phase from 290 to 435 °C, peaking at 375 °C, suggesting improved heat resistance and thermal stability due to polymer interactions. The Sc extract exhibited a dual-step degradation pattern, with stages at 49–140 °C and 160–260 °C, and a maximum degradation at 204 °C. The first stage was attributed to water and solvent loss. PCL–GL-6% Sc nanofibers displayed peaks at 200 °C (Sc components) and 384 °C (PCL–GL chain degradation). The decline of the first stage in Sc in the nanofibers suggested the absence of small molecules like water and solvent in the nanofibers. These findings align with previous studies on the thermal degradation of nanofiber scaffolds.37,66–68
 | ||
| Fig. 3 Mechanical properties, contact angle, and release profile of PCL–GL nanofibers with varying concentrations of Sc extract. (A) Stress–strain curves of PCL–GL, PCL–GL-2% Sc, PCL–GL-4% Sc, and PCL–GL-6% Sc nanofibers, showing a decrease in stiffness and an increase in the initial resistance to deformation at higher Sc extract levels. (B) Water contact angle measurements of (I) PCL–GL: 109.78° ± 1.23, (II) PCL–GL-2% Sc: 88.81° ± 1.23, (III) PCL–GL-4% Sc: 68.0° ± 3.32, and (IV) PCL–GL-6% Sc: 54.6° ± 2.03, demonstrating an improvement in the hydrophilicity with the increase of Sc concentration. (C) Cumulative release of Sc extract over 7 days for the nanofibers: PCL–GL-2% Sc, PCL–GL-4% Sc, and PCL–GL-6% Sc, showing enhanced release with increasing Sc concentration. | ||
| Young's modulus (MPa) | Yield strength (MPa) | Elongation at break (%) | Ultimate tensile strength (MPa) | |
|---|---|---|---|---|
| PCL–GL | 10 ± 1.23 | 0.162 ± 0.05 | 14.114 ± 4.2 | 1.146 ± 0.003 |
| PCL–GL-2% Sc | 10 ± 0.05 | 0.250 ± 0.78 | 16.397 ± 0.1 | 1.237 ± 0.001 |
| PCL–GL-4% Sc | 6 ± 1.22 | 0.289 ± 0.04 | 16.857 ± 2.9 | 0.934 ± 0.002 |
| PCL–GL-6% Sc | 4 ± 0.74 | 0.409 ± 1.52 | 12.691 ± 3.7 | 0.563 ± 0.124 |
Generally, the smaller the diameter of the nanofibers, the better the tensile properties they display. Consequently, free PCL–GL nanofibers, which have the smallest diameters, demonstrated the highest resistance to elastic deformation, with Young's modulus of 10 ± 1.23 MPa.69,70 The introduction of Sc extract increased the diameter of the nanofibers, resulting in a decrease in Young's modulus.71 This observation aligns with Borges-Vilches et al. findings, where the addition of the Pinus radiata extract to the PCL–GL nanofibers reduced their mechanical strength.30
Conversely, the yield strength of the nanofibers improved with increasing concentrations of Sc extract. Free PCL–GL has a yield strength of 0.162 ± 0.05 MPa, which increases to 0.250 ± 0.78 MPa for PCL–GL-2% Sc and 0.289 ± 0.04 MPa for PCL–GL-4% Sc, peaking at 0.409 ± 1.52 MPa for PCL–GL-6% Sc. This suggests that the Sc extract may enhance internal bonding within the nanofiber structure.72,73 The elongation at break of the PCL–GL nanofibers increases with the addition of Sc extract up to 4%, but shows a slight decrease at 6%, indicating some reduction in flexibility. The ultimate tensile strength shows a peak at 1.237 ± 0.001 MPa for the PCL–GL composite containing 2% Sc, which indicates enhanced mechanical stability relative to the base PCL–GL. However, the strength decreases with higher concentrations, reaching 0.563 ± 0.124 MPa at 6% Sc, possibly due to the interference of the extract with the polymer network resulting in weak spots and reduction of the tensile strength of the material.74
Hydrophilicity and hydrophobicity were quantitatively assessed through water contact angle measurements, as depicted in Fig. 3B. The PCL–GL nanofibers exhibited a water contact angle of 109° ± 0.02, indicating a relatively hydrophobic surface. However, the addition of Sc extract significantly reduced the contact angle, demonstrating enhanced hydrophilicity to 88.81° ± 1.23, 68.0° ± 3.32, and 54.6° ± 2.03, respectively. A similar decrease in contact angle was observed in the study by Adeli-Sardou et al., where the incorporation of Lawsone into PCL–GL reduced the water contact angle.71 These results are consistent with previously reported data.37,71 This improvement in hydrophilicity is crucial for wound healing applications as it could enhance cell attachment, proliferation, and overall biocompatibility of the dressing material.76
In the subsequent phase, a slower release rate indicated drug release due to mild polymer degradation or chain breakage, representing a controlled release mechanism. After 72 h, the release percentage increased to reach 70.52 ± 3.05, 45.18 ± 0.94, and 43.33 ± 2.17% from PCL–GL-2% Sc, PCL–GL-4% Sc, and PCL–GL-6% Sc, respectively. Notably, the nanofiber with the lowest Sc concentration (2%) demonstrated the highest percentage release rate, potentially due to changes in the physical structure of the nanofiber matrix at higher concentrations, leading to increased density, which can impede the diffusion of extract molecules within the matrix.78,79
The third phase involved bulk erosion as the polymer continued to hydrate, displaying a slower release rate compared to the earlier stages due to the time required for bulk erosion. On day 7 (168 h) the release percentage reached 79.47 ± 4.98, 51.69 ± 0.349, and 45.99 ± 2.16% in PCL–GL-2% Sc, PCL–GL-4% Sc, and PCL–GL-6% Sc, respectively.80,81Fig. 3C presents the Sc released from PCL–GL nanofibers loaded with different Sc concentrations (2, 4, and 6%).
| Zero-order | First-order | Higuchi | Hixson | Korsmeyer–Peppas | |
|---|---|---|---|---|---|
| R 2 | n | ||||
| PCL–GL-2% Sc | 0.9743 | 0.9888 | 0.9978 | 0.9846 | 0.1794 |
| PCL–GL-4% Sc | 0.9368 | 0.9482 | 0.9891 | 0.9445 | 0.1647 |
| PCL–GL-6% Sc | 0.9069 | 0.9218 | 0.9756 | 0.917 | 0.1519 |
The release kinetics of the Sc extract were found to align with the Higuchi model, showing the highest correlation coefficient (R2) values across all nanofiber samples. This finding suggests that the release mechanism is predominantly driven by diffusion through the polymer matrix. Despite the crystallinity of PCL, which typically creates diffusion barriers, the incorporation of GL, hydrophilic in nature, into the nanofibers facilitated the diffusion of Sc from the nanofiber due to its rapid swelling and porous structure.82,83 Moreover, this synergistic effect between PCL and GL enabled sustained and controlled release of Sc extract over time. These results are consistent with a previous study, where Altun et al. underscored the beneficial role of adding a hydrophilic polymer such as cellulose in modifying the release kinetics of nanofiber-based delivery systems.84 To further identify the type of Sc release mechanism, the release exponent (n) in the Korsmeyer–Peppas model was calculated. The data revealed that all the nanofibers follow Fickian diffusion as n ≤ 0.45, in accordance with previously reported data.41,66
3.3. In vitro biological activities of PCL–GL-Sc nanofibers
The ISO 20743:2021 protocol for antimicrobial activity in fabrics focuses on contact-based antibacterial efficacy. This directly aligns with the goal of this study, which is to evaluate how effectively the nanofibers eliminate bacteria through direct contact with an infected wound.43Fig. 4A represents the log reduction values of P. aeruginosa, S. aureus, and E. coli treated with nanofibers loaded with different concentrations of Sc (2%, 4%, and 6%). The results have shown that all tested bacteria were inhibited in a dose-dependent manner as the concentration of Sc in the nanofibers increased. Notably, S. aureus showed the most significant reduction in bacterial count, highlighting its higher susceptibility to the antimicrobial effects of the Sc extract.
 | ||
| Fig. 4 Antimicrobial, antioxidant, biocompatibility assay, and morphological assessment of HSF cells. (A) The log reduction values of P. aeruginosa, S. aureus, and E. coli after treatment for 24 h with Sc-loaded nanofibers (2%, 4%, and 6%) and free PCL–GL, showing the highest reduction with PCL–GL-6% Sc. (B) The DPPH scavenging activity percentage upon treatment of HSF cells with nanofibers loaded with different concentrations of Sc (2%, 4%, and 6%) and free PCL–GL. (C) Cell viability assessment of HSF cells treated with PCL–GL-6% Sc nanofibers vs. untreated control group (data are represented as mean ± SD, n = 5 per group), showing no significant difference (ns: non-significant, p > 0.05). | ||
Among the formulations, PCL–GL-6% Sc achieved the highest log reductions for all bacteria, with an approximate log reduction of 7, equivalent to 99.999% of the control. This level of reduction is crucial in preventing infections, as a clean wound environment encourages the growth of fibroblasts to ensure effective tissue regeneration and wound closure.89 Eremanthine, a hydrophobic sesquiterpene and the most abundant compound in our Sc extract, was reported to integrate into bacterial lipid bilayers and disrupt the membrane integrity, causing leakage of cytoplasmic contents.90 This mechanism likely contributes to the strong antimicrobial activity observed, particularly against Gram-positive bacteria (S. aureus), whose thicker peptidoglycan layer is more susceptible to the effects of eremanthine.91 In addition, dehydro-saussurea lactone targets bacterial enzymes like DNA gyrase and topoisomerase, which are essential for DNA replication.91 Furthermore, integrating bioactive natural compounds into nanofibers has been associated with enhanced antimicrobial activities as they effectively prevent the formation of biofilms and inhibit the development of antibiotic resistance.92 For example, a study by Fallah et al. demonstrated that incorporating curcumin into PCL–GL nanofibers resulted in a 99.9% antibacterial efficacy against methicillin-resistant S. aureus.93
3.4. In vivo wound healing
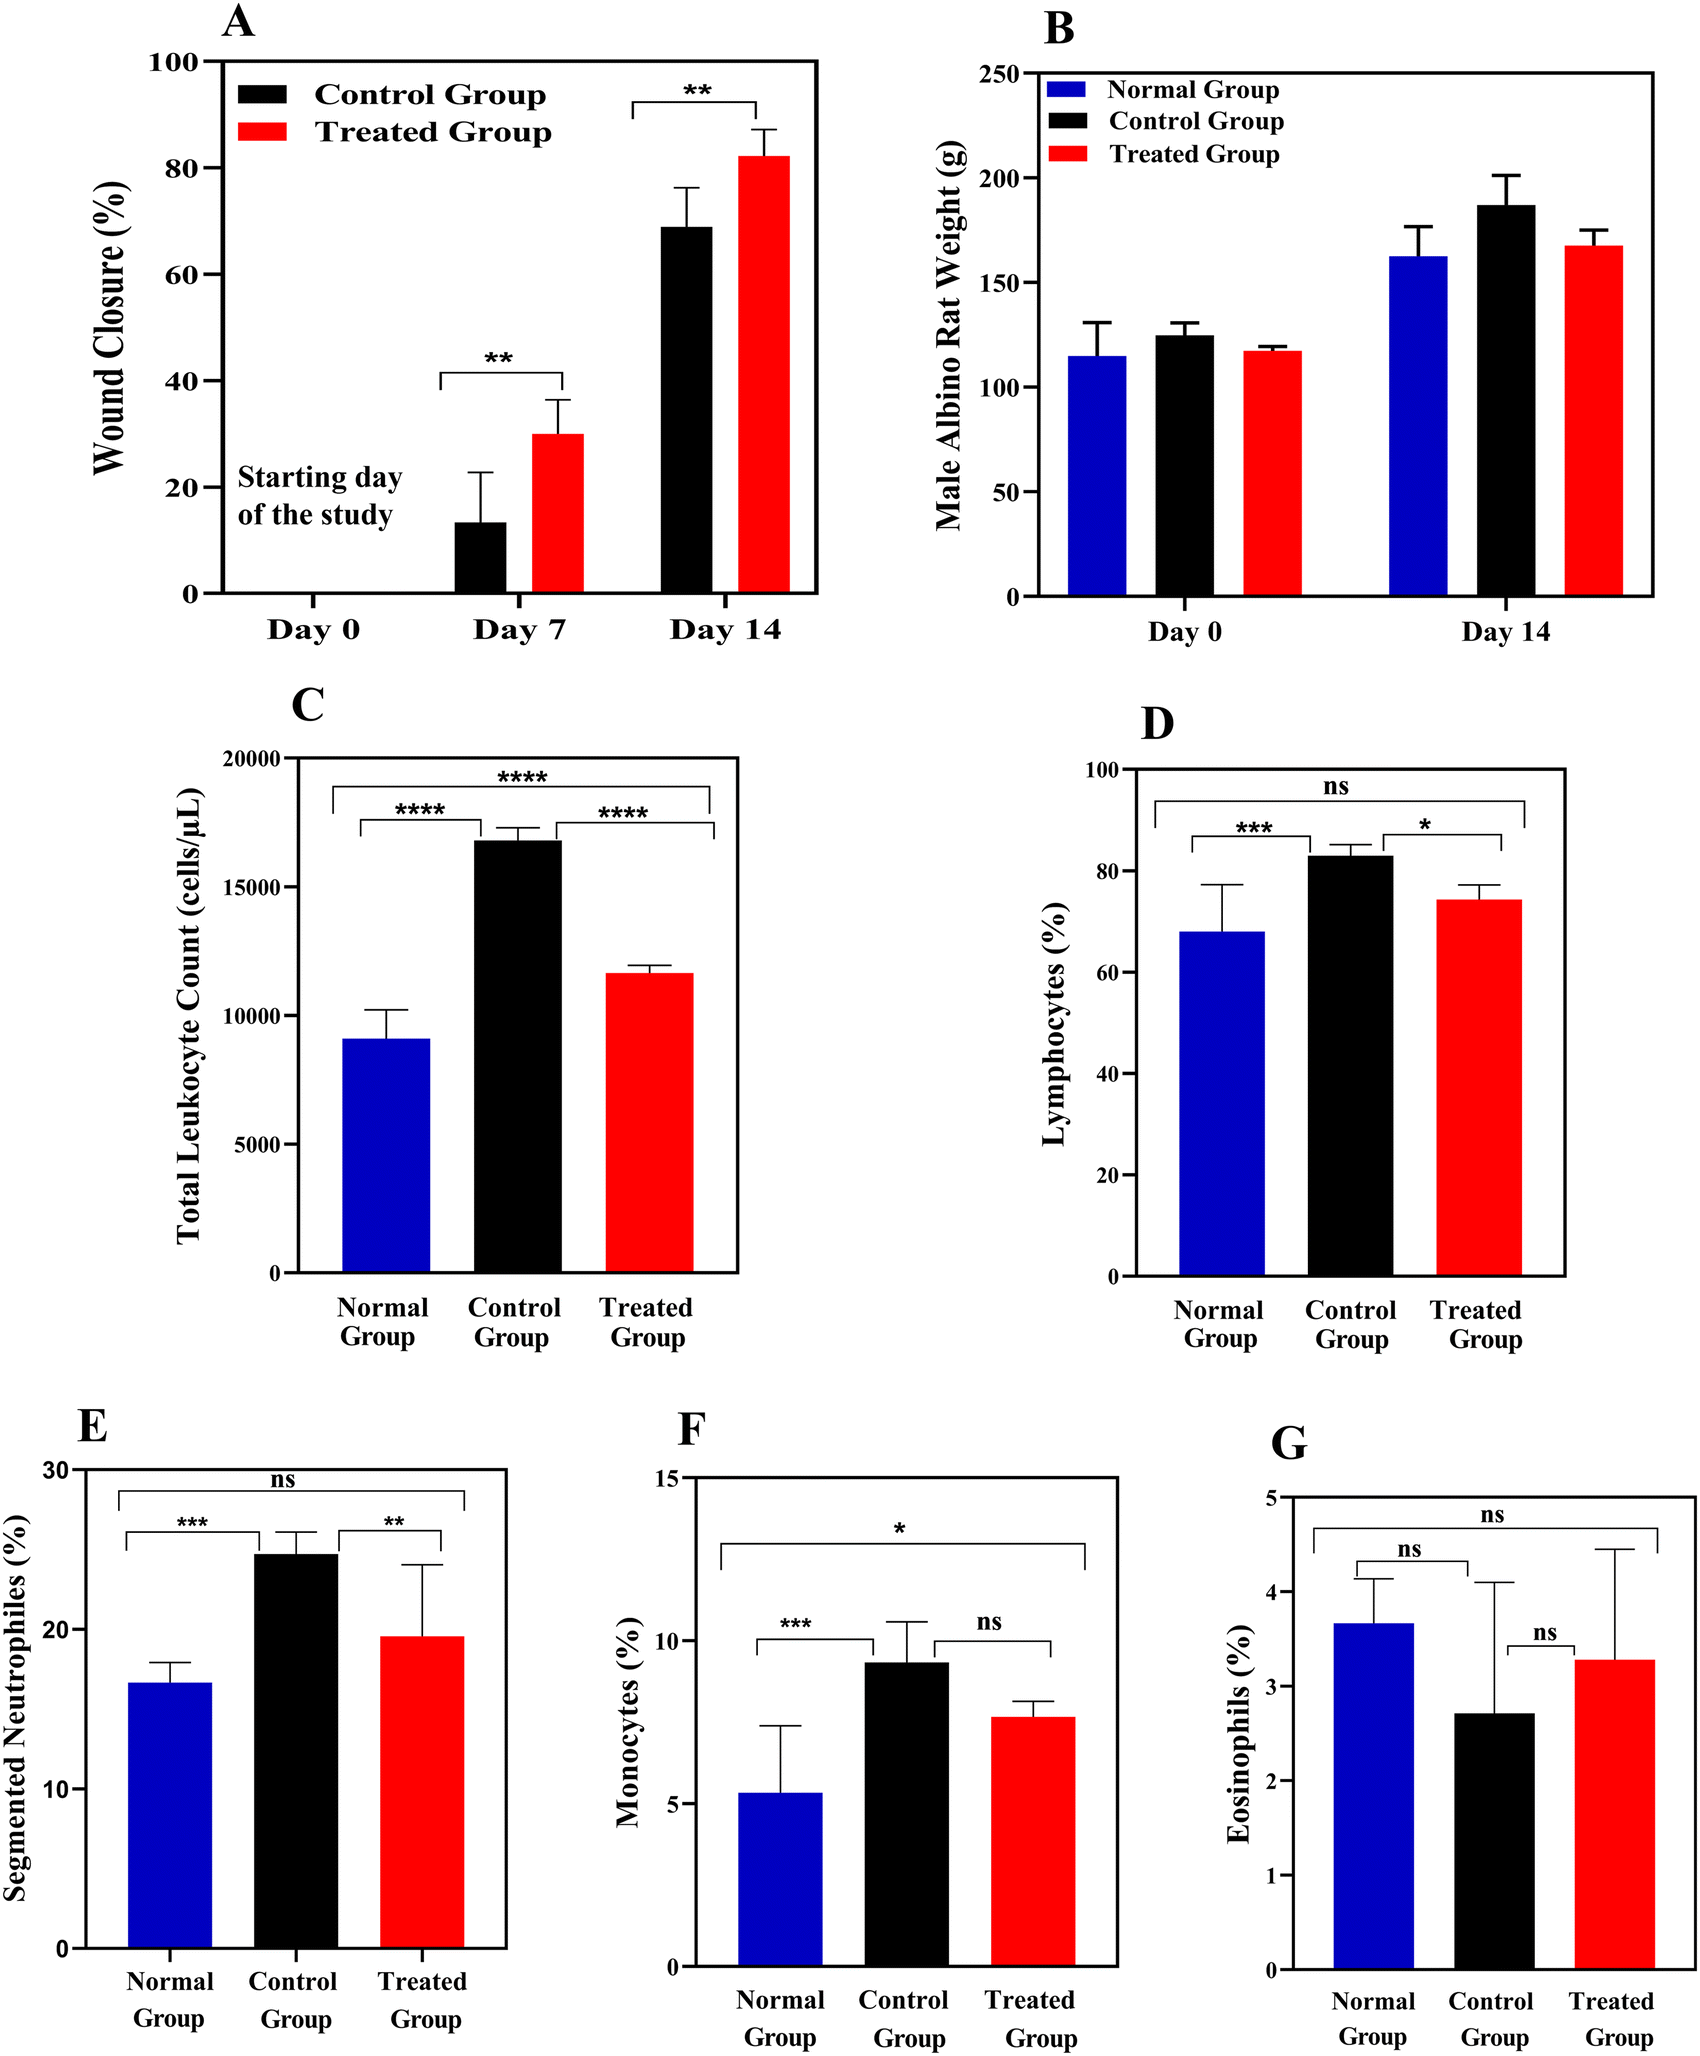 | ||
| Fig. 5 Analysis of healing progress and immune response dynamics. The data are presented as mean ± SE (n = 7). For statistical analysis, one-way ANOVA was used, followed by Tukey's test. Statistical significance was assigned as follows: p ≤ 0.05 was considered significant and marked as *, p ≤ 0.01 as **, p ≤ 0.001 as ***, and p < 0.0001 as ***; non-significant results were denoted as ns. (A) Wound closure percentages indicate that the treated group exhibited a significantly faster healing rate compared to the negative control group. (B) Weight changes of rats on days 0 and 14 showed a similar trend of weight increase across all groups. (C) TLC levels in the normal, control, and PCL–GL-6% Sc-treated groups, highlighted significant differences across these groups. (D) Lymphocyte levels in the normal, control, and treated groups, with a significant difference observed between PCL–GL-6% Sc treated and control groups. (E) Segmented neutrophil levels in the normal, control, and treated groups, with no significant difference, were observed between the PCL–GL-6% Sc treated and normal groups. (F) Monocyte levels in the normal, control, and PCL–GL-6% Sc-treated groups, underscored the role of macrophages in wound healing, with treated groups showing a transition from the inflammatory to the proliferative phase. (G) Eosinophil levels in the normal, control, and PCL–GL-6% Sc-treated groups, indicate that the eosinophil levels remain relatively consistent and unaffected by the nanofiber treatment. | ||
In terms of weight changes, all groups: (a) PCL–GL-6% Sc-treated, (b) negative control (injured but untreated), and (c) normal (uninjured), exhibited a similar trend of increased weight measured on day 14 compared to day 0, as shown in Fig. 5B. The treated group maintained a stable and healthy weight gain, with an initial average weight of 117.33 ± 2.05 g and a final weight of 167.67 ± 7.40 g. The normal (uninjured) group also experienced weight gain, following a similar pattern. This suggests that the nanofiber treatment did not have any adverse effects on the health and metabolism of the rats. Moreover, the control group exhibited similar trends, where the starting weight was at 124.85 ± 5.79 g and ended at 187.90 ± 14.22 g, showing that the experimental conditions mimicked normal growth.
White blood cells (WBC) are involved in inflammation, tissue formation, and remodeling stages of wound healing. Each stage involves distinct types of WBC that contribute to the healing process. Fig. 5C presents total leukocyte count (TLC) in the normal, negative control, and PCL–GL-6% Sc treated groups. In the normal group, TLC remains within the reference range of 9100 ± 1122.49 cells per μL, indicating no inflammatory response. In contrast, the control (injured) group exhibits elevated TLC of 16800 ± 498.89 cells per μL, signifying ongoing inflammation due to untreated wounds (p < 0.0001). The PCL–GL-6% Sc treated group shows a reduced TLC (11650 ± 300 cells per μL) and a significant difference compared to the control (p < 0.0001), indicating that the treatment effectively mitigates inflammation.101
The lymphocyte levels in the normal, negative control, and PCL–GL-6% Sc treated groups are shown in Fig. 5D. Their count percent in the PCL–GL-6% Sc treated group (68 ± 9.24%) showed no significant difference when compared to the normal group (74.33 ± 2.86%), suggesting that there is no ongoing infection at the wound site. The control group, however, displayed elevated lymphocyte counts and persistent inflammation (83 ± 2.16%), indicating a significant difference when compared to the treated group (p < 0.05).
Furthermore, Fig. 5E depicts segmented neutrophil levels in the normal, negative control, and PCL–GL-6% Sc treated groups. The count percent of segmented neutrophils in the PCL–GL-6% Sc treated group (19.57 ± 4.48%) showed no significant difference when compared to the normal group (16.66 ± 1.24%), suggesting that PCL–GL-6% Sc nanofibers helped resolve inflammation more rapidly.102 The control group, however, displayed elevated neutrophil counts (24.71 ± 1.38%) indicative of an acute inflammatory response, when compared to the treated group (p ≤ 0.01).102
Monocyte counts relative to TLC in all groups are displayed in Fig. 5F. The count percent in the normal group is within the standard range (5.33 ± 2.05%), showing a significant difference (p ≤ 0.05) when compared to the treated group (7.66 ± 0.47%), and negative control group (9.33 ± 1.24%). The treated group exhibited a lower monocyte count than the control group, indicating a transition from the inflammatory phase to the proliferative phase as the need for inflammation decreases, leading to a reduction in monocyte and macrophage activity.101
Eosinophil counts relative to TLC in the normal, negative control, and treated groups are shown in Fig. 5G. The levels in the normal group are 3.66 ± 0.47%. In both the control and treated groups, eosinophil levels show minimal variation compared to the normal group, indicating that the treatment does not significantly affect these cells, typically abundant in allergic reactions. These results are consistent with previously reported counts of leukocytes measured during the wound healing process.103,104
 | ||
| Fig. 6 Genetic expression of inflammatory, apoptotic, and angiogenesis genes using qRT-PCR. Data were expressed as mean ± SE (n = 3), and statistical analysis employed a two-way ANOVA for comparison between the control group and the PCL–GL-6% Sc-treated group. Significance was set at 0.05, with levels of statistical importance denoted as: * for p ≤ 0.05, ** for p ≤ 0.01, *** for p ≤ 0.001, **** for p ≤ 0.0001, and ns no significant difference. Graphic with relative signal intensities normalized to β-actin gene expression level. (A) Inflammatory gene fold expression (TNF-α, IL-1, IL-6, IL-12), where PCL–GL-6% Sc significantly downregulated IL-6 (*p < 0.05). (B) Apoptotic-related gene fold expression (P53, BAX, Bcl-2), with PCL–GL-6% Sc significantly upregulating Bax (****p < 0.0001) gene expression. (C) The genetic expression of angiogenesis genes (MMP-2, MMP-3, MMP-13), with PCL–GL-6% Sc significantly upregulating MMP-3 (**p < 0.01). | ||
Regarding apoptosis-related genes, the expression of Bax was significantly higher in the treated group (p < 0.0001) compared to the control, while P53 levels remained unchanged. Furthermore, Bcl-2, an anti-apoptotic gene, showed no significant difference (Fig. 6B). These findings strongly suggest that PCL–GL-6% Sc nanofibers promote the removal of damaged cells through apoptosis, which aids in resolving inflammation. They also contribute to appropriate tissue remodeling and mitigate excessive scarring.
The genetic expression of matrix metalloproteinases (MMP-1, MMP-3, MMP-13) was assessed using qRT-PCR. The findings revealed that treatment with PCL–GL-6% Sc resulted in a significant increase in MMP3 gene expression (p ≤ 0.05), as illustrated in Fig. 6C. In contrast, there was no significant upregulation observed in MMP2 and MMP13 genes compared to the control group. This suggests that PCL–GL-6% Sc promotes angiogenesis and facilitates the formation of new blood vessels to deliver oxygen and nutrients to the wound site, specifically enhancing MMP3 expression.108
 | ||
| Fig. 7 Histological analysis of skin tissue and immune organs at magnification 100×. (I) and (II) Normal (uninjured) skin tissue stained with H&E and Masson's trichrome at, respectively. (III) and (IV) Negative control skin tissue stained with H&E (III), indicating a crust-covered wound with significant neutrophil infiltration (B), loosely organized ECM with minimal collagen fibers (A), and Masson's trichrome (IV) stain, showing early-stage connective tissue. (V) and (VI) PCL–GL-6% Sc treated skin tissue stained with H&E (V) reveals a thick regenerated epithelium (A), with foci of calcification indicating tissue maturation (Arrow), and Masson's trichrome (VI) stain, displaying enhanced collagen deposition (B). | ||
For the histological analysis of the negative control (injured, untreated) skin tissue, H&E staining (Fig. 7III) revealed that the wound tissue was covered by a crust with an absent epidermal layer, indicating early re-epithelialization. In the upper dermis, there was a significant presence of neutrophils with multi-lobed nuclei, and thin-walled capillaries. The dermis also contained numerous fibroblasts, appearing as spindle-shaped cells with elongated nuclei, and a substantial infiltration of mononuclear cells, including lymphocytes, plasma cells, and macrophages. The ECM in the dermis also appeared loosely organized with minimally defined collagen fibers, presenting a pale pink background, indicative of immature connective tissue formation. On the other hand, Masson's trichrome in Fig. 7IV reveals a prominent, blue-colored crust, indicating collagen deposition and early-stage connective tissue formation. The presence of thin-walled capillaries suggests angiogenesis. However, the pale, lightly stained appearance of the ECM indicates a loose, disorganized structure, which may hinder cellular infiltration and tissue regeneration, contributing to a delayed wound-healing process.
In contrast, the PCL–GL-6% Sc treated group demonstrates significant histological improvements. H&E staining of the treated wound tissue reveals that this tissue is covered by a thick regenerated epithelium. The underlying dermis displays well-developed blood vessels and a stroma rich in fibroblasts. The presence of fine and coarse collagen strands indicates robust collagen formation, which supports tissue strength and integrity. Additionally, foci of calcification are observed, reflecting the effective maturation and stabilization of the newly formed tissue (Fig. 7V). Masson's trichrome stain of treated skin tissue (Fig. 7VI) displays regenerated keratinizing stratified squamous epithelium in red and fine strands of collagen in blue within the deeper dermal layers, suggesting enhanced collagen deposition and improved wound healing activity.
Immunohistochemistry (IHC) analysis was also conducted to visualize specific protein products within the tissue sections, thereby confirming the qPCR findings. Initially, vascular endothelial growth factor (VEGF), an essential player in the angiogenesis process, was detected. The results revealed moderate VEGF expression in the endothelial cells lining the blood vessels in both the negative control (Fig. 8A) and the PCL–GL-6% Sc-treated group (Fig. 8B). This cytoplasmic brownish staining, observed at 200× magnification, confirms that angiogenesis was actively occurring in both groups. In the negative control group, there was negative transforming growth factor β1 (TGF-β1) expression, with no significant staining observed (Fig. 8C). However, the PCL–GL-6% Sc treated group exhibited moderate TGF-β1 expression, with clear cytoplasmic brownish staining at 200× magnification (Fig. 8D). Results for BAX revealed negative expression in the negative control group, with no significant staining detected (Fig. 8E). In contrast, the PCL–GL-6% Sc treated group showed high BAX expression, as indicated by strong cytoplasmic brownish staining at 40× magnification (Fig. 8F), suggesting that the treatment may promote apoptosis in damaged cells.
 | ||
| Fig. 8 Immunohistochemistry analysis of skin tissue. (A) and (B) Moderate VEGF expression in endothelial cells lining blood vessels is observed in both the negative control (A) and PCL–GL-6% Sc treated groups (B), with cytoplasmic brownish staining at 200× magnification. (C) and (D) TGF-β1 expression is negative in the negative control group (C) but shows moderate cytoplasmic brownish staining in the PCL–GL-6% Sc treated group (D) at 200× magnification. (E) and (F) BAX expression is negative in the control group (E), with strong cytoplasmic brownish staining in the PCL–GL-6% Sc treated group (F) at 40× magnification. | ||
4. Conclusions
This study demonstrates that PCL–GL nanofibers loaded with 6% Saussurea costus (Sc) extract significantly enhance wound healing compared to lower concentrations of Sc extract and untreated controls. Characterization of the nanofibers reveals an average diameter of 253.07 ± 44.54 nm for PCL–GL-6% Sc, with improved mechanical properties observed in tensile strength tests. Specifically, the PCL–GL-6% Sc nanofibers exhibited a Young's modulus of 4 ± 0.74 MPa, a yield strength of 0.409 ± 1.52 MPa, and an ultimate tensile strength of 0.563 ± 0.124 MPa. In vitro analyses show that PCL–GL-6% Sc nanofibers exhibited a cumulative Sc extract release of 54.6% over 7 days, which is higher than the amounts released from PCL–GL-2% Sc and PCL–GL-4% Sc (38.0% and 45.0%, respectively). Antimicrobial testing indicates a log reduction in bacterial colonies of P. aeruginosa, S. aureus, and E. coli, with the highest reduction achieved with PCL–GL-6% Sc. The DPPH scavenging activity of PCL–GL-6% Sc was 86.4%, significantly higher than that of PCL–GL and lower concentrations of Sc. Histological analysis reveals that PCL–GL-6% Sc treated wounds exhibit accelerated healing, with a 35% faster wound closure rate compared to the negative control group. The treatment significantly enhances collagen deposition, with Masson's trichrome stain showing increased collagen content. Immunohistochemistry confirms moderate VEGF expression and TGF-β1 expression in treated wounds, along with high BAX expression, indicating improved angiogenesis and apoptosis regulation. The PCR results show a significant upregulation of MMP-3 and BAX and a downregulation of IL-6 (*p < 0.05). Furthermore, PCL–GL-6% Sc nanofibers were biocompatible and safe to the immune organs, with normal histological structures observed in the spleen and thymus. This study supports the potential of PCL–GL-6% Sc nanofibers as a highly effective and safe option for advanced wound healing applications. Further clinical studies and applications on wound healing are required to ensure efficacy and safety in humans.Data availability
The data supporting this article have been included as part of the ESI.† Raw data is available upon request from the authors.Conflicts of interest
The authors declare no conflict of interest in this work.Acknowledgements
This work was supported by a DUP grant from the American University in Cairo to Distinguished University Professor Hassan M. E. Azzazy and a grant from the Science and Technology Development Fund (STDF; FLUG grant no. # 46721) to Professor Nagwa El-Badri.References
- A. A. Mamun, C. Shao, P. Geng, S. Wang and J. Xiao, Front. Immunol., 2024, 15, 1395479 CrossRef PubMed.
- A. Uberoi, A. McCready-Vangi and E. A. Grice, Nat. Rev. Microbiol., 2024, 22, 507–521 CrossRef CAS PubMed.
- H. Guan, W. Dong, Y. Lu, M. Jiang, D. Zhang, Y. Aobuliaximu, J. Dong, Y. Niu, Y. Liu and B. Guan, Front. Med., 2021, 8, 609584 CrossRef PubMed.
- K. Nuutila and E. Eriksson, Adv. Wound Care, 2021, 10, 685–698 CrossRef PubMed.
- C. Ersanli, A. Tzora, C. Voidarou, S. Skoufos, D. I. Zeugolis and I. Skoufos, Biology, 2023, 12, 1187 CrossRef CAS PubMed.
- M. Mirhaj, S. Labbaf, M. Tavakoli and A. Seifalian, Macromol. Biosci., 2022, 22, 2200014 CrossRef CAS PubMed.
- A. E. B. Morguette, G. Bartolomeu-Gonçalves, G. M. Andriani, G. E. S. Bertoncini, I. M. D. Castro, L. F. D. A. Spoladori, A. M. S. Bertão, E. R. Tavares, L. M. Yamauchi and S. F. Yamada-Ogatta, Plants, 2023, 12, 2147 CrossRef CAS PubMed.
- O. Yazarlu, M. Iranshahi, H. R. K. Kashani, S. Reshadat, S. Habtemariam, M. Iranshahy and M. Hasanpour, Pharmacol. Res., 2021, 174, 105841 CrossRef CAS PubMed.
- S. El-Ashram, L. M. El-Samad, A. A. Basha and A. El Wakil, Pharmacol. Res., 2021, 170, 105749 CrossRef CAS PubMed.
- A. Shafi, F. Hassan, I. Zahoor, U. Majeed and F. A. Khanday, in Medicinal and Aromatic Plants: Healthcare and Industrial Applications, ed. T. Aftab and K. R. Hakeem, Springer International Publishing, Cham, 2021, pp. 85–111 DOI:10.1007/978-3-030-58975-2_3.
- P. Kumari, S. Samant and S. Puri, J. Med. Plants Stud., 2018, 6, 45–68 Search PubMed.
- R. Kumari, M. Negi, P. Thakur, H. Mahajan, K. Raina, R. Sharma, R. Singh, V. Anand, L. C. Ming, K. W. Goh, D. Calina, J. Sharifi-Rad and A. Chaudhary, Naunyn-Schmiedeb. Arch. Pharmacol., 2024, 397, 1505–1524 CrossRef CAS PubMed.
- C. Benedetto, M. D’Auria, M. Mecca, P. Prasad, P. Singh, S. Singh, C. Sinisgalli and L. Milella, Nat. Prod. Res., 2019, 33, 2355–2358 CrossRef CAS PubMed.
- G. I. A. El-Rahman, A. Behairy, N. M. Elseddawy, G. E. Batiha, W. N. Hozzein, D. M. Khodeer and Y. M. Abd-Elhakim, Antioxidants, 2020, 9, 1029 CrossRef PubMed.
- N. Mammate, F. E. El Oumari, H. Imtara, S. Belchkar, A. Lahrichi, A. S. Alqahtani, O. M. Noman, M. Tarayrah and T. S. Houssaini, Life, 2022, 12, 1026 CrossRef CAS PubMed.
- H. Idriss, B. Siddig, P. González-Maldonado, H. M. Elkhair, A. I. Alakhras, E. M. Abdallah, A. O. Elzupir and P. H. Sotelo, Plants, 2023, 12, 460 CrossRef CAS PubMed.
- M. Azeez Akoul and M. Ghreeb, Bionatura, 2022, 7(2), 33 Search PubMed.
- S. Alsharif, Biosci. Res., 2022, 1607–1614 Search PubMed.
- L. A. Kolahalam, K. Prasad, P. M. Krishna and N. Supraja, Heliyon, 2021, 7, e07265 CrossRef CAS PubMed.
- S. S. Hasson, M. S. Al-Balushi, J. Al-Busaidi, M. S. Othman, E. A. Said, O. Habal, T. A. Sallam, A. A. Aljabri and M. AhmedIdris, Asian Pac. J. Trop. Biomed., 2013, 3, 557–562 CrossRef PubMed.
- M. Ashry, D. Gaber and K. Abdel-Wahhab, Pak. J. Biol. Sci., 2021, 24, 830–839 CrossRef CAS PubMed.
- H. Y. Ahmed, S. M. Kareem, A. Atef, N. A. Safwat, R. M. Shehata, M. Yosri, M. Youssef, M. M. Baakdah, R. Sami, R. S. Baty, N. H. Alsubhi, G. I. Alrefaei, A. A. Shati and F. G. Elsaid, Antioxidants, 2022, 11, 1960 CrossRef CAS PubMed.
- T.-S. Yoon, Y.-Y. Sung, J.-Y. Jang, W.-K. Yang, Y.-U. Ji and H.-K. Kim, Korean J. Med. Crop Sci., 2010, 18, 151–156 Search PubMed.
- E. J. Chong, T. T. Phan, I. J. Lim, Y. Zhang, B. H. Bay, S. Ramakrishna and C. T. Lim, Acta Biomater., 2007, 3, 321–330 CrossRef CAS PubMed.
- X. Liu, H. Xu, M. Zhang and D.-G. Yu, Membranes, 2021, 11, 770 CrossRef CAS PubMed.
- C. Gao, L. Zhang, J. Wang, M. Jin, Q. Tang, Z. Chen, Y. Cheng, R. Yang and G. Zhao, J. Mater. Chem. B, 2021, 9, 3106–3130 RSC.
- B. N. Blackstone, J. M. Hahn, K. L. McFarland, D. M. DeBruler, D. M. Supp and H. M. Powell, Acta Biomater., 2018, 80, 247–257 CrossRef CAS PubMed.
- N. Raina, R. Pahwa, J. K. Khosla, P. N. Gupta and M. Gupta, Polym. Bull., 2022, 79, 7041–7063 CrossRef CAS.
- A. Gaspar-Pintiliescu, A.-M. Stanciuc and O. Craciunescu, Int. J. Biol. Macromol., 2019, 138, 854–865 CrossRef CAS PubMed.
- J. Borges-Vilches, I. Unalan, K. Fernández and A. R. Boccaccini, Polymers, 2022, 14, 2331 CrossRef CAS PubMed.
- M. Azizi, M. Azimzadeh, M. Afzali, M. Alafzadeh and S. H. Mirhosseini, J. Adv. Mater. Process., 2018, 6, 34–46 Search PubMed.
- M. M. Deabes, A.-E. Fatah, I. Sally, S. H. E. Salem and K. M. Naguib, Egypt. J. Chem., 2021, 64, 2833–2843 Search PubMed.
- K.-M. Chang and G.-H. Kim, Prev. Nutr. Food Sci., 2008, 13, 128–133 CrossRef CAS.
- J. Dulnik, P. Denis, P. Sajkiewicz, D. Kołbuk and E. Choińska, Polym. Degrad. Stab., 2016, 130, 10–21 CrossRef CAS.
- N. Reznikov, R. Almany-Magal, R. Shahar and S. Weiner, Bone, 2013, 52, 676–683 CrossRef CAS PubMed.
- A. Dragich, M. McClendon, S. Hadi, A. C. Velez-Ortega and G. I. Frolenkov, 2024 DOI:10.1093/mam/ozae044.479.
- K. Ren, Y. Wang, T. Sun, W. Yue and H. Zhang, Mater. Sci. Eng., C, 2017, 78, 324–332 CrossRef CAS PubMed.
- M. P. Paarakh, P. A. Jose, C. Setty and G. Peterchristoper, Int. J. Pharm. Res. Technol., 2018, 8, 12–20 CrossRef.
- S. Hatem, S. A. Elkheshen, A. O. Kamel, M. Nasr, N. H. Moftah, M. H. Ragai, R. S. Elezaby and N. M. El Hoffy, Drug Delivery, 2022, 29, 1212–1231 CrossRef CAS PubMed.
- L. Marincas, N.-I. Farkas, L. Barbu-Tudoran, R. Barabas and M. I. Tosa, Mater. Chem. Phys., 2023, 304, 127862 CrossRef CAS.
- A. M. Moydeen, M. S. A. Padusha, E. F. Aboelfetoh, S. S. Al-Deyab and M. H. El-Newehy, Int. J. Biol. Macromol., 2018, 116, 1250–1259 CrossRef CAS PubMed.
- M. Esmaeilzadeh Kashi, V. Soheili, J. Asili, J. Davoodi, S. Soleimanpour, G. Karimi, S. F. Taghizadeh, R. Rezaee and A. Shakeri, S. Afr. J. Bot., 2023, 154, 260–264 CrossRef CAS.
- N. K. Mahdy, M. El-Sayed, S. E.-D. Al-Mofty, A. Mohamed, A. H. Karaly, M. E. El-Naggar, H. Nageh, W. A. Sarhan and H. M. El-Said Azzazy, ACS Omega, 2022, 7, 38942–38956 CrossRef CAS PubMed.
- S. Lohrasbi, E. Mirzaei, A. Karimizade, S. Takallu and A. Rezaei, Cellulose, 2020, 27, 927–940 CrossRef CAS.
- N. K. Sedky, Z. H. El Gammal, A. E. Wahba, E. Mosad, Z. Y. Waly, A. A. El-Fallal, R. K. Arafa and N. El-Badri, J. Cell. Biochem., 2018, 119, 3892–3902 CrossRef CAS PubMed.
- R. K. Nadda, A. Ali, R. C. Goyal, P. K. Khosla and R. Goyal, J. Ethnopharmacol., 2020, 263, 113199 CrossRef CAS PubMed.
- M. F. Soliman, Y. M. Shetaia, A. A. Tayel, A. M. Munshi, F. A. Alatawi, M. A. Alsieni and M. A. Al-Saman, Antibiotics, 2022, 11, 327 CrossRef CAS PubMed.
- F. Yalcinkaya, B. Yalcinkaya and O. Jirsak, in Electrospinning: Material, Techniques, and Biomedical Applications, ed. S. A. H. Haider, IntechOpen, Rijeka Croatia, 2016, pp. 67–93 Search PubMed.
- K. F. Eidman and J. D. Belani, e-EROS Encycl. Reagents Org. Synth., 2015, 1–7, DOI:10.1002/047084289X.rf025.pub2.
- P. Denis, J. Dulnik and P. Sajkiewicz, Int. J. Polym. Mater. Polym. Biomater., 2015, 64, 354–364 CrossRef CAS.
- J. W. Kim, S. Park, K. Park and B.-K. Kim, Appl. Sci., 2023, 13, 1844 CrossRef CAS.
- G. El Fawal, H. Hong, X. Mo and H. Wang, J. Drug Delivery Sci. Technol., 2021, 63, 102501 CrossRef CAS.
- I. Unalan, S. J. Endlein, B. Slavik, A. Buettner, W. H. Goldmann, R. Detsch and A. R. Boccaccini, Pharmaceutics, 2019, 11, 570 CrossRef CAS PubMed.
- E. A. Sander and V. H. Barocas, J. Biomed. Mater. Res., Part A, 2009, 88, 322–331 CrossRef CAS PubMed.
- T. Clemons, M. Bradshaw, P. Toshniwal, N. Chaudhari, A. Stevenson, J. Lynch, M. Fear, F. Wood and K. S. Iyer, RSC Adv., 2018, 8, 9661–9669 RSC.
- Y. Luo, N. Li, J. Tu, P. Shen, C. Huang, S. Lu and F. Zhang, Available at SSRN 5077609 DOI:10.2139/ssrn.5077609.
- H. Xu, H. Li, Q. Ke and J. Chang, ACS Appl. Mater. Interfaces, 2015, 7, 8706–8718 CrossRef CAS PubMed.
- F. A. Alshubaily, Int. J. Biol. Macromol., 2019, 141, 499–503 CrossRef CAS PubMed.
- V. T. Kimura, M. H. A. Zanin and S. H. Wang, Polym. Bull., 2024, 81, 9347–9361 CrossRef CAS.
- M. P. Das, P. Suguna, K. Prasad, J. Vijaylakshmi and M. Renuka, Int. J. Pharm. Pharm. Sci., 2017, 9, 239 CrossRef CAS.
- S. Gautam, C.-F. Chou, A. K. Dinda, P. D. Potdar and N. C. Mishra, J. Mater. Sci., 2014, 49, 1076–1089 CrossRef CAS.
- S. Gautam, C.-F. Chou, A. K. Dinda, P. D. Potdar and N. C. Mishra, J. Mater. Sci., 2014, 49, 1076–1089 CrossRef CAS.
- I. Rajzer, E. Menaszek, R. Kwiatkowski, J. A. Planell and O. Castano, Mater. Sci. Eng., C, 2014, 44, 183–190 CrossRef CAS PubMed.
- D. Raj Preeth, S. Saravanan, M. Shairam, N. Selvakumar, I. Selestin Raja, A. Dhanasekaran, S. Vimalraj and S. Rajalakshmi, Eur. J. Pharm. Sci., 2021, 160, 105768 CrossRef CAS PubMed.
- S. Ravichandran, J. Radhakrishnan, P. Jayabal and G. D. Venkatasubbu, Appl. Surf. Sci., 2019, 484, 676–687 CrossRef CAS.
- M. Samy, B. Ekram, B. M. Abd El-Hady and M. M. Ayoub, Polym. Bull., 2024, 81, 3953–3972 CrossRef CAS.
- S. Gautam, A. K. Dinda and N. C. Mishra, Mater. Sci. Eng., C, 2013, 33, 1228–1235 CrossRef CAS PubMed.
- P. Zadehnajar, K. Saeed, A. Babak and L. Ghasemi, Mater. Technol., 2020, 35, 39–49 CrossRef CAS.
- S.-C. Wong, A. Baji and S. Leng, Polymer, 2008, 49, 4713–4722 CrossRef CAS.
- H. H. Kim, M. J. Kim, S. J. Ryu, C. S. Ki and Y. H. Park, Fibers Polym., 2016, 17, 1033–1042 CrossRef CAS.
- M. Adeli-Sardou, M. Torkzadeh-Mahani, M. M. Yaghoobi and M. Dodel, Biomacromol. J., 2018, 4, 46–57 Search PubMed.
- M. Dehghan, H. Nikukar and M. Khajeh Mehrizi, Polym. Bull., 2022, 79, 10881–10908 CrossRef CAS.
- M. Du, S. Liu, N. Lan, R. Liang, S. Liang, M. Lan, D. Feng, L. Zheng, Q. Wei and K. Ma, Regen. Biomater., 2024, 11, rbad114 CrossRef CAS PubMed.
- A. u R. Khan, M. Nadeem, M. A. Bhutto, F. Yu, X. Xie, H. El-Hamshary, A. El-Faham, U. A. Ibrahim and X. Mo, Pharmaceutics, 2019, 11, 386 CrossRef PubMed.
- A. Hivechi, P. B. Milan, K. Modabberi, M. Amoupour, K. Ebrahimzadeh, A. R. Gholipour, F. Sedighi, N. Amini, S. H. Bahrami, A. Rezapour, M. Hamidi and C. Delattre, Polymers, 2021, 13, 854 CrossRef CAS PubMed.
- N. Palani, P. Vijayakumar, P. Monisha, S. Ayyadurai and S. Rajadesingu, J. Nanobiotechnol., 2024, 22, 211 CrossRef CAS PubMed.
- R. Szoleczky, A. Kovács, S. Berkó and M. Budai-Szűcs, Pharmaceutics, 2024, 16, 313 CrossRef CAS PubMed.
- P. Patrojanasophon, S. Tidjarat, P. Opanasopit, T. Ngawhirunpat and T. Rojanarata, Saudi Pharm. J., 2020, 28, 1210–1216 CrossRef CAS PubMed.
- M. A. Barbosa, I. C. Gonçalves, P. M. D. Moreno, R. M. Gonçalves, S. G. Santos, A. P. Pêgo and I. F. Amaral, in Comprehensive Biomaterials II, ed. P. Ducheyne, Elsevier, Oxford, 2017, pp. 279–305 DOI:10.1016/B978-0-12-803581-8.10246-2.
- I. Sriyanti, D. Edikresnha, A. Rahma, M. M. Munir, H. Rachmawati and K. Khairurrijal, Int. J. Nanomed., 2018, 13, 4927–4941 CrossRef CAS PubMed.
- D. E. Estrella-Osuna, J. A. Tapia-Hernández, S. Ruíz-Cruz, E. Márquez-Ríos, J. D. J. Ornelas-Paz, C. L. Del-Toro-Sánchez, V. M. Ocaño-Higuera, F. Rodríguez-Félix, M. I. Estrada-Alvarado and L. A. Cira-Chávez, Nanomaterials, 2022, 12, 2303 CrossRef CAS PubMed.
- M. Milosevic, D. B. Stojanovic, V. Simic, M. Grkovic, M. Bjelovic, P. S. Uskokovic and M. Kojic, Sci. Rep., 2020, 10, 11126 CrossRef CAS PubMed.
- Y. Fu and W. J. Kao, Pharm. Res., 2009, 26, 2115–2124 CrossRef CAS PubMed.
- E. Altun, E. Yuca, N. Ekren, D. M. Kalaskar, D. Ficai, G. Dolete, A. Ficai and O. Gunduz, Pharmaceutics, 2021, 13, 613 CrossRef CAS PubMed.
- G. S. Ahmed and U. S. Coskun, An. Acad. Bras. Cienc., 2023, 95, e20230059 CrossRef CAS PubMed.
- R. E. Omer, F. H. M. Koua, I. M. Abdelhag and A. M. Ismail, J. Appl. Pharm. Sci., 2019, 9, 073–081 CAS.
- R. M. O. Alaagib and S. M. H. Ayoub, Pharma Innov., 2015, 4, 73 CAS.
- V. Duraipandiyan, N. Abdullah Al-Harbi, S. Ignacimuthu and C. Muthukumar, BMC Complementary Altern. Med., 2012, 12, 1–6 CrossRef PubMed.
- K. Khorsandi, R. Hosseinzadeh, H. Esfahani, K. Zandsalimi, F. K. Shahidi and H. Abrahamse, Inflamm. Regen., 2022, 42, 40 CrossRef CAS PubMed.
- F. Nourbakhsh, M. Lotfalizadeh, M. Badpeyma, A. Shakeri and V. Soheili, Phytother. Res., 2022, 36, 33–52 CrossRef PubMed.
- M. V. Ashraf, S. Pant, M. A. H. Khan, A. A. Shah, S. Siddiqui, M. Jeridi, H. W. S. Alhamdi and S. Ahmad, Pharmaceuticals, 2023, 16, 881 CrossRef CAS PubMed.
- Q. Pang, Z. Jiang, K. Wu, R. Hou and Y. Zhu, Antibiotics, 2023, 12, 351 CrossRef CAS PubMed.
- M. Fallah, S. H. Bahrami and M. Ranjbar-Mohammadi, J. Ind. Text., 2016, 46, 562–577 CrossRef CAS.
- H. M. Tag, H. E. Khaled, H. A. Ismail and N. S. El-Shenawy, J. Basic Clin. Physiol. Pharmacol., 2016, 27, 71–78 CrossRef CAS PubMed.
- M. Du, S. Liu, N. Lan, R. Liang, S. Liang, M. Lan, D. Feng, L. Zheng, Q. Wei and K. Ma, Regen. Biomater., 2024, 11, rbad114 CrossRef CAS PubMed.
- M. A. Shalaby, M. M. Anwar and H. Saeed, J. Polym. Res., 2022, 29, 91 CrossRef CAS.
- M. M. Lim and N. Sultana, 3 Biotechnol., 2016, 6, 211 Search PubMed.
- M. M. Lim, T. Sun and N. Sultana, J. Nanomater., 2015, 2015, 303426 CrossRef.
- P. Khazaeli, M. Alaei, M. Khaksarihadad and M. Ranjbar, J. Nanobiotechnol., 2020, 18, 176 CrossRef CAS PubMed.
- N. Yasrebi, A. H. Zarmi, M. Larypoor, M. Zeynali, B. Ebrahimi-Hosseinzadeh, Z. B. Mokhtari-Hosseini and H. Alvandi, J. Polym. Res., 2021, 28, 399 CrossRef CAS.
- N. Urao, J. Liu, K. Takahashi and G. Ganesh, Adv. Wound Care., 2022, 11, 598–621 CrossRef PubMed.
- J. Wang, Cell Tissue Res., 2018, 371, 531–539 CrossRef CAS PubMed.
- L. Hong, P. Qiu, S. Niu, Q. Chen, X. Lu, F. Chen, M. Wen, N. Yu and Z. Chen, Adv. Fiber Mater., 2024, 6, 1993–1994 CrossRef.
- K. Menclová, P. Svoboda, J. Hadač, Š. Juhás, J. Juhásová, J. Pejchal, V. Mandys, K. Eminger and M. Ryska, Mil. Med., 2021, 188, e133–e139 CrossRef PubMed.
- B. Z. Johnson, A. W. Stevenson, C. M. Prêle, M. W. Fear and F. M. Wood, Biomedicines, 2020, 8, 101 CrossRef CAS PubMed.
- P. Schilrreff and U. Alexiev, Int. J. Mol. Sci., 2022, 23, 4928 CrossRef CAS PubMed.
- X. Yang, J. Zeng, X. Yu, Z. Wang, D. Wang, Q. Zhou, T. Bai and Y. Xu, Ann. Clin. Microbiol. Antimicrob., 2023, 22, 103 CrossRef CAS PubMed.
- T. T. Nguyen, S. Mobashery and M. Chang, Wound healing-new insights into ancient challenges, 2016, vol. 10 Search PubMed.
Footnote |
| † Electronic supplementary information (ESI) available. See DOI: https://doi.org/10.1039/d4ma01196a |
| This journal is © The Royal Society of Chemistry 2025 |