
 Open Access Article
 This Open Access Article is licensed under a Creative Commons Attribution-Non Commercial 3.0 Unported Licence
Programmed self-assembly of conjugated oligomer-based helical nanofibres through hydrogen bonding interactions†
Yu
Wang‡
 a,
Guoxin
Yin‡
a,
Pradeep
Cheraku‡
b,
Yu
Xia
a,
Yuping
Yuan
a,
Peng
Miao
c,
Huidong
Zang
d,
Mircea
Cotlet
*d,
Ping
Xu
*c and
Hsing-Lin
Wang
*ab
a,
Guoxin
Yin‡
a,
Pradeep
Cheraku‡
b,
Yu
Xia
a,
Yuping
Yuan
a,
Peng
Miao
c,
Huidong
Zang
d,
Mircea
Cotlet
*d,
Ping
Xu
*c and
Hsing-Lin
Wang
*ab
aDepartment of Materials Science and Engineering, Southern University of Science and Technology, Xueyuan Avenue 1088, Shenzhen 518055, P. R. China. E-mail: wangxl3@sustech.edu.cn
bPhysical Chemistry and Spectroscopy Group, Chemistry Division, Los Alamos National Laboratory, Los Alamos, NM 87545, USA
cHarbin Institute of Technology, 92 Xidazhi Street, Nangang, Harbin, Heilongjiang, P. R. China
dCentre for Functional Nanomaterials, Brookhaven National Laboratory, Upton, New York 11973, USA
First published on 28th November 2024
Abstract
We report the synthesis and programmed self-assembly of m-phenylene vinylene (m-PPV) derivatives containing amino acid functional groups. These derivatives form highly fluorescent nanofibres through hydrogen bonding, rather than π–π stacking. Systematic investigation of tyrosine-based derivatives reveals the critical role of lateral and vertical hydrogen bonding sites in forming uniform, high-aspect-ratio nanofibres, as confirmed by cryo-TEM and SEM (diameters 2–3 nm, lengths > 20 μm). Chiral centres promoted helical nanofibres, while achiral oligomers formed straight fibres. Our study demonstrates the ability to form large-area, homogeneous straight and helical nanofibres with a high aspect ratio and increased melting point from 185 °C to 209.4 °C. Photophysical studies showed thickness-dependent fluorescence lifetimes, attributed to self-quenching. This work enhances the understanding of structure–property relationships in supramolecular assemblies and offers a new design strategy for biomimetic nanomaterials.
Introduction
Inspired by biomolecular scaffold-assisted self-assembly into high aspect ratio nanofibres, various supramolecular systems have been developed through molecular self-assembly to understand and replicate their structure and function.1,2 Such a strategy is especially important for the development of complex materials that require designing hydrogen bonding interactions at the molecular level.1,3 In particular, biomolecule based-nanofibres have shown great potential in the application of bio-sensing, biomedicine, and soft nanofabrication.4,5 Biomimetic peptide-based molecules, DNA, carbohydrates, and steroids have been attached to conjugated oligomers to exemplify how hydrogen bonding-based programmed self-assembly can be applied to facilitate the formation of hierarchical nanoscale structures.6–8 Nanowires with uniform diameters have been constructed with the auxiliary units (peptides) attached to the ends of oligomers.9,10 In recent years, short peptide systems have been studied to achieve 1D self-assemblies and understand the relationship between the peptide sequences and resulting structures.8,11–16 For example, sequence-dependent self-assembly behaviour has been observed in short peptide containing specific tyrosine units.14An alternative way to achieving 1D assemblies with desired size and physiochemical properties is to utilize amino acids.2,17–19 Functional materials based on amino acids and their derivatives have been self-assembled, providing an understanding of the structure–property relationship.20 For example, Ji et al. investigated the self-assembly behavior of L-phenylalanine (L-Phe), L-tyrosine (L-Tyr), and L-3,4-dihydroxyphenylalanine (L-DOPA).19,21–23 For L-Tyr, a face-to-face dimer building block was observed, presumably due to π–π stacking.21 Previous studies reported that L-Tyr forms nanoribbons, branches, and fern-like structures depending on the experimental parameters.24 Furthermore, racemic assembly of L-Tyr and D-Tyr was reported to induce a transformation in the supramolecular secondary structures, shifting from antiparallel to parallel β-sheets.25 However, achieving precise control on characteristics such as morphology, physiochemical property, and chirality of amino acids self-assemblies remain limited.18,25–27 Advancing the understanding of structure–property relationships and enhancing the optoelectronic properties of these amino acid self-assemblies remain challenging.2
In this study, we report the synthesis and self-assembly of a series of m-phenylene vinylene (m-PPV) derivatives containing an amino acid as a self-assembly promoter and with functional groups as hydrogen bonding sites (Scheme 1). The three main features necessary for the programmed self-assembly of oligomer derivatives into nanofibres are: (1) conjugated oligomers with structurally dependent electronic properties, (2) amino acid functional groups are hydrogen bonding donors and acceptors, and (3) oligomers with chiral and achiral centres that can induce the formation of helical and straight nanofibres. It is important to note that these m-PPV derivatives contain hydrogen bonding sites that are positionally correlated to direct the self-assembly to form 1D nanofibres via hydrogen bonding rather than π–π stacking (Fig. S1–S7, ESI†). The cryo-transmission electron microscopy (TEM) and scanning electron microscopy (SEM) revealed uniform, high aspect ratio, straight and helical nanofibres of 2–3 nm diameter that extended for more than 20 μm. The structural requirement of hydrogen bonding for the programmed self-assembly of the desired nanoscale structures can be confirmed upon tailoring multiple hydrogen-bonding sites. More importantly, this programmed self-assembly of tyrosine derivatives through hydrogen bonding interactions resulted in enhanced optical properties.
 | ||
| Scheme 1 Illustration of the supramolecular self-assembly pathway (a) molecular structure of an m-phenylene vinylene (m-PPV) derivative compound L2, designed with hydrogen bonding donors and acceptors. Cryo-TEM images of (b) helical fibres and (c) straight self-assembled fibres assembled from compound L2 in DMSO and DMSO/water mixture. Schematics depicting (d)–(f) the assembly of helical fibres, and (g)–(i) the formation of straight fibres through multiple hydrogen bonds. | ||
Results and discussion
Construction and characterization of the self-assembly system
To achieve a greater understanding of how specific functional groups lead to the formation of nanofibres, we systematically investigated the self-assembly behaviour of tyrosine derivatives with tailored hydrogen bonding sites (Fig. 1a). We first investigated the self-assembly of compound L1, a molecule comprising a phenolic ring, amino acid, and carboxylate functional groups (Fig. 1a). This molecule has a hydrogen bonding acceptor and donor in the vertical direction but not in the lateral direction, leading to no self-assembled nanostructure formation (Fig. 1b).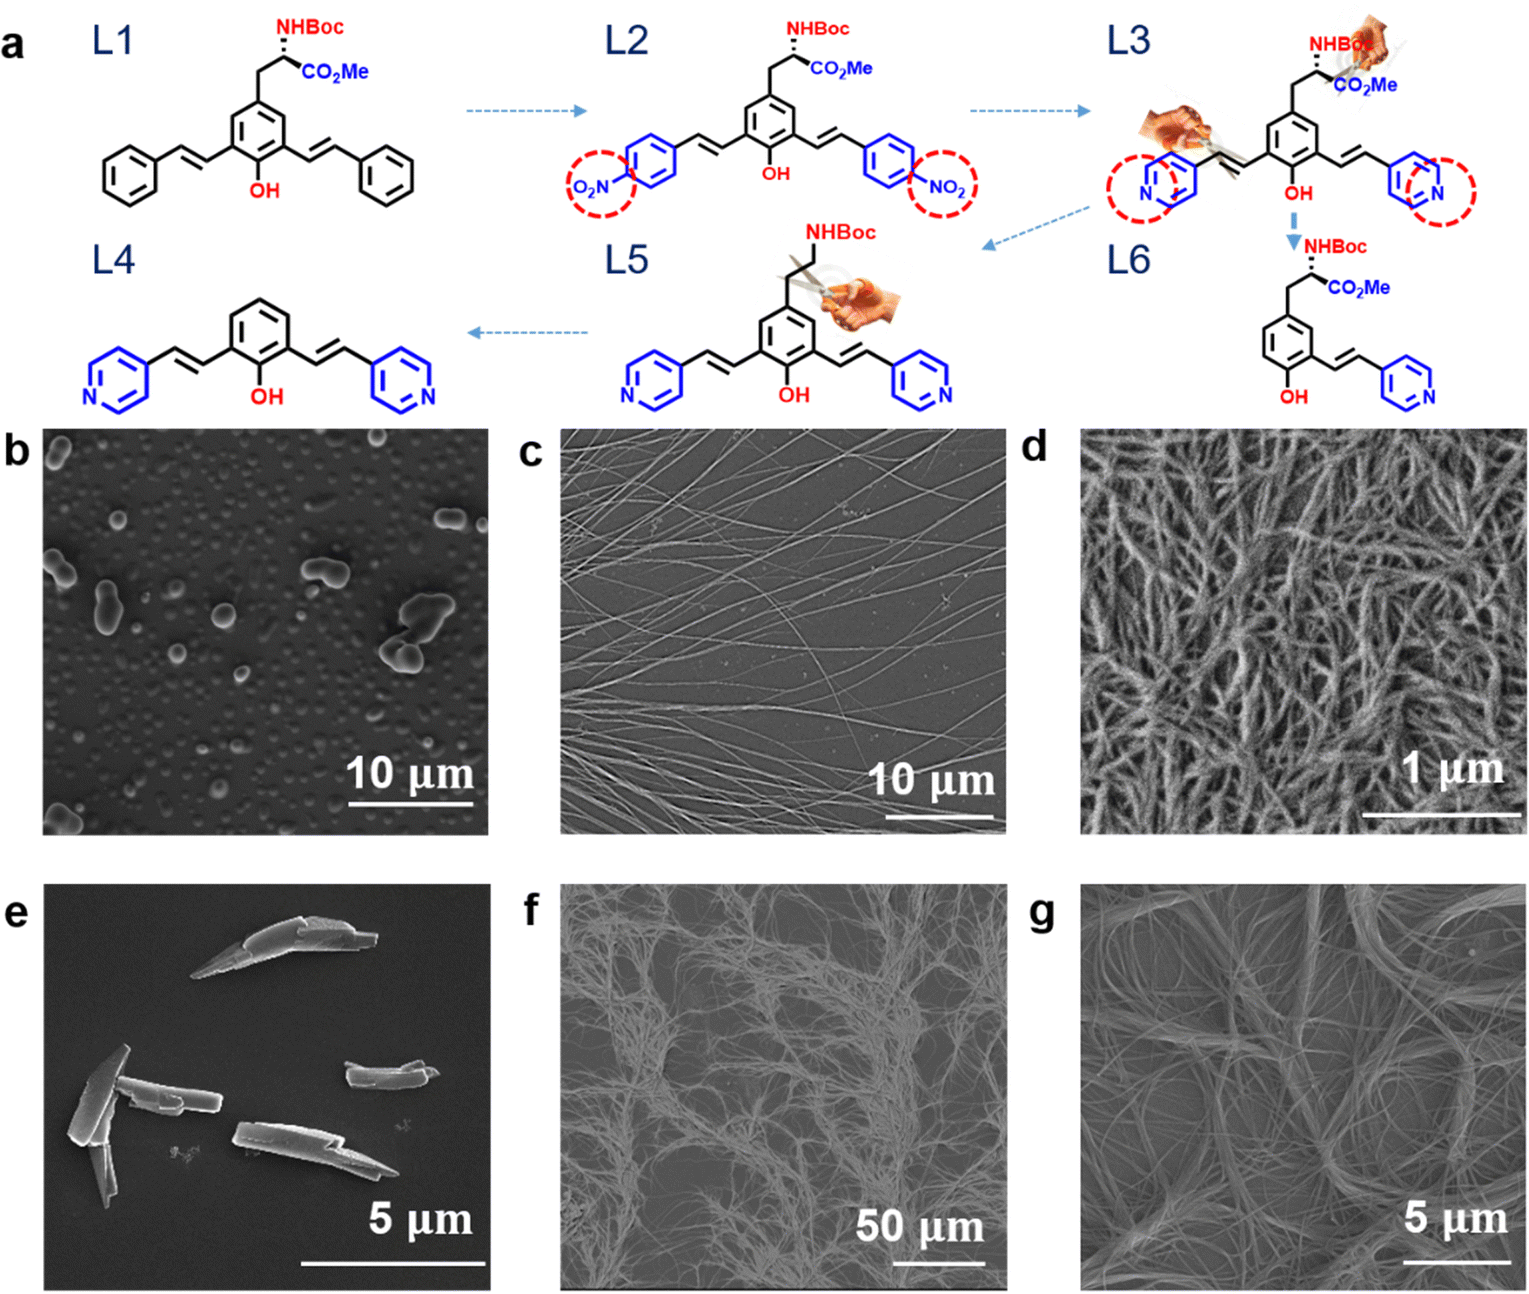 | ||
| Fig. 1 Schematic diagram and SEM images showing the relation between molecular structure and self-assembled morphology. (a) Molecular structures of tyrosine derivatives L1–L6 with various functional groups. The change or removal of functional groups is indicated by circles and scissors, respectively. (b)–(g) SEM images of the self-assembled architectures formed by L1–L6 on Si substrates, respectively. | ||
In contrast, molecules L2 and L3, which have hydrogen bond acceptors at both the vertical and lateral ends of the oligomers, form 1D nanowires. These nanowires have diameters as small as 20 nm and lengths of more than a few micrometres, as shown in Fig. 1c and d. The results suggest that it is necessary for conjugated oligomer to have functional groups (hydrogen bonding donor/acceptor) in lateral direction to form 1D nanofibres.
Then we further investigated how the presence of the phenolic –OH functional group in the vertical direction impacts the nanofiber formation. As can be seen in the m-PPV derivative L8, where the –OH group is replaced with –OMe (Fig. S1, ESI†). The absence of hydrogen bonding interactions in the bottom side of vertical direction, the nanofibre structure was no longer observed.
After validating our hypothesis regarding the –OH functional group, we synthesized L4, which lacks the –NHBoc and –COOMe functional groups. These groups were supposed to be involved in vertical hydrogen bonding with the –OH functional group. It is no surprise that no self-assembled structure was observed for L4, even with the presence of the phenolic hydroxyl group and the pyridinyl group in the lateral direction as hydrogen bond donors and acceptors. The single-crystal X-ray structure of L4 indicates that two molecules formed an interlocked dimer structure through hydrogen bond formation between the phenolic hydroxyl group and the pyridinyl group. This is illustrated in Fig. S8 and S9 (ESI†).
After confirming the importance of hydrogen bonding sites in both the vertical and lateral directions to form nanofibres. We synthesized molecule L6, which have only one hydrogen bonding site at the end, and L5, which lacks a –COOMe group, both are observed forming long nanofibres. This further confirms the necessity of both the –NHBoc group and a H-bonding site in the lateral direction to form nanofibres.
The above results validate the importance of –NHBoc as hydrogen bonding donors and acceptors in nanofibre formation. The role of each functional group in forming fibres is realized by precisely tuning the hydrogen bonding sites and molecular structures of a series of m-PPV derivatives. Additionally, these nanostructures can be easily formed by simply drop-casting an m-PPV solution onto various substrates. Taking molecule L2 as an example, SEM images demonstrate the formation of these nanofibres on several substrates, including ITO glass, aluminium foil, and graphite (Fig. 2).
 | ||
| Fig. 2 SEM images of large area of self-assembled fibre of compound L2 in DMSO on different substrates: (a) Si (b) Al (c) ITO (d) graphite. | ||
Of particular importance in this work is to realize the presence of the chiral centre of the oligomers impacts the nanofibre structure. In Fig. 3a, it can be observed that straight fibres were formed from molecule L5 with achiral building blocks. On the other hand, molecules containing the chiral centre led to the formation of helical nanofibres, as shown in Fig. 3b–d. Notably, the oligomer with only one H-binding site on one side could form helical nanofibres, as shown in Fig. 3e and f, confirming the essential role of chiral centre –COOMe in the self-assembly of nanofibres.
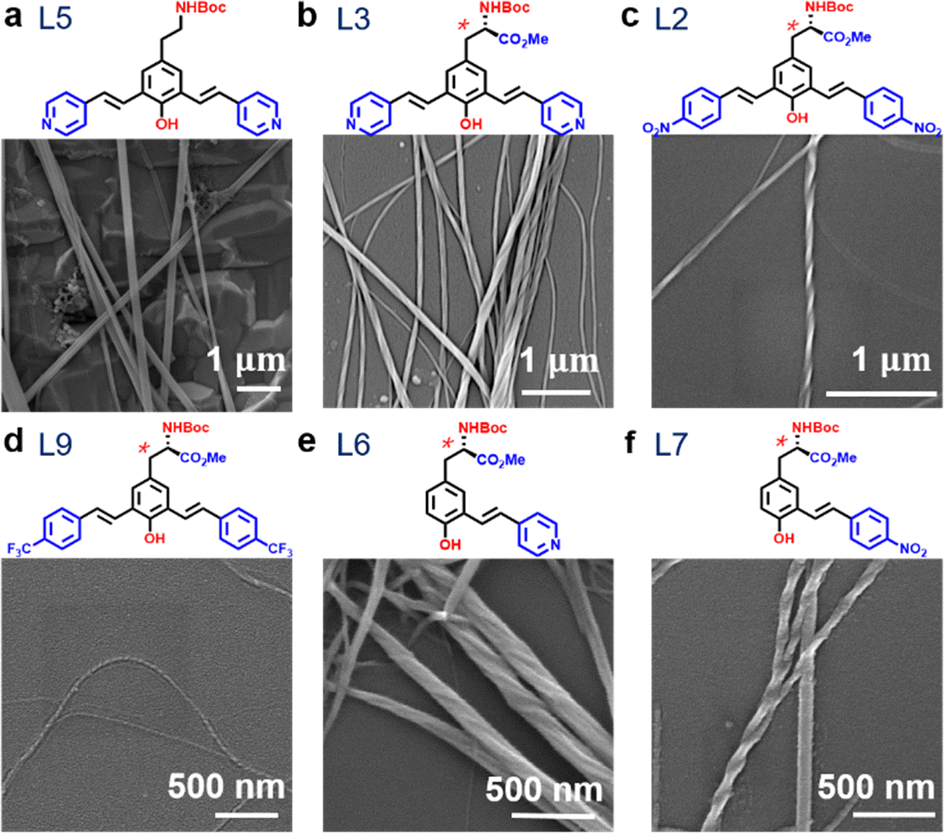 | ||
| Fig. 3 SEM images showing the effect of the chiral centre. (a) Achiral bis-styryl-L-tyrosine analogue formed nanowires without helicity (straight nanowires). (b) Chiral bis-styryl-L-tyrosine analogue formed helical nanowires. (c)–(f) Self-assembled helical fibres resulting from chiral molecules with different functional groups on the end. | ||
To better understand the functional groups involved in the self-assembly processes of forming helical nanofibres, Fourier transform infrared (FTIR) spectra were measured for KBr-dispersed L2 molecules and nanofibre self-assembly. As shown in Fig. 4a and b, the absorption peaks at approximately 3356 cm−1, 1747 cm−1, and 1685 cm−1 were assigned to the O–H, carbonyl, and carbamate groups, respectively. These peaks redshifted upon nanofibre formation, suggesting the involvement of all functional groups in self-assembly, which is consistent with our hypothesis. As shown in Fig. 4b, shifts in the absorbance peaks ascribed to the N–H bending vibration and the N![[double bond, length as m-dash]](https://www.rsc.org/images/entities/char_e001.gif) O stretching vibration in the FTIR spectra of the nanofibres were observed.28,29 It was found that the N–H stretching vibration peak at 1516 cm−1 shifted to 1510 cm−1, which was attributed to H-bond formation between the N–H and NO2 functional groups.30 The NO band was centred at 1334 cm−1 for the nanofibre and shifted to 1340 cm−1. More importantly, the peak at about 1593 cm−1, assigned to CC stretching in the aromatic system, remained unchanged, suggesting minimum overlap between benzene rings in m-PPV moieties.31,32 The above results strongly suggest nanofibres formation is mainly based on H-bonding interaction rather than π–π stacking between conjugated chromophores. Overall, systematic tuning of the molecular structure has enabled a deeper understanding of the role of each binding site within this molecular system. Additionally, FT-IR analysis provided detailed insights into the specific functional groups involved in the assembly process. To further confirm the contribution of intermolecular hydrogen bonding we measured the melting point of nanofibres self-assembled from molecule L2 and the corresponding powder. The melting point increased from 185 °C to 209.4 °C upon self-assembly, indicating enhanced thermal stability due to hydrogen-bonding interactions involving all functional groups (Fig. S10, ESI†).33 Furthermore, the CD spectrum of the self-assembled nanofibres (Fig. 4c) showed a significant CD signal with a positive peak at around 300 nm and a negative peak at around 490 nm. No peak was observed for L2 when dissolved in DMSO. This result is distinctly different from that of L2 in DMSO, consistent with the formation of a supramolecular helical structure. We conducted CD spectroscopy for two additional molecules, L3 and L6. However, the signals were barely detectable (Fig. S11, ESI†), likely due to the sparsely dispersed nature of the fibrous thin films.
O stretching vibration in the FTIR spectra of the nanofibres were observed.28,29 It was found that the N–H stretching vibration peak at 1516 cm−1 shifted to 1510 cm−1, which was attributed to H-bond formation between the N–H and NO2 functional groups.30 The NO band was centred at 1334 cm−1 for the nanofibre and shifted to 1340 cm−1. More importantly, the peak at about 1593 cm−1, assigned to CC stretching in the aromatic system, remained unchanged, suggesting minimum overlap between benzene rings in m-PPV moieties.31,32 The above results strongly suggest nanofibres formation is mainly based on H-bonding interaction rather than π–π stacking between conjugated chromophores. Overall, systematic tuning of the molecular structure has enabled a deeper understanding of the role of each binding site within this molecular system. Additionally, FT-IR analysis provided detailed insights into the specific functional groups involved in the assembly process. To further confirm the contribution of intermolecular hydrogen bonding we measured the melting point of nanofibres self-assembled from molecule L2 and the corresponding powder. The melting point increased from 185 °C to 209.4 °C upon self-assembly, indicating enhanced thermal stability due to hydrogen-bonding interactions involving all functional groups (Fig. S10, ESI†).33 Furthermore, the CD spectrum of the self-assembled nanofibres (Fig. 4c) showed a significant CD signal with a positive peak at around 300 nm and a negative peak at around 490 nm. No peak was observed for L2 when dissolved in DMSO. This result is distinctly different from that of L2 in DMSO, consistent with the formation of a supramolecular helical structure. We conducted CD spectroscopy for two additional molecules, L3 and L6. However, the signals were barely detectable (Fig. S11, ESI†), likely due to the sparsely dispersed nature of the fibrous thin films.
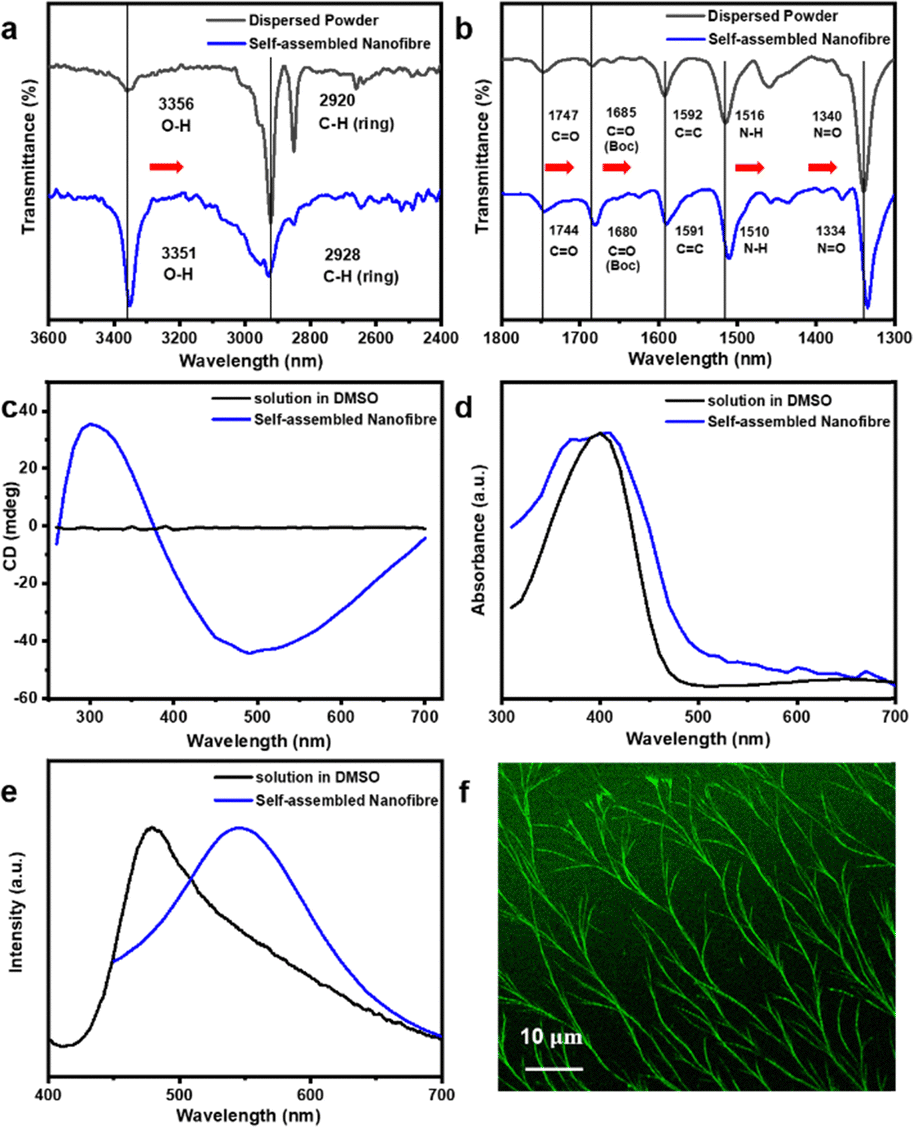 | ||
| Fig. 4 Spectroscopic study of molecule L2 in solvent and the self-assembled structure. (a) and (b) FTIR spectra of pristine L2 dispersed in KBr and the self-assembled nanofibre. (c) CD spectra of L2 dissolved in DMSO and the self-assembled nanofibre. (d) UV-Vis spectra of L2 dissolved in DMSO and the self-assembled nanofibre. (e) The normalized PL spectra of L2 dissolved in DMSO and the self-assembled nanofibre. (f) Confocal microscopy image of bundles of nanofibres confirming the fluorescence properties of the self-assembled nanofibres. | ||
To further investigate changes in optical properties, we performed spectroscopic analysis of L2 in both DMSO and after self-assembly. In the normalized UV-Vis absorption spectrum, L2 in DMSO exhibits a strong absorption band around 390 nm, whereas the self-assembled nanofibers display a broader peak with a shoulder observed around 370 nm (Fig. 4d). The normalized photoluminescence spectra of L2 in solution and in the self-assembled nanofiber form are shown in Fig. 4e. The self-assembled nanofibers exhibit a photoluminescence peak at 550 nm, significantly redshifted from the 478 nm peak observed for L2 in DMSO. These changes indicate conformational changes in the molecular environment associated with the self-assembly process, likely stabilized by intermolecular interactions.34,35 Additionally, Fig. 4f shows a confocal PL image of the self-assembled nanofibres, demonstrating the highly fluorescent nature of the self-assembled nanofibres. Our highly fluorescent nanofibres differ from that of most conjugated oligomer-based nanofibres, which experience quenching due to strong π–π interactions.10,36 This difference is primarily due to H-bonding dominated interactions in our self-assembled nanofibres, with minimum π–π interactions between oligomers.
Photophysical properties
Confocal fluorescence lifetime imaging microscopy (FLIM) was used to investigate the fluorescence lifetimes of L2 nanofibres. We used a marked substrate to locate individual nanofibres and ascertain the size-dependent optical and photophysical properties. Fig. 5a depicts a FLIM image of nanofibres and a magnified view of a portion of the image. The FLIM image in Fig. 5b was utilized to estimate the lifetimes of individual nanofibres. These nanofibres are marked as nanofibres 1–6. Time-dependent decay histograms were measured for each nanofibre, as displayed in Fig. 5b. These histograms were then analyzed using exponential models to determine their lifetimes. The lifetime of each nanofibre was recorded as a function of its diameter, and the results are summarized in Table S2 (ESI†). The data in Fig. 5c shows that the lifetime of the nanofibres increased from 0.35 to 0.89 nanoseconds as their diameter decreased from 1.1 μm to 0.24 μm, respectively. This trend suggests a self-quenching mechanism occurred among individual nanofibres in a bundle (Table S2, ESI†). This self-quenching mechanism was further confirmed by observing similar PL spectra for all these nanofibres showing diameter-dependent lifetimes (Fig. 5d). Such a phenomenon was also observed for other nanofibres, as shown in Fig. S12–S14 and Tables S3, S4 (ESI†). Most importantly, we used cryo-TEM images to examine the structure of nanofibres in more detail (Fig. 5e–g). The nanofibre bundles were achiral and composed of 2, 4, and 6 nanofibres, each with a diameter of 3–4 nm. Furthermore, we observed that the nanofibres were parallel to one another, which supports our hypothesis that H-bond interactions occur in both the paralleled and lateral directions. | ||
| Fig. 5 FLIM of the self-assemblies. (a) FLIM images of nanofibres. (b) Zoom out of the red box in (a). (c) Lifetime and (d) emission spectra of single nanofibres at points 1–6 labelled in (b). (e)–(g) Cryo-TEM images of L2 revealing nanofibre bundles composed of parallel nanofibres with diameters of approximately 2–3 nm. As hypothesized, the h-bonding was formed in both x direction and y direction. | ||
Conclusions
In summary, we report the synthesis and programmed self-assembly of a series of tyrosine derivatives with multiple functional groups capable of H-bonding. Self-assembly on a silicon substrate dominated by H-bonding interaction rather than pi–pi interaction allows the formation of highly fluorescent chiral and achiral nanofibres. We have established a mechanistic understanding of how programmed self-assembly directs nanowire formation by precisely controlling the spatial and geometric arrangements. Cyro-TEM reveals that individual nanofibre has a diameter of ∼2–3 nanometres that is consistent with our hypothesized model, and the control of H-bond at the lateral and perpendicular directions leads to a wide range of nano-scaled self-assembled structures. The photochemical properties of individual nanowires reveal thickness-dependent lifetimes and suggest that self-quenching might explain this observed thickness-dependent lifetimes. Our work provides a fundamental understanding and a unique design principle for mimicking bio-molecular scaffolds in nature and developing functional nano assemblies with structures and functions that are not currently accessible.Methods
Compounds self-assembly
Each compound was dissolved in DMSO at a concentration of 1 mM. The samples were sonicated and allowed to equilibrate for 30 minutes. Subsequently, 5 μL of each sample was drop-casted onto a silicon wafer. The samples were then placed in a plastic glovebox with controlled humidity, maintained at around 10% relative humidity, and left to dry completely.Transmission electron microscopy (TEM)
A cryo-transmission electron microscope (Krios G3i) equipped with an image Cs corrector and two cameras (Falcon 3 and FEI Ceta D) was employed at an acceleration voltage of 300 kV to capture TEM images. 5 μL of sample solution at 1 mM was drop-casted onto a cleaned silicon wafer. Then, the TEM sample was prepared on a carbon-coated copper grid by transferring the self-assembled nanofibre from the silicon wafer by a needle.Scanning electron microscopy (SEM)
5 μL of each sample solution was drop-casted onto a silicon wafer. The samples were imaged with TESCAN MIRA 3 SEM operating at 20 kV. To control the humidity, we connected a pump with a plastic glovebox. A hygrometer was put in the glovebox for in situ measurement of the humidity during pumping.UV-Vis, PL, FTIR, and confocal microscopy measurements
UV absorption spectra were obtained on a Cary 5000 UV-vis-NIR spectrophotometer. Fluorescence emission spectra were recorded using a HORIBA PTI-QM-8075 luminescence spectrometer. The excitation wavelength was 355 nm for the fiber and powder samples, with 3 nm emission and excitation slit widths. FTIR spectra were collected using a Thermo Scientific Nicole iS50 FTIR spectrometer in attenuated total reflection (ATR) mode.Circular dichroism measurements
The CD spectra of all the samples were recorded on an Applied Photophysics Chirascan CD Spectrometer at room temperature. The data were collected at 10 nm intervals over the range of 180–700 nm. All solution measurements were performed in a 1 cm path length cuvette with a 1000 μL sample volume. All film measurements were conducted by drop-casting the sample onto a 1 mm silica glass wafer. Each CD profile was the average of three scans of the same sample collected at a scan rate of 600 nm min−1, with a proper baseline correction for the respective solvents or substrates.Differential scanning calorimetry (DSC)
DSC was measured by DSC 25 TA instruments with a heating rate of 10 °C min−1. The measurement was done at a temperature range between 30 °C and 300 °C with nitrogen as a protective gas at a flow rate of 100 mL min−1. The weight of samples is around 1 mg (±0.1 mg) prepared in standard aluminum DSC pans.Fluorescence lifetime imaging microscopy
The FLIM was performed on an Olympus IX81 confocal microscope equipped with a scanning stage (Physics Instrumente, Germany) and a picosecond laser with an excitation wavelength of 442 nm (Picoquant Sepia, Germany). The laser beam entering the microscope was reflected by a dichroic mirror (Di01-R442, Semrock) and focused on the sample by a 100×, 0.95 NA objective lens (Olympus). Fluorescence from the samples was collected by the same lens, filtered from the laser excitation by the dichroic mirror and a bandpass filter (FF01-583/120, Semrock), spatially filtered by a 75 μm pinhole and refocused onto a single-photon avalanche photodiode (MPD Picoquant), with the signal read by a PicoHarp 300 TCSPC analyzer (PicoQuant). FLIM images and fluorescence decays from diffraction-limited spots were acquired and analyzed with Symphotime 64 software (Picoquant). Fluorescence spectra were acquired using a Spectra Pro 2300i monochromator coupled to a Pixis 100 Roper Scientific camera and WinSpec software.Single crystal of L4
A single crystal of L4 was prepared by slowly evaporating the organic solvent of L4 solution. The measurement was made on a Bruker D8 Venture X-ray diffractometer equipped with compact optics monochromated microfocus Mo source Kα radiation and a Photon100 CMOS detector. The structure was solved by direct methods, SIR92. All of the non-H atoms were refined anisotropically.Data availability
The data supporting this article have been included as part of the ESI.† Crystallographic data for molecule L4 has been deposited at the CCDC under 2116235† and can be obtained from https://www.ccdc.cam.ac.uk/structures/Search?Ccdcid=2116235&DatabaseToSearch=Published.Conflicts of interest
There are no conflicts to declare.Acknowledgements
The authors acknowledge support from the Key-Area Research and Development Program of Guangdong Province (Grant No. 2019B010941001) and the National Key Research and Development Program of China (Grant No. 2018YFB0704100). This research used resources from the Centre for Functional Nanomaterials (CFN), which is a U.S. Department of Energy Office of Science user facility at Brookhaven National Laboratory under Contract No. DE-SC0012704.Notes and references
- T. Aida, E. Meijer and S. Stupp, Science, 2012, 335, 813–817 CrossRef CAS.
- Y. Wang, S. Rencus-Lazar, H. Zhou, Y. Yin, X. Jiang, K. Cai, E. Gazit and W. Ji, ACS Nano, 2023, 18, 1257–1288 CrossRef.
- B. R. Heiner, A. M. Pittsford and S. A. Kandel, Chem. Commun., 2023, 59, 170–178 RSC.
- L. Albertazzi, D. van der Zwaag, C. M. Leenders, R. Fitzner, R. W. van der Hofstad and E. Meijer, Science, 2014, 344, 491–495 CrossRef CAS.
- C. Yuan, W. Ji, R. Xing, J. Li, E. Gazit and X. Yan, Nat. Rev. Chem., 2019, 3, 567–588 CrossRef CAS.
- S. Kumar, A. Pearse, Y. Liu and R. E. Taylor, Nat. Commun., 2020, 11, 2960 CrossRef CAS PubMed.
- B. Cai, Z. Li and C. L. Chen, Acc. Chem. Res., 2021, 54, 81–91 CrossRef CAS PubMed.
- A. Levin, T. A. Hakala, L. Schnaider, G. J. Bernardes, E. Gazit and T. P. Knowles, Nat. Rev. Chem., 2020, 4, 615–634 CrossRef CAS.
- J. D. Tovar, Acc. Chem. Res., 2013, 46, 1527–1537 CrossRef CAS PubMed.
- J. P. Dibble, C. Troyano-Valls and J. D. Tovar, Macromolecules, 2020, 53, 7263–7273 CrossRef CAS.
- T. Schnitzer, S. A. Jansen, M. F. Mabesoone, G. Vantomme and E. Meijer, Angew. Chem., Int. Ed., 2022, 134, e202206729 CrossRef.
- M. B. Baker, L. Albertazzi, I. K. Voets, C. Leenders, A. R. Palmans, G. M. Pavan and E. Meijer, Nat. Commun., 2015, 6, 1–12 Search PubMed.
- M. Kumar, L. Nicole, V. Narang, N. K. Wijerathne, A. I. Hochbaum and R. V. Ulijn, Nat. Chem., 2018, 10, 696–703 CrossRef CAS.
- H.-S. Jang, J.-H. Lee, Y.-S. Park, Y.-O. Kim, J. Park, T.-Y. Yang, K. Jin, J. Lee, S. Park and J. M. You, Nat. Commun., 2014, 5, 1–11 Search PubMed.
- S. Kuila, A. K. Singh, A. Shrivastava, S. Dey, T. Singha, L. Roy, B. Satpati and J. Nanda, J. Phys. Chem. B, 2023, 127, 4808–4819 CrossRef CAS.
- T. M. Clover, C. L. O’Neill, R. Appavu, G. Lokhande, A. K. Gaharwar, A. E. Posey, M. A. White and J. S. Rudra, J. Am. Chem. Soc., 2020, 142, 19809–19813 CrossRef.
- S. Perween, B. Chandanshive, H. C. Kotamarthi and D. Khushalani, Soft Matter, 2013, 9, 10141–10145 RSC.
- P. Xing, P. Li, H. Chen, A. Hao and Y. Zhao, ACS Nano, 2017, 11, 4206–4216 CrossRef CAS PubMed.
- S. Kuila, S. Dey, P. Singh, A. Shrivastava and J. Nanda, Chem. Commun., 2023, 59, 14509–14523 RSC.
- P. P. Bose, M. G. Drew, A. K. Das and A. Banerjee, Chem. Commun., 2006, 3196–3198 RSC.
- W. Ji, B. Xue, Z. A. Arnon, H. Yuan, S. Bera, Q. Li, D. Zaguri, N. P. Reynolds, H. Li and Y. Chen, ACS Nano, 2019, 13, 14477–14485 CrossRef CAS PubMed.
- V. Singh, R. K. Rai, A. Arora, N. Sinha and A. K. Thakur, Sci. Rep., 2014, 4, 3875 Search PubMed.
- B. G. Anand, K. P. Prajapati, D. S. Shekhawat and K. Kar, Biochemistry, 2018, 57, 5202–5209 CrossRef CAS.
- C. Ménard-Moyon, V. Venkatesh, K. V. Krishna, F. Bonachera, S. Verma and A. Bianco, Chem. – Eur. J., 2015, 21, 11681–11686 CrossRef PubMed.
- J. Liang, A. Hao, P. Xing and Y. Zhao, ACS Nano, 2021, 15, 5322–5332 CrossRef CAS.
- Y. Zhang, Q. Li, H. Wu, Y. Wang, Y. Wang, S. Rencus-Lazar, Y. Zhao, J. Wang, D. Mei and H. Xu, ACS Nano, 2023, 17, 2737–2744 CrossRef CAS.
- S. Bera, B. Xue, P. Rehak, G. Jacoby, W. Ji, L. J. Shimon, R. Beck, P. Král, Y. Cao and E. Gazit, ACS Nano, 2020, 14, 1694–1706 CrossRef CAS PubMed.
- F. C. Wang, M. Feve, T. M. Lam and J. P. Pascault, J. Polym. Sci., Part B: Polym. Phys., 1994, 32, 1315–1320 CrossRef CAS.
- R. D. Kross and V. A. Fassel, J. Am. Chem. Soc., 1956, 78, 4225–4229 CrossRef CAS.
- B. Dereka, Q. Yu, N. H. Lewis, W. B. Carpenter, J. M. Bowman and A. Tokmakoff, Science, 2021, 371, 160–164 CrossRef CAS PubMed.
- D. B. Mawhinney, V. Naumenko, A. Kuznetsova, J. T. Yates, J. Liu and R. Smalley, J. Am. Chem. Soc., 2000, 122, 2383–2384 CrossRef CAS.
- Y. Yuan, J. Shu, P. Liu, Y. Zhang, Y. Duan and J. Zhang, J. Phys. Chem. B, 2015, 119, 8446–8456 CrossRef CAS PubMed.
- J.-G. Li, Y.-D. Lin and S.-W. Kuo, Macromolecules, 2011, 44, 9295–9309 CrossRef CAS.
- T. Uesaka, T. Ishitani, R. Sawada, T. Maeda and S. Yagi, Dyes Pigm., 2020, 183, 108672 CrossRef CAS.
- K. Watanabe, I. Osaka, S. Yorozuya and K. Akagi, Chem. Mater., 2012, 24, 1011–1024 CrossRef CAS.
- B. Hua, C. Zhang, W. Zhou, L. Shao, Z. Wang, L. Wang, H. Zhu and F. Huang, J. Am. Chem. Soc., 2020, 142, 16557–16561 CrossRef CAS PubMed.
Footnotes |
| † Electronic supplementary information (ESI) available. CCDC 2116235. For ESI and crystallographic data in CIF or other electronic format see DOI: https://doi.org/10.1039/d4ma01057d |
| ‡ Co-first authors. |
| This journal is © The Royal Society of Chemistry 2025 |