
 Open Access Article
 This Open Access Article is licensed under a
 Creative Commons Attribution 3.0 Unported Licence
Open-space microfluidics as a tool to study signaling dynamics
Maude
Proulx
 a,
Pierre
Clapperton-Richard
a,
Laurent
Potvin-Trottier
b,
Alisa
Piekny
b and
Thomas
Gervais
*acde
a,
Pierre
Clapperton-Richard
a,
Laurent
Potvin-Trottier
b,
Alisa
Piekny
b and
Thomas
Gervais
*acde
aInstitute of Biomedical Engineering, Polytechnique Montréal, Montréal, QC, Canada. E-mail: Thomas.Gervais@polymtl.ca
bDepartment of Biology, Concordia University, Montréal, QC, Canada
cDepartment of Engineering Physics, Polytechnique Montréal, Montréal, QC, Canada
dInstitut du Cancer de Montréal, Montréal, QC, Canada
eCentre de Recherche du Centre Hospitalier de l'Université de Montréal (CRCHUM), Montréal, QC, Canada
First published on 18th September 2025
Abstract
The temporal dynamics of cell signaling are a crucial way for cells to regulate their transcriptional targets and consequently may heavily influence cell responses. Improving our understanding of signaling dynamics is important for drug treatments targeting specific signaling pathways. However, studying signaling dynamics requires multiplexed, time-sensitive experiments. Here, we use an open-space microfluidic device, the microfluidic display, which enables liquid delivery from above a surface, forming defined and stable confinement zones without enclosing samples into a chip. A device with rapid reagent switching (<7 seconds) and 6 independent confinement areas is first designed. Using this platform, we study the Notch pathway in engineered C2C12 cells to display constitutively active Notch receptors upon which we force highly controlled time-dependent modulation patterns by delivering time-varying doses of the Notch inhibitor DAPT. We replicate previous findings on Notch activation with our methodology by confirming the Notch-regulated gene Hes1 is upregulated for short Notch activation pulses, while Hey1 required sustained activation. We confirm a previously observed regime switch from Hes1 to Hey1 dominance between 2 h and 3 h of activation. Finally, by varying signal pulses while keeping dose constant in six independent experiments performed simultaneously, we further show the upregulation of the Hes1 gene for multiple short pulses, while Hey1 activation depends on duty cycle length. These results highlight microfluidic displays as a valuable tool for systems biology, enabling multiplexed, high temporal resolution stimulation of signaling pathways.
Introduction
Signaling is fundamental for cells. It allows them to communicate with one another and adapt to environmental cues, regulating processes such as proliferation, differentiation and apoptosis. Signaling events occur when a ligand binds to a receptor, leading to a cascade of biochemical reactions that control the function of proteins for gene expression, among other outputs. It is now well established that the signaling dynamics, i.e. the temporal profile of the signal, contain information that can be decoded by cells to modulate their behavior.1–3 Many signaling pathways lead to changes in cell fate, which are determined by signaling dynamics. For example, the tumor suppressor p53 may lead to cell senescence or transient cell cycle arrest and DNA repair depending on the pulsatile or sustained nature of its expression.4,5 Changes in the dynamics of the nuclear factor Nf-κB discriminate gene targets,6,7 and different ERK dynamics may lead to different cell fates.8,9 These findings emphasize the importance of understanding signaling dynamics.In recent years, several techniques have emerged to study how cells decode dynamic signals, motivated by the need for precise temporal activation of pathways and increased experimental throughput.10 Among them, microfluidic systems have been highlighted as an appealing technology to control and study signaling dynamics, as they allow close control of liquid handling and experiment automation. There is indeed a long-standing interest in systems biology applications for microfluidics to precisely control culture conditions.11 For example, microfluidic chips were used to study the relation between the signaling oscillations of Notch and Wnt in mouse embryos,12 to investigate the effect of noise in the Nf-κB pathway,13,14 and to look into signaling pathways involved in neural stem cell development.15 However, a main drawback in the adoption of microfluidic systems to study signaling dynamics is how working inside small channels or chambers might complicate the manipulation of samples. This complicates their access and retrieval, making both everyday handling and biological assays more tedious than in traditional Petri dishes and well plates.
Open-space microfluidics offers an alternative to classic, closed-channel systems.16 This change of paradigm removes the need for physical walls to confine fluids, instead operating from above and creating confinement areas on an open surface in a contact-free fashion, thereby enabling the processing of large surfaces in well plates and Petri dishes. A notable open-space technology is the microfluidic probe (MFP), a device with two channels respectively guiding an injection and an aspiration flow.17 The MFP design could be compared to a closed-space microfluidics device with a sole channel, as fluid is confined to a single zone. While the MFP may facilitate sample handling, it lacks the parallel architecture that many classic microfluidics systems provide, and expanding the number of test conditions requires careful scanning systems of the device across the surface. This results in significant losses of time resolution, which constitutes a critical factor to study cellular dynamics.
Some of us (T. G.) have developed a theoretical and experimental framework to guide the design of static multiplexed open-space microfluidic devices, named microfluidic displays, that create distinct confinement areas above a surface.18 Reagents can be pulsed in each independent confinement area with their own spatiotemporal signature, thus multiplexing several experiments in a single culture dish. Their potential for drug screening using cancer cell models has previously been demonstrated.19
Here, we design an open-space microfluidic architecture to be used for the first time ever in the context of systems biology. As a first proof of principle, we apply it to study the dynamics of the Notch pathway. Notch is a ubiquitous, highly conserved pathway which plays a fundamental role in tissue development and homeostasis in varied cellular contexts.20 Dysregulations of the Notch pathway can lead to diseases, and its role in different cancer types is also well established.21–23 Notch functional outcomes are varied, yet all ligand–receptor interactions result in the release of the Notch intracellular domain (NICD), implicating other mechanisms for encoding information. Notably, signal dynamics have been shown to play a role in Notch signaling outcomes in several biological contexts. The periodic expression of Notch signaling targets, such as transcription repressors from the Hes family, is crucial for the synchronization of the signaling pathways network that regulate early development.24 Expression dynamics of the Hes/Hey family of transcription repressors regulate targets involved in the differentiation of muscle cell progenitors, playing crucial roles in myogenesis.25 It also has been demonstrated that Notch can dynamically discriminate between ligands, showing selective gene expression in response to differences in upstream signals.26 A better understanding of the mechanisms of signal decoding could help us understand the wide range of functions that Notch plays a role in.
In this study, we first design and characterize a microfluidic display system capable of streaming six completely independent spatiotemporal signal trains to a surface with transition times in the order of seconds. The Notch response in a mouse myoblast cell model is then characterized for both dose and frequency response in a single step using hybridization chain reaction in fluorescence in situ hybridization (HCR-FISH). We test our experimental results with a mathematical model and find that signal dynamic plays an important role in Notch-mediated downstream gene expression.
Theory
Notch signaling and dynamics
Notch is a contact-dependent (i.e. juxtracrine) signaling pathway. In mammalian cells, Notch acts via five canonical ligands: delta-like ligand (DLL) 1, DLL3, DLL4, Jagged1, and Jagged2 and four receptors (Notch1–Notch4). In transactivation, the ligand of the sender cell will interact with the Notch receptor of the receiver cell. This binding leads to the receptor being cleaved by ADAM10 (A Disintegrin and Metalloproteinase 10) and gamma-secretase, which releases the Notch intracellular domain (NICD).20,27 The NICD translocates to the nucleus where it forms a complex with RBPJ-κ (Recombination Signal Binding Protein for Immunoglobulin Kappa-J) and MAML (Mastermind Like), promoting the transcription of target genes (Fig. 1a).20,27,28 | ||
| Fig. 1 Notch signaling pathway. (a) Dynamic ligand discrimination in the DLL–Notch1 axis of signaling. When DLL1 binds the Notch1 receptor, the pathway is activated in transient pulses, promoting the transcription of Hes1. When DLL4 instead binds Notch1, the pathway is activated in a sustained fashion, promoting the transcription of Hey1. (b) C2C12-ΔECD cells from Nandagopal et al. (2018).26 The truncated Notch1 extracellular domain results in NICD release, circumventing the necessity of ligand-binding for gamma-secretase cleavage to occur. The DAPT molecule is used as an inhibitor of gamma-secretase activity, thereby inhibiting NICD cleavage. | ||
Interestingly, the ligands interact promiscuously with the receptors, resulting in the intracellular release of a similar NICD. Yet, there is a wide range of cellular responses. Using engineered cell lines, a study has shown that distinct ligands can activate distinct genes through the same receptor. Specifically, DLL1 activated Notch1 in a pulsatile manner while DLL4 activated Notch1 in a sustained manner (Fig. 1a). These signaling dynamics resulted in expression of Hes1 for DLL1 and Hey1 for DLL4, resulting in opposite results in MyoD expression, a promoter of myogenesis. Indeed, the roles of Hes1 and Hey1 in myogenesis regulation are increasingly characterized, although their action mechanisms remain elusive. Hes1 overexpression in C2C12 cells does not appear to inhibit myogenesis.29 On the other hand, Hey1 expression inhibits myogenesis in the same cell line.30 In an in vivo experiment, Nandagopal et al. (2018) have found that the selective expression of Hes1 or Hey1 promoted or inhibited myogenesis in chicken embryos, respectively.26 These findings highlight the important role of Hes1 and Hey1 in myogenesis, and their ability to cause distinct phenotypes within the same cell line.
While previous experiments have shown that controlling directly the length of expression of the NICD resulted in distinct Hes1 vs. Hey1 regime, it remains unclear whether a series of pulse could specifically activate Hes1, and at which duty ratio the expression program would switch to Hey1. To begin to address this question, we used previously-generated C2C12 cells stably expressing the Notch1 receptor with a truncated extracellular domain (C2C12-ΔECD).26 In these cells, Notch1 receptor signaling is constitutively active and can be turned off via adding DAPT, a drug that inhibits gamma secretase-mediated cleavage. In this study, the C2C12-ΔECD cells were cultured by default in media containing 10 μM DAPT to inhibit NICD release from the truncated receptors. Notch signaling was therefore triggered inversely, by flowing in DAPT-free media with spatiotemporal precision using our microfluidics system (Fig. 1b). This approach permitted us to reveal how differences in dynamic Notch1 signaling lead to distinct biological responses.
Multipoles and microfluidic displays
We and others have previously developed a complete theory of 2D open-space microfluidics to describe flow and transport in open-space systems to enable function-driven design.17,18,31–33 Briefly, when the gap between the perpendicular channels' apertures and the treated surface is sufficiently small, a Hele-Shaw flow cell is formed at low Reynolds numbers (Fig. 2a).34 An analogy between the flow field and electrostatic fields can hence be formed. An aperture subject to an injection flow rate (Qinj) corresponds to a positive charge and an aperture subject to an aspiration flow rate (Qasp) to a negative charge, making openings under this framework microfluidic “poles”. Consequently, streamlines are mathematically analogous to electric field lines around charges in two-dimensional space, and the flow profile is fully determined analytically (Fig. 2b). Under this formalism, the MFP is a microfluidic dipole, while more than two apertures form a multipolar regime. If we define the ratio α = Qasp/Qinj, when α > 1, we observe hydrodynamic flow confinement in all regions of space where this criterion holds (Fig. 2c). To address the transport problem, the 2D convection–diffusion equation can and has been solved for the MFP.32 When using a multipolar configuration, complex representation of the flow profile may be applied, and conformal mapping is used to precisely describe the concentration profile in and around the confinement areas for any planar 2D flow geometries.35 | ||
| Fig. 2 Experimental set up and device configuration. (a) Schematics of microfluidic displays operation. Automated reagent flow through the device's channels is ensured by programmable syringe pumps. The gap (G) is 100 μm. (b) Theoretical streamlines at Qinj = 1 μL s−1. The ratio of aspiration flow rate and injection flow rate (α) is 1.5. (c) Experimental pattern formed by a fluorescein salt solution. The distance between the center of the aspiration channel and the center of an injection channel (r) is 1.15 mm. Scale bar = 500 μm. (d) Photograph of the 3D printed and assembled device. Scale bar = 1 cm. (e) Observed filmed transition times (ton) according to the injection flow rate Qinj and ratio α. No videos were filmed for α = 1.3, Qinj = 0.4 μL s−1. Error bars represent the standard deviation on different time measures. When no error bars are present, ton represent measures for a single video. | ||
Results and discussion
Design of the microfluidic display
We first sought to identify the optimal geometry to achieve precise spatiotemporal control of reagent delivery. The selected configuration is rotationally symmetric (hexagonal), forming a microfluidic “flower” pattern in which the reagent content of its six “petals” can be individually addressed with independent reagent doses and arbitrary stimulation frequencies (Fig. 2b and c). At the head of each petal is an injection aperture, and at the center is a shared aspiration aperture. The device has seven channels in total. This geometry minimizes the number of apertures by using the central aperture as a waste collector for all petals simultaneously, providing very steady and fast switching reagent delivery.The selection of design parameters, such as the height of the gap (G) between the microfluidic display and the surface, and the distance between an injection aperture and the aspiration aperture (r, for the petal radius) were set based on scaling laws and relations described previously (see also SI section I, Fig. S1 and S2, Table S1).18,32 The device was then conveniently fabricated using 3D printing (Fig. 2d).36 Fluid delivery to the microfluidic display is ensured by programmable syringe pumps.
Next, we experimentally validated the transition timescale between the “on” and “off” states of the device. This transition period refers to the time it takes for the fluid of a fully formed petal to be aspirated by the central aperture (Video S1). When Qinj and α increase, the transition time decreases.32 We gathered videos for different values of α (1.3, 1.5 and 2.0) and Qinj (0.4 μL s−1, 1.0 μL s−1, 2.0 μL s−1) and measured the difference between the frame showing the lowest fluorescence intensity and the frame showing the highest fluorescence intensity (FI) (Fig. 2e). The filming rates were of 1 frame per second. We confirm that transition time decreases with both Qinj and α. We find for α = 1.3 and Qinj = 0.4 μL s−1, the transition time is around 7 seconds, the highest transition time measured. This temporal resolution is superior to the switching resolution achieved by conventional automated liquid handlers and is ideal to study Notch pathway dynamics, where signaling effects occur on the timescale of minutes to hours.
Reagent delivery and cell viability
First, spatial control and inter-petal dosage were assessed by delivering DNA dye (Hoechst 33258) to C2C12 cells with the microfluidic display while keeping the reagent dose delivery constant for each petal (see SI, section II, Fig. S3a). The staining pattern created by the microfluidic display matched what was expected, showing negligible fluidic variability between experiments and no cross talk between petals (Fig. S3b). Moreover, only two statistically significant differences (petal 1–petal 6 and petal 3–petal 6) were found in the inter-petal comparison of fluorescence intensity (Fig. S3c). We next asked whether these two statistically significant differences were due to the use of the microfluidic display or whether they could be attributed to intrinsic differences in Hoechst staining. When comparing the FI between cells stained with our device and cells stained manually, we find no significative difference in the mean variance (Fig. S3d). Thus, we attribute the observed inter-petal differences in intensity to variability in Hoechst staining, which could be due to factors like difference in cell cycle progression (e.g., condensed DNA in mitotic cells have higher intensity) and cell size, rather than to variations in the dye concentrations delivered by our device.Second, we verified the linearity over time of reagent dose delivered by the microfluidic display. DNA dye was delivered to C2C12 cells in a pulsatile fashion. Inter-petal dosage varied according to different duty cycles (Fig. 3a), where the first petal (P1) received a continuous stream of dye, and the last petal (P6) received the smallest dosage. We found that fluorescence intensity linearly correlated with the dose of DNA dye delivered to each petal, which increased with duty cycle (Fig. 3b and c).
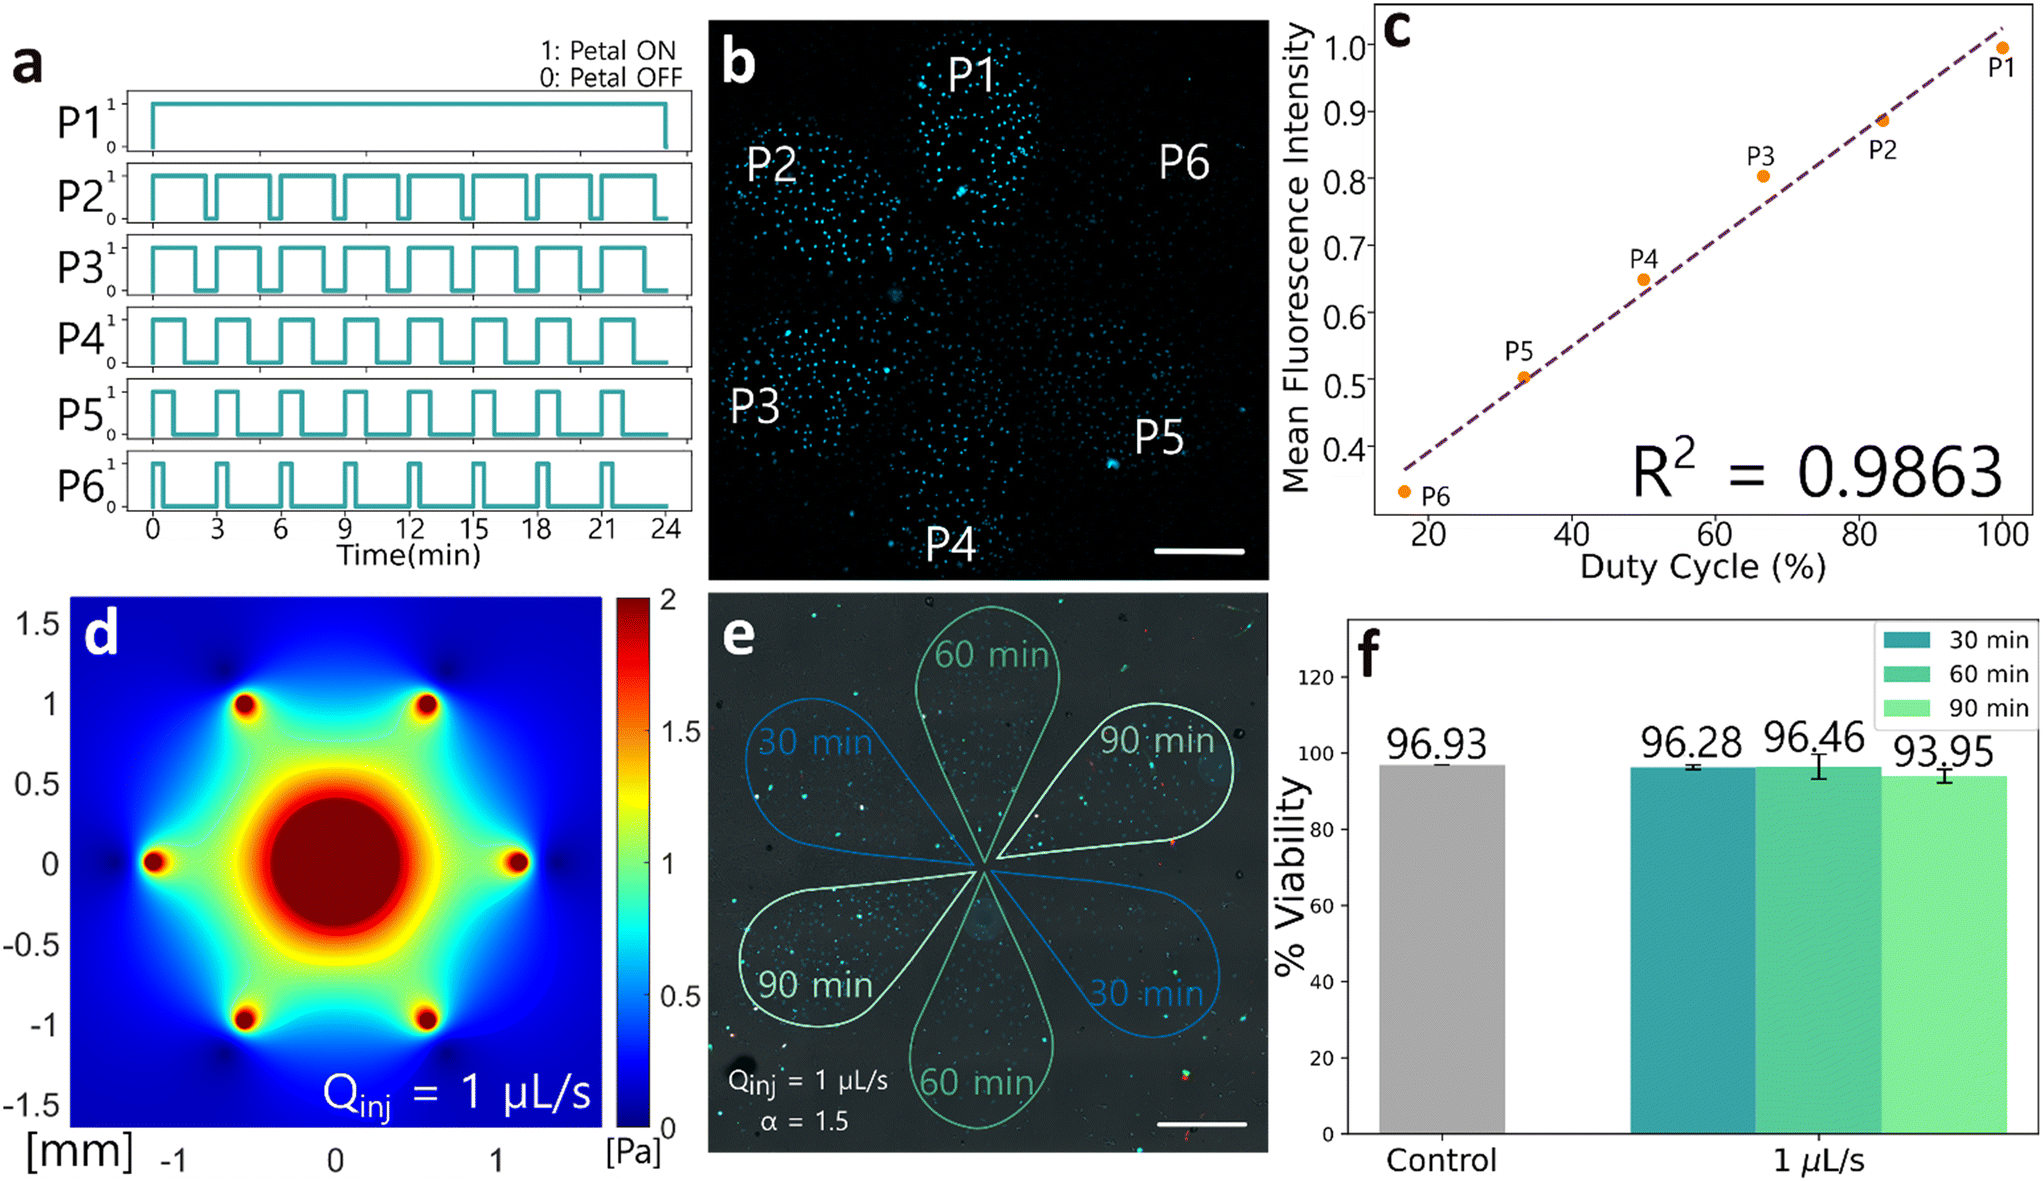 | ||
| Fig. 3 Microfluidic display validation in cell biology (a)–(c) DNA dye (Hoechst 33258) delivery to C2C12 cells. (a) Hoechst was administered at a frequency of 1 pulse every 3 minutes, with doses varying in duty cycles of 16.67%, 33.33%, 50.00%, 66.67%, 83.33% or 100%. Conditions are labelled according to petals (petal 1, P1–petal 6, P6). The petal is “ON” when the corresponding syringe pump is active and the petal is formed, exposing cells underneath to injection media with Hoechst. The petal is “OFF” when the syringe pump is inactive, and the petal is not formed. Qinj = 0.4 μL s−1, α = 1.5. (b) Fluorescence in C2C12 cells nuclei underneath corresponding petals. Scale bar = 500 μm. (c) Mean fluorescence intensity in each petal according to corresponding duty cycle. (d) Analytical shear stress map for an injection flow rate of 1 μL s−1, α = 1.5. (e) and (f) Viability assay on C2C12 cells. (e) The cells were exposed to continuous flow for periods of 30, 60 or 90 minutes at an injection rate of 1 μL s−1, α = 1.5. Injection media contains Hoechst 33258. Red nuclei represent dead cells marked with PI. Green cells show apoptotic cells marked by annexin V-FITC. Scale bar = 500 μm. (f) Cell viability according to exposition duration to a continuous flow. Control cells were placed in the same incubator, without exposition to the microfluidic display. Error bars represent standard error from biological duplicates. | ||
An important consideration when using microfluidic displays is that a continuous flow stream is required to maintain confinement areas, which induces shear forces. We aimed to maintain shear stress under 1 Pa to minimize impact on cell growth and viability.37 For an injection flow rate of 1 μL s−1, calculations from the theoretical model describing shear stress in a Hele-Shaw flow gives maximum forces of 1 Pa over 50% of the display area (Fig. 3d).32 We evaluated the resulting impact of using microfluidic displays on cell viability by exposing C2C12 cells to a continuous flow rate of 1 μL s−1 for durations up to 90 minutes. In each biological repeat, two petal duplicates were evaluated (Fig. 3e). Cell death was then measured with propidium iodide (PI) and early-stage apoptosis was detected with annexin V-FITC.38 Overall viability for cells not exposed to flow (96.93%) was similar to the viability of cells exposed to flow for 30 min (96.28%) and 60 min (96.46%) and decreased slightly for cells exposed to flow for 90 min (93.95%). For cells exposed to a 0.5 μL s−1 flow rate, viability rates remained high across all durations (see SI section III, Fig. S4). To prevent any cell viability decrease in C2C12 cells, a final operating injection flow rate of 0.4 μL s−1 and a α ratio of 1.3 were selected for our Notch dynamics investigations and therefore should not affect normal cell survival. We note that the criterion of keeping shear stress under 1 Pa should be adapted depending on the cell type. For instance, circulating malignant cells have been shown to demonstrate high viability under fluid shear stress compared to primary epithelial cells under flow rates of 250 μL s−1, which corresponds to a flow rate ≈100 times higher than the aspiration flow rate of our device.39 However, in stem cells, shear stress may more strongly affect their differentiation and viability.40 In this case, a compromise between high transition times and low shear stress should be reached.
Moreover, an injection flow rate of 0.4 μL s−1 corresponds to 1.4 mL of injection media consumed per hour, which is higher than volumes typically consumed in microfluidic devices. When working with expensive reagents, reagent consumption is a factor that should be taken into consideration when designing experiments with microfluidic displays, which still have the advantage of parallelization and automating manipulations. When critical, reagent consumption may be minimized by lowering the injection flow rate and increasing the α ratio.
Microfluidic display validation to study Notch signaling dynamics
Subsequently, we sought to validate the use of the microfluidic display to stimulate the Notch pathway chemically. We delivered DAPT-free injection media to C2C12-ΔECD cells for periods ranging from 30 minutes to 4 h with the microfluidic display, resulting in pulses of release of the NICD (Fig. 4a). To assess the impact of continuous flow on basal Hes1 and Hey1 expression, cells in the first petal (P1) were exposed to a continuous stream of media with 10 μM DAPT and compared to cells outside the active (P) regions of our display. After 4 h, the microfluidic display was removed from the treated well and cells were fixed for further processing. HCR-FISH was applied to quantify Hes1 and Hey1 mRNA expression in single cells,41,42 allowing visualization of individual mRNAs as fluorescent dots (Fig. 4b). We note that the extra fluorescence in the nuclei in the Hes1 channel is caused by spectral overlap with the H2B-mCherry reporter in C2C12-ΔECD cells. However, we calculated that the measured Hes1 signal is 2.5 standard deviation (σ) above the mean fluorescence intensity (FI) of the nuclei, which shows that the FI difference is great enough for accurate Hes1 quantification (see SI section IV, Table S2, Fig. S5 and S6 for further quantification of the mCherry signal). | ||
| Fig. 4 Microfluidic display validation for Notch signalling studies. (a) Notch activation of C2C12-ΔECD cells was ensured by delivering media without DAPT with the microfluidic display. Cells underneath each petal were exposed to DAPT removal pulses for durations ranging from 0 h (P1) to 4 h (P6). The petal is “ON” when the corresponding syringe pump is active and delivering injection media without (0 μM) DAPT. (b) Fluorescence micrographs of mRNA expression following 1 h (P3) and 4 h (P6) of Notch activation. Scale bar = 50 μm. *The mCherry reporter in C2C12-ΔECD cell construct bleeds through the Hes1 imaging channel, causing the nuclei to appear fluorescent. (c) and (d) Hes1 and Hey1 mRNA expression. Fold change is calculated over the mean of the No act. condition (P1). (e) Ratios of Hes1 and Hey1 mRNA expression fold change. N = 3, error bars represent SEM, *p < 0.05, **p < 0.01, ***p < 0.001. | ||
For both Hes1 and Hey1 expressions, no significant differences were found in mRNA dots counted from HCR-FISH for cells in P1 and cells similarly exposed to DAPT but without flow (see SI, section V, Fig. S7). Thus, the microfluidic display does not affect the basal expression of Hes1 and Hey1. For the six durations tested, Hes1 expression was the highest for 1 h of DAPT removal and decreased for longer durations (Fig. 4c). For Hey1, mRNA expression slowly increased with the duration of DAPT removal (Fig. 4d). While no statistically significant differences were found across Hes1 and Hey1 responses (p = 0.0528 and p = 0.0658 for Hes1 and Hey1 respectively, one-way ANOVA), these trends match those observed by Nandagopal et al. using the same cell line.26 Similarly to the previous study, we observed a lower fold-change in Hey1 expression compared to Hes1. These results demonstrate that microfluidic display and HCR-FISH in the same dish could replicate what was found previously using multiple well plates with RT-PCR.
Because Hes1 and Hey1 play different roles in cell differentiation and were previously shown to be responsive to different signal dynamics, we measured the ratio of Hey1/Hes1 fold change to determine if there is a regime where Hes1 and Hey1 are individually dominant.26,43–45 We found that indeed, mutually exclusive regimes of expression exist, and that a switch from Hes1 to Hey1 dominance occurs between 2 h and 3 h of activation (Fig. 4e). These results provide further evidence that Notch signaling temporal dynamics can have an impact on cell fate.26,46
Pulsatile activation of the Notch pathway
We next evaluated if a series of pulses could still activate Hes1 specifically, and at which duty ratio the gene expression would switch to Hey1 (Fig. 5a). We hypothesized that multiple pulses of NICD would still activate Hes1, and that when the pulses become close to each other (i.e. high duty cycle), Hey1 expression would increase. The Hes1/Hey1 gene circuit appears to be tuned to be responsive to pulses. However, at a certain point, pulses will be so rapid that they won't be distinguishable biologically from continuous activation. We therefore expect to see an optimum at certain frequencies. To investigate this possibility, DAPT-free media was delivered to C2C12-ΔECD cells with the microfluidic display in 15 min pulses with frequencies ranging from 0.75 pulses per h to 3 pulses per h (Fig. 5b). Cells were fixed at 4 h and Hes1 and Hey1 mRNA expression were assessed with HCR-FISH. | ||
| Fig. 5 Pulsatile activation of C2C12-ΔECD cells. (a) Pulsing the Notch1 pathway of C2C12-ΔECD cells with high frequencies should induce a regime switch in cells. (b) 15-Minute pulses of media without DAPT with frequencies ranging from 0.75 pulse per h to 3 pulses per h were delivered with the microfluidic display. Cells under P1 and P6 were respectively exposed to 10 μM DAPT and 0 μM DAPT. (c) and (d) Resulting Hes1 and Hey1 mRNA expression over the No act. (P1) condition. (e) Ratios of Hes1 and Hey1 mRNA expression fold change. N = 3, error bars represent SEM, *p < 0.05. | ||
Hes1 mRNA expression was strongly upregulated for all pulse trains (0.75 pulse per h to 3 pulses per h) (Fig. 5c). Surprisingly, even the highest pulse frequency (3 h−1) resulted in induction of Hes1. Hey1 mRNA expression increased with the duty cycle (Fig. 5d), as would be expected if Hes1 was sensitive to pulses and Hey1 to the length of the activation. One of the impacts of activating Notch with multiple and close-in-time pulses is that NICD levels remain higher, which may be making the Hey1 levels appear more homogeneous due to the slower response of Hey1 to signal inputs. While no statistically significant changes in mRNA fold changes were observed (p = 0.2063 for Hes1, p = 0.9293 for Hey1), when calculating the ratio of Hey1/Hes1 expression, we found the ratio started trending higher at 3 pulses per h and reached statistical significance for the continuous signal (Fig. 5e). Here, the changes in expression ratios are driven mostly by fluctuations in Hes1 expression, as Hey1 levels appear relatively constant for higher doses (P4–P6 in Fig. 5b). We note that the gene expression profile for Hes1 displays the same bell-shaped curve from Fig. 4c. While our results are consistent with the hypothesis and previously reported results26 that Hes1 is induced by pulses of NICD while Hey1 is responsive to sustained signals, we cannot however exclude the possibility that the total dose during that 4 h time window is the main driver of gene selectivity.
We next delivered DAPT-free media pulses with the same total duty cycle (1 h or 3 h) but delivered either in a single pulse or in multiple pulses (see SI, section VI, Fig. S8). We find no significant difference in Hes1 expression based on the Notch activation modality. Although Hey1 expression increases for 1 h distributed with multiple pulses, Hes1 remains the dominant gene expressed for this duty cycle. We additionally compared Hes1 and Hey1 mRNA expression for repeated conditions and duty cycles across all experiments and find no further statistically significant difference (see SI, section VI, Fig. S9). These results further support that Hes1 is upregulated by shorter duty cycles and pulsatile activation of Notch, while Hey1 expression increases with signal duration.
Modeling Notch-mediated Hes1 and Hey1 expression in C2C12-ΔECD cells
As the last step in our investigation, we developed a model of signaling dynamics, integrating interactions between NICD, Hes1 and Hey1 dynamics to investigate whether these interactions align with our experimental results. We first established a gene circuit describing the interactions of interest (Fig. 6a).47 We factored in the previously reported autorepression of Hes1 transcription, Hes1 repression of Hey1 transcription, and Hey1 repression of Hes1 transcription.48–50 Based on this network, a set of seven ordinary differential equations was established to describe the changes in Hes1 and Hey1 mRNA and protein expression according to different NICD inputs (see SI, section VII, for the equations and underlying assumptions, and Table S3 for the variables lists). The model parameters and their value were found in the literature or estimated from our experimental data (see SI, section VII, Table S4). The repression by Hes1 and Hey1 proteins were modeled as Hill functions.51 Moreover, we considered a basal transcription rate for Hes1 and Hey1 mRNA in the absence of NICD (kB and kD, see Table S5). Indeed, in our DAPT removal experiments, Hes1 and Hey1 mRNAs were observed in cells exposed to 10 μM DAPT (Fig. S10), allowing us to quantify baseline mRNA expression. Lastly, we considered transcriptional delay by differentiating between non-mature (nuclear) mRNA (hes/hey1n in Fig. 6a) and mature, functional mRNA (hes/hey1m in Fig. 6a). The initial calibration revealed that the model is relatively insensitive to the hill cooperativity coefficient within reported ranges52 and delays in transcription, amplitude-wise (data not shown). | ||
| Fig. 6 Model of Hes1 and Hey1 Notch1 induced expression in C2C12-ΔECD cells. (a) Network topology. n, m and p letters refer respectively to nuclear mRNA, mature mRNA, and protein. (b) mRNA and protein fold change for a continuous NICD signal (NICD = 1 ∀ t). mRNA expression fold change represents total mRNA (e.g. hes1n + hes1m) over the total mRNA concentration at equilibrium (initial condition hes1eq, see SI, section VIb). Protein expression fold change represents the number of protein (e.g. Hes1) over the concentration at equilibrium. Marks (x) represent experimental data points displayed in Fig. 4c and d. (c) Hey1/Hes1 fold change ratio of mRNA and protein expression for sustained activation. Marks (x) represent experimental data points displayed in Fig. 4e. | ||
With this reductionist approach, we found that Hes1 and Hey1 mRNA expression after continuous DAPT removal (DAPT = 0 ∀ t, t ∈ [0 h, 4 h]) match those we and others observed experimentally (Fig. 6b).26 Hes1 and Hey1 protein expression closely follows mRNA with a 30 minute delay, which falls within the range of previously reported delays for Hes1 expression.48 Moreover, when calculating the ratio of Hey1/Hes1 expression, we found that the ratio begins to increase after the 1 h time point and is higher after 2 h (Fig. 6c). This is consistent with our findings on the mutually exclusive expression of Hes1 and Hey1.
With the same circuit, we evaluated Hes1 and Hey1 mRNA expressions, following pulsatile DAPT removal at different frequencies (see SI, section VII, Fig. S11a). The Hes1 expression profile we obtained (Fig. S11b) does not correspond to the bell shape we observed experimentally at Fig. 6c, which is the only result that our model does not faithfully reproduce. Indeed, the modeled levels of Hes1 are lower as they rapidly converge towards the Hes1 levels at 4 h for the continuous activation. For Hey1, we found that pulsatile activation slightly increased expression (Fig. S11c), concurrent with our experimental results. For frequencies as low as one 15-minute DAPT removal pulse per hour, we observe Hes1 mRNA expression trends that match those of the continuous activation (see Fig. S12a). However, our experimental data show a prominent difference between the long single-pulsed and short multiple-pulsed signals. In our model, NICD half-life is the sole determinant between the “sustained” and “pulsatile” Notch activation regimes. Therefore, if the NICD half-life is close to the pulsing interval, the Hes1 curve will match the sustained activation curve (Fig. S12b). However, a short NICD half-life (e.g., 5 minutes) reduces Hes1 expression below our experimental observations and contradicts the reported NICD stability53 (Fig. S12c). This suggests that additional factors modulate the differential response to pulsatile vs. sustained Notch signaling. In Drosophila melanogaster (fruit flies), Notch-mediated transcription has been observed to be a highly dynamic and probabilistic process.54 This could affect the transcription dynamics of Hes1 and Hey1. Nonetheless, this simple regulatory network has been sufficient to recapitulate with accuracy the majority of the key mRNA expression trends we observed experimentally (Fig. 4c–e and 5d). Elucidating the kinetics and target-specific features of Notch-mediated transcription will be essential for refining such models.
Conclusions
In this work, we provide a framework for automated chemical stimulation of signaling pathways. Our tool enables the delivery of multiple independent treatments in a single culture dish for easy sample retrieval. Theory-guided design enabled the quick characterization and accurate prediction of confinement zones. The microfluidic display did not affect cell viability when exposed to continuous flows for up to 1.5 h and had no crosstalk between confinement areas despite fast switching rates of reagent (t < 7 s). A final injection flow rate of 0.4 μL s−1 and an aspiration to injection flow rate ratio of 1.3 were selected as operating parameters for Notch dynamics experiments, as they constituted a compromise between shear stress and increased temporal resolution.With the microfluidic display, we were able to reproduce and extend prior work showing dynamics-based signal discrimination.26 We found that both single pulses and series of pulses induced Hes1 expression, while Hey1 expression depended on the total dose of NICD during our experiment. We observed a mutually exclusive regime transition around a duty ratio of 50% during our 4 h experiments, where Hey1 expression would gradually increase and start to dominate for single pulses. For multiple short pulses of activation, Hey1 levels were more homogenous for duty cycles >50%. To further confirm that signal dynamics, and not total dose of NICD is the main driver of gene targets selectivity, future experiments could attempt to transform a Hey1 dominant signal (4 h continuous), into a Hes1 dominant signal while keeping the total dose constant (e.g. 4 × 1 h pulse separated by 3 h). In this paper, we focused on testing different signal frequencies and duty cycles while keeping the timing of pulses constant in each figure. The choice of synchronizing the pulse at the beginning of the cycle rather than at the end may have had an impact on the level of Hes1 observed for highly spaced-out stimulations (e.g. P2 and P3 in Fig. 5b) as the Hes1 gene is known to peak around 1 h after stimulation.26
The methodology provided in this study is compatible with microscopy and single-cell analysis. It could also be used with most live-imaging techniques. Potential challenges would include keeping cells at constant temperature, accounting for the fact that the presence of the display prevents transmitted light imaging, and stabilizing pH within the culture. By using an incubator mounted on an epifluorescence microscope as we did, we believe these challenges could be addressed in a straightforward manner.
One advantage of the “flower” configuration is the independent control of each injection channel with a minimum number of apertures, allowing us to test 6 conditions at once, and the fast-switching rates between “on” and “off” states. However, microfluidic displays have the potential to be highly multiplexed, expanding the number of dynamic conditions tested on a single surface to the hundreds. Notably, we have previously designed a 3D printed microfluidic display capable of confining fluids in up to 144 independent areas where switching between reagents was achieved with external valves and manifolds.55 The on-chip integration of those components to the microfluidic displays will rally both the advanced time-resolution and the multiplex configuration required in fluid handling to study cell signaling dynamics. Integrated microfluidic display fabrication should be facilitated by the advance of ultra-high resolution 3D printing. Here, with a simple six-condition microfluidic display, we were able to perform dynamic stimulation of the Notch pathway in a highly compact and automated manner. Moreover, microfluidic probes have been thoroughly designed to achieve local FISH visualization on cell monolayers56 and tissue sections,57,58 significantly improving FISH probes incubation time due to constant perfusion. While HCR-FISH was executed with traditional pipetting methods in this study, open-space microfluidics tools can be applied for extensive FISH methods and have the potential to automate fluid handling, from cell stimulation to assessing cell response.
Finally, targeting the dynamics of signaling networks has been identified as the next frontier in pharmacological treatment in Notch and other pathways.59 Microfluidic displays are conveniently compatible for integration in a drug testing workflow. By enabling the automated and multiplexed chemical stimulation of cells, microfluidic displays hold promises for advancing fundamental discoveries in signaling dynamics eventually leading to applications in drug development.
Experimental
Microfluidic displays design and fabrication
Displays were modeled by computer aided design in CATIA V5 (Dassault Systèmes) and fabricated by stereolithography (SLA) 3D printing on the Asiga PICO2HD 27 printer with Pro3dure GR-1 black resin (Proto Products) for imaging. 0.06″ Tygon ND-100-80 tubes (United States Plastic Corporation, Lima, USA) were assembled on the device with a UV sensitive resin (DecorRom). The procedure is described thoroughly in Brimmo et al.36 The stl file is available in the SI.Device operation
The flow-through of microfluidic display channels was controlled by Nemesys syringe pumps (Cetoni GmbH) using a custom LabView program. For long duration experiments (i.e. multiples hours), an alternating two-pumps system was used along with a switching valve, in order to continuously aspirate waste media. Thus, when the first aspiration syringe is full, the valve is actioned to switch canal, and the syringe is now pushed to be emptied in the waste collector. Simultaneously, the second syringe begins to aspirate the waste media.Theoretical flow lines, shear stress and Reynold's number maps
Streamline maps were generated analytically by applying the source superposition principle to the flow profile solution for the microfluidic dipole.18,32 Shear stress and Reynold's number maps were calculated for a Hele-Shaw flow as described in Safavieh et al.32 Heatmaps and flow profiles were generated in Matlab R2023a (Mathworks).Quantifying transition time
Flow visualization was ensured using 1 μg ml−1 fluorescein salt (Sigma-Aldrich) diluted in dH2O. The microfluidic display was immersed in dH2O in 35 mm Petri dishes with a 14 mm, 1.5 glass coverslip (Mattek). Videos were recorded in fluorescence microscopy (excitation channel: 469 nm) with a Zeiss Axio Observer inverted microscope, in the Zen Pro software with the ORCA-Flash 4.0 camera (Hamamatsu). Transition times were measured from the video frames between the lowest and highest fluorescence intensity.Cell culture and handling
C2C12 and C2C12-ΔN1ECD (C2C12 + pb-CMV-TO-hN1DECD-T2A-H2B-mCherry26) cells were generously provided by Michael Elowitz (California Institute of Technology). C2C12 cells were cultured in DMEM (Sigma-Aldrich) complemented with 20% FBS (Sigma-Aldrich). C2C12-ΔN1ECD cells were cultured in DMEM with 20% FBS, 10 μM DAPT (Thermo Scientific Chemicals), 300 μg mL−1 Hygromycin B Gold (Invivogen). Cells were thawed in media 1 week prior to their use for experiments and grown in an incubator at 37 °C with 5% CO2. They were passaged every 2–3 days at ∼80% confluency with trypsin-EDTA (Sigma-Aldrich).Microfluidic display operation for cells
The day prior to experiments, cells were seeded with complete media in #1.5 glass bottom 6-well plates (Mattek), previously coated with 5 μg ml−1 bovine plasma fibronectin (Sigma-Aldrich), to reach 80–100% confluency. Microfluidic displays and tubing were soaked in 70% EtOH for 1 h then dried to prevent contamination. Prior to use, reagents were pre-heated to 40 °C and channels were flushed with 70% EtOH to avoid bubble nucleation, then rinsed with PBS. The microfluidic display was operated in a Zeiss Axio Observer microscope in the incubation chamber at 37 °C. Culture media was swapped with imaging media, consisting of reconstituted DMEM without sodium bicarbonate (Sigma-Aldrich), 2% FBS, 25 mM HEPES (Sigma-Aldrich), 1% penicillin/streptomycin (Fisher Scientific). This imaging media was also the base for the injection media in which of 0.1 μg ml−1 fluorescein salt was added for flow visualization.DNA staining assays
Injection media supplemented with 2 mg ml−1 Hoechst 33258 (Fisher Scientific) was delivered to C2C12 cells with the microfluidic display. To quantify spatial control and inter-petal dosage, cells were exposed to Hoechst 33258 for 20 min with the microfluidic display (Fig. S3a). A 35 mm, 1.5 glass bottom Petri dish (MatTek) of cells was stained manually with 2 mg ml−1 Hoechst 33258, and cells in 18 randomly selected regions were imaged to assess intrinsic variability in fluorescence intensities following Hoechst staining (Fig. S3d). Cells were imaged directly after using fluorescence microscopy with the Zeiss Axio Observer with a 5× objective in fluorescence microscopy (excitation channel: 385 nm). Images were stitched in the Zen pro software. The experiments at Fig. 3 and S3d were done in triplicates.Quantification of cell fluorescence
Cell nuclei were segmented with a Matlab Watershed algorithm. The number of cells per petal and their corresponding intensity in a defined area was extracted, excluding fluorescence-saturated cells. To assess inter-petal variability (Fig. S3a–c), the mean of the FI per petal was first calculated:
The overall mean intensity across all petals was then calculated:

The mean fluorescence intensity per petal (Meanpetal) was normalized with respect to the mean fluorescence intensity across the 6 petals (Mean6petal) (Fig. S3b). For the pooled comparison with the manually stained cells (Fig. S3d), each mean was also centered around 0:

Fluorescence intensity for varying-dose experiments (Fig. 3a–c) were normalized with respect to the mean fluorescence intensity of cells underneath P1.
Viability assays
Injection media supplemented with 0.5 μg ml−1 Hoechst 33258 was delivered to C2C12 cells with the microfluidic display for 3 selected durations (30 min, 60 min, 90 min). Two petals were used for each duration. After 90 min, cells were incubated at 37 °C for 45 minutes. They were then stained for 15 minutes with 10 μg mL−1 propidium iodide (PI) (Sigma-Aldrich) and annexin V-FITC (20 μL per 100 μL buffer, Biotium). Cells were imaged using fluorescence microscopy with the Zeiss Axio Observer with a 5× objective (excitation channels: 385 nm, 469 nm, 555 nm for imaging Hoechst, FITC and PI, respectively).Viability quantification
Cells were counted using a Matlab Watershed algorithm according to Hoechst 33258 signal. Early apoptotic (green channel) and dead (red channel) cells were identified manually and considered dead. Cellular viability was assessed by:
Notch dynamic activation
C2C12-ΔN1ECD cells were seeded at a concentration of 300![[thin space (1/6-em)]](https://www.rsc.org/images/entities/char_2009.gif) 000 cells per well in a 6-well plate with a 14 mm, #1.5 glass coverslip (MatTek) between passages 3 and 7 after thawing to ensure high-quality imaging. Culture media was swapped with imaging media supplemented with 10 μM DAPT. Injection media (0 μM DAPT) supplemented with 0.1 μg mL−1 fluorescein salt was delivered to cells for the desired Notch activation duration with the microfluidic display. Here, fluorescein salt was used to ensure flow visualization and record the petals positions on the microscope stage. Cells in petal 1 were exposed to control media (injection media supplemented with 10 μM DAPT) for the duration of the experiment. Cells were fixed with fresh 4% formaldehyde diluted in PBS and permeabilized overnight at −20 °C in 70% ethanol.
000 cells per well in a 6-well plate with a 14 mm, #1.5 glass coverslip (MatTek) between passages 3 and 7 after thawing to ensure high-quality imaging. Culture media was swapped with imaging media supplemented with 10 μM DAPT. Injection media (0 μM DAPT) supplemented with 0.1 μg mL−1 fluorescein salt was delivered to cells for the desired Notch activation duration with the microfluidic display. Here, fluorescein salt was used to ensure flow visualization and record the petals positions on the microscope stage. Cells in petal 1 were exposed to control media (injection media supplemented with 10 μM DAPT) for the duration of the experiment. Cells were fixed with fresh 4% formaldehyde diluted in PBS and permeabilized overnight at −20 °C in 70% ethanol.
HCR-FISH
DNA probes (50 pmol) were obtained from Integrated DNA Technologies and resuspended in 50 μL H2O to make a 1 μM stock. HCR-FISH was performed according to Molecular Instruments' protocol (HCR RNA-FISH protocol for mammalian cells on a chambered slide). Briefly, after fixation, cells are incubated overnight with probe sets specific to the target RNAs. Metastable fluorescent HCR hairpins are after incubated with the probes. These bind to an initiator sequence on the probe, leading to fluorescence amplification. 16 nM of probe was used and incubated with amplifiers for 50 minutes to ensure single molecule detection.mRNA imaging
C2C12-ΔN1ECD cells were imaged with a Zeiss Axio Observer using Zen Pro software and a 63×, 1.4 numerical aperture objective immersed in oil with a ORCA-Flash 4.0 camera (Hamamatsu). mRNA was imaged by collecting z-stacks (0.29 μm thickness). Hes1 fluorescence was imaged at 555 nm with 85.0% light intensity and 200 ms exposition time. Hey1 fluorescence was imaged at 630 nm with a 40.0% light intensity for 300 ms.Hes1 and Hey1 mRNA quantification
mRNA quantification was done using a Matlab (Mathworks) algorithm. Cells were segmented manually and an intensity threshold for each channel was set to count mRNA fluorescent dots. mRNA dots for Hes1 and Hey1 were counted for each cell. For Hes1 mRNA quantification, if the mCherry signal in the nuclei was saturated and impaired the mRNA count, the cell was disregarded.Signal-to-noise ratio in the Hes1 channel
The mean dot fluorescence intensity was calculated in a representative sample of our Hes1 fluorescence micrographs with a custom Matlab code that applied a mask to the dots detected by the dot counting algorithm (see previous section). The mean nuclei intensity, standard deviation and maximum intensity were calculated in ImageJ. The z-score (number of standard deviations above mean) of our detected signal above the noise threshold was used to determine the likelihood of a false positive:where Idots is the mean dots fluorescence intensity, Inuclei is the mean nuclei fluorescence intensity and σ is the mean intensity standard deviation in the nuclei. A z-score above 2 corresponds to 0.95 confidence.

Notch signaling model
The Notch signaling model was developed as described in SI, section VII. Ordinary differential equations were solved in Matlab R2023a using the ODE45 solver.Statistical analysis
Across all statistical tests, a significant difference was found when the pvalue was inferior to 0.05.To assess the difference in fluorescence intensity between petals (Fig. S3b), the mean of each petal for a single DNA staining experiment, was compared with a student t-test. The difference in variance between the control and the petals was also assessed (Fig. S3d). The distribution for six petals from three different experiments was pooled, and the variance of the group was compared to the distribution for the 18 selected regions of the control. A Fisher's variance equality test was used.
Notch activation experiments in C2C12-ΔECD cells were done in triplicates. First, the mean mRNA dot count for the control condition (cells under P1) is calculated:

For each cell, in each condition, the mRNA dot count was then divided by MeanP1 to obtain the expression fold change. The mean fold change per condition is then calculated:

The normalization over the control is used to compare mRNA expression across experiments, but also to account for unspecific binding of FISH probes. Finally, the mean for the experimental triplicates was calculated:

To evaluate the ratios of expression, the MeanCondition was used. For each experiment, the ratio was calculated as:

To assess the significative difference between ratios, a one-way ANOVA test was used, followed by post hoc honestly significative difference.
Author contributions
Conceptualization: M. P., P. C.-R., L. P.-T., A. P., T. G.; methodology: M. P., P. C.-R.; software: M. P., P. C.-R. L. P.-T.; validation: M. P., P. C.-R.; formal analysis: M. P., P. C.-R.; investigation: M. P., P. C.-R.; resources: A. P., L. P.-T., T. G.; data curation: M. P., P. C.-R., T. G.; writing – original draft: M. P., writing – review and editing: M. P., P. C.-R., L. P.-T., A. P., T. G.; visualization: M. P., supervision: L. P.-T., A. P., T. G.; project administration: M. P., P. C.-R., L. P.-T., A. P., T. G.; funding acquisition: L. P.-T., T. G.Conflicts of interest
There are no conflicts to declare.Data availability
Supplementary information is available. See DOI: https://doi.org/10.1039/D5LC00521C.Data sets for experiments at Fig. 3–5 are available at: https://doi.org/10.5683/SP3/IDYAB9. The mRNA counting algorithm is available at https://github.com/laurentpotvin/dot-counting-gui.
Acknowledgements
M. P. and P. C.-R. acknowledge a graduate fellowship from the National Sciences and Engineering Research Council of Canada (NSERC). P. C.-R. acknowledges a graduate fellowship from the Fonds de Recherche du Québec, Nature et Technologies sector (FRQ). L. P.-T. and T. G. acknowledge funding from the FRQ, “Projet de recherche en équipe” program (https://doi.org/10.69777/284621). We thank Sandy Nandagopal for his advice and useful discussions on Notch dynamics and Michael Elowitz at the California Institute of Technology for the cell line courtesy. The graphical abstract was created with Biorender (Graphical Abstract, ID: https://BioRender.com/3ns2n8m).Notes and references
- J. E. Purvis and G. Lahav, Cell, 2013, 152, 945–956 CrossRef CAS PubMed.
- K. F. Sonnen and C. Y. Janda, Biochem. J., 2021, 478, 4045–4070 CrossRef CAS PubMed.
- P. Li and M. B. Elowitz, Development, 2019, 146, dev170977 CrossRef CAS PubMed.
- J. E. Purvis, K. W. Karhohs, C. Mock, E. Batchelor, A. Loewer and G. Lahav, Science, 2012, 336, 1440–1444 CrossRef CAS PubMed.
- E. Batchelor, A. Loewer, C. Mock and G. Lahav, Mol. Syst. Biol., 2011, 7, 488 CrossRef PubMed.
- D. E. Nelson, A. E. C. Ihekwaba, M. Elliott, J. R. Johnson, C. A. Gibney, B. E. Foreman, G. Nelson, V. See, C. A. Horton, D. G. Spiller, S. W. Edwards, H. P. McDowell, J. F. Unitt, E. Sullivan, R. Grimley, N. Benson, D. Broomhead, D. B. Kell and M. R. H. White, Science, 2004, 306, 704–708 CrossRef CAS PubMed.
- A. Hoffmann, A. Levchenko, M. L. Scott and D. Baltimore, Science, 2002, 298, 1241–1245 CrossRef CAS PubMed.
- S. D. M. Santos, P. J. Verveer and P. I. H. Bastiaens, Nat. Cell Biol., 2007, 9, 324–330 CrossRef CAS PubMed.
- J. G. Albeck, G. B. Mills and J. S. Brugge, Mol. Cell, 2013, 49, 249–261 CrossRef CAS PubMed.
- S. Jeknić, T. Kudo and M. W. Covert, Front. Immunol., 2019, 10, 755 CrossRef PubMed.
- H. Kitano, Science, 2002, 295, 1662–1664 CrossRef CAS PubMed.
- K. F. Sonnen, V. M. Lauschke, J. Uraji, H. J. Falk, Y. Petersen, M. C. Funk, M. Beaupeux, P. François, C. A. Merten and A. Aulehla, Cell, 2018, 172, 1079–1090.e12 CrossRef CAS PubMed.
- R. A. Kellogg, R. Gómez-Sjöberg, A. A. Leyrat and S. Tay, Nat. Protoc., 2014, 9, 1713–1726 CrossRef CAS PubMed.
- M. Heltberg, R. A. Kellogg, S. Krishna, S. Tay and M. H. Jensen, Cell Syst., 2016, 3, 532–539.e3 CrossRef CAS PubMed.
- C. Zhang, H.-L. Tu, G. Jia, T. Mukhtar, V. Taylor, A. Rzhetsky and S. Tay, Sci. Adv., 2019, 5, eaav7959 CrossRef CAS PubMed.
- G. V. Kaigala, R. D. Lovchik and E. Delamarche, Angew. Chem., Int. Ed., 2012, 51, 11224–11240 CrossRef CAS PubMed.
- D. Juncker, H. Schmid and E. Delamarche, Nat. Mater., 2005, 4, 622–628 CrossRef CAS PubMed.
- P.-A. Goyette, É. Boulais, F. Normandeau, G. Laberge, D. Juncker and T. Gervais, Nat. Commun., 2019, 10, 1781 CrossRef PubMed.
- D. Dorrigiv, P.-A. Goyette, A. St-Georges-Robillard, A.-M. Mes-Masson and T. Gervais, Cancers, 2023, 15, 1060 CrossRef CAS PubMed.
- S. J. Bray, Nat. Rev. Mol. Cell Biol., 2016, 17, 722–735 CrossRef CAS PubMed.
- B. Zhou, W. Lin, Y. Long, Y. Yang, H. Zhang, K. Wu and Q. Chu, Signal Transduction Targeted Ther., 2022, 7, 1–33 CrossRef PubMed.
- P. O. Valls and A. Esposito, Curr. Opin. Cell Biol., 2022, 75, 102066 CrossRef CAS PubMed.
- S. Majumder, J. S. Crabtree, T. E. Golde, L. M. Minter, B. A. Osborne and L. Miele, Nat. Rev. Drug Discovery, 2021, 20, 125–144 CrossRef CAS PubMed.
- H. Hirata, Y. Bessho, H. Kokubu, Y. Masamizu, S. Yamada, J. Lewis and R. Kageyama, Nat. Genet., 2004, 36, 750–754 CrossRef CAS PubMed.
- S. Gioftsidi, F. Relaix and P. Mourikis, Skeletal Muscle, 2022, 12, 9 CrossRef CAS PubMed.
- N. Nandagopal, L. A. Santat, L. LeBon, D. Sprinzak, M. E. Bronner and M. B. Elowitz, Cell, 2018, 172, 869–880.e19 CrossRef CAS PubMed.
- D. Sprinzak and S. C. Blacklow, in Annual Review of Biophysics, ed. K. A. Dill, Annual Reviews, Palo Alto, 2021, vol. 50, pp. 157–189 Search PubMed.
- S. Bray and F. Bernard, in Current Topics in Developmental Biology, ed. R. Kopan, Academic Press, 2010, vol. 92, pp. 253–275 Search PubMed.
- M. F. Buas, S. Kabak and T. Kadesch, J. Cell. Physiol., 2009, 218, 84–93 CrossRef CAS PubMed.
- M. F. Buas, S. Kabak and T. Kadesch, J. Biol. Chem., 2010, 285, 1249–1258 CrossRef CAS PubMed.
- M. A. Qasaimeh, T. Gervais and D. Juncker, Nat. Commun., 2011, 2, 464 CrossRef PubMed.
- M. Safavieh, M. A. Qasaimeh, A. Vakil, D. Juncker and T. Gervais, Sci. Rep., 2015, 5, 11943 CrossRef CAS PubMed.
- E. Boulais and T. Gervais, Lab Chip, 2023, 23, 1967–1980 RSC.
- H. S. Hele-Shaw, Nature, 1898, 58, 34–36 CrossRef.
- E. Boulais and T. Gervais, Phys. Fluids, 2020, 32, 122001 CrossRef CAS.
- A. Brimmo, P.-A. Goyette, R. Alnemari, T. Gervais and M. A. Qasaimeh, Sci. Rep., 2018, 8, 10995 CrossRef PubMed.
- E. W. K. Young and C. A. Simmons, Lab Chip, 2009, 10, 143–160 RSC.
- G. Zhang, V. Gurtu, S. R. Kain and G. Yan, BioTechniques, 1997, 23, 525–531 CrossRef CAS PubMed.
- J. M. Barnes, J. T. Nauseef and M. D. Henry, PLoS One, 2012, 7, e50973 CrossRef PubMed.
- Y. Huang, J.-Y. Qian, H. Cheng and X.-M. Li, World J. Stem Cells, 2021, 13, 894–913 CrossRef PubMed.
- H. M. T. Choi, M. Schwarzkopf, M. E. Fornace, A. Acharya, G. Artavanis, J. Stegmaier, A. Cunha and N. A. Pierce, Development, 2018, 145, dev165753 CrossRef PubMed.
- H. M. T. Choi, V. A. Beck and N. A. Pierce, ACS Nano, 2014, 8, 4284–4294 CrossRef CAS PubMed.
- M. F. Buas, S. Kabak and T. Kadesch, J. Biol. Chem., 2010, 285, 1249–1258 CrossRef CAS PubMed.
- C. Shawber, D. Nofziger, J. J.-D. Hsieh, C. Lindsell, O. Bögler, D. Hayward and G. Weinmaster, Development, 1996, 122, 3765–3773 CrossRef CAS PubMed.
- Y. Noguchi, M. Nakamura, N. Hino, J. Nogami, S. Tsuji, T. Sato, L. Zhang, K. Tsujikawa, T. Tanaka, K. Izawa, Y. Okada, T. Doi, H. Kokubo, A. Harada, A. Uezumi, M. Gessler, Y. Ohkawa and S. Fukada, Development, 2019, 146, dev163618 CrossRef CAS PubMed.
- Y. Harada, M. Yamada, I. Imayoshi, R. Kageyama, Y. Suzuki, T. Kuniya, S. Furutachi, D. Kawaguchi and Y. Gotoh, Nat. Commun., 2021, 12, 6562 CrossRef CAS PubMed.
- G. McCallum and L. Potvin-Trottier, in Synthetic Gene Circuits: Methods and Protocols, ed. F. Menolascina, Springer US, New York, NY, 2021, pp. 91–118 Search PubMed.
- H. Hirata, S. Yoshiura, T. Ohtsuka, Y. Bessho, T. Harada, K. Yoshikawa and R. Kageyama, Science, 2002, 298, 840–843 CrossRef CAS PubMed.
- J. Heisig, D. Weber, E. Englberger, A. Winkler, S. Kneitz, W.-K. Sung, E. Wolf, M. Eilers, C.-L. Wei and M. Gessler, PLoS Genet., 2012, 8, e1002728 CrossRef CAS PubMed.
- A. Fischer and M. Gessler, Nucleic Acids Res., 2007, 35, 4583–4596 CrossRef CAS PubMed.
- U. Alon, An Introduction to Systems Biology: Design Principles of Biological Circuits, Chapman and Hall/CRC, Boca Raton, 2nd edn, 2019 Search PubMed.
- S. Bernard, B. Čajavec, L. Pujo-Menjouet, M. C. Mackey and H. Herzel, Philos. Trans. R. Soc., A, 2006, 364, 1155–1170 CrossRef CAS PubMed.
- Z. Luo, L. Mu, Y. Zheng, W. Shen, J. Li, L. Xu, B. Zhong, Y. Liu and Y. Zhou, J. Mol. Cell Biol., 2020, 12, 345–358 CrossRef CAS PubMed.
- F. J. DeHaro-Arbona, C. Roussos, S. Baloul, J. Townson, M. J. Gómez Lamarca and S. Bray, eLife, 2024, 12, RP92083 CrossRef PubMed.
- P.-A. Goyette, É. Boulais, M. Tremblay and T. Gervais, Proc. Natl. Acad. Sci. U. S. A., 2021, 118, e2019248118 CrossRef CAS PubMed.
- D. Huber, J. Autebert and G. V. Kaigala, Biomed. Microdevices, 2016, 18, 40 CrossRef CAS PubMed.
- D. Huber and G. V. Kaigala, Biomicrofluidics, 2018, 12, 042212 CrossRef CAS PubMed.
- L. Voith von Voithenberg, A. Fomitcheva Khartchenko, D. Huber, P. Schraml and G. V. Kaigala, Nucleic Acids Res., 2020, 48, e17 CrossRef PubMed.
- M. Behar, D. Barken, S. L. Werner and A. Hoffmann, Cell, 2013, 155, 448–461 CrossRef CAS PubMed.
| This journal is © The Royal Society of Chemistry 2025 |