
 Open Access Article
 This Open Access Article is licensed under a Creative Commons Attribution-Non Commercial 3.0 Unported Licence
Bioselective agglutination induced nanoscale deterministic lateral displacement†
Kuan Yu
Hsieh
abc,
Joshua T.
Smith
 a,
Sung-Cheol
Kim
e,
Stacey M.
Gifford
a,
Michael
Pereira
a,
Guan-Yu
Chen
*bcdf and
Benjamin H.
Wunsch
*a
a,
Sung-Cheol
Kim
e,
Stacey M.
Gifford
a,
Michael
Pereira
a,
Guan-Yu
Chen
*bcdf and
Benjamin H.
Wunsch
*a
aIBM T.J. Watson Research Center, 1101 Kitchawan Road, Yorktown Heights, Yorktown, NY 10598, USA. E-mail: bhwunsch@us.ibm.com
bDepartment of Electrical and Computer Engineering, College of Electrical and Computer Engineering, National Yang Ming Chiao Tung University, Hsinchu 30010, Taiwan. E-mail: guanyu@nycu.edu.tw
cInstitute of Biomedical Engineering, College of Electrical and Computer Engineering, National Yang Ming Chiao Tung University, Hsinchu 30010, Taiwan
dDepartment of Biological Science and Technology, National Yang Ming Chiao Tung University, Hsinchu 30010, Taiwan
eFactory Mutual Insurance Co., 270 Central Avenue, Johnston, RI 02919, USA
fCenter for Intelligent Drug Systems and Smart Bio-devices (IDS2B), National Yang Ming Chiao Tung University, Hsinchu, 300093, Taiwan
First published on 1st April 2025
Abstract
Nanoscale deterministic lateral displacement (nanoDLD) is a microfluidic-based size separation technique allowing separation of subcellular biological particles such as double-stranded DNA and extracellular vesicles. Although there has been extensive study of the separation mechanism, across several applications, a systematic study of migration angle shift due to aggregation has not been done. A bead-based immunoassay is developed to aggregate and separate in the presence of a target protein. The results show that the system effectively separates particles, shows bioselectivity, and allows for the detection of target proteins. We demonstrate the agglutination model can be used to explain the migration angle of the aggregation process as a function of antibody and antigen concentrations.
1. Introduction
Deterministic lateral displacement (DLD) is a microfluidic-based size separation technique in which a periodic array of pillar steers the passage of flowing particles, translocating particles larger than a critical threshold to the edges of the array.1 The critical cutoff can be engineered through the pillar array geometry, in particular the periodicity, which alters the flow paths, and ultimately the trajectories, particles take through the array. In practice size separation of particles is not binary; numerous effects control both the displacement onset and particle trajectory distribution within the array.2,3 DLD has predominately found use at the microscale for cellular level separation, with significant advances in device modality, resolution, and theory of operation.4–10 The technology has been scaled-down and proven at mesoscopic (<500 nm) feature sizes, termed nanoscale deterministic lateral displacement (nanoDLD), allowing separation of colloids including sub-cellular biological particles such as double stranded DNA and extracellular vesicles.11–13 Separation of biological colloids is a key driver for nanoDLD, where it can be used both for in situ analytical assays and preparative applications.Despite its wide applicability in life sciences and materials nanotechnology, DLD lacks chemical specificity – it is essentially a mechanical-based method where selectivity is determined by size, morphology and viscoelasticity.14 Under controlled conditions surface charge can induce separation by modifying pillar/particle interactions to create a virtual gap size; improving sensitivity and resolution of separation and detection.15–17 Several groups have shown electrodynamic-actuated arrays can induce dielectrophoresis to increase sensitivity and allow tunable DLD.18–22 These electrokinetic techniques expand the range of particle properties that can be used to effect separation. However, mechanical and electrokinetic factors cannot fully distinguish more complicated colloid mixtures, in which the size, shape and surface charge densities do not sufficiently distinguish species.23 What is needed is DLD with biochemical specificity to allow targeted separation of species, while maintaining its operational advantages of continuous flow and controlled design.
This is relevant to current challenges in extracellular vesicle (EV) separation, in which particle populations can have similar size and charge distributions but contain sub-populations with different surface species compositions.24–26 Gaillard et al. demonstrated a method of capturing subpopulations of EVs using aptamers bound to microbeads, with DLD serving to isolate the beads from non-target EV populations.27 Zeming et al. developed a detection technique in which vesicle-adhesion modified the apparent size of microbeads, allowing sensitive detection of vesicle concentration.15 Zhang et al. has developed magnetic DLD devices for antibody recognition and separation in an antiobody mixture solutions.28 Although these approaches are effective, we asked whether if an inherent population of particles, without additional carriers, can induce a displacement of a sub-population target based on a surface chemical/biochemical marker, by triggering a size change that utilizes the marker. Aggregation is a simple mechanism whereby the binding of similar-marked particles into a single, larger cluster can shift the displacement from zigzag to bump mode, allowing separation based on a biological target (Fig. 1a and b).
 | ||
| Fig. 1 (a) Illustration of bead-based immunoassay. When antibody-coated particles (Ab-beads) react with the target protein, they form clusters of Ab-beads complex or aggregates. (b) Schematics of deterministic lateral displacement (DLD). Particles are separated based on size as they navigate through the array along the flow direction. The configuration features pillars with a diameter of D0 placed at intervals of Dx, creating gaps, G. The vertical spacing between rows is given by Dy, and there's a lateral shift (δ) between each row. After N rows, the arrangement returns to the initial position, leading to a row-shift fraction, ε = δ/Dx = 1/N. Particles smaller than the Dc follow a zigzag trajectory, while particles larger than DC follow a bump trajectory. (c) Schematic illustration of the chip layout. An on-chip particle condenser, which consists of two DLD arrays mirror towards the center, is placed upstream of the nanoDLD array. Particles are focused towards the mid-point of the nanoDLD array entrance. Particles will follow trajectories at θ° based on their size and displace laterally for ΔW μm. (d) Image of chip used in this study. A single fluid inlet and the fluidic channel were fabricated on a 20 mm × 15 mm silicon wafer chip. (e) SEM image of pillar array at condenser–nanoDLD interface. Condenser's pillars (upper section) have larger diameters and a 4× pitch size than the nanoDLD's pillar (lower section). The condenser shares the same G as the nanoDLD array. (f) Cross-section SEM of nanoDLD pillar array. Pillars are around 1.2 μm depth and have gaps averaging around 190 nm. | ||
For developing bioselectivity in nanoDLD the work herein describes a method of using microparticle-bound antibodies which aggregate in the presence of a target antigen protein. By selecting the proper geometry of the nanoDLD array, the difference in size between aggregated and un-aggregated particles can be set to different displacement trajectories, allowing physical separation and isolation of those particles with the targeted surface chemistry (Fig. 1c). To demonstrate this methodology, the report is organized as follows: i) to prove bioselectivity, we evaluated the displacement response as a function of antibody conjugation chemistry and antigen protein, showing selective aggregation only with the correct antibody–antigen pairing. To quantify the displacement trajectory as a function of aggregation in the nanoDLD we define a signal ratio between the displaced (“bumped” fraction) and the overall particle distribution. ii) We evaluate the limits of detection for the aggregation process and show the displacement response takes the form of a Heidelberger–Kendall immunoagglutination curve. iii) Using a basic model of agglutination and DLD displacement corroborates the observation of a displacement maximum which corresponds to a high aggregation number due to sufficient particle, antibody and antigen densities. iv) Finally we show that modifying the bead–antibody concentration allows tuning of the separation efficiency. Overall, the method described serves as a starting point for elaborating and scaling bio-selective separation in nanoDLD technology, potentially enabling greater resolution of complex colloid samples.
2. Results and discussion
2.1 Antibody–antigen induced displacement in nanoDLD
As a proof-of-concept of bioselective triggering in nanoDLD, IL-8 antibody-conjugated 40 nm carboxylated-polystyrene beads were induced to aggregate in the presence of the IL-8 protein, altering their separation behavior in a Si-based microfluidic device housing a G ∼ 187 nm, ε = 0.1, dc ∼ 70 nm nanoDLD array (Fig. 1d–f). The details of the device geometry and operation are given in the Experimental and ESI.† The device is designed to first concentrate the particles into a single stream in the center of a fluidic channel, and then use this induced, focused injection to insert the particles into the nanoDLD device to measure their displacement efficiency (Fig. 1c and S3†). Particle behavior in the nanoDLD array is measured using fluorescence microscopy of the ensemble particle stream, which illuminates the wedge of the microchannel where the majority particle trajectories pass (over 10 s exposure time). As-obtained, unmodified and un-aggregated 40 nm beads show an altered-zigzag trajectory that follow path between zigzag and the bump mode with a broadening of the particle stream associated with diffusion (Fig. 2).3,29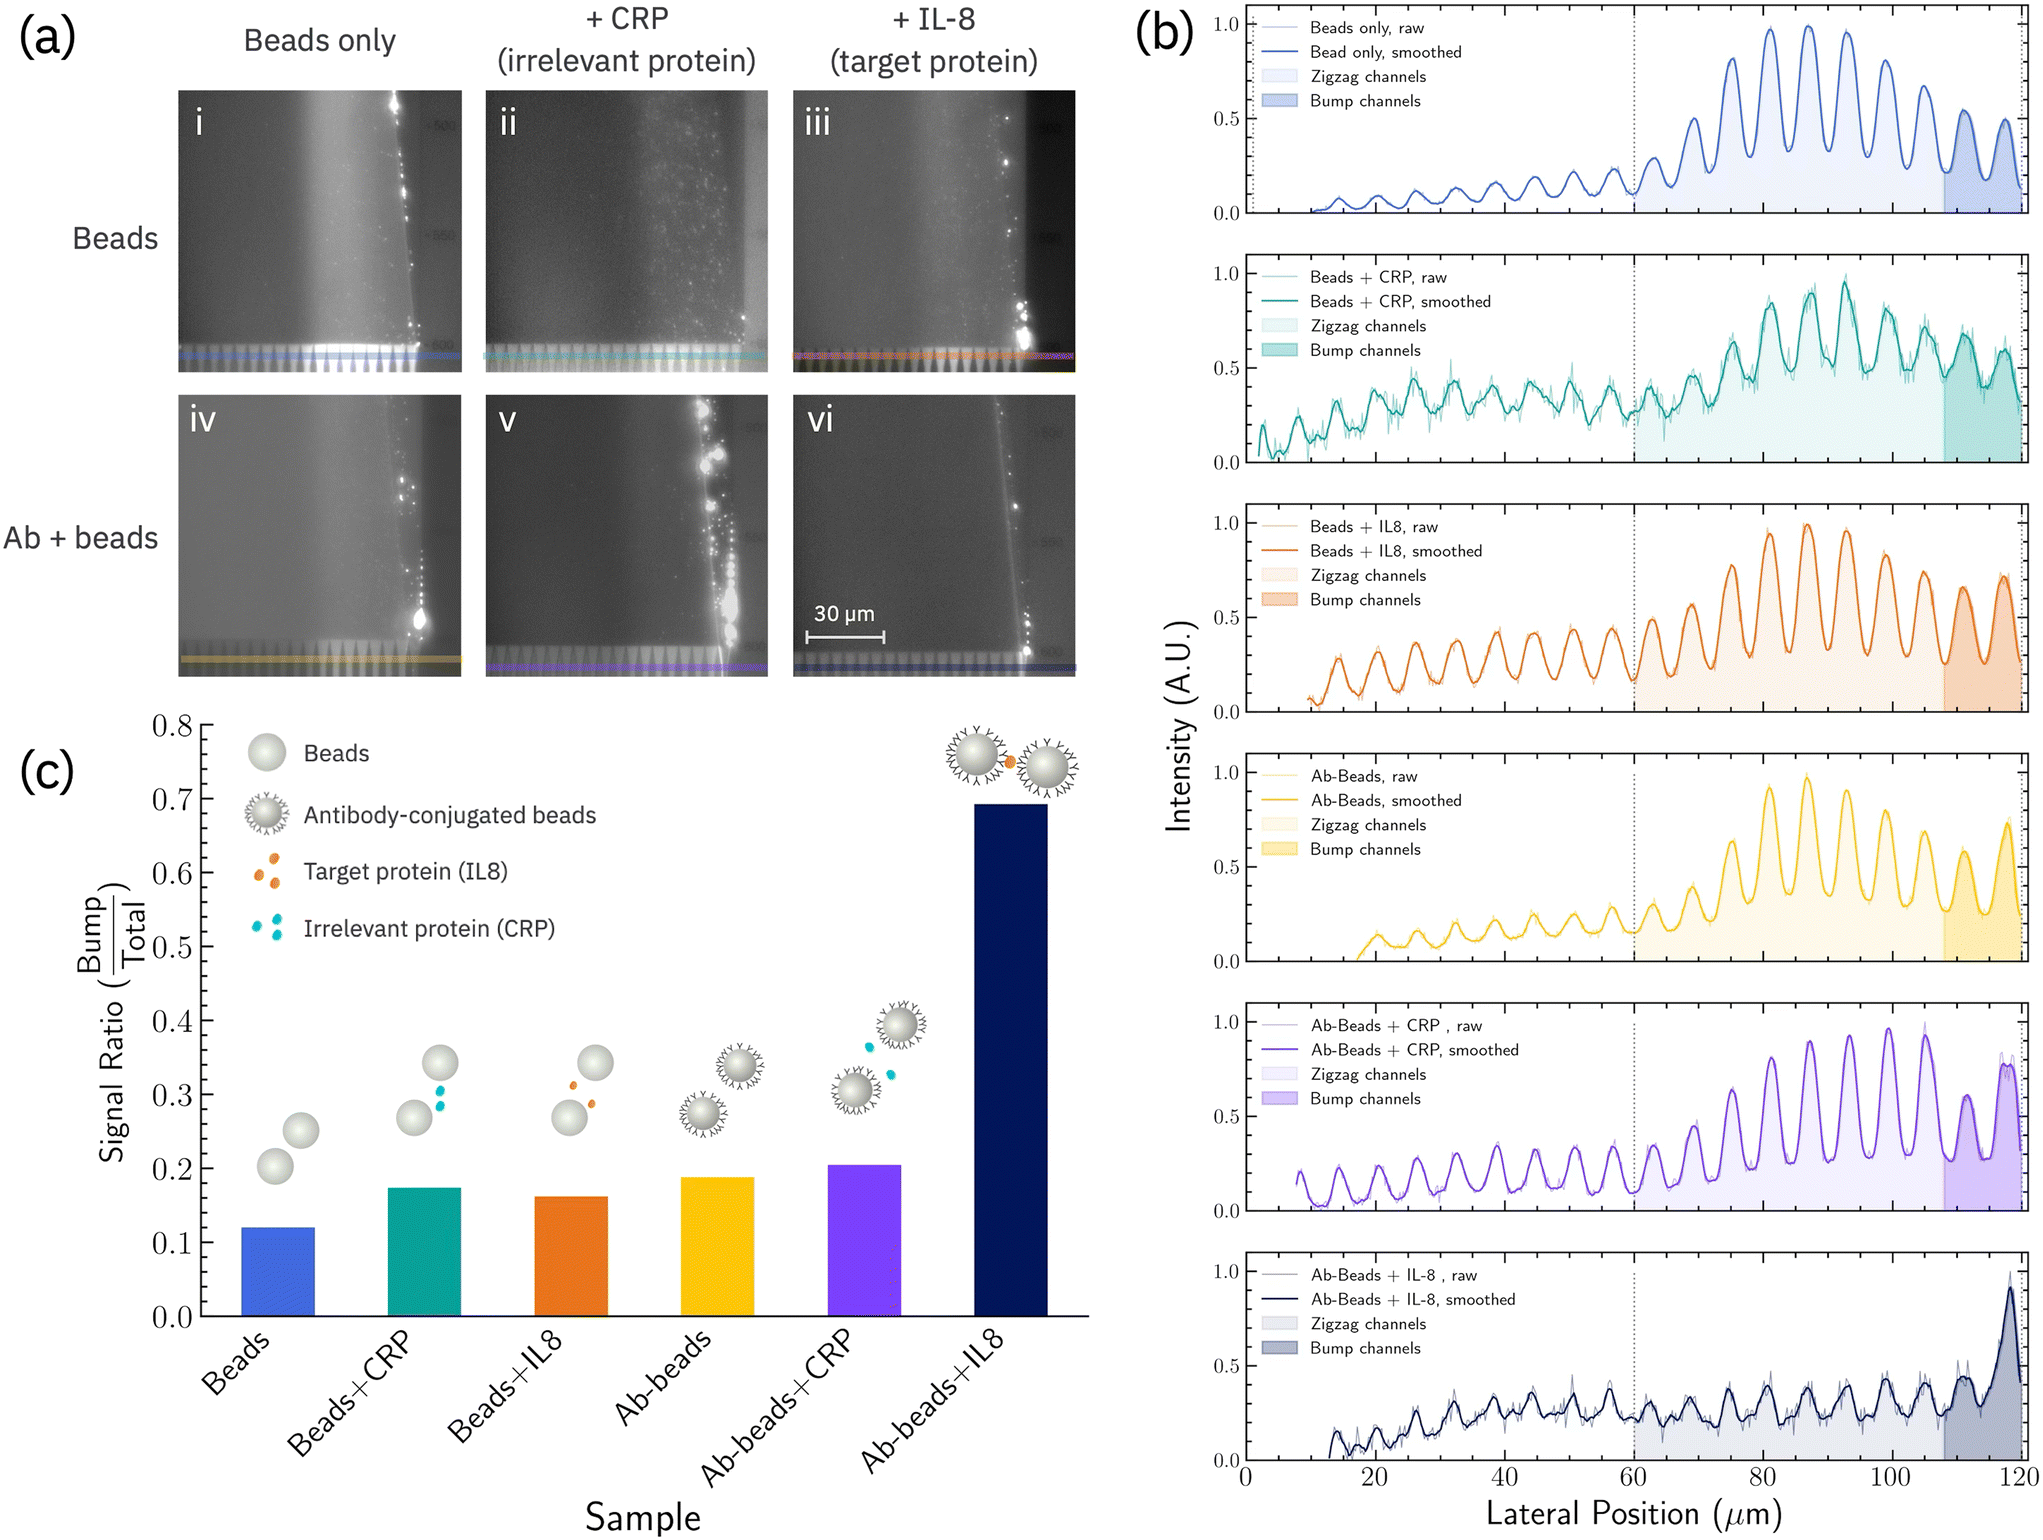 | ||
| Fig. 2 (a) Fluorescent images of nanoDLD array outlet for different conditions: (i) beads only, (ii) beads with irrelevant protein (CRP), (iii) beads with the target protein (IL-8), (iv) antibody-coated beads (Ab-beads), (v) antibody-coated beads with irrelevant protein and (vi) antibody-coated beads with the target protein. (b) Fluorescence intensity (a.u.) line profile across the color line in (a) for each condition. The light-colored regions are the zigzag outlet channels (center to the 8th channel), and the darker regions denote bump outlet channels (the two rightmost channels). As an upstream condenser was used to focus the particles towards the array's center, particles enter the right-shifted nanoDLD array at its midpoint (lateral position = 60 μm) and travel either follow a zigzag pattern or displaced right laterally while navigating along the pillar array. The left half of the array outlet (lateral position <60 μm) does not involve particle separation (white area under curve). (c) Calculated aggregation ratio for each condition using line profile in (b) using eqn (1). | ||
Here, particles follow a non-zero degree instead of traveling along a 0° path termed altered zigzag due to pseudoperiodicity, as discussed in the previous section. Pseudoperiodicity is the effect of particles following a zigzag trajectory that does not match the periodicity of the pillar array (device periodicity), N, which is the number of rows (where each row the pillars shift transversely by 1/Nth the lattice parameter Dx) along the array before the pillars restore to their start positions. In DLD theory, if the pillars are approximated as a point the shift ratio (1/N) is always consistent with the device periodicity N as an integer, and consequently the pillar structure exhibits N-fold periodicity and the particle behavior consistently follows either a zigzag or bumping mode at an angle of arctan (1/N). Previous work demonstrated that realistic pillars with finite volumes and shape can alter the original periodicity by modifying the shift ratio leading to an apparent, pseudoperiodicity that is not equal to the device periodicity.29 This effect becomes particularly significant in nanoscale DLD devices, where the pillar size can no longer be neglected as it often comparable to the gapsize. The spectrum-like distributions at the end of the array could be caused by the size distribution of particles and diffusional broadening.30 When the diffusion process is perpendicular to the flow direction, diffusion along the nanoDLD array can be determined by  . Hence, for 40 nm particles, the broadening width is around 8.64 μm.
Since the as-obtained particles showed a distribution of displacement trajectories, in order to quantify changes in trajectory due to biochemical interactions we calculated a signal ratio (eqn (1)) using the line profile of the fluorescence intensity at the exit of the nanoDLD array.
 | (1) |
In theory, large particles travels along the bump trajectory through array at θmax. In experiments, it was observed that large particles would travel between 4.57° and 5.71°, and ended up in the last two channels of the array. Therefore, we defined the furthest two outlets of the nanoDLD array as the experimental bump region and Ibump is the integrated fluorescence intensity for the bump region. Ibump + Izigzag, the total fluorescence intensity of the line profile across all the 10 outlets. The signal ratio for as-obtain, unconjugated 40 nm beads is ≈0.12, indicating the unmodified particles are, in general, below criticla displacement. Calculation details are given in the Experimental section and Fig. S4.† The line profile used for the signal-ratio shows modulation due to a set of exit channels which help stabilize the particle flow; the line position is chosen to avoid the issue of particle aggregation at the very corner of the exit from obscuring the profile (e.g.Fig. 2a, panel Ab + beads + CRP).
To enable beads to aggregate in the presence of a target antigen, antibodies must be anchored to the bead surface. Polyclonal antibodies were used, assuming at least two binding sites on the antigen would exist and thus allow antibodies to cross-link beasds into clusters. Conjugation of IL-8 polyclonal antibodies shows only a minor increase in signal ratio (Fig. 2), indicating the modification does not significantly induce aggregation or change the displacement trajectory. This signal (≈0.2) serves as the baseline for measuring changes in particle displacement due to target protein-induced aggregation.
Triggered displacement is shown by addition of IL-8 protein. After 1 hour incubation with IL-8, injected particles show a signal ratio ∼0.7, indicating a majority of the particles are now following a bump mode and fully displacing (Fig. 2). As there would be no strong implication of surface charge effects upon antibody–antigen binding, especially in the moderate ionic strength used, and there would be no major change in the inherent particle size of the microbeads upon binding, the interpretation is that higher signal ratio is due to two or more particles aggregating due to aggregation of particles by mutual binding of surface-bound IL-8 antibodies, on separate particles, IL-8 proteins.
In contrast, incubation with off-target CRP shows almost no shift in signal ratio, suggesting the beads are in the same state as that post-antibody conjugation and indicating the bio-selectivity of the triggered displacement is due to the immunochemistry. This is further reinforced by incubating as-obtained 40 nm beads with on-target IL-8/off-target CRP proteins; in both cases the signal ratio does not change, showing the need for bound-antibodies + target protein for displacement. The results show that using aggregation, biochemical interactions can be translated into physical changes in mesoscale particles that alter their nanoDLD displacement trajectory.
2.2 Range of detection for the agglutination process
In applying triggered displacement for selective isolation of colloids based on surface chemistry, it would be beneficial to know the minimal concentration of antigen needed to induce the displacement, and the limits of antigen concentration on signal detection. With our established antibody + bead system, the signal ratio was determined for varying concentrations of IL-8 at a fixed antibody-to-bead ratio and bead concentration (Fig. 3). The resulting plot exhibits a non-linear dose–response relationship. With increasing antigen, particles displacement increases until it reaches a maximum (0.25 μM IL-8 at antibody density of Nab = 1.24 pmol), after which additional antigen reverses the trend – reducing triggered displacement behavior. The limiting concentration for this proof-of-concept system is ∼3.125 nM IL-8, below which signal ratio shifts are insignificant. The maximum observable sensitivity is seens between 0.125 to 0.25 μM IL-8. | ||
| Fig. 3 Experimental results of immunodetection in nanoDLD. Reaction response is measured as the aggregation ratio against a series of known concentrations of the analyte (from 0 to 31.25 μM). The data points represent the mean aggregation ratio for each concentration. Error bars denote the standard deviation. A dose–response curve was observed from 0 M–0.25 μM, and an observable peak agglutination was at 0.25 μM. No significant trajectories were observed along the array between 0.75 μM and 3.75 μM (dotted grey lines). Above 6.25 μM, clusters were observed along the array with a mix of zigzag and bump trajectories. | ||
Between 0.75 μM and 3.75 μM, no significant fluorescence intensity is observed in the nanoDLD array. Only a few particle trajectories are observed at the outlet terminus (Video, ESI†); the signal too low for a quantitative image analysis. In this range of antigen![[thin space (1/6-em)]](https://www.rsc.org/images/entities/char_2009.gif) :antibody–bead, we observe particles clog and accumulate at the inlet of the upstream condenser, never reaching the nanoDLD array. This indicates the induced aggregates are larger than the condenser gap size ∼190 nm, and represents an artifact of the device itself, where limits on the array geometry cause a shift from displacement to filtration. As the nanoDLD device is not designed to filter, even a small number of aggregates at the array interface is sufficient to clog and destroy function.
:antibody–bead, we observe particles clog and accumulate at the inlet of the upstream condenser, never reaching the nanoDLD array. This indicates the induced aggregates are larger than the condenser gap size ∼190 nm, and represents an artifact of the device itself, where limits on the array geometry cause a shift from displacement to filtration. As the nanoDLD device is not designed to filter, even a small number of aggregates at the array interface is sufficient to clog and destroy function.
2.3 Agglutination model interpretation of induced displacement
The use of aggregation to induce particle displacement can be viewed as an agglutination process.31,32 The response curve in Fig. 3 bears a similar form to the Heidelberger–Kendall (H–K) curve which describes the antigen:antibody dependence of particle clustering in agglutination.33 To correlate the behavior observed in the displacement response curve to the agglutination process, the Smoluchowski coagulation framework was used to model the experimental conditions. Eqn (2) and (3) describe the time-dependent concentrations of k-mer clusters, in which a population of particles (k = 1) aggregates into clusters (dimers k = 2, trimers k = 3, etc.) irreversibly:32,34 | (2) |
 | (3) |
Solving eqn (2) and (3) at a fixed time tf = 3600 s (incubation time) and varying analyte concentrations n1 for the nanoDLD system yields an H–K type response curve (Fig. 4a, details in ESI†). While the calculated H–K curve and experimental response curve cannot be quantitatively compared, as the latter is a convolution of both the degree of aggregation and the DLD displacement efficiency, phenomenologically the H–K curve can inform the behavior observed in the triggered displacement. The calculated response curve has three regimes expected in H–K agglutination: in the antibody excess regime, a < 1, there are few antigen molecules present, therefore most antibodies remain unbound and particle cross-linking is low. This follows the response curve at low analyte concentration, where particle clustering would be low and thus remain in altered zig-zag mode. As the occupied antibody fraction a increases to full occupancy, a = 1 (green line in Fig. 4a), the fraction of aggregated particles 1 − A (blue line in Fig. 4a) reaches a maximum. This maximum, the equivalence regime, corresponds to an optimal stoichiometry of 1:2, analytes:reaction sites, and maximized aggregation. This rise to a maximum fits the response curve, in which aggregation now leads to particles larger than dc leading to bump mode and the increase in signal ratio. If aggregates become larger than the gap size of the array, this also could explain the loss of signal seen near the maximum; clusters become large enough be filtered out and clog. Additional analyte causes sites to saturate, leading to antigen excess in which few analytes can occupy two sites, diminishing the cluster sizes and aggregation fraction (yellow shading in Fig. 4a); equivalently this would be the signal roll-off seen in the response curve, indicating cluster size has reduced down to below dc, restoring the altered-zigzag mode.
 | ||
| Fig. 4 Agglutination model for qualitative description of antigen induced displacement behavior in nanoDLD (left panels), and experimental results of immunodetection in nanoDLD using particles conjugated with different antibody densities (right panels). (a) Agglutination model showing three regimes: (i) antibody excess zone (white region), (ii) equivalence zone (grey region), and (iii) antigen excess zone (yellow region). The blue curve illustrates the endpoint degree of agglutination, a, as a function of the concentration of antigens, which is also known as the Heidelberger–Kendall curve profile. The green curve represents the occupied antibody fraction, a. The maximal agglutination occurs when half of the antibodies are occupied (vertical grey dotted line). When antibody concentration surpasses analyte concentration (to the right of the orange dotted line), cluster formation starts to drop abruptly as the free binding sites start to be filled. (b) Simulated agglutination response with various antibody concentrations. The average antibodies per particle is given by f, with fo ≈ 4 antibodies/bead. Theoretical trajectories of agglutination response with varying antibody concentrations. A reduction in antibody concentration shifts the agglutination degree's peak towards diminished analyte concentrations. (c and d) Experimental results of immunodetection. Signal responses were measured as the aggregation ratio against a series of known concentrations of the analyte (from 0 to 31.25 μM). Each data point corresponds to the average aggregation ratio at a given concentration, with error bars representing the standard deviation. The yellow box denotes the observed experimental antibody excess zone. (c) 0.248 pmol antibodies were conjugated to 4 × 10¹⁰ particles, and a logistic-like dose–response curve was observed from 0 M–0.0625 μM. Peak agglutination was observed at 0.0625 μM, and no unobservable zone was experienced. Beyond 1.25 μM, with all the antibodies occupied, particles exhibit mostly monomers and yield a lower aggregation ratio. (d) 3.72 pmol antibodies were conjugated to 4 × 10¹⁰ of particles. From 0–0.625 μM, a dose–response curve was observed, and an observable peak agglutination was at 0.625 μM. Between 0.75 μM and 12.5 μM (dotted grey lines), no significant trajectories were observed along the array, as aggregates were unable to enter the nanoDLD array due to their physical dimensions. At 31.25 μM, as available reaction sites approach saturation, clusters were observed along the array, and this correlates to the antigen excess zone. | ||
2.4 Tuning the range of detection
Varying the particle binding sites, i.e. surface antibodies, in the model shifts the equivalence region as expected (Fig. 4b). The average surface antibodies per particle is f, A lower f leads to saturation at lower analyte concentration. It follows that the analyte sensitivity range can be tuned by altering the antibody–particle ratio. This was tested by modulating the antibody concentration during conjugation, Fig. 4c and d. When 0.248 pmol of antibodies were used during the conjugation (which yields fo ≈ 4 antibodies/bead; 1/5 of the amount in Fig. 3), the peak of aggregation ratio is observed to downshift to 0.0625 μM (Fig. 4c). At 1.25 μM and 6.25 μM, an aggregation ratio similar to that of N1 = 0 M indicates that most particles follow a partial zigzag trajectory. The sensitivity range is found now between 3.125 to 62.5 nM, and no clogging regime was observed for the lower antibody concentration.When 3.72 pmol antibodies were used during the conjugation (15× greater concentration than used in Fig. 4c), the observed sensitivity range does not change significantly, and there is a small attenuation in signal ratio (Fig. 4d). Moreover, between 0.75 μM to 12.5 μM, signal is lost due to particle clogging at the serpentine filter, and following the model that more surface sites should lead to greater cluster size. The clogging prevents quantifying the shift in the maximum.
2.5 Discussion
Here we discuss limitations of the current study. Although we observe aggregation induced particle dislocation, for higher accuracy several improvements can be envisioned. The current image analysis method may overestimate the signal ratio due to small particles diffusing into the bump region. To improve, a double Gaussian distribution can provide a more accurate distinction between zigzag and bump particle populations by modeling the intensity profile as two overlapping Gaussian curves. By integrating the areas under these curves, the contribution of diffused particles to the bump region signal can be minimized.The current demonstration relies on particles with a narrow size distribution (SD ∼10%). In practical scenarios, larger particle size distributions would require either engineering the nanoDLD to operate sequentially on different size ranges,14 or tune the geometry and chemistry to induce larger clusters which could be selectively removed. In biological cases, the use of species for high selectivity, such as antibodies, can be a cost-limiting factor. Although there is a favorable relationship between lower antibody density and lower analyte needed to trigger displacement; this has limiting factors. In the current work the kinetics of clustering were not studied directly; with smaller numbers of analytes, the time necessary for analytes and particles to collide and aggregate, especially in a complex mixture, may become limiting. In addition, this study did not look into the on–off binding kinetics of antibodies; at lower antibody concentrations, clusters may disintegrate in transit and not reform, leading to loss of separation efficiency.
The current work has been developed with nanoDLD devices, using sub-micron colloids, but it is expected agglutination could be extended to micron scale or larger DLD for selective separation, so long as the binding strength of the bioselective-moiety (e.g. antibody) can maintain the aggregate against the forces in the DLD array, in particular shear forces against pillars. Previous work with circulating tumor cell clusters has shown that micro-size aggregates can be separated by size.35,36 In this work it is clear that engineering of the DLD pillars is critical, as asymmetric particulates can have significantly different displacement trajectories depending on their mechanical and hydrodynamic interactions.37–39 This bears on the current work; as a simplifying assumption we have modeled particle aggregates as close-packed (minimal hull) clusters; effectively a single larger particle. However, it is expected that particle aggregates will form a distribution of conformations, of varying asymmetry, potentially including more extended or branched forms. Work with dsDNA has shown the displacement behavior can be severely altered in elongated polymers, and it may be expected that extended or branched aggregates exhibit their own spectrum of displacement behavior.13
Future work is needed to ascertain the aggregate morphologies, their fractions, and how they interact with the pillar array, in order to determine their contribution to the displacement trajectory, e.g. potential line broadening, and to enable better signal resolution in complex mixtures.
3. Experimental
3.1 Materials
Human IL-8/CXCL8 Antibody (Detection, Biotinylated, polyclonal) and Human IL-8/CXCL8 protein were obtained from R&D systems. FluoSpheres® NeutrAvidin® labeled microspheres (d = 40 nm, red fluorescent (excitation/emission: 580/605)) were obtained from ThermoFisher. TWEEN 20, phosphate buffer saline (PBS) tablets, bovine serum albumin (BSA), and 0.02 μm Whatman Anotop syringe filters were obtained from Sigma Aldrich. All buffers were filtered with 0.02 μm Whatman Anotop syringe filters and were stored in 4° C prior to use.3.2 NanoDLD device parameters
All experiments in this study were performed on 20 mm × 15 mm silicon wafer chips (Fig. 1a). Chip layout is as shown in Fig. S1a,† each chip consists of an upstream serpentine filter (Fig. S1b†), load channels leading to an upstream condenser array (Fig. S1d†), a single nanoDLD array (Fig. 1f), and outlet channels at the nanoDLD array exit (Fig. S1e†). The 1.2 mm long condenser focuses the sample particles to the center of the array before the sample enters the nanoDLD array, which is 600 μm long, 120 μm wide (Fig. S1a†). The nanoDLD array is constructed with 1.2 μm pillars of D0 ≈ 210 nm, arranged in ε = 0.1, Dx = Dy, θmax = 5.71° and G ≈ 187 nm (Fig. 1e and f).The upstream condenser has approximately the same gap size (G ≈ 190 nm) as the nanoDLD array. It consists of two arrays mirrored across the channel center line, with larger pillars (D0,condenser = 1410 nm) (Fig. 1e, S3b†). With the increase in the ratio of the pillar diameter to the downstream distance (D0/Dy), the streamline (ys) is divided by a larger psuedoperiodicity, thus yielding a narrower streamline, resulted in a decrease in dc. As dc = 2 × ys,1 thus in the condenser, dC,condenser is smaller than the theoretical nanoDLD dc (eqn (1)). Therefore, along the condenser array, smaller particles deflected towards the center of the nanoDLD array entrance (Fig. S3a†) while only requiring a single fluidic input. A condenser array is not used for signal detection due to the lower efficiency of separation compared to the nanoDLD.
3.3 Device fabrication
NanoDLD chips were fabricated featuring an upstream condenser array and a downstream nanoDLD array with specific dimensions and characteristics (Fig. S1†). The fabrication process involved multiple steps such as feature patterning, etching, and post-etch cleaning. Silicon wafers underwent a rigorous preparation that included RCA cleaning, tri-layer resist coating, and 193 nm lithography. Reactive ion etching (RIE) was then used to define the features down to a micron level, utilizing a multi-step etching process with quality control measures in place. After etch, wafers were subjected to various cleans to remove residual materials. These silicon wafers were then bonded to borosilicate glass wafers through anodic bonding, facilitated by a Süss SB6 anodic bonder. Following bonding, the silicon was polished and thinned, and through-silicon vias (TSVs) were created for fluidic access using an optical mask aligner and deep silicon RIE processes. The wafers were eventually diced to produce 72 usable nanoDLD chips per wafer, all with precisely defined microfluidic features. Details of the fabrication process are described in section 2, ESI.†3.4 Device operation
Chip preparation – all chips were wetted prior to use. The wetting process included submerging chips in 1× PBS in a baker, followed by an autoclave at 130 °C for 90 minutes without a drying phase. Wetted chips were stored in 1× PBS.Chips were operated in a custom-built flow cell (Fig. S2a†). The flow cell has a mounting base (Fig. S2b†) for restraining the chip mounting base (Fig. S2c†), a sample reservoir aligned with the inlet of the chip (Fig. S2d†), a viewing window for microscopy imaging (Fig. S2c†), and a pressurization inlet on the side which connects to a Qmix System syringe pump to drive the fluid flow inside the microfluidic channel (Fig. S2d†). Before each use, the flow cell was cleaned with a 15% hydrogen peroxide solution for a minimum of 10 minutes, followed by a 10 minute soak in deionized water. A syringe was then used to pump fluid through the inlet port to remove any built-up contaminants.
Chips were primed with 20 μL of 0.02 μm filtered 1× PBS, 5% BSA, 0.5% TWEEN20 at 3 bar for 1 hour prior to sample loading to prevent non-specific bindings or particle adhesion. After priming, 20 μL of the sample was pipetted to the inlet of the chip via a gel tip; the sample reservoir was then sealed by tightening the screw. The pressurized sample was driven into the microchannels, flowed through a built-in on-chip condenser, and entered the nanoDLD array.
3.5 Antibodies conjugation on microspheres
Biotinylated IL8 antibodies were conjugated on NeutrAvidin microspheres via binding between biotin and NeutrAvidin. 0.2 μL Neutravidin microspheres were washed in 100 μL 1× PBSTB (1× PBS containing 0.05% Tween 20 and 1% BSA) twice. Beads solution was then centrifuged with a 50 kDA spin filter; microspheres were resuspended in 10 μL 1× PBSTB. 0.248, 1.24, 3.72 pmol of reconstituted antibodies were added to bead solution to prepare antibody-conjugated microbeads with varying surface coverages of antibodies.3.6 Detection of IL8 in nanoDLD
10 μL of antibody-conjugated beads were mixed with 10 μL of IL-8 with different concentrations in a protein Lobind microcentrifuge tube (Eppendorf™) for 1 hour at room temperature on a rotator. Samples were then loaded into the sample reservoir of the flow cell and inserted with primed chips. Chips were operated as described in section 3.4; samples were run at 8 bar for 30 minutes at room temperature in the dark to perform fluorescence imaging. The pressure was maintained by feedback control using the software of Qmix System syringe pump.3.7 Image analysis
To determine the migration angle and the displacement efficiency of particles in nanoDLD, fluorescence image videos of nanoDLD outlet were analyzed using a custom Python script. Detailed process to determine displacement efficiency and signal ratio from the obtained image videos is described in ESI.†3.8 Agglutination model and cluster size distribution simulation
To investigate the agglutination process and simulate the cluster size distribution in a solution, a custom Python program was developed to solve a system of differential equations. Details of the model derivation are described in section 4, ESI.†4. Conclusions
Using antibody-coated beads aggregating in the presence of an antigen, a method of bioselective, induced displacement in nanoDLD has been demonstrated. The method is applicable to selecting colloidal species by surface chemistry and is of potential relevance for isolating sub-populations of biological species, such as extracellular vesicles, protein complexes or nanomaterials, based on both size and surface chemistry. The interplay of three populations, the beads (colloids), the binding site (antibody) surface density, and the analyte (antigen) concentration, makes the need for tuning the stoicheometries and matching the resultant cluster population to the nanoDLD device factors that must be addressed for future development. The agglutination model provides a framework for interpreting the displacement behavior as a function of analyte concentration, and could serve, with refinement, to enable design for targeted isolation of complex mesoscopic species.Data availability
The data supporting this article has been included as part of the ESI.†Author contributions
Conceptualization: SMG, KYH, BHW, GYC; investigation: KYH; device fabrication: JTS; microfluidic design and construction: MP, BHW, formal analysis: KYH, BHW, SCK; methodology: SMG, KYH; writing – original draft: KYH, BHW; writing – review & editing: BHW, KYH, JTS, SMG, SCK; visualization: KYH; project administration: GYC, BHW, JTS.Conflicts of interest
There are no conflicts to declare.Acknowledgements
G.-Y. C. would like to acknowledge funding from The National Science and Technology Council (NSTC113-2823-8-A49-003-, NSTC112-2321-B-A49-015-, NSTC 112-2321-B-A49-016-, NSTC113-2321-B-A49-021, NSTC113-2628-B-A49-008-MY3, and NSTC112-2636-E-A49-008-), “Center for Intelligent Drug Systems and Smart Bio-devices (IDS2B)” from The Featured Areas Research Center Program within the framework of the Higher Education Sprout Project by the Ministry of Education (MOE) (113W30305), and the Higher Education Sprout Project of the National Yang Ming Chiao Tung University and MOE, Taiwan (113W020211, 113W020214). The authors gratefully acknowledge the efforts of the staff of the Microelectronics Research Laboratory (MRL) at the IBM T. J. Watson Research Center, where the devices were fabricated.References
- L. R. Huang, E. C. Cox, R. H. Austin and J. C. Sturm, Science, 2004, 304, 987–990 CrossRef CAS PubMed.
- C. Mallorie, R. Vernekar, B. Owen, D. W. Inglis and T. Krüger, Phys. Rev. Fluids, 2024, 9, 024203 CrossRef.
- V. Biagioni, G. Balestrieri, A. Adrover and S. Cerbelli, Biosensors, 2020, 10(9), 126 CrossRef CAS PubMed.
- J. Kottmeier, M. S. Wullenweber, I. Kampen, A. Kwade and A. Dietzel, Micromachines, 2024, 15, 802 CrossRef PubMed.
- N. Tottori and T. Nisisako, Sci. Rep., 2023, 13, 4994 CrossRef CAS PubMed.
- H. Kutluk, M. Viefhues and I. Constantinou, Small Sci., 2024, 4, 2300206 CrossRef CAS PubMed.
- M. S. Wullenweber, J. Kottmeier, I. Kampen, A. Dietzel and A. Kwade, Processes, 2023, 11, 2438 CrossRef CAS.
- S. Das, I. Gupta and S. Singh Bahga, Biomicrofluidics, 2024, 18, 044104 CrossRef PubMed.
- O. G. Chavez-Pineda, R. Rodriguez-Moncayo, A. M. Gonzalez-Suarez, P. E. Guevara-Pantoja, J. L. Maravillas-Montero and J. L. Garcia-Cordero, Lab Chip, 2024, 24, 2575–2589 RSC.
- Y. Lu, J. Ying, S. Mu, W. Tan and G. Zhu, Sep. Purif. Technol., 2024, 345, 127369 CrossRef CAS.
- B. H. Wunsch, J. T. Smith, S. M. Gifford, C. Wang, M. Brink, R. L. Bruce, R. H. Austin, G. Stolovitzky and Y. Astier, Nat. Nanotechnol., 2016, 11, 936–940 CrossRef CAS PubMed.
- J. T. Smith, B. H. Wunsch, N. Dogra, M. E. Ahsen, K. Lee, K. K. Yadav, R. Weil, M. A. Pereira, J. V. Patel, E. A. Duch, J. M. Papalia, M. F. Lofaro, M. Gupta, A. K. Tewari, C. Cordon-Cardo, G. Stolovitzky and S. M. Gifford, Lab Chip, 2018, 18, 3913–3925 RSC.
- B. H. Wunsch, S.-C. Kim, S. M. Gifford, Y. Astier, C. Wang, R. L. Bruce, J. V. Patel, E. A. Duch, S. Dawes, G. Stolovitzky and J. T. Smith, Lab Chip, 2019, 19, 1567–1578 RSC.
- T. Salafi, Y. Zhang and Y. Zhang, Nanomicro Lett., 2019, 11, 77 Search PubMed.
- K. K. Zeming, T. Salafi, S. Shikha and Y. Zhang, Nat. Commun., 2018, 9, 1254 CrossRef PubMed.
- K. K. Zeming, N. V. Thakor, Y. Zhang and C.-H. Chen, Lab Chip, 2016, 16, 75–85 RSC.
- B. D. Ho, J. P. Beech and J. O. Tegenfeldt, Micromachines, 2020, 11, 1014 CrossRef PubMed.
- J. P. Beech, K. Keim, B. D. Ho, C. Guiducci and J. O. Tegenfeldt, Adv. Mater. Technol., 2019, 4, 1900339 CrossRef CAS.
- V. Calero, P. Garcia-Sanchez, A. Ramos and H. Morgan, Biomicrofluidics, 2019, 13, 054110 CrossRef PubMed.
- V. Calero, R. Fernández-Mateo, H. Morgan, P. García-Sánchez and A. Ramos, J. Chromatogr. A, 2023, 1706, 464240 CrossRef CAS PubMed.
- R. J. Gillams, V. Calero, R. Fernandez-Mateo and H. Morgan, Lab Chip, 2022, 22, 3869–3876 RSC.
- D. Wang, S. Yang, N. Wang, H. Guo, S. Feng, Y. Luo and J. Zhao, Biosensors, 2024, 14, 174 CrossRef CAS PubMed.
- H. Sharma, V. Yadav, C. D'Souza-Schorey, D. B. Go, S. Senapati and H.-C. Chang, ACS Nano, 2023, 17, 9388–9404 CrossRef CAS PubMed.
- D. K. Jeppesen, Q. Zhang, J. L. Franklin and R. J. Coffey, Trends Cell Biol., 2023, 33, 667–681 CrossRef CAS PubMed.
- D. M. Goss, S. A. Vasilescu, G. Sacks, D. K. Gardner and M. E. Warkiani, Nat. Rev. Urol., 2023, 20, 66–95 CrossRef CAS PubMed.
- S. Ferguson, K. S. Yang and R. Weissleder, Trends Mol. Med., 2022, 28, 681–692 CrossRef CAS PubMed.
- M. Gaillard, F. Boizot, C. Raillon, V. Agache, A. Thuaire and Y. Roupioz, MicroTAS 2021, 2021 Search PubMed.
- H. Zhang, J. Zeng, D. Han, J. Deng, N. Hu, X. Zheng and J. Yang, Sensors, 2020, 20, 2846 CrossRef CAS PubMed.
- S.-C. Kim, B. H. Wunsch, H. Hu, J. T. Smith, R. H. Austin and G. Stolovitzky, Proc. Natl. Acad. Sci. U. S. A., 2017, 114, E5034–E5041 CAS.
- J. A. Davis, D. W. Inglis, K. J. Morton, D. A. Lawrence, L. R. Huang, S. Y. Chou, J. C. Sturm and R. H. Austin, Proc. Natl. Acad. Sci. U. S. A., 2006, 103, 14779–14784 CrossRef CAS PubMed.
- M. Wiklund, O. Nord, R. Gothäll, A. V. Chernyshev, P.-A. Nygren and H. M. Hertz, Anal. Biochem., 2005, 338, 90–101 CrossRef CAS PubMed.
- N. Kylilis, P. Riangrungroj, H.-E. Lai, V. Salema, L. Fernández, G.-B. V. Stan, P. S. Freemont and K. M. Polizzi, ACS Sens., 2019, 4, 370–378 CrossRef CAS PubMed.
- M. Heidelberger and F. E. Kendall, J. Exp. Med., 1935, 61, 563–591 CrossRef CAS PubMed.
- E. B. Dolgosheina, A. Y. Karulin and A. V. Bobylev, Math. Biosci., 1992, 109, 1–10 CrossRef CAS PubMed.
- S. H. Au, J. Edd, A. E. Stoddard, K. H. K. Wong, F. Fachin, S. Maheswaran, D. A. Haber, S. L. Stott, R. Kapur and M. Toner, Sci. Rep., 2017, 7, 2433 CrossRef PubMed.
- K. Loutherback, J. D'Silva, L. Liu, A. Wu, R. H. Austin and J. C. Sturm, AIP Adv., 2012, 2, 42107 CrossRef PubMed.
- S. Ranjan, K. K. Zeming, R. Jureen, D. Fisher and Y. Zhang, Lab Chip, 2014, 14, 4250–4262 RSC.
- J. Wu, W. Zhang, X. Du, J. Liu, Y. Lv and Y. He, AIP Adv., 2024, 14, 035351 CrossRef CAS.
- Z. Zhang, E. Henry, G. Gompper and D. A. Fedosov, J. Chem. Phys., 2015, 143, 243145 CrossRef PubMed.
Footnote |
| † Electronic supplementary information (ESI) available. See DOI: https://doi.org/10.1039/d5lc00079c |
| This journal is © The Royal Society of Chemistry 2025 |