
 Open Access Article
 This Open Access Article is licensed under a Creative Commons Attribution-Non Commercial 3.0 Unported Licence
A comprehensive review of competitive lateral flow assays over the past decade†
Julia
Pedreira-Rincón
 ab,
Lourdes
Rivas
a,
Joan
Comenge
cd,
Vasso
Skouridou
e,
Daniel
Camprubí-Ferrer
abf,
Jose
Muñoz
abf,
Ciara K.
O'Sullivan
eg,
Alejandro
Chamorro-Garcia
*h and
Claudio
Parolo
*ae
ab,
Lourdes
Rivas
a,
Joan
Comenge
cd,
Vasso
Skouridou
e,
Daniel
Camprubí-Ferrer
abf,
Jose
Muñoz
abf,
Ciara K.
O'Sullivan
eg,
Alejandro
Chamorro-Garcia
*h and
Claudio
Parolo
*ae
aBarcelona Institute for Global Health (ISGlobal), Barcelona 08036, Spain
bFacultat de Medicina i Ciències de la Salut, Universitat de Barcelona (UB), Barcelona, Spain
cVall d'Hebron Research Institute (VHIR), 08035 Barcelona, Spain
dNetworking Research Centre for Bioengineering, Biomaterials, and Nanomedicine (CIBER-BBN), Instituto de Salud Carlos III, 28029 Madrid, Spain
eINTERFIBIO Research Group, Departament d'Enginyeria Química, Universitat Rovira i Virgili, 43007 Tarragona, Spain. E-mail: claudio.parolo@urv.cat
fInternational Health Department, Hospital Clínic de Barcelona, Barcelona, Spain
gInstitució Catalana de Recerca i Estudis Avançats (ICREA), Passeig Lluís Companys 23, 08010, Barcelona, Spain
hDepartment of Chemical Sciences and Technologies, University of Rome Tor Vergata, Via Della Ricerca Scientifica, 1, Rome, 00133, Italy. E-mail: alejandro.chamorro.garcia@uniroma2.it
First published on 31st March 2025
Abstract
Competitive lateral flow assays (LFAs) provide a versatile and cost-effective platform for detecting a wide range of molecular targets across fields such as healthcare, food safety, and environmental monitoring, particularly for small analytes or single epitopes that lack suitable bioreceptor pairs. However, the interpretation of competitive LFAs can be challenging due to their counterintuitive output, where the absence of a test line signifies the presence of the target. In this review, we present a comprehensive overview of the fundamental strategies underlying competitive LFAs, explore the mathematical models that quantify assay performance, and outline the critical parameters involved in their design and optimization. We further highlight notable applications and discuss methods to enhance the user experience through improved result interpretation and user-centric design. By consolidating current knowledge and best practices, this work will serve as a valuable reference for researchers and developers seeking to refine the usability, reliability, and effectiveness of competitive LFAs.
 Top row, left to right: Julia Pedreira-Rincón, Lourdes Rivas, Joan Comenge, Vasso Skouridou, and Daniel Camprubí-Ferrer. Bottom row, left to right: Jose Muñoz, Ciara K. O'Sullivan, Alejandro Chamorro-Garcia, and Claudio Parolo | The authors of this review form an interdisciplinary team whose expertise spans chemistry, biotechnology, materials science, and clinical research. By integrating biosensor design, biomolecular engineering, advanced nanomaterials, and point-of-care technologies, they offer a holistic perspective on the challenges and opportunities of competitive LFAs across diverse applications, from clinical settings to environmental and food safety monitoring. Julia Pedreira-Rincón: PhD student specializing in malaria diagnostics. Lourdes Rivas: senior researcher focusing on LFA development. Joan Comenge: senior researcher working on nanoparticle synthesis and functionalization. Vasso Skouridou: senior researcher working on aptamer and LFA development, DNA detection and recombinant protein production. Daniel Camprubí-Ferrer: medical doctor and researcher specialized in malaria, dengue and travel-related diseases. Jose Muñoz: head of the Travel Medicine Unit and professor working on travel medicine and neglected tropical diseases. Ciara K. O'Sullivan: ICREA Professor working on aptamer selection and the development of optical and electrochemical biosensors. Alejandro Chamorro-Garcia: senior researcher developing optical and electrochemical biosensors. Claudio Parolo: Ramón y Cajal researcher developing optical and electrochemical biosensors. |
1. Introduction
During the early 1960s and in the subsequent years, rapid tests based on paper chromatography experienced a dramatic increase in examples and applications in research laboratories.1 This phenomenon was translated decades later in the development of lateral flow assays (LFAs), which changed the original paraffin2 and paper substrate to nitrocellulose. Since then, LFAs have progressively become more integrated into our daily lives.3 Currently, we use them in a myriad of applications ranging from healthcare (e.g., pregnancy and Covid-19 tests) to food and environmental (e.g., pesticide and heavy metal detections) analysis.3,4 Clearly, their popularity resides in their ability to provide meaningful results within minutes at a low cost.3,5 Their user-friendliness is achieved through a thoughtful, and sometimes complex, optimization of all LFA components (such as membranes, bioreceptors, labels, buffers), resulting in the appearance of a test line (TL) that can be readily assessed with the naked eye, rendering them as ideal diagnostic devices to be used at the point of care.5–81.1. Principles and types of lateral flow assays
An LFA takes advantage of the capillary-driven flow of the sample through a set of sequential pads for delivering a visible signal on the strip, indicating the presence or absence of a certain target. In order to achieve this the LFA generally comprises four overlapping membranes: (i) a sample pad, (ii) conjugate pad, (iii) detection membrane and (iv) absorbent pad. The fluid sample is dispensed onto the sample pad and then flows via capillary action until reaching the conjugate pad. The conjugate pad contains the pre-adsorbed conjugates (e.g., nanoparticles conjugated to a specific recognition element for the target), which are resuspended within the sample as it keeps migrating. Following the conjugate pad, the fluid reaches the detection membrane, where the presence or absence of the target induces the specific immobilization of the conjugates on the TL and control line (CL), obtained by printing specific bioreceptors on the membrane itself. Finally, the excess of fluid is wicked to the absorbent pad. For more in-depth exploration of LFA principles and fabrication methods, the literature offers excellent references for further reading.3,5,8–11From a sensor design perspective, LFAs can be divided into two main categories: sandwich (non-competitive) and competitive assays.12 In the former, the intensity of the TL increases proportionally with the target concentration (Fig. 1A), whilst in the latter the intensity of the TL decreases as the amount of target in the sample increases (Fig. 1B). In particular, immune-sandwich LFAs are mostly employed for the detection of targets that present at least two different epitopes. This allows the formation of the so-called immuno-sandwich complex between at least two different antibodies and the antigen. Immune-sandwich based assays tend to offer an easier user-experience given their more intuitive read-out (i.e., signal intensity directly proportional to target concentration).3,5,11 In contrast, competitive assays have generally been exploited for the detection of small molecules or single epitope targets, when it is not possible to form an immune-sandwich complex.3,5,11 They offer important advantages over the non-competitive assays such as: the requirement of just one single bioreceptor and the fact that they are insensitive to the hook effect (i.e., when extremely high concentrations of the analyte saturate the antigen binding sites in an immunoassay, leading to a decrease in the signal), a leading cause of false negative results.5,9,13 However, competitive LFAs often present significant challenges, including the need for more intricate optimization to balance the amounts of bioreceptors in order to achieve a sufficiently strong signal without compromising sensitivity. They also feature an inverse signal-to-analyte relationship, which can result in a less intuitive readout for individuals lacking specialized training and may rely more on advanced detection strategies due to the inherently lower absolute signal, substantially increasing complexity and overall costs. Finally, multiplexing is typically less straightforward in the competitive format because each target requires its own competition reaction, and the multiple inverse signals can complicate data interpretation.
 | ||
| Fig. 1 Schematic representation of LFA signal outputs. (A) Sandwich format: an increase in target analyte concentration leads to a higher intensity of the test line (TL), resulting in a positive correlation between analyte concentration and signal intensity. (B) Competitive format: an increase in target analyte concentration results in a reduction of signal intensity on the TL, demonstrating an inverse correlation between analyte concentration and signal intensity. | ||
In this manuscript, we provide a comprehensive review of competitive LFAs, discussing their design, theoretical models that aid in their development, the use/optimizations of their different components, their applications and the end-user perspective. In order to do this, we searched in PubMed for all manuscripts published between 2013 and 2023 that contained the words “competitive” and “lateral flow” in the Title or the Abstract. From that search, excluding the manuscripts that did not discuss competitive LFAs and their fabrication, we identified 131 manuscripts. From these references, some of them included different competitive assays in the same study, thus in this manuscript, we will refer to 161 assays in total. Since not all the articles refer to each aspect discussed, each section will reference only the assays that contain the relevant information. Finally, for the convenience of the reader, in the SI we provide a complete table (Table S1†) of all the manuscripts analysed and categorized taking into account 19 different parameters.
1.2. Competitive lateral flow assay formats: working principles and considerations
As a general rule, competitive assays universally involve a synthetic target molecule or target analog (herein referred to as a “competitor”) that competes with the target for the binding sites of the bioreceptor. This principle can be adapted into countless biosensor architectures for competitive detection, in the literature we identify two main format types of competitive LFA, direct and indirect (collectively referred to as “Standard”) and four less common variants (here collectively referred to as “Non-standard”). | ||
| Fig. 2 Standard competitive assay formats. Panel (A) illustrates a direct assay using an antibody as a capture bioreceptor and the competitor conjugated to the nanoparticle. Panel (B) displays the indirect competitive format using an antibody as a detection bioreceptor (i.e., conjugated to the nanoparticle) while the competitor is printed on the TL. | ||
• Dual competitive: this format (Fig. 3A) relies on the use of a specially designed competitor that consists of a multiple hapten-competitor carrier that is pre-absorbed in the sample pad. This is crucial as the presence of multiple effective competitors in the same molecule allows for the formation of a sandwich. Specifically, the presence of the target in the sample inhibits the formation of the immune-sandwich complex between the competitor and the capture/detection bioreceptors, while in target absence the competitor enables polyvalent interactions forming the mentioned immune-sandwich.14 This approach combines typical advantages of a sandwich assay (sample preconcentration in the detection bioreceptor) with the advantages of competitive assays (capable of detecting single epitope targets). Besides, the competitor is modified onto the carrier protein, simplifying the handling and stability, and the bioreceptors, typically antibodies, are the ones labelled with the reporter and immobilized on the lines.
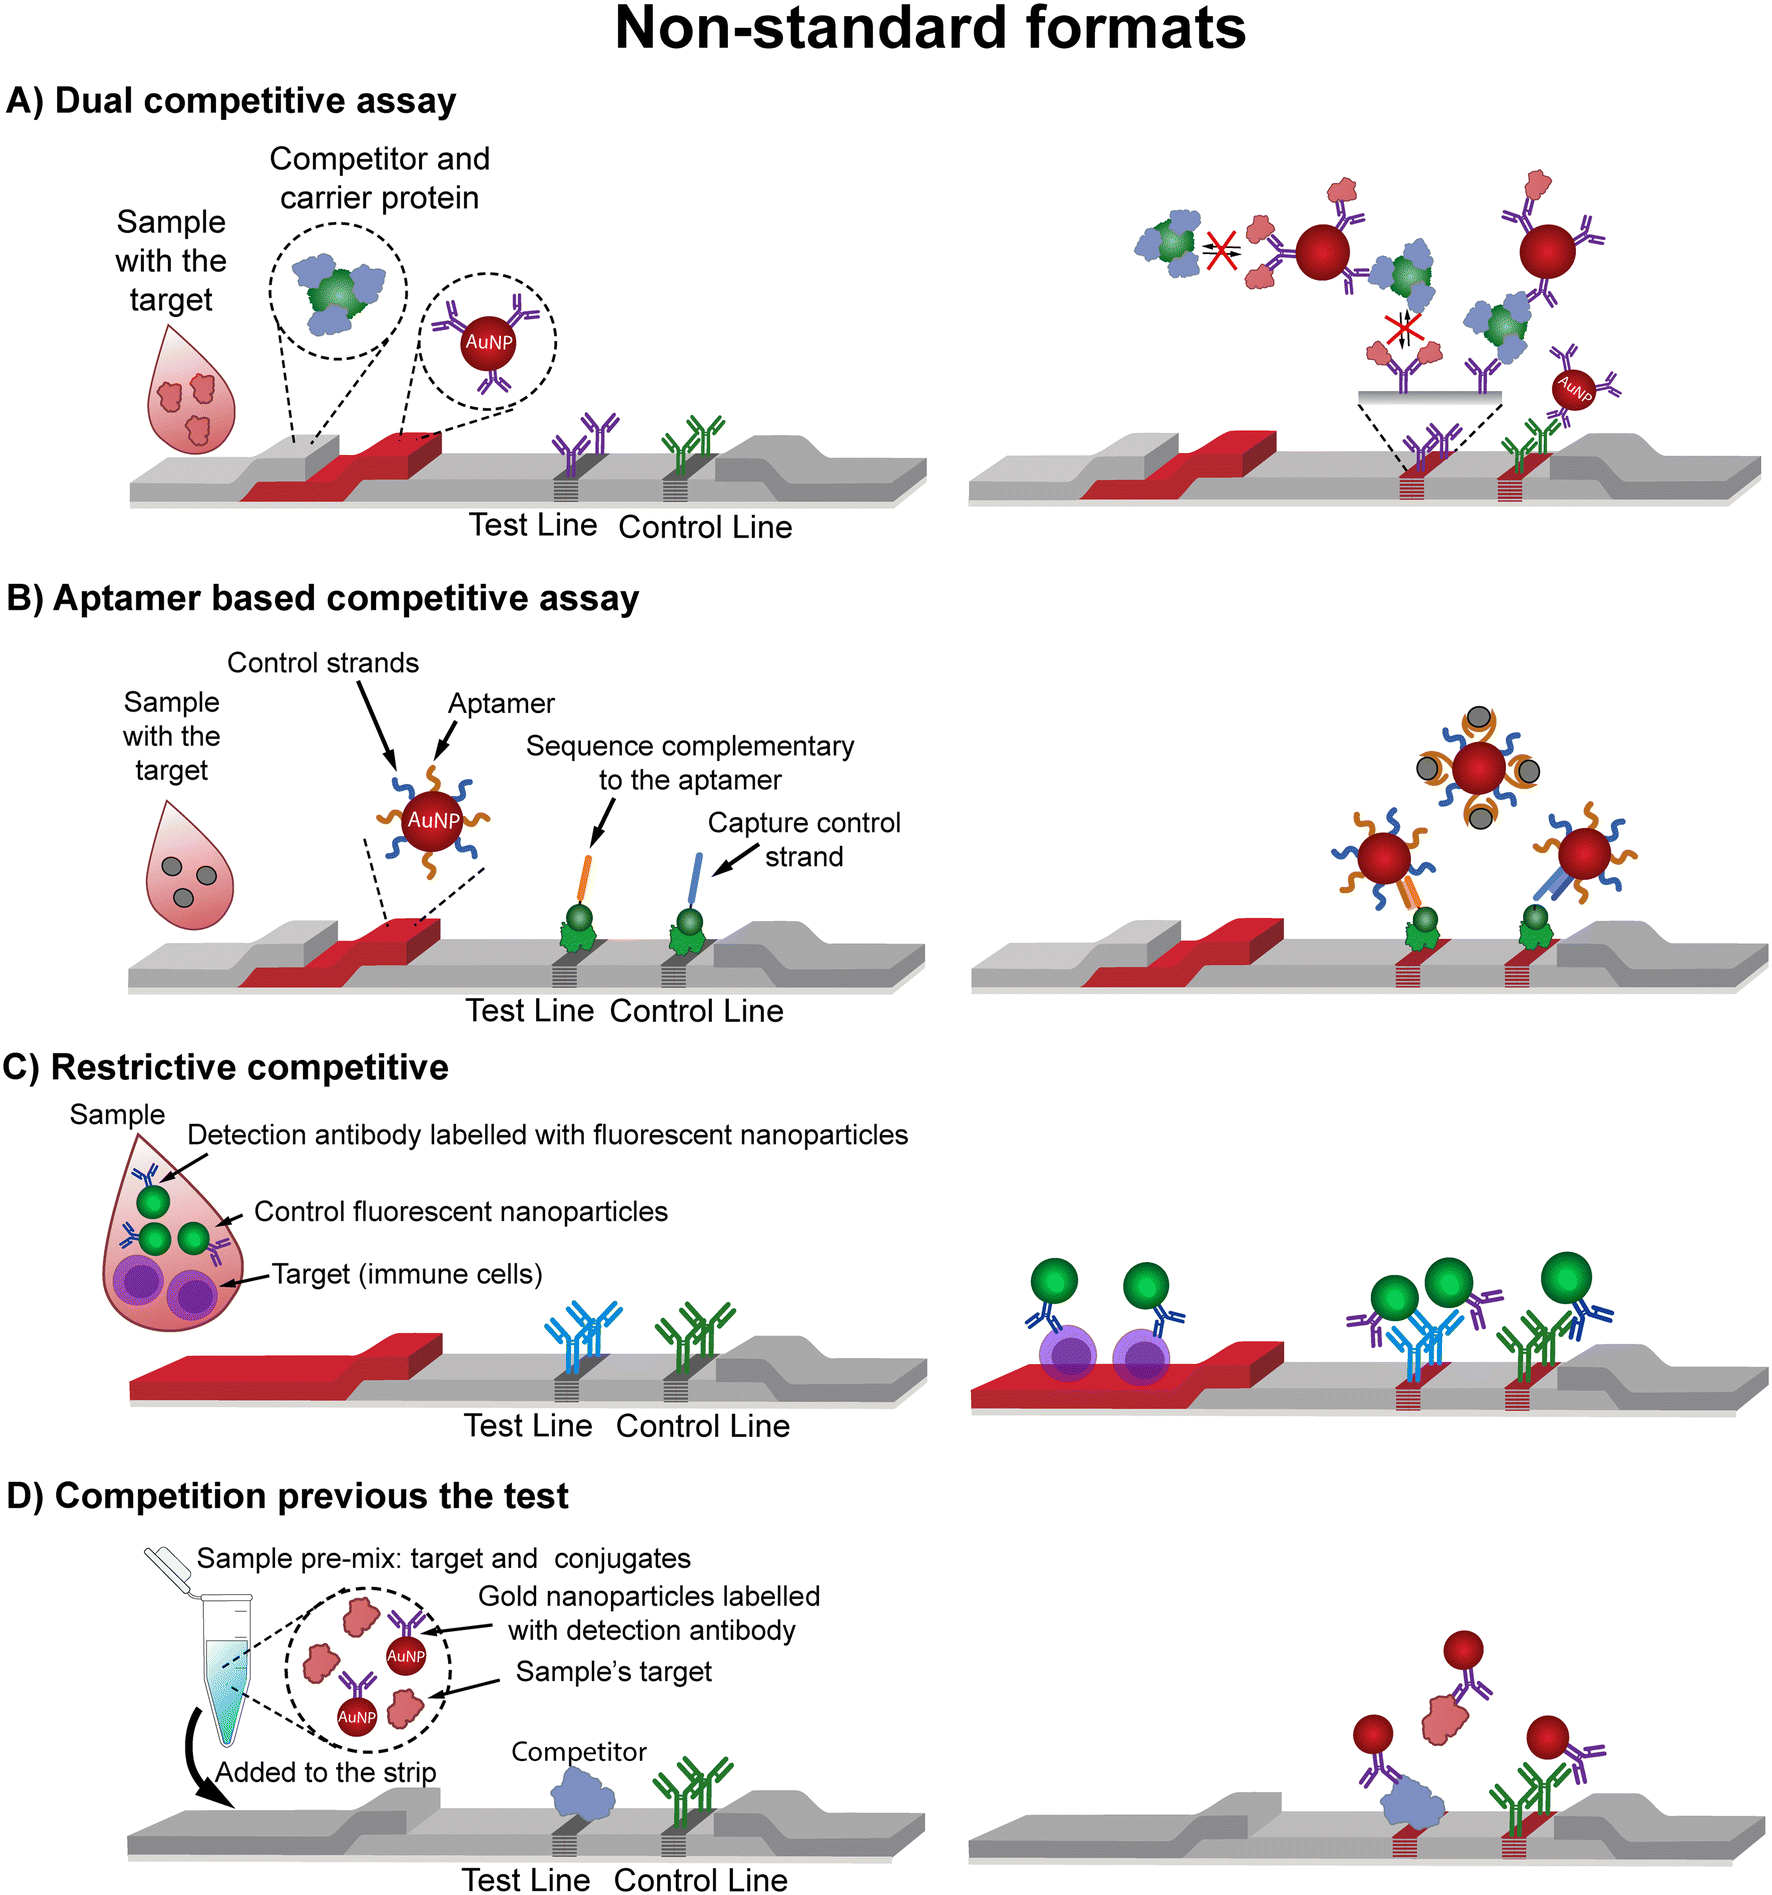 | ||
| Fig. 3 Non-standard competitive assay formats. (A) In a double competitive assay the use of a conjugate carrier multiple competitor allows the formation of an immune-sandwich in the absence of the target molecule.14 (B) In the so-called aptamer-based competitive assay15 the competitor molecule is a nucleic acid strand complementary to the aptamer. (C) Restrictive competitive assays16,17 detect full cells, which retain the nanoparticle in the conjugate pad due to their large size, therefore preventing the formation of the TL. (D) It is also possible to perform the competition before the test by mixing the sample and the nanoparticle conjugate before adding them into the strip.18,19 | ||
• Aptamer-based competitive format exploiting their nucleic acid nature: this competitive assay involves aptamers or nucleic acid sequences that bind to specific targets with high affinity and specificity. However, instead of using a target analog as the competitor, DNA molecules complementary to different regions of the aptamer are employed for this purpose. These complementary DNA sequences are designed in such a way that the aptamer acts as a bridge between them. Typically, one of these sequences is immobilized on the detection line (capture DNA) and the other labelled free in solution (detection DNA) along with the aptamer and target. In this approach, target molecules bind the aptamers, sequestering them and therefore preventing them from forming a complex with the detection and capture sequences, resulting in a non-visible signal at the TL (Fig. 3B). Consequently, the signal intensity inversely correlates with the concentration of the target analyte.15,20–28 In aptamer-based LFAs, ensuring sufficient exposure of the aptamer's binding pocket is critical for maintaining high affinity and specificity. The hybridization and folding properties of aptamers must be carefully optimized to prevent non-specific interactions and ensure efficient target capture.
• Restrictive competitive: this format restricts the competition of target molecules by limiting the access of larger molecules or by creating steric hindrance and entrapping them in specific compartments.16 This approach requires targets of considerable size such as lymphocyte cells that are too bulky to pass from the conjugate to the detection pad. The assay utilizes a labelled antibody against the target (detection bioreceptor), and a secondary antibody (capture bioreceptor) against the detection antibody (Fig. 3C). The detection antibodies bind the target in the conjugate pad but remain stuck due to the size of the target itself, never reaching the detection line. In the absence of the target the detection antibodies flow easily along the membrane and are captured in the detection line generating a signal.16,17 To ensure optimal performance, the membrane pore size and capillary flow rate must prevent unintended target migration while allowing free detection antibodies to move. The detection bioreceptor must bind strongly to the target for effective retention in the conjugate pad.
• Competition previous to the test: in this setup, the target and a labelled competitor are mixed with the detection bioreceptor during a pre-incubation step, before they flow through the test strip (Fig. 3D). This allows the binding competition to happen in an optimized environment, enhancing the sensitivity and precision of the test. This approach is generally used in two applications: i) the detection of amplified nucleic acid targets and ii) when the target analyte and a BSA-modified competitor compete for antibodies in solution.18,19 For optimal performance, the pre-incubation buffer must maintain the pH and ionic strength needed for effective target–competitor interactions.
1.3. Considerations of assay mechanisms and implications in the design
According to our analysis, a significant 81% of competitive LFAs developed use the indirect format. Conversely, the direct format is less common, representing only 9% of developed LFAs. The remaining 10% of competitive assays are represented by the non-standard types. The decision of which strategy to employ depends on a combination of practical, experimental and economic considerations. A plausible explanation of indirect assays' domination in the literature might be related to the assay's working principle and superior performance, specifically the fact that the labelled detection bioreceptor can interact with the target before reaching the TL, where the competitor has been previously printed. This short “incubation” gives priority to the analyte to bind to the capture bioreceptor in solution rather than the printed competitor,29 limiting the latter to the remaining bioreceptor's free binding sites and therefore resulting in more sensitive response. On the contrary, in the direct method, the target and the labelled competitor reach the TL almost simultaneously, not giving any preference nor advantage to the target for interaction with the available capture bioreceptor's binding sites. Moreover, as each label is generally functionalized with multiple competitors, the overall complex would exhibit greater avidity compared to individual targets. In these cases, if one competitor molecule is displaced from the binding site, all other competitors on the label are in close enough proximity to readily bind to the bioreceptor. Overall, this would lead to a less sensitive device. Regarding non-standard competitive formats, the mechanism varies. In the dual competitive format, similar to the indirect approach, the competition occurs on the conjugation pad. This arrangement allows a short incubation period where both the competitor and the target compete for the binding sites on the detection bioreceptor. In contrast, in aptamer-based competitive LFAs, the target molecule modifies either the detection or capture bioreceptors, impairing their ability to bind to each other and thus generate a signal.Beyond the technical and biochemical aspects of competitive LFAs, economic considerations play a crucial role in assay development. The choice of bioreceptors, labeling strategies, and detection methods can significantly impact overall expenses, influencing not only material costs but also production scalability and accessibility. For instance, bioreceptor selection involves a trade-off between performance and cost. Monoclonal antibodies provide high specificity and reproducibility but come at higher costs compared to polyclonal antibodies, which, although less expensive, are less consistent and specific. As an alternative, aptamers can be considerably cheaper than antibodies once selected, particularly when utilizing unmodified DNA aptamers, allowing for cost-effective mass production. However, the initial aptamer selection process may be as expensive as or even costlier than antibody production, especially when chemical modifications are required to enhance performance. Nevertheless, aptamers offer greater temperature stability, potentially reducing storage and transportation costs by eliminating or decreasing the need for stringent temperature controls. Competitor costs represent another significant economic factor. Many molecules employed as competitors, especially certain proteins, are expensive, making efficient, high-yield labeling strategies critical to ensure economic viability. Labeling methods also significantly influence final test production costs. Gold nanoparticles (AuNPs) represent the most cost-effective option due to their inexpensive and straightforward fabrication processes, well-established commercial availability, and minimal requirements for signal detection, such as naked-eye observation or simple colorimetric measurements. In contrast, labels such as quantum dots, europium nanoparticles, magnetic nanoparticles, and fluorescent dyes, although offering enhanced sensitivity, generally involve higher material costs, complex production methods, and a less mature supply industry. These factors increase the per-strip cost and often necessitate specialized reading platforms, further contributing to overall expenses. Ultimately, developers must balance affordability with performance demands, as increased sensitivity typically requires more expensive bioreceptors, advanced labeling strategies, and specialized detection systems.
2. Theoretical modelling
Traditionally, biosensing assay design and development have predominantly been approached from an experimental standpoint.5,30–33 Despite the publication of remarkable research studies and reviews addressing theoretical modelling and their experimental validation, a significant gap still exists between both fields. We particularly recognize the importance of understanding and approaching competitive assays from a modelling perspective due to their less intuitive outcomes and the consequent optimization challenges. In this section, our aim is to provide comprehensive insights to assist other researchers in the field in applying basic modelling to assist the development and optimization of their assays, bridging the gap between theoretical and experimental approaches.2.1. Introduction to competitive assay models
Taking a standard direct competitive assay between a target, a labelled competitor and a bioreceptor in solution, we will explore this system from an analytical modelling point of view that will allow us to relate the general parameters involved in the competitive assay and their corresponding outcomes, such as the critical optimization of the amounts of labelled bioreceptor and its effect on the limit of detection (LoD).The detection or recognition event in a sensing system can be understood as the reaction between a recognition element, or bioreceptor, and its target, or ligand, and may be simplistically described by the law of mass action:12
 | (R1) |
The equilibrium constants, association (Keq) and dissociation (Kd), represent the ratio of bound to unbound analyte and antibody at the equilibrium, and can be described as the ratio of kinetic constants kaT and kdT:
 | (1) |
 | (2) |
 | (3) |
 | (R2) |
 | ||
| Fig. 4 Modelling of a direct competitive assay using an analytical expression. (A) Schematic representation of the selected system, the main components contained and relevant parameters. In this study, the concentration of the labelled target (competitor, C) and bioreceptor complex (C–R) determines the amount of signal in the assay, therefore the complex's concentration can be understood as an indicator of the assay's output signal. Panels B to D demonstrate how the system behaves in different scenarios: (B) study of the Kd ratio: changing C's dissociation constant (KdC) while keeping constant the T's dissociation constant (KdT), bioreceptor's concentration [R]0 and initial competitor's concentration [C]0; (C) [R]0, KdT and KdC were kept constant at increasing values of [C]0; (D) [C]0, KdT and KdC kept constant at increasing values of [R]0. | ||
The competition between C and T for the R is governed by the specific KdT and KdC constants. Their effect is evidenced when maintaining all other parameters constant and increasing R's affinity for C and thus decreasing the KdC (Fig. 4B). Low affinities for C result in small signal changes, as scarce amounts of C manage to remain attached to the R. However, small concentrations of T will easily displace the C and induce the signal loss, rendering the assay very sensitive to very low amounts of T. When increasing the affinity, C–R complex formation is favored, hindering the T binding to R, rendering the system less sensitive to low levels of T and big signal changes. Ideally, a slightly reduced affinity for C would enhance the assay's sensitivity while allowing a good signal change. However, tuning the KdTvs. KdC ratio becomes a complex challenge far from trivial to engineer. Generally, the label modification on C does not have a serious impact on the KdC meaning that, essentially, both constants can very often be considered equal.
Generally, typical parameters, with significant impact on the assay's performance that are more feasible to engineer/tune are the competitor's initial concentration ([C]0) and bioreceptor's initial concentration ([R]0). To illustrate their impact on the assay we set KdTvs. KdC to be equal to 1 × 10⁻¹⁰ M and explored the response dependence of [C]0 and [R]0 in the model (Fig. 4C and D). Low amounts of C0 result in small signal changes, since few C molecules will occupy R0 binding sites (Fig. 4C). Optimal scenarios are at C0 above the R0 to ensure the full occupancy of the binding sites, a situation very susceptible to the presence of T, resulting in very sensitive detection. In contrast, an excess of C0, higher than the R0, will have a detrimental effect on the assay sensitivity, as is evidenced by the binding curve shifting towards higher T values (Fig. 4C), where the high C0 forces the C–R formation, requiring more [T] to be detected.
In the last scenario, keeping a constant [C]0 and varying [R]0 (Fig. 4D) demonstrate that increasing [R]0 concentrations allow more C–R formation and therefore higher initial signal while retaining good sensitivities (Fig. 4D). A further increase of [R]0 results in further shifting of the binding curve towards higher T values, and the subsequent loss in sensitivity. This phenomenon is easily explained by the excess of available binding sites in the R0 with regard to total C0. That means that T will find plenty of binding sites available in R0 before competing with C, allowing T–R formation without affecting C–R. Another observed phenomenon is the steeper transitions in the binding curves at high [R]0 concentrations, not typical Langmuir isotherms as in other panels. This is caused by the depletion regime, in which the bioreceptor's concentration is higher than its dissociation constant.36 Here, the model demonstrates the importance of the [R]0 and how a simple excess of it can negatively affect the resulting assay, inducing a significant loss in sensitivity.
Overall, this general model demonstrates the delicate balance among the different components involved in competitive assays, meaning that an excess of one component can be detrimental to the sensitivity of the assay, and therefore increase the LoD of the test. The tight balance of components' concentrations also gives the opportunity to tune and shift the linearity of the system to better fit the specific needs of a specific sensing scenario. For instance, when maximized sensitivity is not the ultimate end, but the detection in a high [T] range, then simply by increasing either [R]0 or [C]0 the binding curves will shift to higher [T] allowing the system response to better align with the desired detection window.
2.2. Models for lateral flow competitive assays
In the specific case of LFA strips, the assay takes place on a porous matrix under a main capillary flow initiated by the addition of a liquid sample onto the sample pad. Therefore, the biochemical reactions related to the target's recognition and the signal generation occur while reagents migrate towards the TL and CL, and not in a homogeneous static mix at equilibrium.37,38 Furthermore, other aspects need to be taken into account, such as the multivalency of conjugates, as when using NPs more than one recognition element can be loaded, increasing significantly the number of binding sites. These factors introduce other layers of complexity in the system that the theoretical models must account for.39Approaches to address mathematical description/simulation of lateral flow immunoassays can be divided into two main categories: analytical modelling (mathematical modelling) in which the systems are described using sets of exact equations or numerical modelling (computational modelling) in which solutions are approximated through step-by-step numerical calculations accounting for parameters in specific scenarios.35
The analytical approach offers a better understanding of the detection systems and the functioning, but this approach requires several approximations and is more complex to develop. Therefore, few mathematical models have been described in the literature for competitive LFAs. One of the first models detailed is that reported by Qian and Bau in the early 2000s40 where they built a model approximating for equilibrium conditions, which are only fulfilled at high target and high affinity bioreceptors. Years later, Sotnikov and co-workers41 proposed an improved version of the mathematical model that accounted for the non-equilibrium nature of LFA interactions. Other studies in the field developed mathematical models with a special focus on implications of the flow, and how they affect the final result of the assay42 or other models in which special weight was given to the reporter label.43
The numerical or computational modelling, in contrast to the analytical model, allows for the consideration of more parameters in the system while requiring fewer approximations. This comes at the cost of requiring the input of various empirical parameters or their potential ranges. However, due to its versatility and superior applicability to routine experimental work, numerical modelling clearly dominates the literature.39 In particular, numerical modelling outperforms analytical models in capturing the complexities of flow-related parameters within assays. In addition, numerical modelling leverages advanced computational techniques to incorporate a broader range of variables and interactions.44 This allows numerical modelling to simulate complex flow dynamics more accurately, leading to better and more precise predictions.45,46
2.3. How to exploit the theoretical models when developing a competitive lateral flow assay
Significant efforts to adapt theoretical models to improve design, optimization, development and performance prediction of LFAs39,47 can be found in the literature. Some modelling approaches have even been developed to address very specific questions such as determining the optimal TL location and sample volume.48 However, current assay development and optimization still rely heavily on experimental and empirical trial and error approaches, failing to fully leverage the advances in competitive LFA modelling. This gap needs to be addressed by systematically making these theoretical models more accessible to researchers developing the LFAs and progressively integrating them as a valuable tool throughout the development process.To evidence the utility of mathematical models in competitive LFAs we selected an indirect competitive lateral flow immunoassay as a testbed scenario. To study the implications of diverse parameters we utilized the model developed by Sotnikov and co-workers.41 In this indirect competitive format (Fig. 5A), the antibody R labelled with the gold NP responsible for the assay's signal is free in solution to flow along the strip. The target in the sample T competes with the competitor immobilized on the detection line C for the binding sites of R. Binding sites in R unoccupied by T will bind C generating a signal at the detection line. In this context we consider the formation of C–R as the signal obtained in the assay. Utilizing the analytical model above mentioned (see Section S3†) it is possible to explore the effects of tuning different parameters in a competitive LFA.
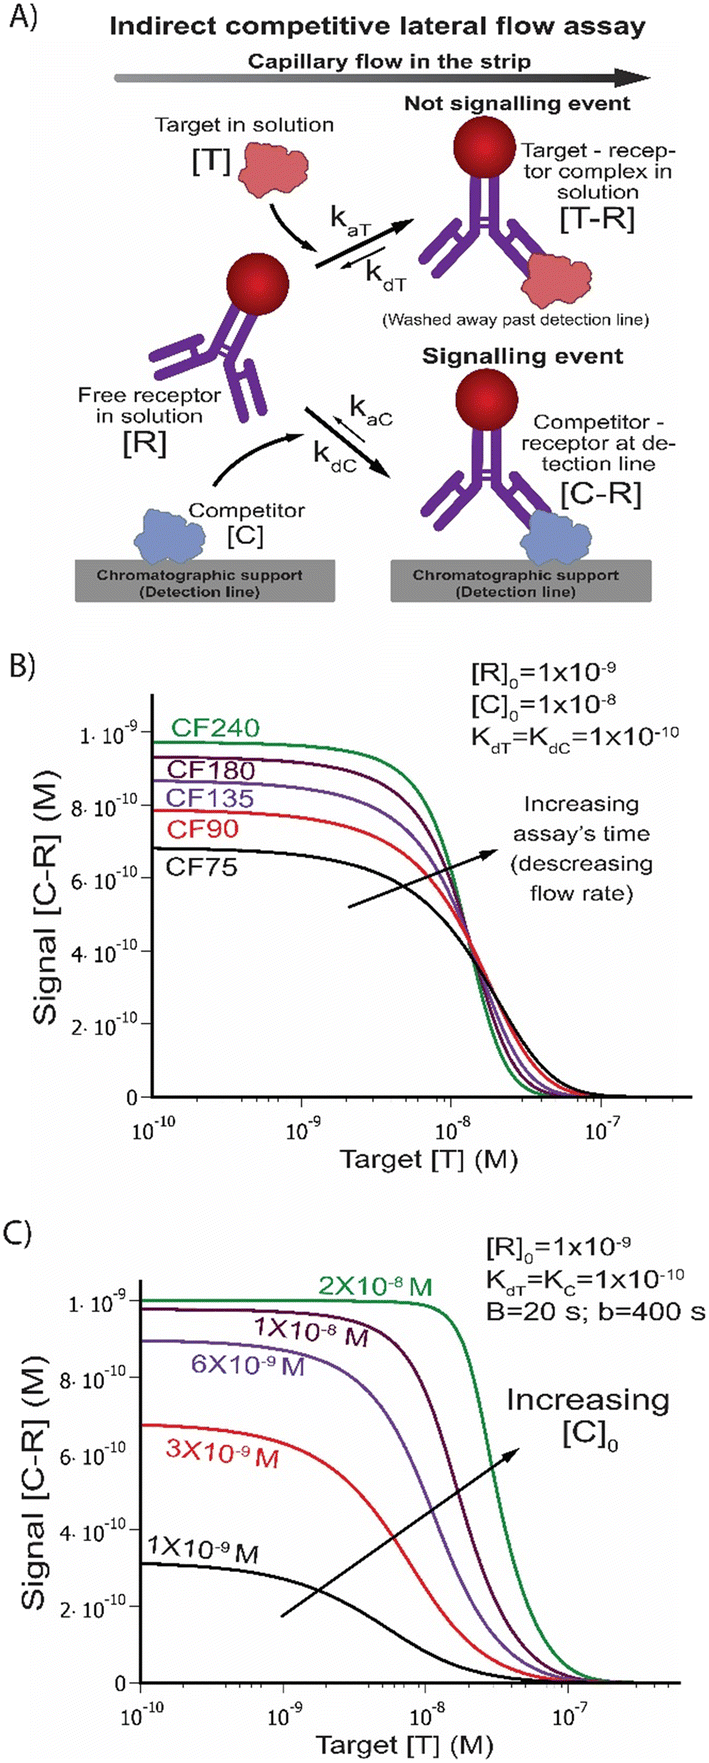 | ||
| Fig. 5 Modelling of an indirect competitive assay using an analytical expression reported by Sotnikov and co-workers.41 (A) Scheme of reactions involved the indirect competitive LFA using a labelled antibody R in solution as a conjugate and the competitor immobilized on the detection line C. kaT and kaC are the kinetic association constants for T and C respectively, and kdT and kdC are the kinetic dissociation constants for T and C. (B) Implication of the capillary flow (CF) from detection pads of different porosity: higher porosity substrates (CF75, faster assay) and lower porosity (CF240, slower assay). Panel (C) displays the effects of different [C] in the detection line. B stands for the migration time from sample addition until the detection line, b is the total duration of the assay starting. | ||
The capillary flow (CF) that depends on the detection pad's porosity was explored (Fig. 5B) by translating CF into assay time, as higher porosity (lower CF number) results in faster assays (shorter assay time), leaving lower times for reagents to diffuse and interact. Conversely, lower porosity detection pads (higher CF number) present slower assays allowing more time for reagents to diffuse and interact. The model demonstrates the compromise of the total signal achieved and flow speed; this means that a fast flow (CF75) results in a low signal, due to the limited C–R formation achievable in the reaction time given. Contrarily, the extra time allowed by the CF240 detection pad favors C and R interaction, allowing more efficient C–R formation, with the extra time also increasing the efficiency of T–R, requiring less T to result in complete signal depletion as compared to lower CF. Subsequently, we evaluated the effects of different C on the detection line (Fig. 5C). In this scenario, too low amounts of C result in highly sensitive assays with low signals, hindering the reading of results. Higher amounts of C allow stronger signals, however above certain thresholds it has a negative impact on the sensitivity, as the equilibrium is shifted by the excess of C, requiring even more T to compete for the binding sites on R. As specific examples, Nalumachu and co-workers reported a thorough analysis of a numerical model of a competitive LFA for detection of cortisol,11 in which the authors incorporated the transport and reaction phenomena occurring in the assay strips. With this approach, they estimated the optimal competitor concentration and flowing regimes that maximize the signal on the test line. In another example, Gasperino and colleagues developed a numerical model to assist the tuning of the assay's response to the desired detection range, ensuring the alignment with the detection requirements of the target,37 such as modelling how to tune the visual detection threshold, the dynamic range, etc. In complementary work, Xia G. and co-workers have developed a numerical model to assess the effect of sample volume on the sensitivity of a sandwich test to detect pepsinogen.49 In this work, the authors used fluorescent microspheres at a constant target concentration, a situation that can be extrapolated easily into a competitive assay, to demonstrate that a sample volume lower than 43.9 μL induced a flow that allows sensitive detection.
In summary, incorporating a theoretical model at an initial stage in LFA development can substantially improve and simplify the general process reducing the experimental steps and trial-and-error optimizations. Although theoretical models cannot entirely substitute for the assay development, since final experimental validation and ultimate parameter tuning experimentally are always required, they can definitely reduce the experimental working times, cut the reagent expense and help to guide and develop complex and more sophisticated assays.
3. Classification of competitive lateral flow assays according to the target properties
Given their ability to generate a measurable signal employing a single type of bioreceptor, competitive LFAs are known for the detection of “small” molecules and individual epitopes. However, they can also be developed for the detection of full-size antigens when the use of an immune-sandwich is not feasible. This trend is further driven by the high and rising costs of antibodies, encouraging the use of single-antibody systems to reduce overall assay expenses. In Fig. 6A we show the distribution of the different target types and their molecular weight (MW) depending on the type of competitive format. In Fig. S1,† we present detailed percentages of studies that have targeted different categories, including small molecules (<1 KDa), proteins (1–200 KDa) and cells/spores (>200 KDa), providing further insight into the typical size preferences in competitive LFAs. | ||
| Fig. 6 Targets and limits of detection: (A) molecular weight distribution of different types of targets, organized by the type of competitive format. This figure presents the MW (kDa) distribution of various targets, categorized along the x-axis. The scatter plot differentiates target types based on the assay format: direct (red circle), indirect (green triangle), and non-standard (blue square) (n = 154). (B) Comparative analysis of competitive LFAs focusing on the limits of detection across different targets and competitive formats. (B1) The boxplot shows the LoD values for indirect competitive LFAs grouped by target type. For each target, the boxes represent the range of LoD values observed (n = 115), being 1 × 10⁴ ng mL−1 the highest LoD, which corresponds to the detection of a protein, specifically hLF,50 and 0.1 ng ml−1 the lowest LoD, which corresponds to the detection of a hormone, specifically cortisol.51 (B2) The boxplot shows the LoD values for direct competitive LFAs, sorted by type of target (n = 8), where the highest reported value is 1.25 × 10⁶ ng mL−1, in allergen detection assay, per a 2 and 9,52 and the minimum value is 1.6 × 10⁻⁵ ng mL−1, a detection assay for the hormone ft4.53 (B3) The plot displays the LoD values for LFAs using non-standard competitive formats, also sorted by type of target (n = 14), being 100 ng mL−1 the highest LoD for the antibiotic ampicillin,25 and 2.25 × 10⁻⁴ ng mL−1 the highest LoD in a test for the detection of tumor maker PCA3.54 | ||
Looking in particular at the detected target's size (Fig. 6A) we found that: direct competitive LFAs have been employed to detect targets with sizes between 0.112 kDa and 80 kDa,50,55 with a median MW of 0.883 kDa; indirect competitive LFAs have been employed for the detection of targets with sizes between 0.126 kDa and 300 kDa,53,56 with a median MW of 0.330 kDa; and non-standard competitive LFA formats have been employed to detect targets between 0.200 kDa and 32 kDa,17,23 with a median MW of 0.324 kDa. Our analysis suggests that any of the three formats have been successfully employed in the detection of a wide range of target sizes. Of note, all three formats have been predominantly employed for the detection of targets below 1 kDa (Fig. S4†).
When examining the type of target (Fig. 6A), we observed that direct competitive LFAs have been mostly employed for hormone (4 assays) and protein (6 assays) detection; indirect competitive LFAs have been mostly employed for drug (43 assays, 17 of them are antibiotic) and toxin (33 assays) detection; non-standard competitive LFA formats have been mostly employed for drug (6 assays) and toxin (4 assays) detection. While apparently any of the three formats can be used to detect any type of target, we found that for microorganism (Salmonella sp., B. anthracis spores and A. brassicae spores)57,58 and antibody59 detection the indirect format has mainly been used. In contrast, targets like CD8 glycoprotein17 and HIV RNA18 have been detected exclusively using the non-standard formats. Pesticides have been detected either with the indirect and the non-standard format.
4. Classification on the basis of the assay's limit of detection
Besides the size and type of analyte, the LoD represents another relevant criterion often used to compare sensing strategies. In this manuscript, we have reported the LoDs as they were reported in the original studies (Fig. 6B), regardless of the method used to calculate them, with the use of the value of the blank plus three times its standard deviation being the most extensively used and accepted method for the calculation of the LoD. Analyzing 137 assays, we found that: direct competitive LFAs' lowest LoD reported was 0.23 pg mL−1 or 1.02 × 10⁻¹⁴ M for tumor biomarker PCA3 detection,54 and the highest LoD was 10 μg mL−1 or 1.25 × 10⁻⁶ M for human lactoferrin;50 the indirect competitive LFAs' lowest LoD was 0.016 pg mL−1 or 2.06 × 10⁻¹⁴ M for free thyroxine detection,53 and the highest LoD was 1.25 mg mL−1 or 5.44 × 10⁻⁵ M for American cockroach allergens.52 Finally, using the non-standard competitive format, the lowest LoD was 0.6 pg ml−1 or 1.83 × 10⁻¹² M for the toxin AFM1,19 while the highest LoD was 100 ng mL−1 or 2.7 × 10⁻⁴ M for ampicillin.25Although we are aware that the comparison of the LoD of devices specific for different targets is a mere reviewing exercise, we believe that it still provides relevant information. For example, the LoD's median values for indirect, direct and non-standard formats are 1.76 ng mL−1 (3.18 nM), 0.55 ng mL−1 (1.69 nM) and 0.5 ng mL−1 (1.49 nM) respectively, demonstrating a tendency of direct and non-standard type assays to achieve lower LoDs. Moreover, when considering analyte sizes, we observed that the smallest median LoD values correspond to the larger analytes. Specifically, analytes larger than 200 kDa exhibited a median LoD of 53.3 fM, analytes between 1–200 kDa showed a median of 2.42 nM, and analytes smaller than 1 kDa had a median LoD of 2.96 nM LoD. In another note, when considering the analyte's properties (Fig. 6B), we found the following: for drugs (total median: 1 ng mL−1, 1.55 nM); direct: 0.2 ng mL−1 (0.7 nM), indirect: 1.2 ng ml−1 (3.2 nM), non-standard: 1.6 ng ml−1 (4.2 nM) being the smallest median LoD for the direct format. For hormone targets (total median: 0.8 ng mL−1 (2.54 nM); direct: 0.3 ng mL−1 (0.8 nM), indirect: 1 ng mL−1 (3.18 nM), non-standard: 1.57 ng mL−1 (5 nM) with the direct format showing again the lowest LoD median. For metal ion targets (total median: 2 ng mL−1 (4.19 nM); direct: 3 ng mL−1 (3.4 nM), indirect: 8.65 ng mL−1 (36.4), non-standard: 0.56 ng mL−1 (2.8 nM) and the lowest median LoD corresponds to the non-standard competitive formats.
4.1. Technical innovations enabling lower LoD values
Recent advancements have significantly improved LoDs in competitive LFAs. Particularly 31 of the studies reviewed use specific signal amplification strategies to improve the sensitivity and the LoD. Some of these methods include surface-enhanced Raman scattering (SERS),54,60–64 gold nanobeads,65–67 quantum dots,67,68 and fluorescence quenching,23,69,70 which enhance signal intensity and reduce background noise. Enzymatic amplification, such as horseradish peroxidase (HRP)-mediated TMB and luminol reactions,71–76 increases the assay's detectability by catalyzing colorimetric or chemiluminescent signals. Additionally, silver enhancement techniques improve the visibility of nanoparticle-based detection by depositing metallic silver around labels.77–79 Other innovative approaches, such as isothermal amplification,18 recombinase polymerase amplification (RPA),80 and carbon nanotube electrodes,81 further enhance sensitivity by increasing reaction efficiency or improving electrochemical readouts.Specifically, the lowest LoD for the indirect competitive LFA53 was 0.016 pg ml−1 (2.06 × 10⁻¹⁴ M) for thyroxine (T4), and a dynamic range spanning three orders of magnitude. This remarkable sensitivity was attained employing a bifunctional ligand (T4–biotin) in combination with magnetic labels and magnetic reading of the test. This bifunctional ligand is a molecular entity that can simultaneously bind to two different sites. Thanks to the biotin the bifunctional ligand can be captured with high affinity and efficiency by streptavidin present on the TL, while the T4 side will bind the anti-T4 Ab (Ab–MB) that are labelled with magnetic NPs. The T4 target in the sample competes with the T4–biotin for the Ab–MB complex.53 The magnetic NP reading enabled robust and specific detection, leveraging volumetric quantification via magnetic particle quantification (MPQ) readers.
The lowest direct competitive reported LoD was 0.23 pg mL−1 or 1.02 × 10⁻¹⁴ M is for the genomic tumor biomarker PCA3.54 This low detection limit is primarily attributed to the use of a SERS detection. This increased sensitivity is achieved through the competitive hybridization interaction between the target DNA and DNA-labelled SERS reporter nanotags, which allows for the precise quantification of the target DNA based on Raman peak intensity changes on the TL.54
The lowest LoD reported in non-standard competitive formats was 0.6 pg mL−1 or 1.83 × 10⁻¹² M for aflatoxin M1 (AFM1) and chloramphenicol (CAP).19 The assay benefits from a pre-incubation step that enhances sensitivity, combined with anti-BSA antibodies to allow universal detection of multiple analytes on the same test strip.19
As an illustrative example, for the analyte aflatoxin B1 (AFB1), detected using three distinct detection formats – direct, indirect and non-standard (aptamer-based) – the corresponding LoD values were 5 ng ml−1 (16.01 μM),82 3.87 ng ml−1 (12.39 μM) (mean value)70,75,83–88 and 1 ng ml−1 (3.20 μM),20 respectively. This comparison underscores the importance of assay design in optimizing sensitivity for specific applications, paving the way for more effective and tailored diagnostic solutions.
While these technical innovations have significantly improved the limit of detection (LoD) in competitive LFAs, their real-world application presents several challenges that must be considered when developing cost-effective and scalable assays. Many high-sensitivity techniques, such as SERS, MPQ, and enzymatic amplification, require specialized reagents and complex protocols, increasing costs and reducing the simplicity that makes LFAs ideal for point-of-care diagnostics. Additionally, these methods often demand fluorescence, Raman, or magnetic readers, limiting their feasibility in low-resource settings despite the development of portable detection devices. Lastly, scalability remains a concern, as nano-based and enzymatic amplification approaches require precise reaction conditions and batch-to-batch consistency, posing challenges for large-scale cost-effective commercial production. Therefore, future efforts should focus on integrating high-sensitivity methods into practical, scalable, and affordable LFA designs.
5. Classification according to samples used
Having analysed the competitive LFAs employed for a wide range of different targets, we analyzed the types of samples and pretreatments. Here, we consider a pretreatment any preparatory step executed prior to testing a sample, including purification, concentration, dilution, or extraction of a specific component with the aim to minimize any matrix effect and maximize the signal-to-noise ratio.89 In the following section we discuss the types of samples (Fig. S2†) we identified upon reviewing 159 assays and when appropriate what type of pretreatment they required.5.1. Food and water samples
Solid food (or feed) represents the most commonly examined sample type in competitive LFAs, as shown in 59 studies. Given their solid state, these foods invariably require some form of pretreatment as the targets need to be extracted to a liquid phase, which is a basic operating need of LFAs assays. Corn is the most frequently analyzed food,24,66,75,86–88,90 primarily targeting the toxins Fumonisin type B and Aflatoxin type B1. To a lesser extent a diverse array of other matrices including eggs, fruits, meats, sea food, and peanuts are analyzed in competitive LFAs. Given the considerable differences in the type of solid food analyzed, the ideal pretreatment must be thoroughly optimized after carefully considering physicochemical properties of both the sample and the analyte.88 Basic pretreatment methods for solid food samples include grinding, cutting, or pureeing, followed by dilution and/or centrifugation.14,15,65,67,75,86,91–93 More complex procedures may involve additional steps such as sonication and extraction using various solvents.24,82,85,94–101Liquid foods, including milk, are the second most frequent type of sample employed in competitive LFAs (26 studies). This type of sample often requires simpler or no pretreatment.74,102–104 Typically, the preparation of these samples generally involves only a dilution and/or centrifugation step.55,105–109 Dilution helps to minimize the matrix effect to acceptable levels for LFA detection and to adjust the analyte concentration to levels suitable for LFA detection. Centrifugation helps in removing contaminants such as solid particles and, specifically in milk samples, separating from the lipid layer110–112 to ensure clearer and more homogeneous samples.
Water samples (11 studies) do not generally require pretreatment given the lack of major contaminants, making water a simple and homogeneous matrix as compared to other types of samples. Consequently, water samples can often be tested directly in competitive LFAs. However, when required, pretreatment of water samples may involve simple steps such as filtration, to remove suspended particles and impurities that could interfere with the analytical process. For example, in the case of hospital wastewaters,27 which contain various impurities such as particles, proteins, metal ions, or nucleases, pretreatment is essential to prevent the blockage of micropores in the assay. In one of these specific examples,27 the sample was first centrifuged, and the supernatant was then diluted in trichloroacetic acid, to precipitate proteins and other macromolecules. Following another round of centrifugation, the final supernatant was collected and filtered.26 Alternatively, using an appropriate sample pad for filtration could help avoid the need for extensive pretreatment by effectively removing impurities and preventing micropore blockage during the assay.
5.2. Bodily fluids
Beyond food, milk and water samples, the articles reviewed predominantly focused on bodily fluids, with substantial attention to urine (19 assays), serum (13 assays), blood (9 assays), saliva (8 assays) and plasma (6 assays).For point-of-care clinical applications a small volume of whole blood is the sample of choice since it can be obtained directly with a fingerpick. We identified 9 studies that analyzed whole blood through competitive LFAs, using two main approaches. One approach consists in the integration of a blood filter pad in the strip itself, which facilitates the separation of plasma from the blood cells without the need for any specific pretreatment,78 decreasing the viscosity of the samples and minimizing the non-specific background caused by the red color of red blood cells. It is important to note that this limits the assay to the measurement of extracellular biomarkers. The other approach consists in pretreating the blood sample before applying it to the strip. While this can be applied to any type of biomarker, this is essential for intracellular biomarkers that need to be extracted from blood cells by lysis. In order to achieve this, processes including extraction, dilution, centrifugation, and the use of specialized reagents such as radioimmunoprecipitation assay (RIPA) buffer, along with protease and phosphatase inhibitors are often employed.113–115
Serum and plasma present an initial processing that is intrinsic to their preparation, involving the separation of these components from whole blood. This includes centrifugation, which is crucial for removing cellular components and yielding clear serum or plasma. The pretreatment methods we discuss apply after serum or plasma has been obtained. Subsequent processes may include additional centrifugation to concentrate the samples, dilution for further analysis, filtration to remove remaining particulates, or chemical treatment to stabilize the samples.53,59,116–120
Urine and saliva present a particularly attractive choice compared to the other body fluids previously mentioned as they can be obtained non-invasively, quickly, and easily. This significantly reduces patient discomfort and anxiety, which increases patient adherence to testing protocols (a crucial aspect for applications requiring a recurrent testing regime such as managing chronic conditions or ongoing health assessments).121 Looking at their pretreatments, in most cases, urine samples can be used directly as collected122–130 or diluted.71 However, there are instances where urine samples may require a degree of pretreatment, most commonly centrifugation (to remove sediments) or pH adjustment (to ensure correct biorecognition).126,131Saliva is often employed to detect salivary cortisol.51,72,76,77,132 Generally, saliva samples do not need pretreatment as it is directly obtained in an extraction buffer, and the sample pad of the LFA removes the matrix effect of the oral fluids.72,76,77,79,121,133 However, patients are sometimes required to refrain from eating or drinking for a defined period of time before sample collection.72 In exceptional cases saliva needs pretreatment such as centrifugation to remove cell debris and other proteins.72,77,132
In the context of bodily fluids, the bioanalytical field has recently focused on developing novel minimally or non-invasive sampling strategies. Besides the commonly utilized urine and saliva samples, sweat and interstitial fluid (ISF) are emerging as promising sample types. To successfully integrate these samples into LFAs, researchers are employing automated microfluidic devices for sweat collection134–137 and microneedle-based systems138–140 for interstitial fluid extraction. We anticipate that ongoing advances in automated sampling strategies to reliably collect sufficient sample volumes, coupled with parallel biomarker discovery studies utilizing these fluids, will increasingly facilitate the incorporation of sweat and interstitial fluid into various LFAs, including competitive formats, particularly due to the abundance of small-molecule analytes present in these samples.
5.3. Other types of samples
In the case of plant samples (2 assays), pretreatment is necessary as they are in a solid state. This process typically involves drying the plant material, followed by grinding it into a finer form. After grinding, an extraction is carried out using a suitable solvent. This step is crucial for isolating the desired compounds from the plant cells. The process is often followed by sonication, which helps in breaking down cell walls and facilitating the extraction of target compounds. Finally, the sample undergoes centrifugation to separate the extract from the solid plant material, resulting in a sample that is ready for analysis.141,142In the analysis of pharmaceutical drugs (7 assays), various pretreatment methods have been described, mostly tailored to the specific needs of the analysis and the characteristics of the sample matrix. These methods can range from simple procedures such as grinding, diluting, centrifuging, and filtering the sample, to more elaborate steps like sonication or extraction using various solvents.143,144 Each of these techniques is designed to effectively prepare the sample for accurate testing, ensuring the isolation and purity of the drug compounds for precise analysis.
Finally, the use of buffer spiked samples (4 assays), in early assay development, serves as a preliminary step to study reactions and interferences in a controlled environment. This approach is crucial for validating analytical procedures and understanding target analyte interactions before analyzing complex biological samples.
6. Classification according to the bioreceptors (recognition elements)
The LFA component that predominantly defines the sensitivity and specificity of the test is the bioreceptor. While the general definition of a bioreceptor includes any molecule or biological entity (including whole cells) capable of specifically binding to a given analyte, in LFAs the most common ones are antibodies and to some extent aptamers.5 To be employed in LFAs, bioreceptors, besides providing excellent specificity and sensitivity, must also guarantee adequate stability, rapid binding kinetics and low cost. The stability is crucial because bioreceptors in LFAs are completely dried either on nitrocellulose or as conjugates with the labels and as soon as the sample reaches them, they must quickly regain their original structure and functionality. The rapid-binding kinetics are equally important since the vast majority of LFAs do not include any incubation step and the binding must be almost immediate. Finally, the bioreceptors and the labels employed are generally the most expensive components of the LFAs and therefore play a crucial role in the overall affordability of the final product. All these considerations are true for any type of LFA.56.1. Types of bioreceptors
However, despite their benefits, antibodies can have stability issues and may exhibit batch-to-batch variability, making their production expensive and time-consuming, with potential for cross-reactivity and ethical concerns due to the use of animals in their production.31
There are different types of antibodies used in LFAs: monoclonal, polyclonal, and fragments. Monoclonal antibodies have a unique binding site, providing targeted and consistent interactions. They are derived from a single B-cell lineage and are designed to recognize and bind to a single, specific epitope.5 This high degree of specificity enhances assay sensitivity, particularly for small targets, and reduces the risk of off-target interactions.31 Moreover, monoclonal antibodies provide consistent and reproducible results with no batch-to-batch variability. However, they tend to be more expensive compared to other bioreceptors, and their development process is time-intensive.5 In competitive assays monoclonal antibodies are preferred, as the detection principle relies on the occupancy of binding sites, monoclonal antibodies ensure identical binding sites and recognition of the exact same epitope over all the bioreceptor population, being ideal to build precise and specific competitive assays.31
Polyclonal antibodies, in contrast to monoclonal antibodies, originate from different B-cell lineages. Consequently, they constitute a mixture of antibodies capable of recognizing various epitopes on the same antigen.5 Their advantage lies in their ease and speed of production, making them a cost-effective choice.5 Despite that, due to their broader specificity, polyclonal antibodies may cross-react with other analytes or molecules present in the sample and they exhibit higher variability between different batches.5 Besides, the fact that different polyclonal antibodies can bind an antigen through more than one epitope, competitive assays based in polyclonal antibodies might suffer from the variability of epitope recognition of the polyclonal population of bioreceptors.
Antigen-binding fragments (F(ab)s) are the part of the antibody molecule responsible for specific antigen binding. Fabs can be produced either through recombinant DNA technologies or by enzymatic cleavage of full-length antibodies. Generally, F(ab)s demonstrate reduced nonspecific binding compared to full-sized antibodies and, are generally more cost-effective and easier to produce.5,31 Recombinant Fabs, in particular, offer high batch-to-batch consistency due to the controlled production process. In contrast, Fabs obtained through enzymatic cleavage might have variability influenced by the cleavage conditions. Similar to monoclonal antibodies, they offer low batch-to-batch variability and, owing to their smaller size, permit the incorporation of a higher number of bioreceptors per probe.5 In contrast, they are less stable than full-length antibodies due to the absence of an Fc region.5
Aptamers are selected through a process called SELEX (systematic evolution of ligands by exponential enrichment), where they are iteratively screened from a large pool of random sequences to identify those that bind best to the target.145 Aptamers excel in targeting organic molecules within the MW range of 100–10![[thin space (1/6-em)]](https://www.rsc.org/images/entities/char_2009.gif) 000 Da.8
000 Da.8
Their advantages over other bioreceptors, such as antibodies, include in vitro production processes, cost-effectiveness, straightforward labelling methods, and enhanced stability.5,8 Unlike antibodies, aptamers do not require animal hosts for their selection and exhibit higher stability and batch-to-batch reproducibility.145,146 Additionally, aptamers can be amplified post-selection and exhibit higher batch-to-batch reproducibility as compared to polyclonal antibodies.8,145
6.2. Bioreceptor affinity for the target
A common parameter used to assess the affinity between the bioreceptor and the target of interest is its dissociation constant (Kd). It represents the concentration of target that binds half of the binding sites of the bioreceptor.3,8 Lower Kd values typically indicate higher affinity, which is often desirable for achieving low LoDs.3,5,8 Of the 131 reviewed studies, only 14 studies mentioned the Kd values of their bioreceptors. These studies revealed a broad spectrum of affinities, ranging from 600 nM (ref. 25) to 91.74 pM.128 Notably, bioreceptors with lower Kd values, such as 131.58 pM,147 165.29 pM,105 2702.70 pM,148 and 91.74 pM,128 reflect high affinity, indicating their potential efficiency even at minimal analyte concentrations. These bioreceptors achieved LoDs of 0.229 nM, 232 nM, 3.21 μM, and 1.36 nM, respectively. Conversely, the highest Kd values, such as 600 nM,25 580 nM,15 172 nM,124 17 nM,26 and 10.41 nM,124 indicate lower affinity and correspond to LoDs of 269 nM, 1.36 nM, 143 nM, and 5 nM, respectively, suggesting that bioreceptors with lower affinity require higher analyte concentrations for effective detection.While selecting bioreceptors with very low Kd values can enhance assay sensitivity, other factors must be considered to ensure optimal performance. The production of high-affinity mAbs can be costly and time-consuming, whereas aptamer engineering often requires extensive screening to optimize binding properties.5,8 Additionally, extremely low Kd values may result in slow dissociation kinetics, potentially reducing assay responsiveness.12 Another critical aspect is cross-reactivity, as some high-affinity bioreceptors may bind structurally similar molecules, impacting assay specificity.8 To address these considerations, recent studies have explored computational modeling to predict and refine antigen–antibody interactions before synthesis, significantly improving selection efficiency.11 Additionally, engineered antibody fragments (e.g., F(ab) or scFv) and bifunctional ligands have been employed to enhance specificity while maintaining optimal binding kinetics.10 Some researchers have also adjusted the bioreceptor-to-competitor ratio to ensure that competitive displacement is not hindered by excessively strong binding.
The ability to fine-tune affinity is particularly evident in aptamer-based LFAs.3 As observed in Alnajrani et al.,28 two aptamers with different Kd were employed to investigate their impact on the sensitivity and performance of the lateral flow aptasensor. The full-length 60-mer aptamer exhibited a Kd of 47 nM, while its truncated 38-mer variant demonstrated a significantly lower Kd of 1 nM. This substantial difference in Kd values highlights the improved affinity of the truncated aptamer for the target molecule, dabigatran etexilate (DBG). The truncated 38-mer aptamer, with its higher affinity (lower Kd), was expected to provide better sensitivity and selectivity in detecting DBG. However, the study found that the full-length 60-mer aptamer offered a robust and reliable detection performance, achieving a detection limit of 20 nM in both buffer and blood samples as opposed to 100 nM when using the truncated version.28
6.3. Detection bioreceptor
The detection bioreceptor, typically a molecule like an antibody, aptamer or protein, is either labeled with a reporter molecule such as NPs or enzymes or immobilized in the detection line. When labelled forming the bioreceptor–reporter conjugate generates the signal at the TL indicating the presence or absence of the captured analyte.In the direct competitive format, the competitor serves as the detection bioreceptor. In contrast, in the indirect competitive format and in the non-standard types of competitive formats, the detection bioreceptor is a molecule capable of recognizing the target molecule. Fig. 7B illustrates that those competitors such as toxins, proteins, metal ions, hormones, and antigens, typically detect targets with MW similar to themselves. Among the 161 assays reviewed, 130 assays utilize the indirect competitive format, 128 assays employ antibodies and 2 an aptamer, as depicted in Fig. 7A. Within the 128 assays employing antibodies, 11 did not mention the type of antibody, 103 use monoclonal antibodies, 12 polyclonal antibodies and 2 antigen-binding fragments. In the 16 assays employing the non-standard competitive format, 11 employ aptamers as detection bioreceptors, 1 uses DNA, and 4 exploit monoclonal antibodies, as shown in Fig. 7A. Antibodies and aptamers as detection bioreceptors exhibit comparable MW ranges (mean MW: 329.9 and 323.8 g mol−1, respectively) (Fig. 7B).
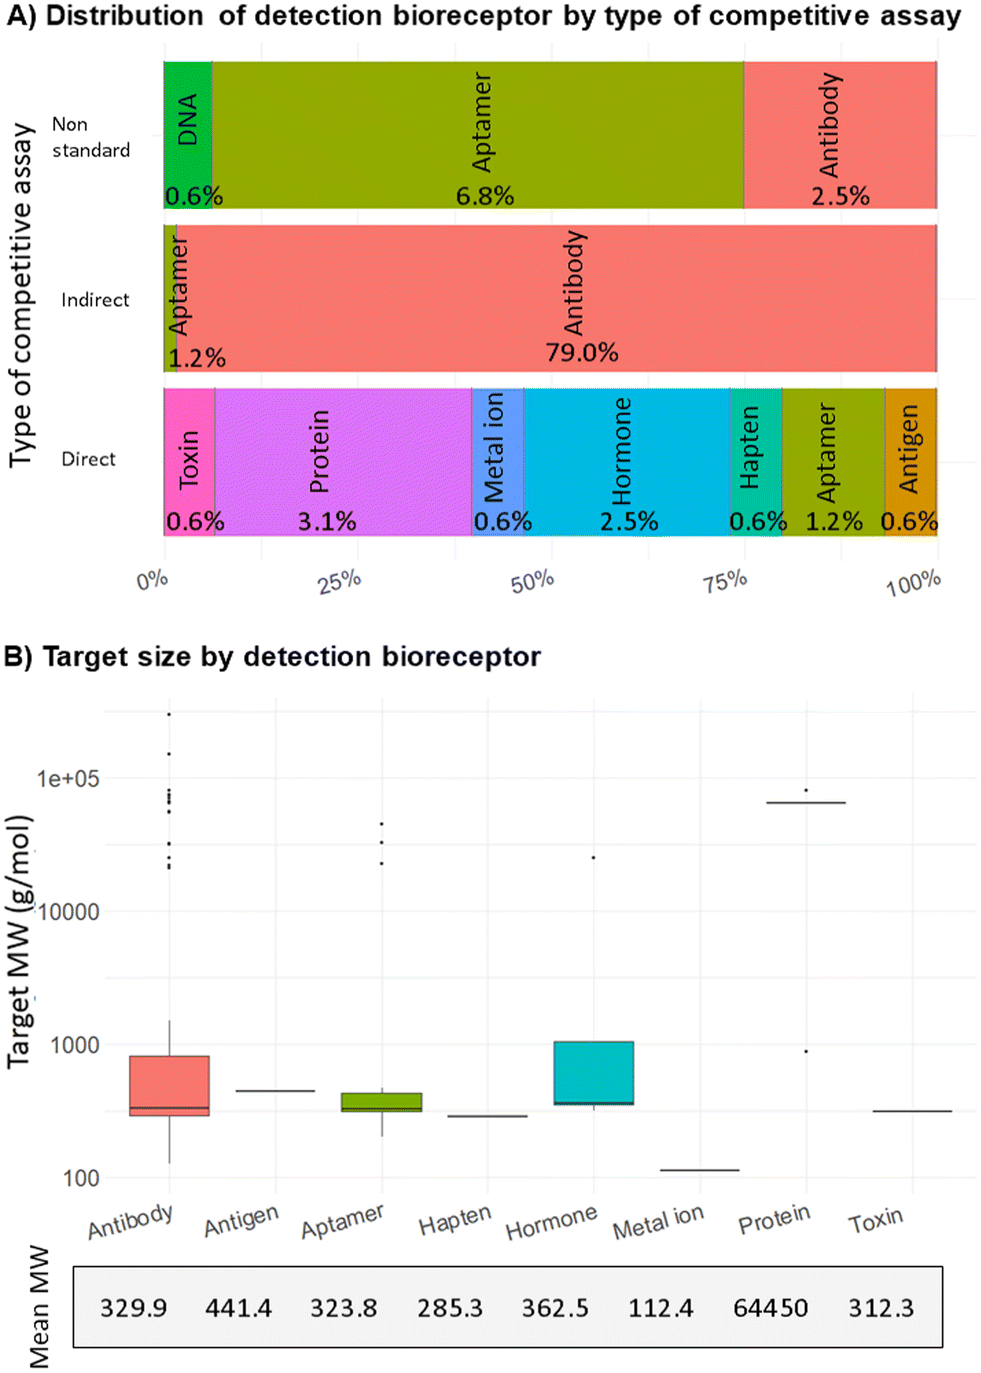 | ||
| Fig. 7 Comparative analysis of the detection bioreceptor depending on the type of competitive assay and the target molecular weight. (A) Percentage distribution of the different detection bioreceptors across the three types of competitive formats. (n = 160) (B) Boxplot representation of the MW distribution of targets (g mol−1) for the different bioreceptors. Each bioreceptor type is represented in the x-axis, with the corresponding boxplot revealing the median, interquartile range, and outliers. The numeric labels above each boxplot specify the median MW for easy reference (n = 160). | ||
6.4. Capture bioreceptor
The capture bioreceptor refers to the bioreceptor immobilized on the TL within the LFA. Its primary function is to capture or bind the target analyte present in the sample being tested. Typically, the capture bioreceptor is an antibody or aptamer that specifically recognizes and binds to the target analyte with high affinity and specificity but it can also be the competitor in the case of competitive LFAs. Once the analyte binds to the capture bioreceptor, it forms a complex that is detected by the detection bioreceptor. In competitive LFAs, the concentration of the capture bioreceptor, typically antibodies, at the TL ideally ranges from 0.1 mg mL−1 to 1 mg mL−1.5 This concentration will determine the assay's peak signal and consequently, its sensitivity. Intuitively, a higher concentration of the bioreceptor on the TL leads to a higher density of labelled NPs that can be captured.In the review of 161 assays, for the 130 assays employing the indirect competitive format the capture bioreceptor is the competitor, and the median concentration at the TL was observed to be 0.65 mg mL−1, equivalent to 11.34 μM. In the direct format, which comprised 15 assays, antibodies were used as a capture bioreceptor in 12 of them, with the median concentration at the TL, similar to the indirect format, of 0.65 mg mL−1 or 8.13 μM. For the non-standard competitive format, 16 assays, 5 assays used DNA which was the most frequently used capture bioreceptor, with a median TL concentration of 0.25 mg mL−1 or 4.7 μM, a notably lower concentration than standard formats. Approximately 2% of the test analyzed used aptamers in the TL with a median concentration of 0.05 mg ml−1 or 5 μM.
To enhance cost-efficiency without sacrificing sensitivity, we need to use lower-end bioreceptor concentrations, particularly with high-affinity bioreceptors.
Antibodies are the preferred choice for the direct competitive format due to their high specificity, strong affinity, and demonstrated assay performance. In contrast, the utilization of lower concentrations of DNA bioreceptors for the non-standard competitive format suggests that DNA–antigen interaction might be more efficient or may not necessitate as high a bioreceptor density for effective detection.
6.5. Supplementary proteins for enhancing bioreceptor performance
In situations where the capture bioreceptor is expensive, when highly concentrations are not feasible or when we need to maintain the bioreceptor's structure and functionality over time, as low concentrations may induce protein denaturing and loss of binding activity, it is sometimes necessary to introduce additional proteins. In this case, bovine serum albumin (BSA) or egg ovalbumin (OVA) is often used.BSA, with a MW of 66 kDa, is a primary component of bovine blood plasma, while OVA, lighter at 45 kDa, is the main protein in egg whites. Among the 161 assays analyzed, 103 incorporate one of these proteins on the TL. However, their inclusion in the direct and non-standard competitive formats is rare, with only three assays reported, two direct and 1 of the non-standard category. BSA and OVA mainly serve as blocking agents in indirect LFAs, mitigating non-specific binding and helping to maintain the integrity of protein structures.
BSA is preferred and utilized in 82 assays, in contrast to OVA's 21 and the choice between BSA and OVA is often guided by the specific application and potential for interference or cross-reactivity with the target analyte. Furthermore, BSA is generally more accessible and cost-effective than OVA, which can significantly impact the decision between the two in research and commercial settings. Importantly, for applications involving fragments of antibodies, which have lower MW (below 50 kDa for fragments and 15 kDa for nanobodies), BSA, with its higher MW of 66 kDa, is typically avoided as a blocking agent due to potential interference.
The analysis also showed a variation in reporting practices regarding the use of BSA or OVA; some studies did not mention their addition at all, as indicated in Fig. S3 in the ESI† as ‘NA’. Among the minority of studies that did report concentrations, the median used was 1.5% w/v, ranging from a minimum of 0.5% w/v to a maximum of 6.7% w/v. These details underscore the nuanced decisions made in assay design to ensure both functionality and economic responsibility.
7. Impact of the competitor's properties in competitive lateral flow assays
As previously mentioned, a competitor is a molecule that closely resembles or mimics the target analyte. The competitor competes with the target molecule for the binding sites of the bioreceptor.In the case of the direct format, the competitor is used as a detection bioreceptor, with a wide range of types of molecules used including hormones, ions, proteins and toxins, among others (Fig. 7A). The concentration of this competitor in the reporter varies widely, from 5 μg mL−1 (602 μM) to 3000 μg mL−1 (120 mM). This variation is due to the differing affinities and detection requirements of each assay type. Higher concentrations are often needed for molecules with lower affinities or for assays requiring higher sensitivity. The optimization of these concentrations is crucial to ensure accurate detection and minimize cross-reactivity.
Alternatively, in the case of the indirect format, the competitor is used as a capture bioreceptor. Those competitors have a wide range of MW ranging from 288 Da (dehydroepiandrosterone, DHEA) to 67 kDa (human serum albumin, HSA). Moreover, most of them need a carrier protein, the most commonly used being BSA, to enhance their stability.
In contrast, non-standard competitive LFAs employ different strategies. The competitor can either be a complementary DNA chain or can be added to the sample pad along with the sample. This versatility in the use of competitors allows for the development of highly specific and sensitive assays tailored to the needs of different applications.
8. Implications of detection membranes
The membrane or detection pad in an LFA strip, typically made of nitrocellulose, is where the TL and CL are printed.5,8 An ideal membrane not only offers robust support and effective binding for capture probes like antibodies or aptamers, but also promotes homogeneous flow while minimizing nonspecific binding.5,8 The capillary flow rate, measured in mm min−1, gauges the time needed for the sample to traverse the membrane, which is crucial for determining the assay's overall duration and affects the LFA's sensitivity and specificity. Higher capillary flow times, though increasing sensitivity by providing more time for interaction between the target molecule and bioreceptor, also increase the risk of nonspecific binding. Thus, carefully assessing the membrane's capillary flow rates is vital to ensure the assay's optimal performance and accuracy.8Of the 161 studies examined, 79 assays discuss the type of nitrocellulose used and the corresponding capillary flow rates. The median flow rate observed across these studies is 135 mm min−1, with the highest reported rate being 250 mm min−1 and the lowest at 70 mm min−1 (Fig. 8).
 | ||
| Fig. 8 Relationship between the LoD and the capillary flow time for the different competitive assay formats. The y-axis is scaled logarithmically to represent the LoD values (ng mL−1), while the x-axis represents the capillary flow time. Data points are distinguished by competitive assay type: direct competitive (A, in red), indirect competitive (B, in green), and non-standard competitive (C, in blue). The size of each point corresponds to the MW of the target (g mol−1), with larger points representing higher MW (n = 67). | ||
This optimized capillary flow rate of 135 could likely be due to the small size of the targets (around 300 g mol−1). Small analytes typically require a precise balance between the flow rate and interaction time to ensure that the target molecules sufficiently collide with and bind to the capture agents. If the flow rate is too fast, the target molecules may not have enough contact time with the capture bioreceptor, potentially reducing the assay's sensitivity. Conversely, if the flow rate is too slow, it could result in unnecessary delay in readout without significantly improving binding efficiency.
8.1. Control line
Typically, the CL captures the excess or unbound signalling reporters to confirm proper flow of reagents and ensure test validity. In the case of the indirect competitive assay the CL can be obtained by printing secondary antibodies specific for those conjugated on the nanoparticle. In the case of the direct competitive assay either the CL is obtained by printing the same bioreceptor of the TL or it is obtained by printing a bioreceptor specific for a different element present on the nanoparticle itself (e.g., an anti-BSA antibody in the case that the nanoparticle is blocked with BSA). For non-standard competitive assays, every format has different requirements. In all cases however the LFA must contain enough nanoparticle conjugates to generate a reliable signal at the CL independently from the target concentration.9. Multiplexed competitive lateral flow assays
Multiplexing in LFAs allows for the detection of multiple targets simultaneously within a single test. Our review identified 17 research papers that have developed a multiplex competitive LFA.18,56,62,63,75,86,88,102,111,113,114,119,129,143,149,150These papers reveal various multiplexing approaches that demonstrate the versatility of LFAs' adaptability to meet different detection needs. The indirect competitive format is the most frequently used strategy, particularly in assays detecting two analytes with separate TLs.56,62,75,88,102,113,119,143,149,150 Five studies explored multiplexing for more than two analytes. Of these, three detection models employ a direct competitive format114,129 (Fig. 9A), while two adopted an indirect competitive approach63,86,111 (Fig. 9C). Additionally, one work combined two different approaches employing both a sandwich format and an indirect competitive format within the same test strip91 (Fig. 9B).
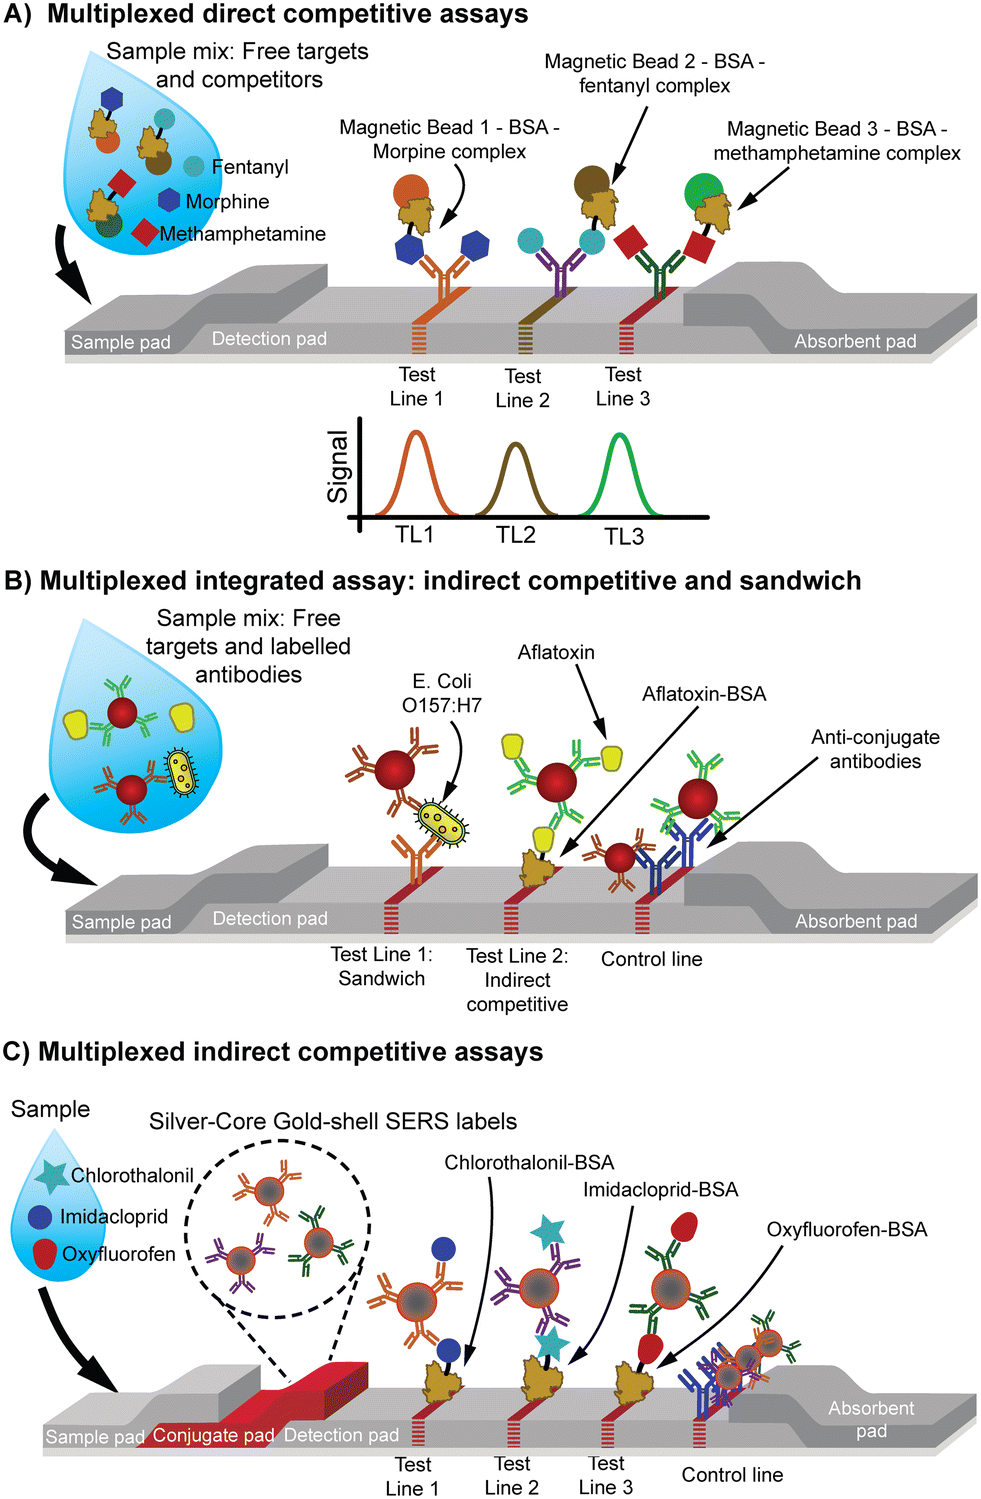 | ||
| Fig. 9 Schematic representation of different multiplexed assay formats. (A) Multiplexed direct competitive assays. Each target competes with a labelled analogue for binding to specific antibodies immobilized on magnetic beads, which are subsequently captured at distinct TLs (TL1, TL2, TL3) for detection.129 (B) Multiplexed integrated assay combining indirect competitive and sandwich assay. Free targets are captured by the labelled antibodies, one of these complexes compete with the immobilized target analog and the other one forms a sandwich in two different TLs.91 (C) Multiplexed indirect competitive assay. Free targets are captured by the labelled antibodies and compete with the immobilized target analog in the TL.63 | ||
These multiplexing approaches have predominantly been applied in the field of food safety, especially for detecting toxins and antibiotics in food samples.56,62,75,88,102,119,143,149,150 They have also proven useful in other domains, such as detecting drugs of abuse,129 monitoring health biomarkers,114 and diagnosing diseases like sickle cell anemia, as well as evaluating treatments for HIV.18,113 Specific applications included determining the concentration of immunoglobulin free light chains119 and assessing the content of antimalarial drugs.143,149 This variety in applications underlines the broad utility of multiplex LFAs, particularly in settings where rapid, cost-effective, and simultaneous detection of multiple analytes is required.
Multiplexing in competitive LFAs presents significant challenges, primarily due to the delicate equilibrium required for precise assay optimization. Adjustments in assay conditions to optimize detection for one analyte may inadvertently impact the performance and sensitivity toward other targets, making simultaneous optimization particularly difficult or even impossible in competitive formats. Additionally, cross-reactivity between bioreceptors and analytes poses a critical issue, as unintended interactions can compromise assay specificity and reliability. Worth highlighting in the context of multiplexing, the work by Xu et al. has successfully demonstrated multiplex detection within a single test line through innovative approaches, such as self-assembling antibody networks (NAN). Specifically, the NAN method employs dynamic, non-covalent interactions between antibodies, effectively allowing multiple analytes to be detected simultaneously without interference.150 Additionally, improving antibody specificity is another effective strategy; for instance, in a SERS-based pesticide detection assay, antibodies against chlorothalonil (CHL), imidacloprid (IMI), and oxyfluorfen (OXY) exhibited minimal cross-reactivity despite structural similarities.63 Similarly, in the CNAN-mLFIA system, custom-engineered monoclonal antibodies (mAbs) allowed the simultaneous detection of chloramphenicol (CAP) and streptomycin (STR) without interference.150 Some studies have further optimized antigen–antibody interactions using computational modeling to predict cross-reactivity before laboratory validation, as demonstrated in a chemiluminescent biosensor for fumonisins and aflatoxin B1, where pre-modeled mAb interactions ensured high specificity across multiple mycotoxins.75 These approaches, whether through antibody engineering, self-assembling bioreceptors, or computational optimization, contribute to reducing cross-reactivity while maintaining the accuracy and practicality of multiplex competitive LFAs.
10. Classification according to labels and readout systems
Labels used in LFAs play an important role in determining sensitivity of the analysis and a wide variety of labels are employed in LFAs, including nanomaterials (between 1 and 100 nm), which represent the majority of the labels used. In this context, nanotechnology has contributed enormously to the synthesis of new nanomaterials with outstanding optical properties that are promising for biosensing purposes.151 Additionally, for lateral flow applications, optimal labels should exhibit colloidal stability, possess a homogeneous size and shape distribution, demonstrate effective conjugation to biomolecules, generate a robust analytical signal, and maintain resistance to aggregation during the test preparation and assay process.151,152In Fig. 10A, we summarized the different sizes of the most used NPs in the reviewed articles, optical, luminescent, and magnetic NPs.
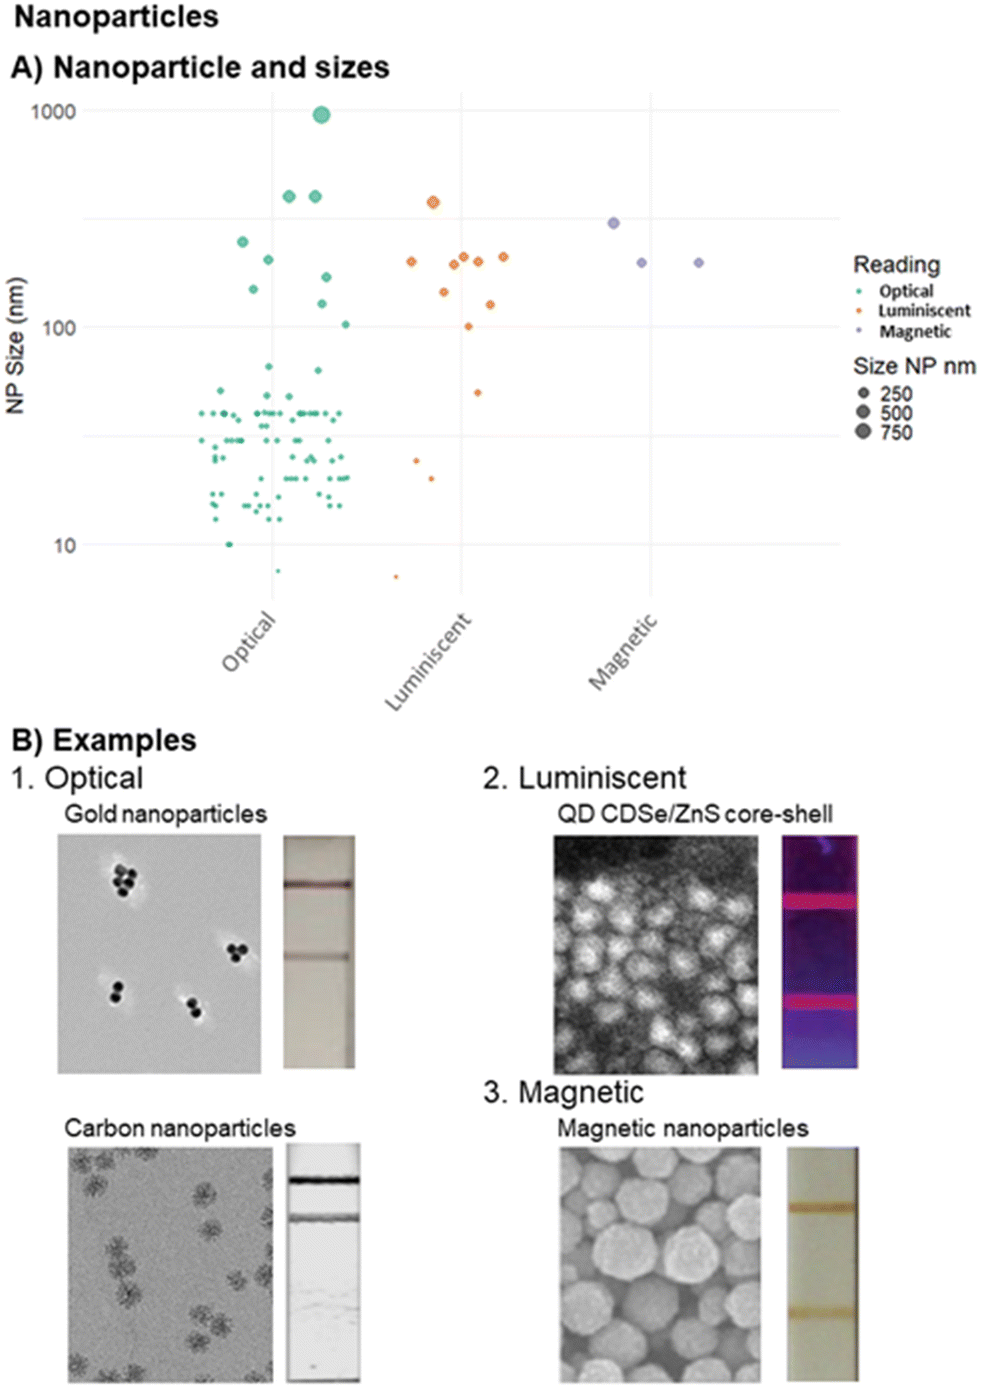 | ||
| Fig. 10 Characterization of nanoparticles. (A) Type of NP and size. The graph presents NP size distribution across three detection methods: optical, luminescent, and magnetic. NP sizes (in nm) are displayed on a logarithmic y-axis. Size categories are depicted using different marker sizes (100 nm, 250 nm, 500 nm, and 750 nm) for precise identification (n = 107). (B) Examples of NPs. Representative images for each NP are shown: (1) optic: gold NPs and carbon NPs, (2) luminescent: quantum dots, and (3) magnetic: magnetic NPs. Adapted from ref. 5, 70, 129, 153. | ||
10.1. Colorimetric labels
The use of colored NPs, utilized in 122 of 161 assays, offers specific advantages in LFAs, making them particularly well-suited for qualitative applications or scenarios where cost-effectiveness is a primary consideration. One key benefit of colored NPs is their inherent visual detectability, eliminating the need for an external reader. This simplicity is particularly advantageous for rapid, in situ assessments.5 Nevertheless, in more intricate or demanding contexts that require semi-quantification or quantification, the integration of an external reader becomes indispensable. These devices enhance the reproducibility of results and enable precise quantitative analysis.5From the 106 studies employing AuNPs, 78 of them mention their size. The sizes of the NPs used range from 7.5 nm to 40 nm.15,20–23,25,26,28,54–56,59–64,71,72,78–82,86,88,90,91,94,96,97,105,110–112,115,117,124,125,133,141–144,147–149,159,161–163,165,167–174,176,178 The variability in NP size is critical, as it influences the surface area-to-volume ratio, which in turn affects the sensitivity and detection capabilities of the assays. Larger NPs provide a greater surface area for functionalization but may exhibit slower diffusion rates, whereas smaller NPs can diffuse more quickly but offer less surface for binding.151
The data reveals a wide range of detection bioreceptor concentrations conjugated to the NPs, from 0.25 μg mL−1 to 150000 μg mL−1. Either smaller or larger NPs show variability in detection bioreceptor concentrations, indicating versatility for different assay sensitivities and specificities. The highest bioreceptor concentration (8345 μg mL−1) is linked to 39 nm NPs.64 Conversely, the lowest concentration (0.25 μg mL−1) is associated with 13 nm NPs,28 as smaller NPs might need less bioreceptor per mass unit due to their high surface area-to-volume ratio. NP sizes around 15 nm to 20 nm are frequently used across various concentrations, suggesting that they provide a good balance between surface area and effective binding. Overall, the significant variability in NP sizes and bioreceptor concentrations underscores the importance of optimizing these parameters based on specific assay requirements.
To increase the size and visibility of AuNPs, a silver enhancer solution that contains silver ions and a reducing agent (hydroquinone) is frequently dropped onto the strip following the binding reaction. In the presence of this solution, AuNPs act as a catalyst and they turn darker because of the deposition of metallic silver onto their surface.155
For competitive LFA, 5 studies employed this strategy,63,64,71,77,79 this approach has been used for boosting the sensitivity of the assay up to 10-fold when compared with its AuNP-based counterpart, thus broadening the range of target concentrations, diminishing the matrix effects by increasing the signal-to-noise ratio, and also reducing the amount of competitor and bioreceptor required to construct the competitive LFA.77,79,155
Among these five studies using silver enhancement, the median concentration of the detection bioreceptor is 2.5 mg mL−1, which is comparable to that of AuNPs without silver enhancement of similar sizes (17–39 nm). However, the capture bioreceptor concentration is slightly lower than the ones without silver enhancement, averaging 0.7 mg mL−1. This could be attributed to the enhanced sensitivity provided by the silver NPs, allowing for effective detection with lower bioreceptor concentrations.
Despite its advantages, it is important to note that this method has some limitations, including the additional steps during the assay and may require rigorous washing steps to eliminate interfering ions, such as chlorine, which can be a stringent requirement.152
Among the competitive assays reviewed, two of them reported the use of CNPs for the detection of cow milk adulteration106 and detection of a synthetic phytoregulator (Fig. 10).100 These NPs range between 160–180 nm which is approximately 8-fold the size of classical AuNPs (20 nm) and their bioconjugation is a lengthy process that lasts at least 12 hours to complete, when compared with the 1 hour AuNP-based conjugation.
10.2. Luminescent labels
A luminescent material is that one that absorbs energy, its electrons are excited into higher energy levels, and when they return to their normal state, this material is able to emit energy in the form of light. Depending on the type of excitation, luminescence can be divided into several categories; the main ones used in LFA are: photoluminescence (fluorescence and phosphorescence), chemiluminescence, bioluminescence and electrochemiluminescence.180In particular, we found that in 33 of 161 competitive assays,17,19,23,27,61,67–69,73–76,84,85,99,102,107,118,120,122,150,181–186 luminescent molecules and NPs were employed, offering a distinct advantage in LFAs where highly sensitive detection is required. In scenarios where quantitative analysis is needed, these entities provide an inherent glow that can be measured with precision, making them highly valued in assays where visual confirmation alone is insufficient.
10.3. Fluorescent labels
Fluorophores are organic molecules that absorb and emit energy, which can be used as labels if they are bound to a biomolecule. Among their advantages include the ease of use and the ability to provide increased sensitivity, particularly beneficial in situations requiring the detection of low concentrations and in applications that take advantage of multiplexing capabilities.5,152 For instance, 3 of 33 assays were found to employ fluorophores such as fluorescein isothiocyanate (FITC), R-phycoerythrin (RPE) and cyanine-based molecules for the detection of folate,118 progesterone,183 and aflatoxin,85 respectively. Three out of the 33 assays incorporate europium-based NPs. These NPs, coated with organic chelates, have gained widespread adoption due to their highly sensitive luminescence detection capabilities, enabling enhanced performance in diagnostic applications.17,122,181 Another example of fluorophores, but used in multiplexed assays, is Coomassie bright blue R-250, a protein stain, which has been used in a multiplexed competitive assay for the detection of antibiotic's residues, taking advantage of a system formed by linking two monoclonal antibodies to specific locations along the Ab2 scaffold that avoids multiple probe fabrication steps. Moreover, this antibody system also reduces interferences during the multiplexed LFA, which resulted in lower LoD as compared to their AuNP-based counterpart.150
However, these dyes come with disadvantages such as limited photostability, vulnerability to environmental quenching, and concentration-dependent quenching. Additionally, when applied in membrane-based assays, they face challenges due to light scattering from the support and interference from internal fluorescence sources such as proteins, probe components, and certain analytes (e.g., polycyclic aromatic hydrocarbons and certain mycotoxins), which can introduce interference.152 In this context, to avoid some of those problems, organic dyes such as rhodamine can be encapsulated in polymersomes for colorimetric and fluorescent detection in competitive LFAs offering two modes for sensitive detection.182
Finally, 2 of 33 assays used commercial carboxylated polymeric microparticles, which are loaded with proprietary fluorescent dyes and have been applied in competitive assays for detection of drug residues.102
When excited with UV light, QDs emit robust photoluminescence, and by altering their elemental composition and size, their emission peak can be adjusted.180 This unique characteristic not only allows for a blue shift in smaller QDs but also renders them exceptionally well-suited for multiplexed detection.5 According to the articles found, four of them use core–shell metal chalcogenide QDs such as CdSe/ZnS,19,61,120,186 while just one reported core–shell binary metal chalcogenide QDs such as AgInS/ZnS,107 which was used as an alternative QD label. Despite the fact that Cd-based QDs have been successfully applied as labels in LFAs, they are potentially toxic and their synthesis is a time-consuming and laborious process. Alternatively, AgInS/ZnS QDs appear as a safe and easy replacement when it comes to QD-based labelling. Nonetheless, their cost is generally higher than AuNPs and they require a UV lamp for excitation.5
10.4. Magnetic nanoparticles as labels
Magnetic NPs (MNPs) (Fig. 10), used in 4 reported assays, are versatile labels for LFAs, offering the dual functionality of both optical and magnetic signals.5 The signal intensity in MNPs is directly correlated with the magnetite content, provided that the particles are of the same size, with higher levels of magnetite resulting in more robust signals, although other factors can influence the signal, such as the detection system and the applied magnetic field. Moreover, their natural dark color renders them ideal for conventional optical labelling.152,187In optical membrane-based assays, which are hindered by the opacity of the membrane (e.g., nitrocellulose), only the NPs (labels) accumulated on the surface (i.e., 10 μm) will be detected by an optical reader, leading to less sensitive devices. MNPs overcome this limitation by enabling the detection of magnetic signals throughout the full thickness of the membrane using highly sensitive magnetic-particle detectors, ensuring the capture of all magnetic signals within the membrane, significantly enhancing the sensitivity of the assay.5,152,187 This unique advantage ensures that none of the generated signals are lost, significantly enhancing test sensitivity.
Coating and size considerations of MNPs are crucial, influencing flow rates and thereby affecting the LFA performance.
Their inherent magnetic properties facilitate efficient separation of the MNP–bioreceptor captured target molecule from the sample matrix, effectively eliminating any interference prior to application to the LFA, using a magnet.5,152 However, one drawback of MNPs is their tendency to aggregate in solutions due to their magnetic properties. To address this, MNP conjugation with proteins is commonly achieved through a series of steps, including silica coating, surface modification with amino or carboxylic groups, and eventual conjugation with biomolecules.152
In 4 competitive LFAs studies that employed MNPs, three of them took advantage of their properties and used inductive readers (one of them a commercial one188) that are based on Faraday electromagnetic induction,187 for quantification purposes.53,103,129 Only one study reported that they did not carry out magnetic but optical measurements for detection of bacteria. Interestingly, this study used MSPs to indirectly contribute to sample concentration by enhancing the interaction between antibodies and target bacteria during pre-enrichment.57
11. Application of the tests
The analysis of the types of targets section provides an overview of the main applications of competitive LFAs. Specifically, we found that the two main areas employing these tests are: food/water safety (103/161 assays) and healthcare (54/161 assays), as depicted in Fig. 11. With additional applications in veterinary monitoring (14/161 assays) and environmental surveillance. Fig. 11 summarizes these applications.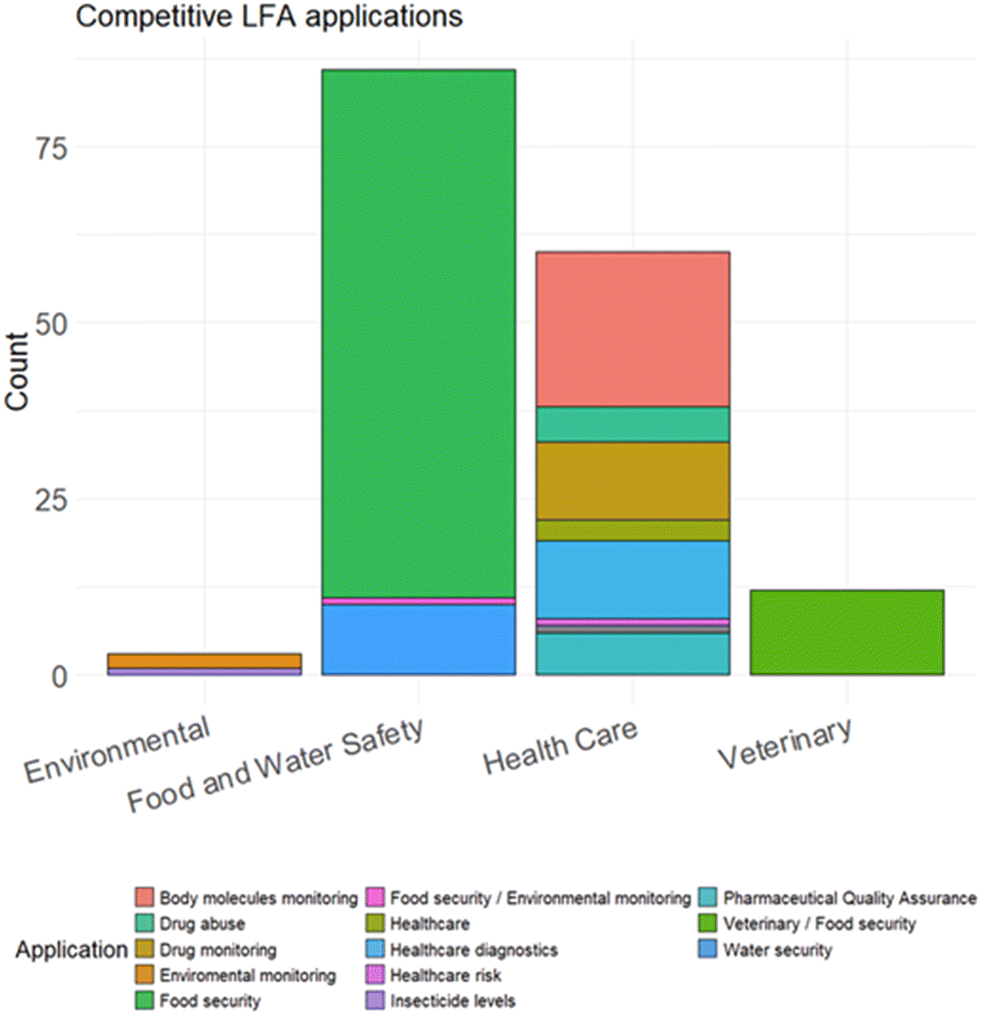 | ||
| Fig. 11 Competitive LFA applications. The chart categorizes the number of LFAs developed for environmental monitoring, food and water safety, healthcare, and veterinary purposes. Each bar is subdivided to show specific applications within these sectors, such as body molecule monitoring, drug abuse, food security, and others. This chart highlights the distribution and prevalence of competitive LFA applications, with food and water safety and healthcare being the most prominent sectors (n = 161). | ||
11.1. Use cases for competitive LFAs
In food and water safety, competitive LFAs are widely used for detecting toxins in food products, such as mycotoxins (e.g., aflatoxins, fumonisins) in grains, dairy, and processed foods, ensuring compliance with food safety regulations. They are also employed for screening antibiotic residues (e.g., chloramphenicol, streptomycin) in meat, milk, and seafood, helping to prevent antimicrobial resistance. Additionally, they play a key role in monitoring pesticide contamination, enhancing agricultural safety. In healthcare, competitive LFAs are utilized for hormone level monitoring, including cortisol, thyroxine (T4), and progesterone. They are also essential for drug abuse screening, detecting substances such as opioids, fentanyl, and cocaine, as well as for therapeutic drug monitoring, ensuring accurate medication dosages for effective disease management. For environmental applications, competitive LFAs are primarily used for detecting insecticides and heavy metals, such as lead, mercury, and pyrethroids, in water and soil samples, providing a portable and efficient solution for environmental monitoring. In veterinary applications, these assays support disease surveillance, the detection of contaminants in animal feed, and the monitoring of hormonal levels in livestock, contributing to improved animal health and reinforcing food chain safety.Although we have categorized LFA applications into distinct fields, there is often significant overlap. This is particularly evident in veterinary care and food safety, where the distinction between animal health monitoring and ensuring the safety of meat products is closely interconnected.
11.2. User perspective on competitive LFAs
From the user perspective, the use of competitive LFAs entails certain challenges. For example, competitive LFAs have particular significance in specific medical fields, such as drug abuse detection,123,127,129,142,182 where they provide rapid feedback, enabling an optimized (and sometimes autonomous) decision-making process in such an ethical and legal field. However, as we saw a negative result is indicated by the appearance of two lines (TL and CL), signifying that the drug concentration is below detectable levels. In contrast, a positive result occurs when only one line is visible in the control zone, indicating that the drug concentration exceeds the detectable threshold.189 This can generate unpleasant situations, especially when these tests are used by non-specialized personnel, leading to the wrong assumption that two lines mean the presence of the drug. Another important challenge arises from the accurate interpretation of weak or borderline lines.190 In sandwich formats, the presence of even a faint test line is clearly interpreted as a positive result. Because the line is either visibly present or absent, it is relatively straightforward to distinguish a positive signal from a negative one. In contrast, competitive LFAs rely on detecting a reduction in test line intensity to indicate a positive result. Here, the interpretation depends not on the mere presence or absence of a line, but on differentiating a strongly visible line from a slightly fainter one, an inherently more challenging assessment.The need to correctly interpret the presence of two lines as a negative result and the absence of a signal at the TL as positive along with the potential for human error at interpreting weak lines and the lack of standardized result reporting highlights the importance of developing more user-friendly designs. Integrating digital readers or technologies that quantify color intensity would significantly enhance the accuracy and reliability of competitive LFA tests. A more intuitive branding of the test could also help the user in the interpretation. For example, in the case of a competitive LFA for cocaine abuse naming it as “cocaine-free test” could facilitate the user in associating the appearance of the line with the absence of cocaine from the sample. Preparation of appropriate instructions (maybe including a clear color palette) and training and monitoring the user's behaviour are essential for rapid test implementation.191 Regarding the second challenge, implementing analytical strategies that achieve high sensitivity in competitive LFAs making the test as close to a binary, yes/no outcome as possible would ensure a more reliable and easily interpretable result albeit decreasing the dynamic range of the test.
12. Challenges and opportunities in real-world deployment
While competitive LFAs provide rapid, cost-effective, and portable diagnostic solutions, their practical deployment faces several challenges that must be addressed to maximize their impact across various applications. A primary challenge is sensitivity and detection limits, as competitive LFAs typically exhibit lower sensitivity compared to laboratory-based techniques like ELISA or PCR.7,8 To overcome this limitation, numerous signal amplification strategies are under investigation, including surface-enhanced Raman spectroscopy (SERS),10 enzymatic amplification methods,3 and silver-enhanced nanoparticle approaches.8 Although these advanced strategies significantly enhance assay sensitivity, they simultaneously introduce increased complexity and production costs, potentially limiting their practical accessibility, especially in resource-constrained settings.5 Moreover, as discussed in the theoretical section, the analytical performance of competitive LFAs can be extensively tuned beyond nanotechnology-based strategies.10 Advances in biotechnology, such as the identification and engineering of bioreceptors with optimal binding constants,10 can substantially improve sensitivity, limit of detection, and dynamic range, further enhancing assay performance.Another substantial challenge involves obtaining regulatory approval and ensuring assay standardization.6 Achieving reproducible and reliable performance across diverse sample matrices remains challenging.7 Variations in sample composition, viscosity, pH, and interfering substances can significantly affect assay performance.8 Consequently, developing robust standardized protocols and rigorous validation methods is essential to facilitate broader regulatory acceptance and integration into critical sectors like healthcare diagnostics, food safety inspections, and environmental monitoring.6 Scalability and overall cost considerations also significantly influence competitive LFA deployment. LFAs are generally intended to be low-cost solutions; however, the incorporation of advanced detection methods, including chemiluminescence,3,5,10 electrochemical sensing,5,10 and fluorescent labeling,3,5,10 may significantly elevate production and instrumentation costs.
Despite these challenges, numerous opportunities exist to enhance and expand competitive LFAs. Integration with digital and smart technologies represents a promising direction, with smartphone-based readers, cloud connectivity, and artificial intelligence (AI)-driven image analysis increasingly being explored.5,10 These technological integrations can substantially enhance LFA accuracy, sensitivity, and user accessibility, enabling real-time remote diagnostics, automated result interpretation, and reduced human error.10 Advancements in multiplexing technologies also present significant opportunities.5,8 The development of multi-analyte detection systems employing innovative approaches such as self-assembling antibody networks10 or microfluidic-based multiplex strips5 can extend diagnostic capabilities within a single assay. Multiplexed competitive LFAs are particularly beneficial in applications requiring simultaneous detection of multiple targets, including point-of-care diagnostics,8 food safety assessments,9 and environmental monitoring.8 Continued assay optimization and innovation could significantly enhance their suitability for global health surveillance,6 rapid response to infectious disease outbreaks,1 and environmental hazard detection.8 Furthermore, exploring new bioreceptor technologies, such as engineered proteins, nanobodies,10 or molecularly imprinted polymers (MIPs),139 could increase assay versatility, stability, and economic viability, thereby broadening their global impact.
13. Conclusions
In this review, we explored different aspects of the competitive lateral flow assays, including the mathematical modelling of competitive assays, different key parameters for test development, the types of labels and readouts employed, the different applications and the user perspectives. Specifically, we showed how the implementation of the mathematical modelling of competitive LFAs is a critical tool for a quick and less expensive optimization of the test, reducing the need for extensive experimental trial-and-error. By analyzing the different competitive formats, we have underscored their ability to detect a wide range of targets where conventional sandwich assays fall short. These formats – direct, indirect and non-standard formats – offer flexibility depending on the specific needs of the assay. The use of diverse labelling techniques, from traditional AuNPs to more sophisticated fluorescent or magnetic nanoparticles, has allowed those competitive LFAs to enhance the sensitivity and detection capabilities of the competitive LFAs. Overall, we hope that this manuscript will provide junior and experienced LFA developers with useful insights and a convenient resource (in the ESI† the reader can find a comprehensive table reporting all most important parameters of all the articles reviewed) to find critical information for speeding up the development of novel competitive LFAs.Data availability
No primary research results, software or code have been included and no new data were generated or analysed as part of this review.Author contributions
J. P.-R. investigation, original writing draft and review/editing. L. R. investigation original writing draft and review/editing. J. C. investigation and original draft writing. V. S. supervision and original draft writing. D. C.-F. supervision and original draft writing. J. M. supervision and original draft writing. C. O'S. supervision original draft writing and review/editing. A. C.-G. conceptualization, investigation original draft writing and review/editing. C. P. conceptualization, investigation, original draft writing and review/editing.Conflicts of interest
The authors declare that there are no conflicts of interest regarding the publication of this manuscript.Acknowledgements
The ISGlobal authors acknowledge support from the grant CEX2023-0001290-S funded by MCIN/AEI/10.13039/501100011033, and support from the Generalitat de Catalunya through the CERCA Program. This research was supported by CIBER – Consorcio Centro de Investigación Biomédica en Red – CB21/13/00112, Instituto de Salud Carlos III, Ministerio de Ciencia e Innovación and Unión Europea – NextGenerationEU, with the support of AGAUR-FI ajuts (2024 FI-3 00065) Joan Oró de la secretaria d'Universitats i Recerca del Departament de Recerca i Universitats de la Generalitat de Catalunya i del Fons Europeu Social Plus. They also acknowledge support from the Spanish Ministry of Science and Innovation through the program PID2020-116770RJ-I00 and CPP2021-008658. C. P. acknowledges support from the Hospital Clinic of Barcelona, the Caixa Research Institute Innovation Hub and Caixa Impulse project CI24-10491 and from the Spanish Ministry of Science through the Ramón y Cajal grant no. RYC2022-036743-I. This project has received funding from the European Union – Next Generation EU through the program YOUNG RESEARCHER – MSCA (Project ID: MSCA_0000010) awarded by the Italian Ministerio dell'Università e della Ricerca (MUR) within the PNRR framework. URV authors acknowledge funding from European Union under grant agreement 101112109. We also thank all CEK “support” team and in particular Cristina Canaleta, Laura Muñoz, Laura Puyol, Diana Barrios and the other research groups from ISGlobal and IDIBAPS. We also thank all the healthcare personnel of the Travel Medicine Clinic of the Hospital Clinic of Barcelona.References
- B. G. Andryukov, Six decades of lateral flow immunoassay: from determining metabolic markers to diagnosing COVID-19, AIMS Microbiol., 2020, 6(3), 280–304 CAS.
- R. S. Yalow and S. A. Berson, Immunoassay of endogenous plasma insulin in man, J. Clin. Invest., 1960, 39(7), 1157–1175 CrossRef CAS PubMed.
- E. B. Bahadır and M. K. Sezgintürk, Lateral flow assays: Principles, designs and labels, TrAC, Trends Anal. Chem., 2016, 82, 286–306 CrossRef.
- C. Parolo and A. Merkoçi, Paper-based nanobiosensors for diagnostics, Chem. Soc. Rev., 2013, 42(2), 450–457 RSC.
- C. Parolo, A. Sena-Torralba, J. F. Bergua, E. Calucho, C. Fuentes-Chust and L. Hu, et al., Tutorial: design and fabrication of nanoparticle-based lateral-flow immunoassays, Nat. Protoc., 2020, 15, 3788–3816 CrossRef CAS PubMed.
- S. Rink and A. J. Baeumner, Progression of Paper-Based Point-of-Care Testing toward Being an Indispensable Diagnostic Tool in Future Healthcare, Anal. Chem., 2023, 95(3), 1785–1793 CrossRef CAS PubMed.
- K. M. Koczula and A. Gallotta, Lateral flow assays, Essays Biochem., 2016, 60(1), 111–120 CrossRef PubMed.
- M. Sajid, A. N. Kawde and M. Daud, Designs, formats and applications of lateral flow assay: A literature review, J. Saudi Chem. Soc., 2015, 19(6), 689–705 CrossRef.
- L. Anfossi, C. Baggiani, C. Giovannoli, G. D'Arco and G. Giraudi, Lateral-flow immunoassays for mycotoxins and phycotoxins: A review, Anal. Bioanal. Chem., 2013, 405(2–3), 467–480 CrossRef CAS PubMed.
- A. Sena-Torralba, R. Álvarez-Diduk, C. Parolo, A. Piper and A. Merkoçi, Toward Next Generation Lateral Flow Assays: Integration of Nanomaterials, Chem. Rev., 2022, 122(18), 14881–14910 CrossRef CAS PubMed.
- R. Nalumachu, A. Anandita and D. Rath, Computational modelling of a competitive immunoassay in lateral flow diagnostic devices, Sens. Diagn., 2023, 2, 687–698 RSC.
- C. Davies, Chapter 2.1 – Principles of Competitive and Immunometric Assays (Including ELISA)1, in The Immunoassay Handbook, ed. D. Wild, Elsevier, Oxford, 4th edn, 2013, pp. 29–59 Search PubMed.
- E. Rey, D. O'dell, S. Mehta and D. Erickson, Mitigating the hook effect in lateral flow sandwich immunoassays using real-time reaction kinetics, Anal. Chem., 2017, 89(9), 5095–5100 CrossRef CAS PubMed.
- D. V. Sotnikov, L. V. Barshevskaya, A. V. Bartosh, A. V. Zherdev and B. B. Dzantiev, Double Competitive Immunodetection of Small Analyte: Realization for Highly Sensitive Lateral Flow Immunoassay of Chloramphenicol, Biosensors, 2022, 12(5), 343 CrossRef CAS PubMed.
- M. Mao, Z. Xie, P. Ma, C. Peng, Z. Wang and X. Wei, et al., Design and optimizing gold nanoparticle-cDNA nanoprobes for aptamer-based lateral flow assay: Application to rapid detection of acetamiprid, Biosens. Bioelectron., 2022, 207, 114114 CrossRef CAS PubMed.
- W. Xiao, M. Xiao, S. Yao, H. Cheng, H. Shen and Q. Fu, et al., A Rapid, Simple, and Low-Cost CD4 Cell Count Sensor Based on Blocking Immunochromatographic Strip System, ACS Sens., 2019, 4(6), 1508–1514 CrossRef CAS PubMed.
- W. Xiao, J. Liang, Y. Zhang, Y. Zhang, P. Teng and D. Cao, et al., CD8 cell counting in whole blood by a paper-based time-resolved fluorescence lateral flow immunoassay, Anal. Chim. Acta, 2021, 1179, 338820 CrossRef CAS PubMed.
- I. T. Hull, E. C. Kline, G. K. Gulati, J. H. Kotnik, N. Panpradist and K. G. Shah, et al., Isothermal Amplification with a Target-Mimicking Internal Control and Quantitative Lateral Flow Readout for Rapid HIV Viral Load Testing in Low-Resource Settings, Anal. Chem., 2022, 94(2), 1011–1021 CrossRef CAS PubMed.
- Z. Qie, W. Yan, Z. Gao, W. Meng, R. Xiao and S. Wang, An anti-BSA antibody-based immunochromatographic assay for chloramphenicol and aflatoxin M 1 by using carboxy-modified CdSe/ZnS core-shell nanoparticles as label, Microchim. Acta, 2019, 187(1), 10 CrossRef PubMed.
- S. Zhao, S. Zhang, S. Wang, J. Liu and Y. Dong, Development of Lateral Flow Immunochromatographic Strips for Micropollutants Screening Using Colorants of Aptamer Functionalized Nanogold Particles Part I Methodology and Optimization, J. AOAC Int., 2018, 101(5), 1402–1407 CrossRef CAS PubMed.
- W. Zhou, W. Kong, X. Dou, M. Zhao, Z. Ouyang and M. Yang, An aptamer based lateral flow strip for on-site rapid detection of ochratoxin A in Astragalus membranaceus, J. Chromatogr., B, 2016, 1022, 102–108 CrossRef CAS PubMed.
- N. Cheng, Y. Xu, K. Huang, Y. Chen, Z. Yang and Y. Luo, et al., One-step competitive lateral flow biosensor running on an independent quantification system for smart phones based in-situ detection of trace Hg(II) in tap water, Food Chem., 2017, 214, 169–175 CrossRef CAS PubMed.
- Z. Wu, H. Shen, J. Hu, Q. Fu, C. Yao and S. Yu, et al., Aptamer-based fluorescence-quenching lateral flow strip for rapid detection of mercury (II) ion in water samples, Anal. Bioanal. Chem., 2017, 409(22), 5209–5216 CrossRef CAS PubMed.
- G. Zhang, C. Zhu, Y. Huang, J. Yan and A. Chen, A Lateral Flow Strip Based Aptasensor for Detection of Ochratoxin A in Corn Samples, Molecules, 2018, 23(2), 291 CrossRef PubMed.
- L. Kaiser, J. Weisser, M. Kohl and H. P. Deigner, Small molecule detection with aptamer based lateral flow assays: Applying aptamer-C-reactive protein cross-recognition for ampicillin detection, Sci. Rep., 2018, 8(1), 5628 CrossRef PubMed.
- M. N. Alnajrani and O. A. Alsager, Lateral flow aptasensor for progesterone: Competitive target recognition and displacement of short complementary sequences, Anal. Biochem., 2019, 587, 113461 CrossRef CAS PubMed.
- H. Lin, F. Fang, J. Zang, J. Su, Q. Tian and R. K. Kankala, et al., A Fluorescent Sensor-Assisted Paper-Based Competitive Lateral Flow Immunoassay for the Rapid and Sensitive Detection of Ampicillin in Hospital Wastewater, Micromachines, 2020, 11(4), 431 CrossRef PubMed.
- M. N. Alnajrani, M. M. Aljohani, R. Chinnappan, M. Zourob and O. A. Alsager, Highly sensitive and selective lateral flow aptasensor for anti-coagulant dabigatran etexilate determination in blood, Talanta, 2022, 236, 122887 CrossRef CAS PubMed.
- A. Sena-Torralba, D. B. Ngo, C. Parolo, L. Hu, R. Álvarez-Diduk and J. F. Bergua, et al., Lateral flow assay modified with time-delay wax barriers as a sensitivity and signal enhancement strategy, Biosens. Bioelectron., 2020, 168, 112559 CrossRef CAS PubMed.
- J. D. Bishop, H. V. Hsieh, D. J. Gasperino and B. H. Weigl, Sensitivity enhancement in lateral flow assays: a systems perspective, Lab Chip, 2019, 19(15), 2486–2499 RSC.
- Y. Liu, L. Zhan, Z. Qin, J. Sackrison and J. C. Bischof, Ultrasensitive and Highly Specific Lateral Flow Assays for Point-of-Care Diagnosis, ACS Nano, 2021, 15(3), 3593–3611 CrossRef CAS PubMed.
- I. Safenkova, A. Zherdev and B. Dzantiev, Factors influencing the detection limit of the lateral-flow sandwich immunoassay: A case study with potato virus X, Anal. Bioanal. Chem., 2012, 403(6), 1595–1605 CrossRef CAS PubMed.
- S. Cavalera, A. Gelli, F. Di Nardo, T. Serra, V. Testa and S. Bertinetti, et al., Improving the sensitivity and the cost-effectiveness of a competitive visual lateral flow immunoassay through sequential designs of experiments, Microchem. J., 2025, 208, 112450 CrossRef CAS.
- S. A. Berson and R. S. Yalow, Quantitative aspects of the reaction between insulin and insulin-binding antibody, J. Clin. Invest., 1959, 38(11), 1996–2016 CrossRef CAS PubMed.
- D. V. Sotnikov, A. V. Zherdev and B. B. Dzantiev, Mathematical modeling of bioassays, Biochemistry, 2017, 82(13), 1744–1766 CAS.
- B. Esteban Fernández de Ávila, H. M. Watkins, J. M. Pingarrón, K. W. Plaxco, G. Palleschi and F. Ricci, Determinants of the Detection Limit and Specificity of Surface-Based Biosensors, Anal. Chem., 2013, 85(14), 6593–6597 CrossRef PubMed.
- D. J. Gasperino, D. Leon, B. Lutz, D. M. Cate, K. P. Nichols and D. Bell, et al., Threshold-Based Quantification in a Multiline Lateral Flow Assay via Computationally Designed Capture Efficiency, Anal. Chem., 2018, 90(11), 6643–6650 CrossRef CAS PubMed.
- X. Zhao, Y. Zhang, Q. Niu, L. Wang, C. Xing and Q. Wang, et al., Research on the Flow Characteristics and Reaction Mechanisms of Lateral Flow Immunoassay under Non-Uniform Flow, Sensors, 2024, 24(6), 1989 CrossRef PubMed.
- D. Gasperino, T. Baughman, H. V. Hsieh, D. Bell and B. H. Weigl, Improving Lateral Flow Assay Performance Using Computational Modeling, Annu. Rev. Anal. Chem., 2018, 11(1), 219–244 CrossRef PubMed.
- S. Qian and H. H. Bau, Analysis of lateral flow biodetectors: competitive format, Anal. Biochem., 2004, 326(2), 211–224 CrossRef CAS PubMed.
- D. V. Sotnikov, N. A. Byzova, E. A. Zvereva, A. V. Bartosh, A. V. Zherdev and B. B. Dzantiev, Mathematical modeling of immunochromatographic test systems in a competitive format: Analytical and numerical approaches, Biochem. Eng. J., 2020, 164, 107763 CrossRef CAS.
- C. L. A. Berli and P. A. Kler, A quantitative model for lateral flow assays, Microfluid. Nanofluid., 2016, 20(7), 1–9 CrossRef CAS.
- Z. Liu, J. Hu, A. Li, S. Feng, Z. Qu and F. Xu, The effect of report particle properties on lateral flow assays: A mathematical model, Sens. Actuators, B, 2017, 248, 699–707 CrossRef CAS.
- E. Fu, K. E. Nelson, S. A. Ramsey, J. O. Foley, K. Helton and P. Yager, Modeling of a competitive microfluidic heterogeneous immunoassay: sensitivity of the assay response to varying system parameters, Anal. Chem., 2009, 81(9), 3407–3413 CrossRef CAS PubMed.
- C. Berli, S. Claudio, L. A. Berli, E. Elizalde, R. Urteaga and C. L. A. Berli, Rational design of capillary-driven flows for paper-based microfluidics, Lab Chip, 2015, 15(10), 2173–2180 RSC.
- F. Schaumburg, P. A. Kler and C. L. A. Berli, Numerical prototyping of lateral flow biosensors, Sens. Actuators, B, 2018, 259, 1099–1107 CrossRef CAS.
- Z. Liu, Z. Qu, R. Tang, X. He, H. Yang and D. Bai, et al., An improved detection limit and working range of lateral flow assays based on a mathematical model, Analyst, 2018, 143(12), 2775–2783 RSC.
- M. S. Ragavendar and C. M. Anmol, A mathematical model to predict the optimal test line location and sample volume for lateral flow immunoassays, Annu. Int. Conf. IEEE Eng. Med. Biol. Soc., 2012, 2012, 2408–2411 CAS.
- G. Xia, J. Wang, Z. Liu, L. Bai and L. Ma, Effect of sample volume on the sensitivity of lateral flow assays through computational modeling, Anal. Biochem., 2021, 619, 114130 CrossRef CAS PubMed.
- C. Liu, S. Zhai, Q. Zhang and B. Liu, Immunochromatrography detection of human lactoferrin protein in milk from transgenic cattle, J. AOAC Int., 2013, 96(1), 116–120 CrossRef CAS PubMed.
- M. Yamaguchi, Y. Matsuda, S. Sasaki, M. Sasaki, Y. Kadoma and Y. Imai, et al., Immunosensor with Fluid Control Mechanism for Salivary Cortisol Analysis, Biosens. Bioelectron., 2013, 41, 186–191 CrossRef CAS PubMed.
- M. F. Lee, Y. H. Chen, S. J. Lin, H. C. Liu and T. M. Lin, Detection of American cockroach allergens as environmental markers using rapid competitive lateral flow tests, Ann. Allergy, Asthma, Immunol., 2019, 123(3), 301–302 CrossRef PubMed.
- S. L. Znoyko, A. V. Orlov, A. V. Pushkarev, E. N. Mochalova, N. V. Guteneva and A. V. Lunin, et al., Ultrasensitive quantitative detection of small molecules with rapid lateral-flow assay based on high-affinity bifunctional ligand and magnetic nanolabels, Anal. Chim. Acta, 2018, 1034, 161–167 CrossRef CAS PubMed.
- X. Fu, J. Wen, J. Li, H. Lin, Y. Liu and X. Zhuang, et al., Highly sensitive detection of prostate cancer specific PCA3 mimic DNA using SERS-based competitive lateral flow assay, Nanoscale, 2019, 11(33), 15530–15536 RSC.
- A. M. López-Marzo, J. Pons, D. A. Blake and A. Merkoçi, High sensitive gold-nanoparticle based lateral flow Immunodevice for Cd2+ detection in drinking waters, Biosens. Bioelectron., 2013, 47, 190–198 CrossRef PubMed.
- T. Le, P. Yan, J. Xu and Y. Hao, A novel colloidal gold-based lateral flow immunoassay for rapid simultaneous detection of cyromazine and melamine in foods of animal origin, Food Chem., 2013, 138(2–3), 1610–1615 CrossRef CAS PubMed.
- D. Liu, Z. Yu, Y. Huang, S. Wang, J. Wang and Q. Guo, et al., An immuno-magnetic nanobead probe competitive assay for rapid detection of salmonella choleraesuis, J. Nanosci. Nanotechnol., 2016, 16(3), 2291–2295 CrossRef CAS PubMed.
- D. B. Wang, B. Tian, Z. P. Zhang, J. Y. Deng, Z. Q. Cui and R. F. Yang, et al., Rapid detection of Bacillus anthracis spores using a super-paramagnetic lateral-flow immunological detection system, Biosens. Bioelectron., 2013, 42(1), 661–667 CrossRef CAS PubMed.
- V. V. Vrublevskaya, V. N. Afanasyev, A. A. Grinevich, Y. Y. Skarga, P. P. Gladyshev and S. A. Ibragimova, et al., Development of a competitive double antibody lateral flow assay for the detection of antibodies specific to glycoprotein B of Aujeszky's disease virus in swine sera, J. Virol. Methods, 2017, 240, 54–62 CrossRef CAS PubMed.
- S. Liu, X. Luo, R. Shu, Y. Liao, L. Dou and T. Bu, et al., Engineered Core–Shell Multifunctional Nano-Tracer in Raman-Silent Region with Highly Retained Affinity to Enhance Lateral Flow Immunoassays, Small, 2022, 18(45), e2204859 CrossRef PubMed.
- K. V. Serebrennikova, O. D. Hendrickson, E. A. Zvereva, D. S. Popravko, A. V. Zherdev and C. Xu, et al., A Comparative Study of Approaches to Improve the Sensitivity of Lateral Flow Immunoassay of the Antibiotic Lincomycin, Biosensors, 2020, 10(12), 198 CrossRef CAS PubMed.
- Q. Shi, J. Huang, Y. Sun, R. Deng, M. Teng and Q. Li, et al., A SERS-based multiple immuno-nanoprobe for ultrasensitive detection of neomycin and quinolone antibiotics via a lateral flow assay, Microchim. Acta, 2018, 185(2), 84 CrossRef PubMed.
- E. Sheng, Y. Lu, Y. Xiao, Z. Li, H. Wang and Z. Dai, Simultaneous and ultrasensitive detection of three pesticides using a surface-enhanced Raman scattering-based lateral flow assay test strip, Biosens. Bioelectron., 2021, 181, 113149 CrossRef CAS PubMed.
- W. Huang, E. Guo, J. Li and A. Deng, Quantitative and ultrasensitive detection of brombuterol by a surface-enhanced Raman scattering (SERS)-based lateral flow immunochromatographic assay (FLIA) using Ag MBA @Au-Ab as an immunoprobe, Analyst, 2021, 146(1), 296–304 RSC.
- D. Li, M. Huang, Z. Shi, L. Huang, J. Jin and C. Jiang, et al., Ultrasensitive Competitive Lateral Flow Immunoassay with Visual Semiquantitative Inspection and Flexible Quantification Capabilities, Anal. Chem., 2022, 94(6), 2996–3004 CrossRef CAS PubMed.
- X. Chen, X. Miao, T. Ma, Y. Leng, L. Hao and H. Duan, et al., Gold Nanobeads with Enhanced Absorbance for Improved Sensitivity in Competitive Lateral Flow Immunoassays, Foods, 2021, 10(7), 1488 CrossRef CAS PubMed.
- H. Shen, F. Xu, M. Xiao, Q. Fu, Z. Cheng and S. Zhang, et al., A new lateral-flow immunochromatographic strip combined with quantum dot nanobeads and gold nanoflowers for rapid detection of tetrodotoxin, Analyst, 2017, 142(23), 4393–4398 RSC.
- J. Wang, C. Jiang, J. Yuan, L. Tong, Y. Wang and D. Zhuo, et al., Hue Recognition Competitive Fluorescent Lateral Flow Immunoassay for Aflatoxin M 1 Detection with Improved Visual and Quantitative Performance, Anal. Chem., 2022, 94(30), 10865–10873 CrossRef CAS PubMed.
- W. Wei-Wen Hsiao, N. Sharma, T. N. Le, Y. Y. Cheng, C. C. Lee and D. T. Vo, et al., Fluorescent nanodiamond-based spin-enhanced lateral flow immunoassay for detection of SARS-CoV-2 nucleocapsid protein and spike protein from different variants, Anal. Chim. Acta, 2022, 1230, 340389 CrossRef CAS PubMed.
- Y. Wang, C. Deng, S. Qian, H. Li, P. Fu and H. Zhou, et al., An ultrasensitive lateral flow immunoassay platform for foodborne biotoxins and pathogenic bacteria based on carbon-dots embedded mesoporous silicon nanoparticles fluorescent reporter probes, Food Chem., 2023, 399, 133970 CrossRef CAS PubMed.
- X. Ruan, V. Hulubei, Y. Wang, Q. Shi, N. Cheng and L. Wang, et al., Au@PtPd enhanced immunoassay with 3D printed smartphone device for quantification of diaminochlorotriazine (DACT), the major atrazine biomarker, Biosens. Bioelectron., 2022, 208, 114190 CrossRef CAS PubMed.
- H. K. Oh, J. W. Kim, J. M. Kim and M. G. Kim, High sensitive and broad-range detection of cortisol in human saliva using a trap lateral flow immunoassay (trapLFI) sensor, Analyst, 2018, 143(16), 3883–3889 RSC.
- M. Zangheri, F. Di Nardo, M. Mirasoli, L. Anfossi, A. Nascetti and D. Caputo, et al., Chemiluminescence lateral flow immunoassay cartridge with integrated amorphous silicon photosensors array for human serum albumin detection in urine samples, Anal. Bioanal. Chem., 2016, 408(30), 8869–8879 CrossRef CAS PubMed.
- J. V. Samsonova, V. A. Safronova and A. P. Osipov, Pretreatment-free lateral flow enzyme immunoassay for progesterone detection in whole cows' milk, Talanta, 2015, 132, 685–689 CrossRef CAS PubMed.
- M. Zangheri, F. Di Nardo, L. Anfossi, C. Giovannoli, C. Baggiani and A. Roda, et al., A multiplex chemiluminescent biosensor for type B-fumonisins and aflatoxin B1 quantitative detection in maize flour, Analyst, 2015, 140(1), 358–365 RSC.
- M. Zangheri, L. Cevenini, L. Anfossi, C. Baggiani, P. Simoni and F. Di Nardo, et al., A simple and compact smartphone accessory for quantitative chemiluminescence-based lateral flow immunoassay for salivary cortisol detection, Biosens. Bioelectron., 2015, 64, 63–68 CrossRef CAS PubMed.
- A. Apilux, S. Rengpipat, W. Suwanjang and O. Chailapakul, Development of competitive lateral flow immunoassay coupled with silver enhancement for simple and sensitive salivary cortisol detection, EXCLI J., 2018, 17, 1198–1209 Search PubMed.
- S. Lee, D. O'Dell, J. Hohenstein, S. Colt, S. Mehta and D. Erickson, NutriPhone: a mobile platform for low-cost point-of-care quantification of vitamin B12 concentrations, Sci. Rep., 2016, 6, 28237 CrossRef CAS PubMed.
- L. Anfossi, F. Di Nardo, C. Giovannoli, C. Passini and C. Baggiani, Increased sensitivity of lateral flow immunoassay for ochratoxin A through silver enhancement, Anal. Bioanal. Chem., 2013, 405(30), 9859–9867 CrossRef CAS PubMed.
- M. Jauset-Rubio, M. Svobodová, T. Mairal, C. McNeil, N. Keegan and M. S. El-Shahawi, et al., Aptamer Lateral Flow Assays for Ultrasensitive Detection of β-Conglutin Combining Recombinase Polymerase Amplification and Tailed Primers, Anal. Chem., 2016, 88(21), 10701–10709 CrossRef CAS PubMed.
- X. Zhu, P. Shah, S. Stoff, H. Liu and C. Z. Li, Paper electrode integrated lateral flow immunosensor for quantitative analysis of oxidative stress induced DNA damage, Analyst, 2014, 139(11), 2850–2857 RSC.
- S. Lee, G. Kim and J. Moon, Performance improvement of the one-dot lateral flow immunoassay for aflatoxin B1 by using a smartphone-based reading system, Sensors, 2013, 13(4), 5109–5116 CrossRef CAS PubMed.
- A. E. Urusov, A. V. Petrakova, A. V. Zherdev and B. B. Dzantiev, “Multistage in one touch” design with a universal labelling conjugate for high-sensitive lateral flow immunoassays, Biosens. Bioelectron., 2016, 86, 575–579 CrossRef CAS PubMed.
- Y. Zhao, X. Liu, X. Wang, C. Sun, X. Wang and P. Zhang, et al., Development and evaluation of an up-converting phosphor technology-based lateral flow assay for rapid and quantitative detection of aflatoxin B1 in crops, Talanta, 2016, 161, 297–303 CrossRef CAS PubMed.
- C. Zhu, G. Zhang, Y. Huang, S. Yang, S. Ren and Z. Gao, et al., Dual-competitive lateral flow aptasensor for detection of aflatoxin B1 in food and feedstuffs, J. Hazard. Mater., 2018, 344, 249–257 CrossRef CAS PubMed.
- S. Yu, L. He, F. Yu, L. Liu, C. Qu and L. Qu, et al., A lateral flow assay for simultaneous detection of Deoxynivalenol, Fumonisin B1 and Aflatoxin B1, Toxicon, 2018, 156, 23–27 CrossRef CAS PubMed.
- T. Bu, F. Bai, X. Sun, Y. Tian, M. Zhang and S. Zhao, et al., An innovative prussian blue nanocubes decomposition-assisted signal amplification strategy suitable for competitive lateral flow immunoassay to sensitively detect aflatoxin B1, Food Chem., 2021, 344, 128711 CrossRef CAS PubMed.
- Y. Wang, X. Wang, S. Wang, H. Fotina and Z. Wang, A Novel Lateral Flow Immunochromatographic Assay for Rapid and Simultaneous Detection of Aflatoxin B1 and Zearalenone in Food and Feed Samples Based on Highly Sensitive and Specific Monoclonal Antibodies, Toxins, 2022, 14(9), 615 CrossRef CAS PubMed.
- V. Greco, M. Locatelli, F. Savini, U. de Grazia, O. Montanaro and E. Rosato, et al., New Challenges in (Bio)Analytical Sample Treatment Procedures for Clinical Applications, Separations, 2023, 10(1), 62 CrossRef CAS.
- T. V. Tran, B. N. Do, T. P. T. Nguyen, T. T. Tran, S. C. Tran and N. B. Van, et al., Development of an IgY-based lateral flow immunoassay for detection of fumonisin B in maize, F1000Research, 2019, 8, 1042 CAS.
- C. Wang, J. Peng, D. F. Liu, K. Y. Xing, G. G. Zhang and Z. Huang, et al., Lateral flow immunoassay integrated with competitive and sandwich models for the detection of aflatoxin M1 and Escherichia coli O157:H7 in milk, J. Dairy Sci., 2018, 101(10), 8767–8777 CrossRef CAS PubMed.
- L. Su, L. Wang, J. Xu, Z. Wang, X. Yao and J. Sun, et al., Competitive Lateral Flow Immunoassay Relying on Au-SiO2 Janus Nanoparticles with an Asymmetric Structure and Function for Furazolidone Residue Monitoring, J. Agric. Food Chem., 2021, 69(1), 511–519 CrossRef CAS PubMed.
- J. Liu, Q. Yu, G. Zhao and W. Dou, Ultramarine blue nanoparticles as a label for immunochromatographic on-site determination of ractopamine, Microchim. Acta, 2020, 187(5), 285 CrossRef CAS PubMed.
- S. Shao, W. Shang, Y. Bai, L. Dou, S. Zhang and J. Shen, et al., Development of a Highly Sensitive and Specific ic-ELISA and Lateral Flow Immunoassay for Diacetoxyscirpenol, Foods, 2022, 1(11), 1548 CrossRef PubMed.
- P. Wang, X. Xu, S. Song, W. Aihong and L. Liu, et al., Rapid and sensitive detection of clomazone in potato and pumpkin samples using a gold nanoparticle-based lateral-flow strip, Food Chem., 2022, 375, 131888 CrossRef CAS PubMed.
- M. Chao, X. Xu, L. Liu, A. Wu, S. Song and H. Kuang, et al., Ultrasensitive immunochromatographic strip assay for the detection of diminazene, Analyst, 2021, 146(15), 4927–4933 RSC.
- P. Preechakasedkit, N. Ngamrojanavanich, N. Khongchareonporn and O. Chailapakul, Novel ractopamine-protein carrier conjugation and its application to the lateral flow strip test for ractopamine detection in animal feed, J. Zhejiang Univ., Sci., B, 2019, 20(2), 193–204 CrossRef CAS PubMed.
- X. Yang, J. Yang, Y. Wang, L. Li, Z. Sun and Z. Yue, et al., A Lateral Flow Immunochromato-graphic Strip Test for Rapid Detection of Oseltamivir Phosphate in Egg and Chicken Meat, Sci. Rep., 2018, 8(1), 16680 CrossRef PubMed.
- R. Wang, W. Zhang, P. Wang and X. Su, A paper-based competitive lateral flow immunoassay for multi β-agonist residues by using a single monoclonal antibody labelled with red fluorescent nanoparticles, Microchim. Acta, 2018, 185(3), 191 CrossRef PubMed.
- C. Suárez-Pantaleón, J. Wichers, A. Abad-Somovilla, A. Van Amerongen and A. Abad-Fuentes, Development of an immunochromatographic assay based on carbon nanoparticles for the determination of the phytoregulator forchlorfenuron, Biosens. Bioelectron., 2013, 42, 170–176 CrossRef PubMed.
- P. P. J. Mulder, C. von Holst, N. Nivarlet and H. P. van Egmond, Intra- and inter-laboratory validation of a dipstick immunoassay for the detection of tropane alkaloids hyoscyamine and scopolamine in animal feed, Food Addit. Contam.,: Part A, 2014, 31(7), 1165–1176 CAS.
- Y. Li, G. Jin, L. Liu, H. Kuang, J. Xiao and C. Xu, A portable fluorescent microsphere-based lateral flow immunosensor for the simultaneous detection of colistin and bacitracin in milk, Analyst, 2020, 145(24), 7884–7892 RSC.
- D. B. Wang, B. Tian, Z. P. Zhang, X. Y. Wang, J. Fleming and L. J. Bi, et al., Detection of Bacillus anthracis spores by super-paramagnetic lateral-flow immunoassays based on “Road Closure.”, Biosens. Bioelectron., 2015, 67, 608–614 CrossRef CAS PubMed.
- R. Deb, P. Chaudhary, P. Pal, R. S. Tomar and M. Roshan, et al., Development of an on-site lateral flow immune assay based on mango leaf derived colloidal silver nanoparticles for rapid detection of Staphylococcus aureus in milk, J. Food Sci. Technol., 2023, 60(1), 132–146 CrossRef CAS PubMed , available from: http://www.ncbi.nlm.nih.gov/pubmed/36618039.
- L. Zeng, L. Guo, Z. Wang, X. Xu, S. Song and L. Xu, et al., Immunoassays for the rapid detection of pantothenic acid in pharmaceutical and food products, Food Chem., 2021, 348, 129114 CrossRef CAS PubMed.
- R. Sharma, A. Verma, N. Shinde, B. Mann, K. Gandhi and J. H. Wichers, et al., Adulteration of cow's milk with buffalo's milk detected by an on-site carbon nanoparticles-based lateral flow immunoassay, Food Chem., 2021, 351, 129311 CrossRef CAS PubMed.
- A. S. Novikova, T. S. Ponomaryova and I. Y. Goryacheva, Fluorescent AgInS/ZnS quantum dots microplate and lateral flow immunoassays for folic acid determination in juice samples, Microchim. Acta, 2020, 187(8), 427 CrossRef CAS PubMed.
- Q. Shi, J. Huang, Y. Sun, M. Yin, M. Hu and X. Hu, et al., Utilization of a lateral flow colloidal gold immunoassay strip based on surface-enhanced Raman spectroscopy for ultrasensitive detection of antibiotics in milk, Spectrochim. Acta, Part A, 2018, 197, 107–113 CrossRef CAS PubMed.
- H. Jiang, X. Li, Y. Xiong, K. Pei, L. Nie and Y. Xiong, Silver Nanoparticle-Based Fluorescence-Quenching Lateral Flow Immunoassay for Sensitive Detection of Ochratoxin A in Grape Juice and Wine, Toxins, 2017, 9(3), 83 CrossRef PubMed.
- M. Yin, X. Hu, Y. Sun, Y. Xing, G. Xing and Y. Wang, et al., Broad-spectrum detection of zeranol and its analogues by a colloidal gold-based lateral flow immunochromatographic assay in milk, Food Chem., 2020, 321, 126697 CrossRef CAS PubMed.
- Y. Sun, J. Yang, S. Yang, Q. Sang, M. Teng and Q. Li, et al., Development of an immunochromatographic lateral flow strip for the simultaneous detection of aminoglycoside residues in milk, RSC Adv., 2018, 8(17), 9580–9586 RSC.
- L. Naik, R. Sharma, B. Mann, K. Lata, Y. S. Rajput and N. B. Surendra, Rapid screening test for detection of oxytetracycline residues in milk using lateral flow assay, Food Chem., 2017, 219, 85–92 CrossRef CAS PubMed.
- M. Bond, B. Hunt, B. Flynn, P. Huhtinen, R. Ware and R. Richards-Kortum, Towards a point-of-care strip test to diagnose sickle cell anemia, PLoS One, 2017, 12(5), e0177732 CrossRef PubMed.
- C. T. Quinn, M. C. Paniagua, R. K. DiNello, A. Panchal and M. Geisberg, A rapid, inexpensive and disposable point-of-care blood test for sickle cell disease using novel, highly specific monoclonal antibodies, Br. J. Haematol., 2016, 175(4), 724–732 CrossRef CAS PubMed.
- M. Naif Alhussien and A. Kumar Dang, Sensitive and rapid lateral-flow assay for early detection of subclinical mammary infection in dairy cows, Sci. Rep., 2020, 10(1), 11161 CrossRef PubMed.
- G. E. Davies and C. R. Thornton, Development of a Monoclonal Antibody and a Serodiagnostic Lateral-Flow Device Specific to Rhizopus arrhizus (Syn. R. oryzae), the Principal Global Agent of Mucormycosis in Humans, J. Fungi, 2022, 8(7), 756 CrossRef CAS PubMed.
- P. Tripathi, A. Kumar, M. Sachan, S. Gupta and S. Nara, Aptamer-gold nanozyme based competitive lateral flow assay for rapid detection of CA125 in human serum, Biosens. Bioelectron., 2020, 165, 112368 CrossRef CAS PubMed.
- E. G. Rey, J. L. Finkelstein and D. Erickson, Fluorescence lateral flow competitive protein binding assay for the assessment of serum folate concentrations, PLoS One, 2019, 14(6), e0217403 CrossRef CAS PubMed.
- J. P. Campbell, J. L. J. Heaney, M. Shemar, D. Baldwin, A. E. Griffin and E. Oldridge, et al., Development of a rapid and quantitative lateral flow assay for the simultaneous measurement of serum κ and λ immunoglobulin free light chains (FLC): Inception of a new near-patient FLC screening tool, Clin. Chem. Lab. Med., 2017, 55(3), 424–434 CAS.
- X. Qi, Y. Huang, Z. Lin, L. Xu and H. Yu, Dual-Quantum-Dots-Labeled Lateral Flow Strip Rapidly Quantifies Procalcitonin and C-reactive Protein, Nanoscale Res. Lett., 2016, 11(1), 167 CrossRef PubMed.
- P. Ghezzi, E. A. Shirtcliff, O. Miočević, C. R. Cole and M. J. Laughlin, Quantitative Lateral Flow Assays for Salivary Biomarker Assessment: A Review, Front. Public Health, 2017, 5, 133 CrossRef PubMed.
- J. Zhu, L. Dou, J. Mi, Y. Bai, M. Liu and J. Shen, et al., Production of highly sensitive monoclonal antibody and development of lateral flow assays for phallotoxin detection in urine, Anal. Bioanal. Chem., 2021, 413(20), 4979–4987 CrossRef CAS PubMed.
- N. Larpant, P. K. Kalambate, T. Ruzgas and W. Laiwattanapaisal, Paper-Based Competitive Immunochromatography Coupled with an Enzyme-Modified Electrode to Enable the Wireless Monitoring and Electrochemical Sensing of Cotinine in Urine, Sensors, 2021, 21(5), 1659 CrossRef CAS PubMed.
- N. Vutthikraivit, P. Kiatamornrak, C. Boonkrai, T. Pisitkun, K. Komolpis and S. Puthong, et al., Development and validation of point-of-care testing of albuminuria for early screening of chronic kidney disease, J. Clin. Lab. Anal., 2021, 35(4), e23729 CrossRef CAS PubMed.
- K. Misawa, T. Yamamoto, Y. Hiruta, H. Yamazaki and D. Citterio, Text-Displaying Semiquantitative Competitive Lateral Flow Immunoassay Relying on Inkjet-Printed Patterns, ACS Sens., 2020, 5(7), 2076–2085 CrossRef CAS PubMed.
- Q. He, H. Yang, Y. Chen, D. Shen, X. Cui and C. Zhang, et al., Prussian blue nanoparticles with peroxidase-mimicking properties in a dual immunoassays for glycocholic acid, J. Pharm. Biomed. Anal., 2020, 187, 113317 CrossRef CAS PubMed.
- Z. Li, H. Chen, S. Feng, K. Liu and P. Wang, Development and Clinical Validation of a Sensitive Lateral Flow Assay for Rapid Urine Fentanyl Screening in the Emergency Department, Clin. Chem., 2020, 66(2), 324–332 CrossRef PubMed.
- X. Li, W. Wang, L. Wang, Q. Wang, X. Pei and H. Jiang, Rapid determination of phenylethanolamine A in biological samples by enzyme-linked immunosorbent assay and lateral-flow immunoassay, Anal. Bioanal. Chem., 2015, 407(25), 7615–7624 CrossRef CAS PubMed.
- N. V. Guteneva, S. L. Znoyko, A. V. Orlov, M. P. Nikitin and P. I. Nikitin, Rapid lateral flow assays based on the quantification of magnetic nanoparticle labels for multiplexed immunodetection of small molecules: application to the determination of drugs of abuse, Microchim. Acta, 2019, 186(9), 621 CrossRef PubMed.
- X. Hu, J. Wan, X. Peng, H. Zhao, D. Shi and L. Mai, et al., Calorimetric lateral flow immunoassay detection platform based on the photothermal effect of gold nanocages with high sensitivity, specificity, and accuracy, Int. J. Nanomed., 2019, 14, 7695 CrossRef CAS PubMed.
- H. Yang, Q. He, Y. Chen, D. Shen, H. Xiao and S. A. Eremin, et al., Platinum nanoflowers with peroxidase-like property in a dual immunoassay for dehydroepiandrosterone, Microchim. Acta, 2020, 187(11), 592 CrossRef CAS PubMed.
- F. Di Nardo, L. Anfossi, L. Ozella, A. Saccani, C. Giovannoli and G. Spano, et al., Validation of a qualitative immunochromatographic test for the noninvasive assessment of stress in dogs, J. Chromatogr., B, 2016, 1028, 192–198 CrossRef CAS PubMed.
- J. Liu, X. Hu, F. Cao, Y. Zhang, J. Lu and L. Zeng, A lateral flow strip based on gold nanoparticles to detect 6-monoacetylmorphine in oral fluid, R. Soc. Open Sci., 2018, 5(6), 180288 CrossRef PubMed.
- S. Dalirirad and A. J. Steckl, Aptamer-based lateral flow assay for point of care cortisol detection in sweat, Sens. Actuators, B, 2019, 283, 79–86 CrossRef CAS.
- M. Hudson, T. Stuchinskaya, S. Ramma, J. Patel, C. Sievers and S. Goetz, et al., Drug screening using the sweat of a fingerprint: lateral flow detection of Δ9-tetrahydrocannabinol, cocaine, opiates and amphetamine, J. Anal. Toxicol., 2019, 43(2), 88–95 CrossRef CAS PubMed.
- S. Mukherjee, S. Pietrosemoli Salazar, T. Saha, M. D. Dickey and O. D. Velev, Capillary-osmotic wearable patch based on lateral flow assay for sweat potassium analysis, Sens. Actuators, B, 2024, 419, 136383 CrossRef CAS.
- Q. Chen, L. Yao, J. Xu, Q. Qi, S. Tao and X. Song, et al., Stepwise Au decoration-assisted double signal amplified lateral flow strip for ultrasensitive detection of morphine in fingerprint sweat, Anal. Chim. Acta, 2023, 1278, 341684 CrossRef CAS PubMed.
- G. R. Yang, W. Kim and J. H. Jung, Sliding Microneedle – Lateral flow immunoassay strip device for highly sensitive biomarker detection in interstitial fluid, Biosens. Bioelectron., 2024, 263, 116590 CrossRef CAS PubMed , available from: https://www.sciencedirect.com/science/article/pii/S0956566324005955.
- A. Sena-Torralba, M. Parrilla, A. Hernanz-Grimalt, A. Steijlen, E. Ortiz-Zapater and C. Cabaleiro-Otero, et al., Integrated 3D-Printed Hollow Microneedle Array and Lateral Flow Immunoassay for Point-of-Care Wound Healing Monitoring, Anal. Chem., 2024, 96(52), 20684–20692 CrossRef CAS PubMed.
- E. C. Wilkirson, D. Li and P. B. Lillehoj, Lateral Flow-Based Skin Patch for Rapid Detection of Protein Biomarkers in Human Dermal Interstitial Fluid, ACS Sens., 2024, 9(11), 5792–5801 CrossRef CAS PubMed.
- W. Sae-Foo, S. Krittanai, W. Juengsanguanpornsuk, G. Yusakul, S. Sakamoto and W. Putalun, Fragment antigen-binding (Fab) antibody-based lateral flow immunoassay for rapid and sensitive detection of potent phytoestrogen, deoxymiroestrol, J. Nat. Med., 2021, 75(4), 1043–1049 CrossRef CAS PubMed.
- S. Limsuwanchote, W. Putalun, H. Tanaka, S. Morimoto, N. Keawpradub and J. Wungsintaweekul, Development of an immunochromatographic strip incorporating anti-mitragynine monoclonal antibody conjugated to colloidal gold for kratom alkaloids detection, Drug Test. Anal., 2017, 10(7), 1168–1175 CrossRef PubMed.
- J. Qian, M. Wang, Z. Wang, R. Feng, J. Zhang and C. Ye, et al., Development of single and multiplexing immunoassays for rapid detection and quantitation of amodiaquine in ACT drugs and rat serum, Anal. Bioanal. Chem., 2022, 414(4), 1631–1640 CrossRef CAS PubMed.
- L. He, T. Nan, Y. Cui, S. Guo, W. Zhang and R. Zhang, et al., Development of a colloidal gold-based lateral flow dipstick immunoassay for rapid qualitative and semi-quantitative analysis of artesunate and dihydroartemisinin, Malar. J., 2014, 13, 127 CrossRef PubMed.
- A. Chen and S. Yang, Replacing antibodies with aptamers in lateral flow immunoassay, Biosens. Bioelectron., 2015, 71, 230–242 CrossRef CAS PubMed.
- L. Huang, S. Tian, W. Zhao, K. Liu, X. Ma and J. Guo, Aptamer-based lateral flow assay on-site biosensors, Biosens. Bioelectron., 2021, 186, 113279 CrossRef CAS PubMed.
- J. Yao, Z. Wang, L. Guo, X. Xu, L. Liu and H. Kuang, et al., Lateral flow immunoassay for the simultaneous detection of fipronil and its metabolites in food samples, Food Chem., 2021, 356, 129710 CrossRef CAS PubMed.
- M. H. Fadlalla, S. Ling, R. Wang, X. Li, J. Yuan and S. Xiao, et al., Development of ELISA and Lateral Flow Immunoassays for Ochratoxins (OTA and OTB) Detection Based on Monoclonal Antibody, Front. Cell. Infect. Microbiol., 2020, 10, 80 CrossRef CAS PubMed.
- J. Qian, M. Wang, M. Zhang, R. Feng, J. Zhang and C. Ye, et al., Development and application of immunoassays for rapid quality control of the antimalarial drug combination artesunate-mefloquine, J. Pharm. Biomed. Anal., 2022, 207, 114342 CrossRef CAS PubMed.
- J. Xu, J. Zhou, T. Bu, L. Dou, K. Liu and S. Wang, et al., Self-Assembling Antibody Network Simplified Competitive Multiplex Lateral Flow Immunoassay for Point-of-Care Tests, Anal. Chem., 2022, 94(3), 1585–1593 CrossRef CAS PubMed.
- A. C. Mirica, D. Stan, I. C. Chelcea, C. M. Mihailescu, A. Ofiteru and L. A. Bocancia-Mateescu, Latest Trends in Lateral Flow Immunoassay (LFIA) Detection Labels and Conjugation Process, Front. Bioeng. Biotechnol., 2022, 10, 922772 CrossRef PubMed.
- I. Y. Goryacheva, P. Lenain and S. De Saeger, Nanosized labels for rapid immunotests, TrAC, Trends Anal. Chem., 2013, 46, 30–43 CrossRef CAS.
- H. Shin, D. Jang, J. Hwang, Y. Jang, M. Cho and K. Park, Structural characterization of CdSe/ZnS core–shell quantum dots (QDs) using TEM/STEM observation, J. Mater. Sci.: Mater. Electron., 2014, 25(5), 2047–2052 CrossRef CAS.
- Z. Wang and L. Ma, Gold nanoparticle probes, Coord. Chem. Rev., 2009, 253(11–12), 1607–1618 CrossRef CAS.
- M. Seydack, Nanoparticle labels in immunosensing using optical detection methods, Biosens. Bioelectron., 2005, 20(12), 2454–2469 CrossRef CAS PubMed.
- C. Martinez-Liu, C. Machain-Williams, N. Martinez-Acuña, S. Lozano-Sepulveda, K. Galan-Huerta and D. Arellanos-Soto, et al., Development of a Rapid Gold Nanoparticle-Based Lateral Flow Immunoassay for the Detection of Dengue Virus, Biosensors, 2022, 12(7), 495 CrossRef CAS PubMed.
- R. E. Cevallos-Cedeño, G. Quiñones-Reyes, C. Agulló, A. Abad-Somovilla, A. Abad-Fuentes and J. V. Mercader, Rapid Immunochemical Methods for Anatoxin-a Monitoring in Environmental Water Samples, Anal. Chem., 2022, 94(30), 10857–10864 CrossRef PubMed.
- O. D. Hendrickson, E. A. Zvereva, O. N. Solopova, N. E. Varlamov, O. B. Shemchukova and A. V. Zherdev, et al., Rapid detection of phycotoxin domoic acid in seawater and seafood based on the developed lateral flow immunoassay, Anal. Methods, 2022, 14(24), 2446–2452 RSC.
- N. M. Moloney, A. Larkin, L. Xu, D. A. Fitzpatrick, H. L. Crean and K. Walshe, et al., Generation and characterisation of a semi-synthetic siderophore-immunogen conjugate and a derivative recombinant triacetylfusarinine C–specific monoclonal antibody with fungal diagnostic application, Anal. Biochem., 2021, 632, 114384 CrossRef CAS PubMed.
- S. Cavalera, C. Agulló, J. V. Mercader, F. Di Nardo, M. Chiarello and L. Anfossi, et al., Monoclonal antibodies with subnanomolar affinity to tenofovir for monitoring adherence to antiretroviral therapies: From hapten synthesis to prototype development, J. Mater. Chem. B, 2020, 8(45), 10439–10449 RSC.
- X. H. Zhou, C. Q. Zhang, X. Zhang, C. Sun, J. Li and X. Xiao, et al., Determination of Fipronil and Its Metabolites in Eggs by Indirect Competitive ELISA and Lateral-flow Immunochromatographic Strip, Biomed. Environ. Sci., 2020, 33(9), 731–734 CAS.
- V. Nayan, E. S. Sinha, S. K. Onteru and D. Singh, A proof-of-concept of lateral flow based luteinizing hormone detection in urine for ovulation prediction in buffaloes, Anal. Methods, 2020, 12(26), 3411–3424 RSC.
- J. Liu, S. Song, A. Wu, X. Wu, J. Xiao and C. Xu, Development of a gold nanoparticle-based lateral-flow strip for the detection of dinitolmide in chicken tissue, Anal. Methods, 2020, 12(25), 3210–3217 RSC.
- G. Jin, X. Wu, G. Cui, L. Liu, H. Kuang and C. Xu, Development of an ic-ELISA and Immunochromatographic Strip Assay for the Detection of Diacetoxyscirpenol in Rice, ACS Omega, 2020, 5(29), 17876–17882 CrossRef CAS PubMed.
- F. Ling, L. Liu, H. Kuang, G. Cui and C. Xu, Development of Indirect Competitive Enzyme-Linked Immunosorbent Assay and Lateral-Flow Immunochromatographic Strip for the Detection of Digoxin in Human Blood, ACS Omega, 2020, 5(3), 1371–1376 CrossRef CAS PubMed.
- Y. Li, L. Liu, H. Kuang and C. Xu, Visible and eco-friendly immunoassays for the detection of cyclopiazonic acid in maize and rice, J. Food Sci., 2020, 85(1), 105–113 CrossRef CAS PubMed.
- X. Chen, J. He, G. Tan, J. Liang, Y. Hou and M. Wang, et al., Development of an enzyme-linked immunosorbent assay and a dipstick assay for the rapid analysis of trans-resveratrol in grape berries, Food Chem., 2019, 291, 132–138 CrossRef CAS PubMed.
- B. Liu, J. Si, F. Zhao, Q. Wang, Y. Wang and J. Li, et al., Rapid detection of cow milk adulteration/contamination in goat milk by a lateral flow colloidal gold immunoassay strip, J. Dairy Res., 2019, 86(1), 94–97 CrossRef CAS PubMed.
- D. Quesada-González, G. A. Jairo, R. C. Blake, D. A. Blake and A. Merkoçi, Uranium (VI) detection in groundwater using a gold nanoparticle/paper-based lateral flow device, Sci. Rep., 2018, 8(1), 16157 CrossRef PubMed.
- D. Kong, X. Wu, Y. Li, L. Liu, S. Song and Q. Zheng, et al., Ultrasensitive and eco-friendly immunoassays based monoclonal antibody for detection of deoxynivalenol in cereal and feed samples, Food Chem., 2019, 270, 130–137 CrossRef CAS PubMed.
- X. Ning, W. Li, M. Wang, S. Guo, G. Tan and B. Wang, et al., Development of monoclonal antibody-based immunoassays for quantification and rapid assessment of dihydroartemisinin contents in antimalarial drugs, J. Phram. Biomed. Anal., 2018, 159, 66–72 CrossRef CAS PubMed.
- G. W. Pratt, A. Fan, B. Melakeberhan and C. M. Klapperich, A competitive lateral flow assay for the detection of tenofovir, Anal. Chim. Acta, 2018, 1017, 34–40 CrossRef CAS PubMed.
- M. Castellarnau, J. Ramón-Azcón, Y. Gonzalez-Quinteiro, J. F. López, J. O. Grimalt and M. P. Marco, et al., Assessment of analytical methods to determine pyrethroids content of bednets, Trop. Med. Int. Health, 2017, 22(1), 41–51 CrossRef CAS PubMed.
- A. J. Wakeham, G. Keane and R. Kennedy, Field Evaluation of a Competitive Lateral-Flow Assay for Detection of Alternaria brassicae in Vegetable Brassica Crops, Plant Dis., 2016, 100(9), 1831–1839 CrossRef PubMed.
- M. Gholamzad, M. R. Khatami, S. Ghassemi, Z. V. Malekshahi and M. B. Shooshtari, Detection of Staphylococcus Enterotoxin B (SEB) Using an Immunochromatographic Test Strip, Jundishapur J. Microbiol., 2015, 8(9), e26793 Search PubMed.
- Y. Liu, A. Wu, J. Hu, M. Lin, M. Wen and X. Zhang, et al., Detection of 3-phenoxybenzoic acid in river water with a colloidal gold-based lateral flow immunoassay, Anal. Biochem., 2015, 483, 7–11 CrossRef CAS PubMed.
- T. Peng, F. S. Zhang, W. C. Yang, D. X. Li, Y. Chen and Y. H. Xiong, et al., Lateral-Flow Assay for Rapid Quantitative Detection of Clorprenaline Residue in Swine Urine, J. Food Prot., 2014, 77(10), 1824–1829 CrossRef CAS PubMed.
- E. Maiolini, E. Ferri, A. L. Pitasi, A. Montoya, M. Di Giovanni and E. Errani, et al., Bisphenol A determination in baby bottles by chemiluminescence enzyme-linked immunosorbent assay, lateral flow immunoassay and liquid chromatography tandem mass spectrometry, Analyst, 2014, 139(1), 318–324 RSC.
- G. A. Posthuma-Trumpie, J. H. Wichers, M. Koets, L. B. J. M. Berendsen and A. Van Amerongen, Amorphous carbon nanoparticles: a versatile label for rapid diagnostic (immuno)assays, Anal. Bioanal. Chem., 2012, 402(2), 593–600 CrossRef CAS PubMed.
- V. Kumar, D. Bhatt, Saruchi and S. Pandey, Luminescence nanomaterials for biosensing applications, Luminescence, 2023, 38(7), 1011–1025 CrossRef CAS PubMed.
- L. Bian, J. Liang, H. Zhao, K. Ye, Z. Li and T. Liu, et al., Rapid Monitoring of Vancomycin Concentration in Serum Using Europium (III) Chelate Nanoparticle-Based Lateral Flow Immunoassay, Front. Chem., 2021, 9, 763686 CrossRef CAS PubMed.
- H. Moulahoum, F. Ghorbanizamani and S. Timur, Paper-based lateral flow assay using rhodamine B-loaded polymersomes for the colorimetric determination of synthetic cannabinoids in saliva, Microchim. Acta, 2021, 188(11), 402 CrossRef CAS PubMed.
- M. Masello, Z. Lu, D. Erickson, J. Gavalchin and J. O. Giordano, A lateral flow-based portable platform for determination of reproductive status of cattle, J. Dairy Sci., 2020, 103(5), 4743–4753 CrossRef CAS PubMed.
- Z. Zhang, M. Jin, X. Feng, Y. Liu, Y. Guo and R. Zou, et al., Up-Converting Nanoparticle-Based Immunochromatographic Strip for Multi-Residue Detection of Three Organophosphorus Pesticides in Food, Front. Chem., 2019, 7, 18 CrossRef PubMed.
- R. L. Liang, Q. T. Deng, Z. H. Chen, X. P. Xu, J. W. Zhou and J. Y. Liang, et al., Europium (III) chelate microparticle-based lateral flow immunoassay strips for rapid and quantitative detection of antibody to hepatitis B core antigen, Sci. Rep., 2017, 7(1), 14093 CrossRef PubMed.
- H. Qu, Y. Zhang, B. Qu, H. Kong, G. Qin and S. Liu, et al., Rapid lateral-flow immunoassay for the quantum dot-based detection of puerarin, Biosens. Bioelectron., 2016, 81, 358–362 CrossRef CAS PubMed.
- A. Moyano, E. Serrano-Pertierra, M. Salvador, J. C. Martínez-García, M. Rivas and M. C. Blanco-López, Magnetic Lateral Flow Immunoassays, Diagnostics, 2020, 10(5), 288 CrossRef CAS PubMed.
- MagnaBioSciences, The Magnetic Immuno-Chromatographic Test System by MagnaBioSciences, LLC, cited 2024 Sep 26, available from: https://magnabiosciences.com/technology.html Search PubMed.
- Self-Diagnostics, Test rapido de cocaina en orina – Tiras reactivas, cited 2024 Nov 20, available from: https://self-diagnostics.com/es/test-rapido-cocaina-orina.html Search PubMed.
- O. T. Mytton, N. McCarthy, J. Watson and P. Whiting, Interpreting a lateral flow SARS-CoV-2 antigen test, BMJ, 2021, 373, n1411 CrossRef PubMed.
- W. Rennie, R. Phetsouvanh, S. Lupisan, V. Vanisaveth, B. Hongvanthong and S. Phompida, et al., Minimising human error in malaria rapid diagnosis: clarity of written instructions and health worker performance, Trans. R. Soc. Trop. Med. Hyg., 2007, 101(1), 9–18 CrossRef PubMed.
Footnote |
| † Electronic supplementary information (ESI) available. See DOI: https://doi.org/10.1039/d4lc01075b |
| This journal is © The Royal Society of Chemistry 2025 |