
 Open Access Article
 This Open Access Article is licensed under a
 Creative Commons Attribution 3.0 Unported Licence
A simple three-dimensional microfluidic platform for studying chemotaxis and cell sorting†
Xiaobo
Li‡
a,
Yanqing
Song‡
a,
Andrew
Glidle
a,
Cindy
Smith
a,
William
Sloan
a,
Maggie
Cusack
b and
Huabing
Yin
 *a
*a
aJames Watt School of Engineering, Advanced Research Centre (ARC), University of Glasgow, Chapel Lane, Glasgow G11 6EW, UK. E-mail: huabing.yin@glasgow.ac.uk
bMunster Technological University, Rossa Avenue, Bishopstown, Cork, T12 P928, Ireland
First published on 6th January 2025
Abstract
Microbial chemotaxis plays a key role in a diversity of biological and ecological processes. Although microfluidics-based assays have been applied to investigate bacterial chemotaxis, retrieving chemotactic cells off-chip based on their dynamic chemotactic responses remains limited. Here, we present a simple three-dimensional microfluidic platform capable of programmable delivery of solutions, maintaining static, stable gradients for over 20 hours, followed by active sorting and retrieval of bacteria based on their chemotactic phenotypes. Using this platform, we revealed the swimming features of individual E. coli cells in response to chemoattractant and observed rapid bacterial adaptation to the gradients. Furthermore, the robust performance of the platform allowed us to investigate complex natural microbial communities. Exemplified by sorting bacteria towards soluble cellulose and lignin compounds, we found only a small percentage (<20%) of chemotactic bacteria from a leaf mould microbiota exhibited cellulolytic or lignin-degradation abilities. These findings highlight that chemotaxis does not always align with degradation abilities. Interestingly, a new Erwinia aphidicola strain was discovered with substantial cellulose degradation capabilities. These results illustrate the strong potential of this microfluidic platform for investigating broad processes involving bacterial chemotaxis and for discovering functional microbes.
Introduction
Chemotaxis is the ability of microorganisms to move along chemical gradients.1 It has been recognized as a widespread, multifaceted phenomenon involved in numerous processes, from foraging to interactions among symbionts,2 the virulence of pathogens3 and biofilm formation.4 Chemotaxis plays a crucial role in hydrocarbon degradation by attracting bacteria to the chemical interface, increasing the biodegradation rate and enhancing the mass transfer process.5 Many studies have shown that bacteria involved in environmental biodegradation possess chemotactic characteristics. For example, hydrocarbon-degrading bacteria exhibit a high abundance of chemotaxis-related genes or proteins.6,7 Mutation of chemotaxis-related genes decreases bacterial degradation ability.8 While these studies have illustrated the chemotaxis ability in hydrocarbon-degrading bacteria, the correlation between chemotactic capabilities and degradation proficiency remains unclear.The studies of bacterial chemotaxis emerged in the 1970s.9–12 Common methods include capillary assays,11 plug-in-pond assays,12 and the swarm plate assay.13 However, these methods are mostly qualitative and unable to maintain a stable gradient over time. As end-point population assays, they also lack dynamic single-cell information. In recent years, microfluidics has demonstrated great potential for chemotaxis studies, allowing for quantitative analysis in a short time14–16 and generating highly stable gradients over user-defined concentration ranges.17
Generally, microfluidic chemotaxis assays can be categorized into flow-based and flow-free approaches.18 Maintaining stable gradients in a flow system requires precise control of flow profiles, while gradient formation in the absence of flow is simpler.18 However, flow-free microfluidics often requires the integration of hydrogel barriers on the chip to prevent convection in the channel,16,19 which is prone to leakage and bubble formation.16 Despite these challenges, microfluidic chemotaxis assays have provided valuable insights, including the identification of phenotypic heterogeneity in chemotactic sensitivity,20 exploration of chemotaxis behaviour in marine microorganisms,21,22 and establishment of chemotactic phenotype-to-performance maps.23 However, retrieving chemotactic cells off-chip remain limited due to challenges in simultaneously maintaining stable chemotactic microenvironments and implementing sorting actuation on the chip. To date, active cell sorting based on cell chemotactic phenotypes has not been demonstrated.
Lignocellulosic biomass, primarily composed of cellulose, hemicelluloses, and lignin, is an abundant and renewable plant-based resource.24 It is considered a promising alternative to fossil resources for producing second-generation biofuels, as well as bio-sourced chemicals and materials.25,26 Current screening of lignocellulosic-degrading bacteria is dominantly based on selective culture,27,28 which limited the diversity of cellulolytic bacteria species suitable for different biomass sources. We envisage chemotaxis-based sorting may select cellulolytic bacteria of additional swimming capability, thus facilitating degradation efficiency, as illustrated in other studies.8
Here, we present a three-dimensional (3D), easy-to-operate microfluidic platform for characterizing and sorting bacteria based on their chemotactic characteristics. The platform maintains a highly stable gradient over time, enables programmable delivery of stimuli, and sorting chemotactic bacteria for off-chip processes. With the platform, we can obtain the high-order swimming characteristics of individual bacteria cells in response to chemoattractant, providing a criterion for sorting bacteria. As a proof-of-concept application, we employed this platform to investigate the link between chemotaxis and degradation of cellulose and lignin using a leaf mould microbiota, and to search for novel bacteria with high efficiency in degrading cellulose. In summary, our platform provides a versatile tool for investigating bacterial chemotaxis in a broad range of scenarios and for discovering functional bacteria.
Experimental
Microfluidic platform fabrication
A 3D microfluidic mould was designed using the Autodesk Fusion 360 software and fabricated by an Objet30 Prime 3D printer with X × Y × Z axis resolution at 42 μm × 42 μm × 16 μm. The mould consists of three units (Fig. 1a): 1) the inlet and outlet channels (500 μm width × 100 μm height) for delivering and retrieving cells/reagents, 2) two independent reservoirs (volume ∼30 μl each) connected by a semi-round migration channel (1500 μm length × 500 μm width × 100 μm maximum height) for chemotaxis observation, and 3) the valve channels (round channels with a 500 μm diameter) located on the upper layer for programmable control of opening or closing the inlet/outlet/migration channels. Metal needles (0.5 mm diameter) were used as a mould to form the valve channels. These were positioned in the 3D printed slots located 50 μm above the migration channel (details were shown in Fig. S1†). The mould was filled with a mixture of polydimethylsiloxane (PDMS) oligomer and curing agent (20![[thin space (1/6-em)]](https://www.rsc.org/images/entities/char_2009.gif) :1, wt/wt; Dow Corning) after inserting two dead-end solid needles (diameter = 0.5 mm) at the valve positions. After curing for 4 hours at 65 °C, the needles were removed to create the valve channels and the PDMS layer was peeled off from the mould. Holes were punched on the inlets and outlets of the channels from the PDMS replica for tube connection. The PDMS replicas and coverslips were thoroughly washed using acetone, menthol and isopropanol for 5 minutes, before bonding together using oxygen plasma. The chips were further heated to strengthen the bonding and then stored at room temperature until use.
:1, wt/wt; Dow Corning) after inserting two dead-end solid needles (diameter = 0.5 mm) at the valve positions. After curing for 4 hours at 65 °C, the needles were removed to create the valve channels and the PDMS layer was peeled off from the mould. Holes were punched on the inlets and outlets of the channels from the PDMS replica for tube connection. The PDMS replicas and coverslips were thoroughly washed using acetone, menthol and isopropanol for 5 minutes, before bonding together using oxygen plasma. The chips were further heated to strengthen the bonding and then stored at room temperature until use.
 | ||
| Fig. 1 Microfluidic chip design. (a) Optical image of the chemotaxis microfluidics device. Zoom-in pictures of two on-chip valves controlling on/off of the migration and delivery channels. (b) Time-lapse images showing valve 2 opening and closing the migration channel. (c) Operation steps for studying and sorting chemotactic cells. By controlling the valve channels, this system enables in situ observation of chemotaxis and simultaneous isolation of chemotactic bacteria. | ||
Characterization of gradient formation and flow convection
Fluorescein solution (100 μM) was used to characterize the formation of concentration gradients in the migration channel. After filling the channel with deionized water, the migration channel was closed by pumping water into the valve 2 channel at 5 μL min−1. The fluorescein solution was then delivered to the chemoattractant reservoir through the side channels. Closing these channels via the valve 1 channel ensures non-convection within the system. The migration channel was then opened by withdrawing the water at a speed of 1 μL min−1 to allow the gradient to establish. Fluorescent images were taken to determine the fluorescence intensity along the migration channel. 0.01% Fluoro-Max Dyed Green Aqueous Fluorescent Particles (diameter = 5.0 μm; Thermo Scientific) were loaded into the bacteria reservoir to test for flow convection when the migration channel opened. All time-lapse fluorescence imaging captured under 470–495 nm (excitation)/510–555 nm (emission).Bacterial culture
The ingredients of all mediums, buffer used in this study were listed in ESI† section 1.1. The Escherichia coli strain (MG1655:: PLacUV5-mRFP) was cultured overnight in tryptone broth (TB) supplemented with 50 mg L−1 kanamycin at 30 °C, 200 rpm. The bacteria suspension was then diluted 30-fold into the same fresh medium and incubated for about 4 hours (OD600nm = 0.5). Before loading the cells into the microfluidic device, the bacteria were washed with sterile chemotaxis buffer (CB)17 once by centrifugation at 2000 rpm for 3 minutes and diluted 10 folds using sterile CB. Under these culture and harvest conditions, the bacteria maintained good motility (see ESI† section 1.2 and Fig. S2).Microbial community preparation
Soil samples underneath rotten leaves (i.e., a leaf mould) were collected from the Glasgow Botanic Gardens, Glasgow, UK (NL 55°52′51′′, WL 4°17′35′′). The rotten leaf layer was removed, and the top 10 cm soil layers were collected. All samples were stored at 4 °C during transport and afterwards. 1 g of soil sample was added into 10 mL CB and then incubated for 14 hours at 30 °C, 200 rpm. After that, the suspension was allowed to stand for 2 hours and the supernatant was used as the bacterial stock solution. 2 mL of the bacterial stock solution was centrifuged at 2000 rpm for 3 minutes, and the bacteria pellet was suspended in 1 mL CB for use.Bacterial chemotaxis tests and sorting on chip
For chemotaxis test, the chip was treated with 70% ethanol, deionized water and then 1% Pluronic F-127 solution for 1 hour to minimize cell attachment to the surface. After the migration channel was closed, the bacteria solution and chemoattractant solution were loaded into their respective reservoirs. Both the inlet and outlet channels were then closed to prevent convection within this system. Time-lapse videos at the observation window were recorded every 10 minutes over 2 hours once the migration channel was opened. For soil microbial community, soluble sodium carboxymethyl cellulose (denoted as CMC) and alkali lignin were used as chemoattractants. After a 2 hour chemotaxis assay, bacteria swimming into the chemoattractant reservoirs were isolated and retrieved off-chip for further analysis.Cellulolytic bacteria or lignin-degradation bacteria selection and identification
The isolated bacteria were harvested at 8000 rpm for 10 min and resuspended into CB. An aliquot (100 μL) of the bacterial solution was spread on tryptic soy broth (TSB) agar plates to quantify the total cultivable cell number. Simultaneously, the same bacterial solution was spread on CMC selective agar or/and lignin selective agar plates, where CMC or alkali lignin was used as the dormant carbon source to isolate cellulolytic bacteria29 or lignin-degradation bacteria.27 The TSB agar plates were incubated at 30 °C for 2 days, while the CMC or alkali lignin selective agar plates were incubated for 5 days until no new colony appeared. Total colonies grown on different agar plates were counted to identify the association between bacteria chemotaxis and degradation. Once a single visible colony grew on the CMC selective agar plate, it was transferred to LB medium for enrichment. The enriched bacteria solution was stored at −80 °C with 20% glycerol for subsequent analysis.The cellulolytic activity of selected strains was evaluated using Congo red staining method.30 After selection, the cellulolytic enzyme activity of these selected strains was determined using the 3,5-dinitrosalicylic acid (DNS) method.31 Then high-produce enzyme strains were chosen to test the insoluble cellulose degradation activity using an acid-detergent method.32 The whole 16S rRNA gene fragments of these selected strains were sequenced for species identification. More details were listed in ESI† section 1.3.
Image acquisition and analysis
All chemotaxis experiments were carried out at room temperature (∼22 °C). The chemotaxis chip was mounted on an automated motorized stage on an IX71 epi-fluorescence inverted microscope (Olympus Inc., UK) with an Andor iXon Ultra 897 CCD camera. Unless otherwise mentioned, all fluorescence images for the RFP-labelled E. coli strain were taken using an Olympus 10 × UPlanFL objective lens (0.30 N.A.) at 525 ± 45 nm (excitation)/645 ± 75 (emission). All images were focused on the glass slide substrate. The observation window was selected near the chemoattractant reservoir to improve cell tracking accuracy and minimize variations associated with the loading process (details provided in ESI† Fig. S3). For chemotaxis testing, time-lapse videos at the observation window were taken every 10 minutes over 2 hours. Each video consists of 60 frames with 0.11 s interval between adjacent frames. All videos were analysed using the open-source software Fiji-Trackmate to track cell trajectories.16,33,34 As shown in Fig. S4† and Video 1, it is easy to track cells' trajectories over time to calculate swimming speeds, displacement, and movement bias. Only cells within at least 30 consecutive frames were selected to calculate the trajectories. Trajectories exhibiting displacements less than 10 μm were subsequently removed. These cells primarily adhered to the channel, constituting a minor fraction of the overall population.Statistical analysis
For each condition, at least three independent replicates were conducted. All results were presented as the mean ± standard deviation. Statistical analysis was carried out with the unpaired one-way analysis of variance (ANOVA) or t-test by GraphPad Prism 8 software system. Statistical significance was determined when the P value < 0.05.Results and discussion
Characterization of the microfluidic device
The 3D microfluidic device (Fig. 1a) consists of two independent microvalve channels, where valve 1 controls all inlet/outlet channels, while valve 2 regulates the opening or closing of the migration channel. Two reservoirs are linked by the migration channel. Fig. 1b and Video 2 show how valve 2 is opened and closed. Fig. 1c illustrates the operational procedure of this microfluidic chip. Through three successive steps, the chips can achieve sample loading, chemotaxis observation, and sample retrieval. Compared with conventional methods, this platform presents many advantages for chemotaxis studies, including 1) the capability for single-cell tracking and quantitative analysis, 2) the establishment of a precisely controlled and stable gradient, 3) enabling a long period of observation, and 4) programmable delivery of stimuli and retrieval of chemotactic bacteria for further analysis.Fluorescein solution was used to characterize the gradient formation within the migration channel. A stable fluorescein gradient was established 40 minutes after the migration channel was opened, and remarkably, maintained over the long period of experiments (i.e., 20 h, shown in Fig. 2a and b). There was a consistent linear relationship between fluorescence intensity and distance along the migration channel. As illustrated in Fig. 2c, upon introducing fluorescent beads to the bacteria reservoir, no fluorescent beads were found in the migration channel following its opening, indicating no flow convection in the platform during the chemotaxis assays. Thus, the bacteria migrated into the chemoattractant reservoir solely in response to the chemoattractant stimulus, proving that the platform is an effective tool for studying bacterial chemotaxis.
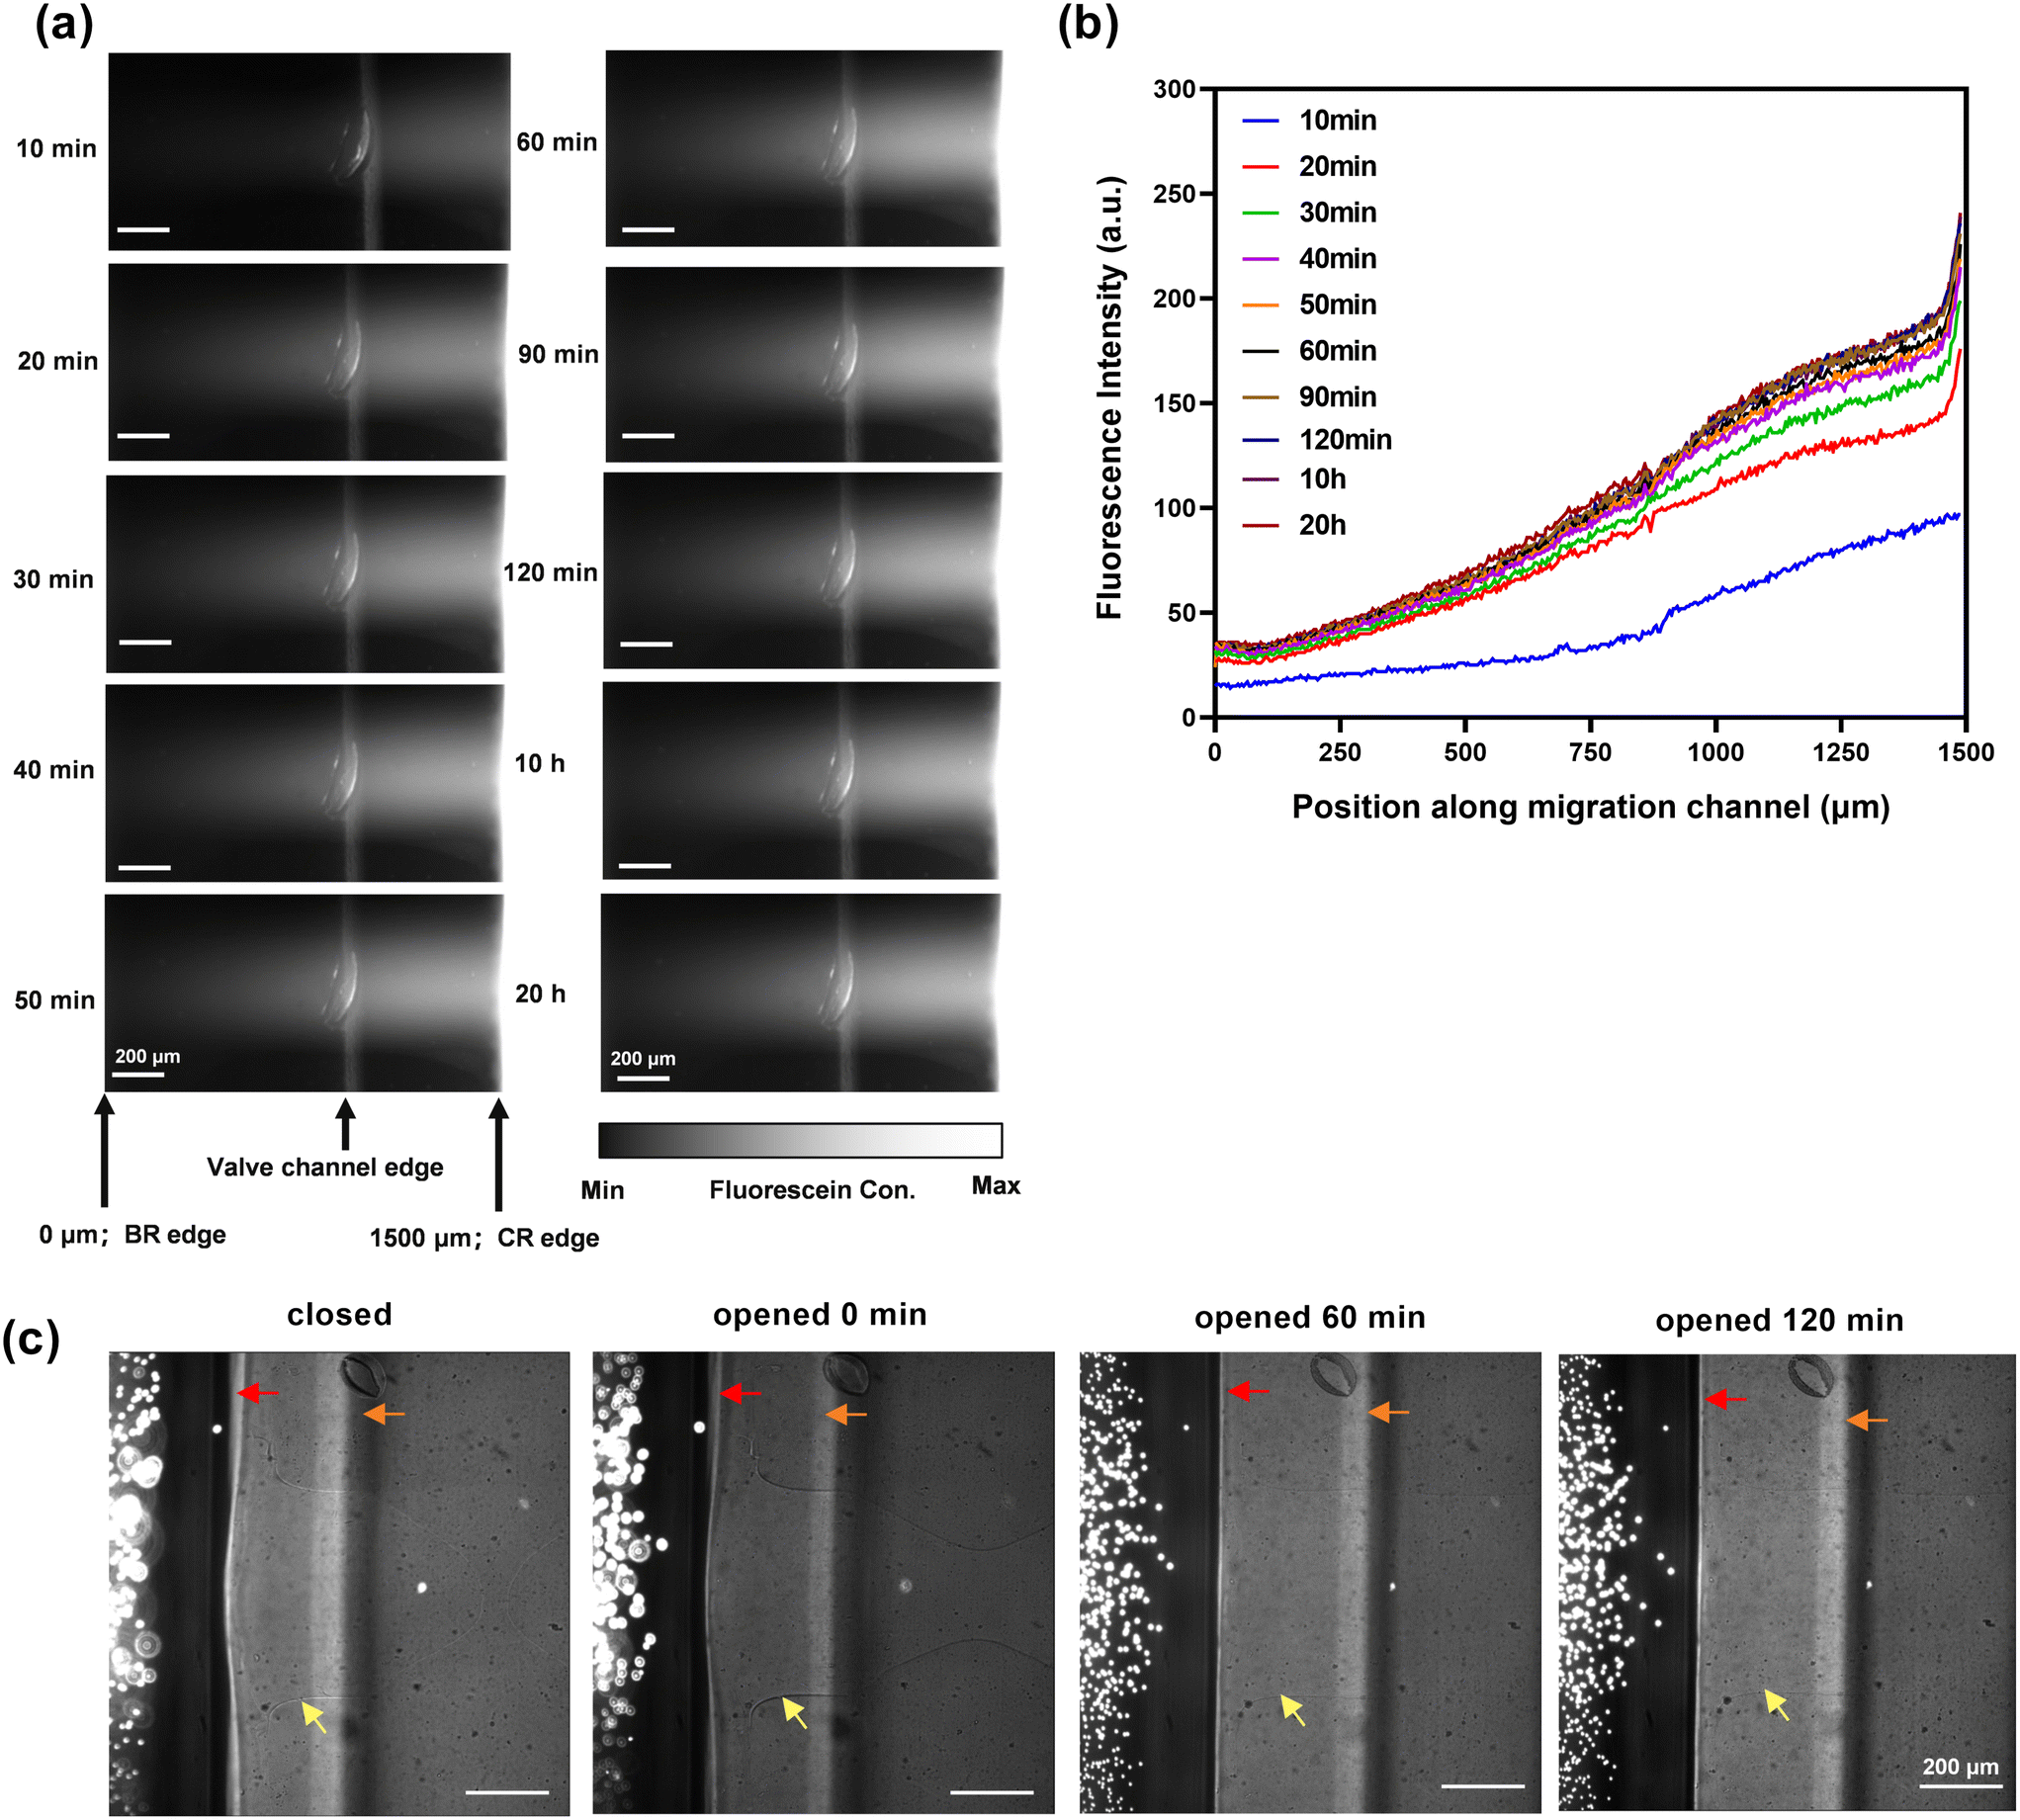 | ||
| Fig. 2 Microfluidic chip characterization. (a) Time-lapse fluorescent images of the migration channel with the chemoattractant reservoir filled with 100 μM fluorescein, allowing visualization of the fluorescein gradient along the migration channel. After 40 minutes, a stable gradient was established, extending from the chemoattractant reservoir (CR) to the bacteria reservoir (BR). Position 0 μm corresponds to the BR edge, while position 1500 μm corresponds to the CR edge. (b) A linear relationship between fluorescence intensity and distance was formed along the migration channel. (c) Green fluorescent beads (4.8 μm) remained in the reservoir when the migration channel was opened, confirming the absence of convection. Red arrows, orange arrows and yellow arrows indicated the bacteria reservoir edge, valve channel and migration channel, respectively. The migration channel was closed using valve 2, resulting in a deformed shape (as indicated by the yellow arrow). In its open position, the migration channel appeared rectangular in the top view. | ||
Characterizing chemotactic response at the single cell level
For quantitative characterization of cell chemotactic behaviour, a strong chemoattractant for E. coli, aspartic acid (ASP), was used as a model system. Time-lapse images were recorded at the observation window upon opening of the migration channel (Fig. 3a). Based on previous studies,14 2 mM ASP was tested initially. It was found that bacteria rapidly entered the migration channel within the first 60 minutes, and then the cell number plateaued afterwards (Fig. 3b). In contrast, very few cells (<50 single cells, Fig. 3b) were present in the observation window in the control (i.e., CB only in the chemoattractant reservoir). The chemotaxis index, defined as the ratio of bacteria number in the chemoattractant group to the control group, indicates the tendency of chemotaxis.21 Unlike other methods where the chemotaxis index is determined by calculating changes in the initial cell density at the observation window,14,16 our approach monitors cell-free area. This method, combined with single-cell tracking, eliminates the influence of the bacterial preloading process and surface-attached cells, offering a more accurate and reliable evaluation of chemotaxis. The chemotactic index of the E. coli strain exceeds 20 after 30 minutes, indicating a strong chemotactic response towards ASP (Fig. 3c). Similar trends were observed with a lower concentration of ASP (20 μM), although the chemotaxis intensity was significantly reduced compared to 2 mM ASP. For instance, at 20 μM ASP, the swimming cell number plateaued at approximately 150 after 60 minutes (Fig. 3b), and the chemotaxis index peaked at around 10 after 40 minutes (Fig. 3c). This concentration proved insufficient for robust chemotaxis, consistent with previous studies.14,15 Consequently, 2 mM ASP was used for subsequent analyses. | ||
| Fig. 3 Bacteria chemotaxis tests on chip. (a). Time-lapse images were acquired at the observation window (red square) near the chemoattractant reservoir once the migration channel opened. (b) The cell number of E. coli in the observation window was tracked when the chemoattractant reservoir was loaded with the chemotactic buffer (CB) only (the control), 2 mM ASP in CB or 20 μM ASP in CB (the chemoattractant group). Shaded regions indicate standard deviations, where the deviations in the control are too small to be seen. (c) Chemotactic index of E. coli towards 2 mM ASP or 20 μM ASP under different time points. The chemotactic index is defined as the ratio of bacteria number in the chemoattractant groups to the control at each time point. (d) Bacterial swimming speeds with 2 mM ASP or without chemoattractant. (e) The movement bias β with 2 mM ASP chemoattractant. The movement bias is defined as the ratio of the number of cells swimming towards ASP to that backwards from ASP. The β in control (i.e., dotted line) was used as the reference. CB: chemotactic buffer. ASP: aspartic acid (ns: no difference. ****p < 0.0001, one-way ANOVA with Tukey's post hoc comparison). | ||
The bacteria's swimming speeds changed with time in the presence of the ASP gradient (Fig. 3d), whereas no significant difference was observed in the control (Fig. S5a†). Interestingly, the bacteria's swimming speeds rapidly reached their peak within the first 30 minutes in the ASP gradient and then decreased continuously. By 90 minutes, the speed became comparable to that of the control group and lower after that. This phenomenon revealed that E. coli could respond to the ASP quickly and subsequently adapt to this gradient. Consistent with previous studies,14–16 bacterial chemotactic adaptation in the microfluidic system is not correlated with changes in the gradient. Bacteria adapted to the ASP gradients (2 mM or 20 μM) and lost the chemotactic behaviours after 60 minutes, even though the gradients stabilized by 40 minutes in our system. This indicates that bacterial chemotaxis adaptation is primarily driven by the presence of a gradient rather than by dynamic changes in the gradient.
In most cases, bacteria cells are too small to detect concentration gradients along their body lengths, and thus, they employ temporal sensing mechanisms, executing a biased walk through alternating run and tumble motions.1 Given that ASP is a well-established strong chemoattractant for E. coli,15,35 we assumed that E. coli could swim directly towards the ASP. However, it was found that bacteria swam both forward and backwards towards the ASP reservoir. Thus, the parameter of movement bias, β (denoted as the ratio of the number of cells swimming towards ASP to that moving backwards), was used to measure the overall movement of the population.34 Bacteria in the control swam randomly with an average β value of 1.08 (Fig. S5b†). However, in the presence of an ASP gradient, β was significantly greater than 1.08 within the first 60 minutes but then decreased to ∼1.08 afterwards (Fig. 3e). This change agrees well with those observed in the cell number (Fig. 3b) and swimming speed (Fig. 3d) at the same time point.
Single-cell tracking unveils the heterogeneous chemotactic responses
The bacterial foraging strategy is associated with the distance to the target site.36 The chemotaxis path is more effective using a Lévy flight and extended runs (run-tumble shift motion) instead of a Brownian random walk.36,37 By measuring the displacement (the linear distance between the start and end time point) and the total trajectory length, we characterized the chemotaxis path of individual E. coli cells towards ASP. If the ratio of displacement to trajectory length >0.95, then cells chose the direct swimming path (as indicated in Fig. S4†). Cells that were situated along the red line (Y = X, indicating that the cells' displacements were nearly equal to trajectory lengths) swam directly into the ASP, whereas cells lying above the red line chose the run-tumble paths (indicated in grey circles in Fig. 4a). Since the focal plane is on the glass substrate, bacteria moving towards the upper section of the channel may not be captured accurately. However, the bacterial population near the focal plane (i.e., within the objective lens's depth of field) clearly revealed individual differences in their swimming paths. | ||
| Fig. 4 Bacterial chemotactic pathways. (a) A typical scatter diagram of displacement (direct distance between the start and end point within the recording time) versus trajectory (the total travel distance within the recording time) in the chemoattractant group at a time point of 30 minutes. Each dot corresponds to a single cell. The grey circles indicate two different swimming pathways: direct swimming (those situated along the red line) and run-tumble swimming (those above the red line). (b) The percentage of bacteria choosing direct swimming pathway when the chemoattractant reservoir was filled with 2 mM aspartic acid in the chemotactic buffer. The percentage of direct swimming in control groups served as a baseline. | ||
A wide distribution of both paths was found to be adopted by individual cells at 30 minutes in the presence of ASP (Fig. 4a), indicating a strong heterogeneous chemotactic sensitivity in the population. However, such a difference quickly faded after 30 minutes, as illustrated by the decreased percentage of direct swimming bacteria (<10.4% – the random swimming in the control) (Fig. 4b and S6†). Again, this may result from bacterial adaptation to the gradient. Heterogeneity in chemotactic sensitivity was reported to play an important role in migratory bet-hedging strategies,20,38 where isogenic populations stochastically diversify their phenotypes to enhance adaptability to sudden environmental shifts.
Discover the correlation between chemotaxis and degradation
Although chemotaxis activity has been observed in bacteria with degradation ability,6,7 it remains unclear whether bacteria that exhibit chemotaxis toward a substance also possess the ability to degrade that substance. To address this question, we collected soil microbial community and employed cellulose (water-soluble form, CMC) and alkali lignin as the chemoattractants to elucidate the association between chemotaxis and degradation. Fig. 5a illustrated the process of identifying the link between bacterial chemotaxis and degradation of CMC or alkali lignin, and the chemotactic-based sorting of cellulolytic bacteria. | ||
| Fig. 5 Studying the relationship between chemotaxis and degradation using a leaf mould microbiota. (a) The process of identifying the link between bacterial chemotaxis and degradation of CMC or alkali lignin, and the chemotactic-based sorting of cellulolytic bacteria. (b) Bacteria from the microbiota showed strong chemotaxis towards CMC (2 g L−1 in CB) and alkali lignin (1 g L−1 in CB) compared with the control (filled with CB in a chemoattractant reservoir). Shaded regions indicate standard deviations. (c) The chemotaxis index of bacteria towards different compounds. Data of E. coli towards 2 mM ASP were derived from Fig. 3c. (d) Chemotactic bacteria were sorted and retrieved off-chip after 2 hours of assays. Each 100 μL bacterial suspension was spread on TSB agar for total cultivable cell number counting, on CMC selective agar for isolating cellulolytic bacteria, and on alkali lignin selective agar for isolating lignin-degradation bacteria respectively. CB: chemotaxis buffer. CMC: sodium carboxymethyl cellulose. (**p < 0.01, *p < 0.05, unpaired one-tailed t-test). | ||
Since most cellulolytic bacteria collected from the soil sample are aerobic and motile,39 the conditions described above were used for the leaf mould microbiota. Many bacteria exhibit a stronger chemotactic behaviour toward CMC and alkali lignin than the control (Fig. 5b). However, compared with E. coli chemotaxis towards small molecule (i.e., aspartic acid), soil bacteria showed relatively weak chemotactic responses towards large molecules of CMC and alkali lignin, with chemotactic indexes of 6.4 ± 1.9 for CMC and 8.1 ± 3.7 for alkali lignin at 2 hours (Fig. 5c). To characterise the chemotactic bacteria, sorting actuation was initiated after 2 hours and retrieving bacteria that have migrated into the chemoattractant reservoir off-chip. It is worth noting that different user-defined chemoattractants can be loaded to initiate a new round of sorting, allowing searching for cells of different functions from the same community.
The collected bacteria were spread onto non-selective nutrient-rich TSB agars for total cultivatable bacteria isolation. The CMC and alkali lignin-selective agar plates were used to isolate bacteria capable of degrading cellulose and lignin, respectively. For the CB attractant control, the collected cells were due to random movement, and the number of cultivable colonies was significantly lower than those obtained from the CMC or alkali lignin chemotactic group (Fig. 5d). However, the number of bacterial colonies grown on either CMC or lignin-selective agar was significantly lower than that on the non-selective TSB agar (Fig. 5d). Using this value as the reference for the total cultivable chemotactic bacteria, those capable of utilising CMC count for 20.0% ± 6.0%, and those capable of utilising alkali lignin count for 11.5% ± 2.2% in the respective chemotactic group. It is worth noting that the agar media were not optimised, and only culturable bacteria were counted. Nevertheless, the above results show differences in the relative abundance and suggest that soil bacteria eliciting a positive chemotactic response to a substance may not necessarily be capable of degrading it.
Determine the cellulose degradation activity of cellulolytic bacteria
Congo red staining was employed to evaluate the capability of cellulose degradation for the bacteria that grew on the CMC selective agar. Congo red binds strongly with cellulose, yielding a red colloidal solution, which diminishes when cellulose is degraded by bacteria. This leaves distinct hydrolyzed circles (i.e., the pale yellow halo around the colony as indicated in Fig. S7†).31 Among the total 55 isolated strains, 15 strains showed hydrolyzed circles with hydrolytic capacities greater than 1 (Fig. S8†). These 15 strains were further tested for their CMC enzyme (CMCase) and filter paper enzyme (FPase) activities (Fig. 6a and b). The CMCase activities of the strains OCC11, OCC12, ACC13, ACC16, and ACC17 increased over time, reaching more than 0.08 U mL−1 at 30 days. However, the other 10 strains did not show increases in CMCase activity over time. Subsequently, only these five strains were further tested for their FPase activities. All produced a high level of FPase activity, surpassing 0.10 U mL−1 after 30 days (Fig. 6b), indicating their potential capability of cellulose degradation. | ||
| Fig. 6 Cellulose degradation activity. (a) CMCase enzyme activities and (b) FPase enzyme activities in different strains under different incubation periods. (c) The fermentation broths were inoculated with different strains after 30 days. (d) Net cellulose loss (degraded cellulose mass/initial cellulose mass; 100%) after inoculation with different strains for 30 days (ns: no difference, *p < 0.05, **p < 0.01, ****p < 0.0001, one-way ANOVA with Tukey's post hoc comparison). | ||
To determine whether these 5 strains can degrade insoluble cellulose, they were incubated with filter paper. After 30 days, the broth colour changed from pale yellow to brown for OCC11 and OCC12 (Fig. 6c), indicating that the filter papers had been degraded.32 Based on the net cellulose loss, strains OCC11, OCC12, and ACC16 demonstrated faster degradation rates compared with the control (Fig. 6d). In particular, treatment with the OCC11 strain resulted in more than 23% net cellulose loss. It should be noted that the degradation rates could be further enhanced with the optimization of the cultural conditions, such as culture temperature, pH, and medium composition. The excellent performance of the OCC11 strain in degrading insoluble cellulose makes it a promising candidate for utilising the most abundant carbohydrate–lignocellulosic biomass for various applications.
Discovering new functions and the implications
16S rRNA sequencing was carried out to identify the five strains exhibiting CMCase and FPase activities (Table 1). Interestingly, two strains capable of cellulose degradation (OCC11 and OCC12) are from Erwinia aphidicola and Paenibacillus tritici, which have not demonstrated cellulose degradation capability to date. Here, through chemotactic sorting and selection, we have discovered new functions of these species. While this study focuses on cellulose degradation by way of example, our microfluidic platform can be readily exploited to search for functional species to degrade other substances. Importantly, the programmable delivery of chemoattractant and the isolation of chemotactic cells can be performed reiteratively on the chip, allowing comprehensive investigations of the function and interactions in a natural microbiota. Furthermore, the simple operation of the platform allows it to be accommodated in common anaerobic chambers, further extending its utilities in anaerobic communities. Thus, our system offers a flexible platform for studying microbial behaviour, cell-to-cell interaction, and the functional diversity of various microbiota (e.g., gut or environmental microbiota).| Strains ID | Identified species | Similarity | Accession number |
|---|---|---|---|
| OCC11 | Erwinia aphidicola | 99.75% | PP790382 |
| OCC12 | Paenibacillus tritici | 99.65% | PP790383 |
| ACC13 | Microbacterium ginsengisoli | 99.44% | PP790384 |
| ACC16 | Microbacterium ginsengisoli | 99.52% | PP790385 |
| ACC17 | Microbacterium ginsengisoli | 99.66% | PP790386 |
Conclusions
We developed a user-friendly 3D microfluidic device for studying bacterial chemotaxis and sorting cells based on their chemotactic phenotypes. The platform enables quantitative investigations of microbiota at the single-cell level, revealing a diversity of chemotactic responses. Using this platform, we discovered that E. coli responded quickly to the chemoattractant aspartic acid, but adapted to this chemical gradient within 60 minutes. Importantly, the ability to sort and retrieve cells based on their chemotactic phenotypes allowed us to investigate a long-standing question on the correlation between chemotaxis and degradation. As a proof-of-concept application, we sorted chemotactic bacteria responsive to soluble cellulose and lignin compounds from a leaf mould microbiota, finding only 20.0% ± 6.0 or 11.5% ± 2.2% of cultivable chemotactic bacteria exhibited cellulolytic or lignin-degradation capabilities, respectively. This suggests chemotaxis towards a substance does not necessarily correlate with degradation capability. However, chemotaxis-based sorting can facilitate the rapid discovery of highly efficient degraders. For the first time, we isolated new environmental strains from Erwinia aphidicola and Paenibacillus tritici, that possess promising capability to degrade insoluble cellulose. Given the wide availability of 3D printing, this platform can be easily implemented in conventional labs, providing new ways to explore the interactions and functions within microbial communities.Data availability
The data supporting this article have been included as part of the ESI.†Author contributions
XL, YS, and HY conceived the original idea. XL, YS, and AG performed the experiments. CS, WS, MC and HY supervised this project. XL and HY wrote the original manuscript, all authors revised the manuscript.Conflicts of interest
The authors declare no competing financial interest.Acknowledgements
We thank the EPSRC (EP/K038885/1), NERC (NE/P011063/1), NERC (NE/S008721/1) and EPSRC IAA (EP/R511705/1) for financial support. Xiaobo Li also thanks the China Scholarship Council for sponsorship.References
- S. L. Porter, G. H. Wadhams and J. P. Armitage, Nat. Rev. Microbiol., 2011, 9, 153–165 Search PubMed.
- J.-B. Raina, V. Fernandez, B. Lambert, R. Stocker and J. R. Seymour, Nat. Rev. Microbiol., 2019, 17, 284–294 CrossRef CAS PubMed.
- M. A. Matilla and T. Krell, FEMS Microbiol. Rev., 2018, 42, 42–67 CrossRef.
- G. H. Wadhams and J. P. Armitage, Nat. Rev. Mol. Cell Biol., 2004, 5, 1024–1037 CrossRef CAS.
- M. Ibrar, S. Khan, F. Hasan and X. Yang, Environ. Sci. Pollut. Res., 2022, 29, 24391–24410 CrossRef CAS PubMed.
- J. Tremblay, N. Fortin, M. Elias, J. Wasserscheid, T. L. King, K. Lee and C. W. Greer, Environ. Microbiol., 2019, 21, 2307–2319 CrossRef CAS PubMed.
- O. U. Mason, T. C. Hazen, S. Borglin, P. S. G. Chain, E. A. Dubinsky, J. L. Fortney, J. Han, H.-Y. N. Holman, J. Hultman, R. Lamendella, R. Mackelprang, S. Malfatti, L. M. Tom, S. G. Tringe, T. Woyke, J. Zhou, E. M. Rubin and J. K. Jansson, ISME J., 2012, 6, 1715–1727 CrossRef CAS PubMed.
- R. B. Marx and M. D. Aitken, Environ. Sci. Technol., 2000, 34, 3379–3383 Search PubMed.
- R. Mesibov and J. Adler, J. Bacteriol., 1972, 112, 315–326 Search PubMed.
- J. Adler, G. L. Hazelbauer and M. M. Dahl, J. Bacteriol., 1973, 115, 824–847 CrossRef CAS.
- J. Adler, J. Gen. Microbiol., 1973, 74, 77–91 Search PubMed.
- W.-W. Tso and J. Adler, J. Bacteriol., 1974, 118, 560–576 Search PubMed.
- E. O. Budrene and H. C. Berg, Nature, 1991, 349, 630–633 CrossRef CAS.
- G. Si, W. Yang, S. Bi, C. Luo and Q. Ouyang, Lab Chip, 2012, 12, 1389–1394 RSC.
- C. Shen, P. Xu, Z. Huang, D. Cai, S.-J. Liu and W. Du, Lab Chip, 2014, 14, 3074–3080 RSC.
- P. Hu, K. L. Ly, L. P. H. Pham, A. E. Pottash, K. Sheridan, H.-C. Wu, C.-Y. Tsao, D. Quan, W. E. Bentley, G. W. Rubloff, H. O. Sintim and X. Luo, Lab Chip, 2022, 22, 3203–3216 RSC.
- D. L. Englert, M. D. Manson and A. Jayaraman, Nat. Protoc., 2010, 5, 864–872 CrossRef CAS.
- H. H. Jeong, SLAS Technol., 2021, 26, 159–164 CrossRef CAS PubMed.
- N. Garcia-Seyda, L. Aoun, V. Tishkova, V. Seveau, M. Biarnes-Pelicot, M. Bajenoff, M. P. Valignat and O. Theodoly, Lab Chip, 2020, 20, 1639–1647 RSC.
- M. M. Salek, F. Carrara, V. Fernandez, J. S. Guasto and R. Stocker, Nat. Commun., 2019, 10, 1877 CrossRef.
- B. S. Lambert, J.-B. Raina, V. I. Fernandez, C. Rinke, N. Siboni, F. Rubino, P. Hugenholtz, G. W. Tyson, J. R. Seymour and R. Stocker, Nat. Microbiol., 2017, 2, 1344–1349 CrossRef CAS.
- K. Son, F. Menolascina and R. Stocker, Proc. Natl. Acad. Sci. U. S. A., 2016, 113, 8624–8629 CrossRef CAS PubMed.
- A. J. Waite, N. W. Frankel, Y. S. Dufour, J. F. Johnston, J. Long and T. Emonet, Mol. Syst. Biol., 2016, 12, 895 CrossRef.
- A. Zoghlami and G. Paës, Front. Chem., 2019, 7, 874 CrossRef CAS.
- C. E. Rodrigues Reis, T. S. Milessi, M. D. N. Ramos, A. K. Singh, G. Mohanakrishna, T. M. Aminabhavi, P. S. Kumar and A. K. Chandel, Biotechnol. Adv., 2023, 68, 108209 CrossRef CAS PubMed.
- V. Ashokkumar, R. Venkatkarthick, S. Jayashree, S. Chuetor, S. Dharmaraj, G. Kumar, W. H. Chen and C. Ngamcharussrivichai, Bioresour. Technol., 2022, 344, 126195 CrossRef CAS PubMed.
- T. Sumranwanich, E. Amosu, S. Chankhamhaengdecha, T. Phetruen, W. Loktumraks, P. Ounjai and P. Harnvoravongchai, Sci. Rep., 2024, 14, 13350 CrossRef CAS PubMed.
- A. Karthika, R. Seenivasagan, R. Kasimani, O. O. Babalola and M. Vasanthy, Waste Manage., 2020, 116, 58–65 CrossRef CAS PubMed.
- L. Ma, Y. Lu, H. Yan, X. Wang, Y. Yi, Y. Shan, B. Liu, Y. Zhou and X. Lü, BMC Biotechnol., 2020, 20, 2 CrossRef PubMed.
- A. K. S. Kameshwar and W. Qin, in Cellulases, ed. M. Lübeck, Springer, New York, 2018, pp. 47–56 Search PubMed.
- Z. H. Fu, J. Liu, L. B. Zhong, H. Huang, P. Zhu, C. X. Wang and X. P. Bai, Front. Microbiol., 2022, 13, 996930 CrossRef.
- A. J. Book, G. R. Lewin, B. R. McDonald, T. E. Takasuka, D. T. Doering, A. S. Adams, J. A. Blodgett, J. Clardy, K. F. Raffa, B. G. Fox and C. R. Currie, Appl. Environ. Microbiol., 2014, 80, 4692–4701 CrossRef.
- K. Jaqaman, D. Loerke, M. Mettlen, H. Kuwata, S. Grinstein, S. L. Schmid and G. Danuser, Nat. Methods, 2008, 5, 695–702 CrossRef CAS PubMed.
- N. M. Oliveira, J. H. R. Wheeler, C. Deroy, S. C. Booth, E. J. Walsh, W. M. Durham and K. R. Foster, Nat. Commun., 2022, 13, 7608 CrossRef CAS PubMed.
- C. Roggo, C. Picioreanu, X. Richard, C. Mazza, H. Van Lintel and J. R. Van Der Meer, Environ. Microbiol., 2018, 20, 241–258 CrossRef CAS PubMed.
- G. M. Viswanathan, S. V. Buldyrev, S. Havlin, M. G. E. Da Luz, E. P. Raposo and H. E. Stanley, Nature, 1999, 401, 911–914 CrossRef CAS PubMed.
- J. M. Keegstra, F. Carrara and R. Stocker, Nat. Rev. Microbiol., 2022, 20, 491–504 CrossRef CAS PubMed.
- R. Colin and V. Sourjik, Curr. Opin. Microbiol., 2017, 39, 24–33 CrossRef CAS PubMed.
- R. C. Wilhelm, R. Singh, L. D. Eltis and W. W. Mohn, ISME J., 2019, 13, 413–429 CrossRef CAS.
Footnotes |
| † Electronic supplementary information (ESI) available. See DOI: https://doi.org/10.1039/d4lc00892h |
| ‡ L. X. and Y. S. contributed equally to this work. |
| This journal is © The Royal Society of Chemistry 2025 |