
 Open Access Article
 This Open Access Article is licensed under a
 Creative Commons Attribution 3.0 Unported Licence
Image-based fuzzy logic control for pressure-driven droplet microfluidics as autosampler for multimodal imaging microscopy†
Fabian
Ott
a,
Tobias
Meyer-Zedler
 a,
Michael
Schmitt
b and
Jürgen
Popp
*ab
a,
Michael
Schmitt
b and
Jürgen
Popp
*ab
aMember of Leibniz Health Technologies, Member of the Leibniz Center for Photonics in Infection Research (LPI), Leibniz Institute of Photonic Technology (Leibniz-IPHT), Albert-Einstein-Str. 9, 07745 Jena, Germany
bInstitute of Physical Chemistry (IPC) and Abbe Center of Photonics (ACP), Member of the Leibniz Center for Photonics in Infection Research (LPI), Friedrich Schiller University Jena, Helmholtzweg 4, 07743 Jena, Germany. E-mail: juergen.popp@uni-jena.de
First published on 20th November 2024
Abstract
Here we present a highly customisable image-based fuzzy logic control (FLC) method for pressure-driven droplet microfluidics. The system is designed to position droplets of different sizes in microfluidic chips of varying channel size in the centre of the region of interest (ROI) using two parallel multiple input single output (MISO) FLCs. Overall, 95.1% of the droplets with an average displacement of 2.5 μm could be kept within the ROI during the pre-defined time intervals of up to 10 s. This is achieved by pre-determined pressure values that are kept constant during this time. The control principle was tested on different pressure controllers and microfluidic chips varying in material, channel layout and cross section. Droplet volumes ranged from a few hundred picolitres to a tenth of a microlitre. The droplets were composed of deionised water or contained two concentrations of S. cerevisiae. The average processing time was 12.5 seconds. This makes the method suitable for studying several hundred pre-sorted droplets from high-throughput screening (HTS) experiments.
Introduction
Droplet microfluidics is ideal for manipulating and analyzing small volumes of fluids and the analytes they contain. The principle is based on the immiscibility of a continuous and a disperse phase, making each droplet a confined reaction chamber.1–3 The technique combined with appropriate microfluidic chips and pressure controllers, enables the generation of monodisperse droplets of precisely defined size and composition.4–6 The droplet volume produced is determined by the channel geometry, pressure difference (ΔP) between continuous and disperse phases, interfacial tension, viscosities and surfactants.7–10 Ultimately, the application determines the droplet size, which ranges from picolitres to microlitres. By covering several orders of magnitude, a wide range of applications in chemistry, biology, materials science and diagnostics can be addressed.11–14Parallel monitoring of large number of droplets can be performed in observation chambers for longer periods of time.15 In contrast the aim of this work is to automatically analyze and move individual droplets of interest for longer time spans. To combine droplet microfluidics with different microscopic imaging modalities, it is necessary to overcome the obstacle of their different operating and acquisition frequencies. In general, pressure-driven droplet microfluidics means continuous generation of droplets at constant velocity and kHz rates.16 This requires the use of high-speed cameras with correspondingly short exposure times to avoid motion blur.17 The flow rate of the droplets is subject to certain fluctuations18 and vortices form within the droplets.19,20 Therefore, measurements that require switching between widefield and confocal imaging modalities with long acquisition times are extremely challenging.
However, there are ways to extend the observation time. One approach is to follow the droplets of interest.21 Another technique uses the movement of the microscope stage in the opposite direction to the flow.17 A further option is to stop the droplets with valves.22,23
Here we introduce an image-based FLC algorithm to set ΔP close to zero in the center of ROI (Fig. 1). This allows the droplet to be held in position for a period of time, extending the timeframe for imaging. We chose pressure regulators which have several advantages over syringe-based systems. Firstly, the flow has less fluctuations.24 Second, the response time to parameter changes is faster.4,25 Thirdly, sample exchange is straight forward.
 | ||
| Fig. 1 Basic operation principle, a) pressure controller, b) microfluidic chip with sample reservoirs for pre-sorted droplets, c) microscope camera, d) image processing and FLC algorithm. | ||
We expect that our method will provide a deeper insight into the contents of the microfluidic droplets with high precision. For example, the morphology of cells could be studied or movement patterns analyzed. Furthermore, this basic principle can be extended to complex channel geometries. This provides a new tool for controlling pressure-based droplet microfluidics for lab-on-a-chip systems, where on-demand control and manipulation is paramount.
Experimental
Imaging
Images were captured using a monochrome camera (MQ022MG-CM, XIMEA GmbH, Münster, Germany) with a 10× objective (MPlan, NA 0.25, Olympus, Japan) and a tube lens (AC254-200-A-ML, Thorlabs Inc., Newton, USA). An LED light source (Kern & Sohn GmbH, Balingen-Frommern, Germany) was used for illumination (Fig. 2). The condenser consists of two apertures and two lenses (EO ACH 25 × 30 VIS-NIR, Edmund Optics GmbH, Mainz, Germany). A calibration target (A1L3S3, Thorlabs) was used to determine the spatial resolution by measuring the conversion factor (px μm−1). | ||
| Fig. 2 Experimental setup, a) LED light source, b) condenser, c) microfluidic chip, d) 10× objective, e) tube lens, f) pressure controller with pressure and vacuum pump, g) monochrome camera, h) computer with control software. | ||
Microfluidics
A P2CS pressure controller with pressure and vacuum pump (Biophysical Tools GmbH, Wettin, Germany) was used for microfluidic flow control. The connection to the chip is realized by silicone tubing (inner diameter 1 mm, outer diameter 3 mm, length 30 cm, Carl Roth, Karlsruhe, Germany) and male elbow Luer connectors (10802, ibidi GmbH, Gräfelfing, Germany), which fit onto female Luer to 10–32 UNF threads, which act as sample reservoirs. The interface to the straight channel glass chip (Fluidic design 1072, microfluidic ChipShop GmbH, Jena, Germany), channel dimensions (width: 100 μm, depth: 37 μm, length: 58.5 mm) is realized by a custom 3D printed holder and silicon O-rings for sealing.Samples
Continuous phase (Pico-Wave 7500 with 0.5% (V/V) Pico-Surf, Sphere Fluidics, Cambridge, UK) was prepared. The disperse phase samples were deionized water (H2O), Saccharomyces cerevisiae 250 mg ml−1 H2O, diluted 1![[thin space (1/6-em)]](https://www.rsc.org/images/entities/char_2009.gif) :1000 and 1:100 in H2O. Droplet generation was performed using a cross-shape channel chip (Fluidic design 82, microfluidic ChipShop GmbH, Jena, Germany) and a 10 ml syringe (B. Braun SE, Melsungen, Germany). During the manual droplet generation, the syringe plunger was randomly pulled with varying speed to produce polydisperse droplets. Respectively 20 μl of these prepared emulsions were pipetted into the inlet sample reservoir of the straight channel chip.
:1000 and 1:100 in H2O. Droplet generation was performed using a cross-shape channel chip (Fluidic design 82, microfluidic ChipShop GmbH, Jena, Germany) and a 10 ml syringe (B. Braun SE, Melsungen, Germany). During the manual droplet generation, the syringe plunger was randomly pulled with varying speed to produce polydisperse droplets. Respectively 20 μl of these prepared emulsions were pipetted into the inlet sample reservoir of the straight channel chip.
Software
The imaging and pressure control algorithms were developed in the LabVIEW programming environment (LabVIEW 2019, version 19.0.1f5, 64-bit, Vision Development Module, National Instruments Corp., Texas, USA). Fiji26 was used for image calibration and video editing. OriginPro 2024 (64-bit, version 10.1.0.170, OriginLab Corp., Northampton; USA) was used for graph visualization. Microsoft Office Professional Plus 2019 (Microsoft Corp., Redmond, USA) was used for writing, figure generations and flowcharting.Microfluidic state machine
The program sequence is implemented by a state machine. The default state is designated as Manual which enables the user to modify the values transmitted to the pressure controller. Upon selection of the Feedback operation mode, the state transitions to Init. The pressure values pinlet and poutlet are incrementally increased or decreased by pos_neg_pressure_increment until max_pos_neg_pressure is reached. If both droplet sides, dLL and dRR are true and cLxinv + cRx = drop_length is within the range of min_drop_length and max_drop_length the state switches to Center. In the absence of a detection of either cLx or cRx for a period of one second, the state reverts to its initial state Init. The first Center loop execution sets pinlet and poutlet to zero. If both dLL and dRR are true the value of drop_length/2 will be set as the actual points for the input MSF contour position. In turn, the MSF pressure change will be modified in accordance with the values of vL and vR. When either dLL or dRR is true, the corresponding MISO FLC is executed and the calculated value is added to pinlet and poutlet until max_pos_neg_pressure is reached or the center_stabilizing_timer is true. This is the case when cLxinv= xleftmax− drop_length/2 ± 5 px or cRx = drop_length/2 ± 5 px are in range for 1 s. The follow-up state is Hold, here the pressure values remain constant until the predefined Hold time has expired and then the state switches to For. Here, similar to Init pinlet and poutlet are in-/decreased stepwise until max_pos_neg_pressure is reached or droplet side dRL becomes true. In this case n_droplets_done will be incremented by one and the state changes to Init. This cycle continues till n_droplets_done = Image_n_droplets, then the sequence lingers into the Center state. There is the option to continue the sequence by increasing Image_n_droplets or to quit the program.Droplet contour detection
The readout of the y-pixels from the raw camera image is reduced to the width of the microfluidic channel, excluding the channel walls. This equates to 128 pixels. The number of x-pixels was set to 512 px and 1024 px. The main ROI camera images (Fig. 3a) were divided into two ROI's in x-direction, namely the left and right ROI (IMAQ Extract 2.vi). Subsequently, the thresholding of the raw 8-bit greyscale images, which ranged from 0 to 100, was conducted in order to transform them into binary images (IMAQ Threshold.vi, Fig. 3b). Subsequently, the boarder objects are identified (IMAQ RejectBorder.vi) and the resulting image (Fig. 3c) is subtracted from the input image (IMAQ Absolute Difference.vi). The calculated image comprises solely border objects and is employed for the purpose of contour detection. The IMAQ Extract Contour.vi was set to only identify the first contour from search start. The search directions were defined from right to left for the left ROI and from left to right for the right ROI. The contours that have been detected are then overlaid on the images for visualization (Fig. 3d). To achieve a smoother contour data set, a spline curve fitting technique (IMAQ Fit Contour.vi) was employed. In order to exclude false positive results, the pixel array of xy-clusters is checked for the criteria ymin ≤ 8 px and ymax ≥ 120 px. In the false case, the position information is set as Not a Number (NaN) while the droplet sides (dLL, dLR, dRL, dRR) are set as false. If the aforementioned criteria are met the vector![[u with combining right harpoon above (vector)]](https://www.rsc.org/images/entities/i_char_0075_20d1.gif) ×
× ![[v with combining right harpoon above (vector)]](https://www.rsc.org/images/entities/i_char_0076_20d1.gif) is calculated (Fig. 3e). A positive result (>0) indicates that the left side of the droplet has been identified, whereas a negative result (<0) implies that the right side has been detected. Consequently, the droplet side variables were designated as either true or false. Additionally, the corresponding x value to yn/2 was utilized as the position (cLx, cRx). In order to apply the same fuzzy input membership function (MSF) for both contour positions, it is necessary to invert cLx whereby xleftmax − cLx = cLxinv. The contour velocity is calculated only if the same droplet side is detected in two consecutive frames (vL, vR).
is calculated (Fig. 3e). A positive result (>0) indicates that the left side of the droplet has been identified, whereas a negative result (<0) implies that the right side has been detected. Consequently, the droplet side variables were designated as either true or false. Additionally, the corresponding x value to yn/2 was utilized as the position (cLx, cRx). In order to apply the same fuzzy input membership function (MSF) for both contour positions, it is necessary to invert cLx whereby xleftmax − cLx = cLxinv. The contour velocity is calculated only if the same droplet side is detected in two consecutive frames (vL, vR).
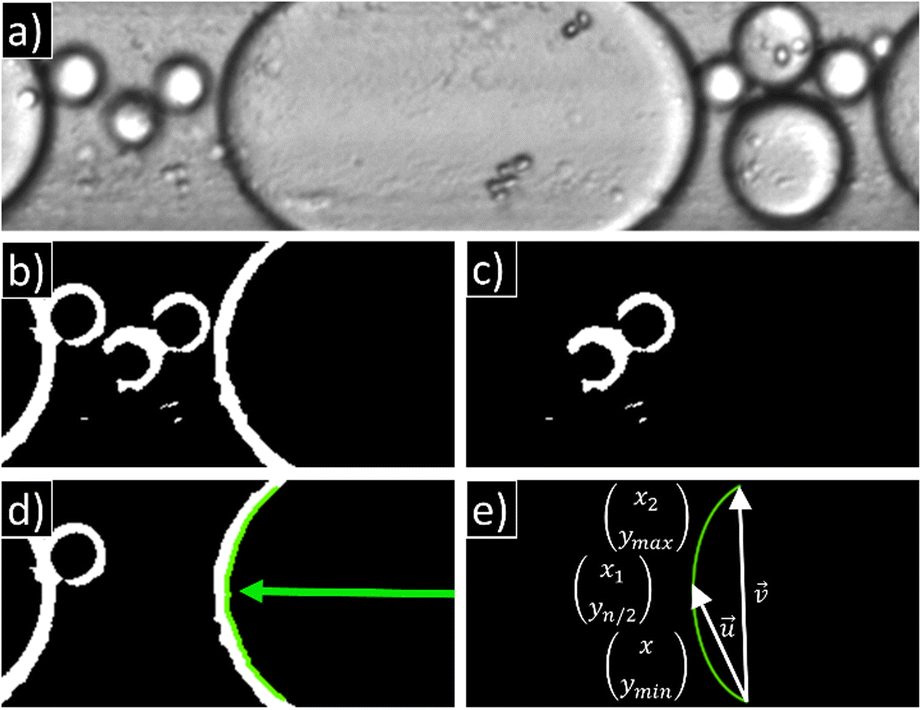 | ||
| Fig. 3 Image processing steps; a) main ROI camera image; b) cropped, threshold, binary, left ROI; c) rejected border objects; (d) absolute difference between (b) and (c) with first contour detected, search direction right to left; e) b-spline fitting and coordinate pairs for droplet side calculations. | ||
Fuzzy logic control
Two parallel MISO FLC systems were implemented using the FL Fuzzy Controller (MISO).vi. The input variables are the contour position (c = cLxinv or cRx) and the contour velocity (v = vL or vR). In the Center state the three triangular-shaped input MSFs contour position are programmatically changed to the actual drop_length/2 (Fig. 4a; n: point 3, z: point 2, p: point 1). The input MSF contour velocity, which comprise two trapezoid-shaped n and p functions and one narrow triangular-shaped z function remain unchanged (Fig. 4b). The output MSFs n and p will be adapted in accordance with the respective speed v = vL or vR (Fig. 4c). The fuzzy rule base comprises a total of nine rules (Fig. 4d). The defuzzification method employed was the center of maximum. For all rules, the antecedent connective was set to AND (minimum), the degree of support is equal to one and the consequent implication was set to minimum. The output dp1 and dp2 are added to pinlet and poutlet. | ||
| Fig. 4 a) Input MSF – contour position for 1024 px main ROI; b) input MSF – contour velocity; c) output MSF – pressure change; d) rule base. | ||
Results and discussion
A total of 2400 droplets were examined. For each sample (H2O, S. cer. 1:1000, S. cer. 1:100) and main ROI (512 px, 1024 px), 400 droplets were processed. The total measurement time was 11 h:29 m:31 s. Subtracting the hold time leaves 8 h:19 m:31 s. This yields an average value of 12.5 s for initializing, centering and forwarding a single droplet. Fig. 5a presents the time distribution of the microfluidic states broken down by the sample group.
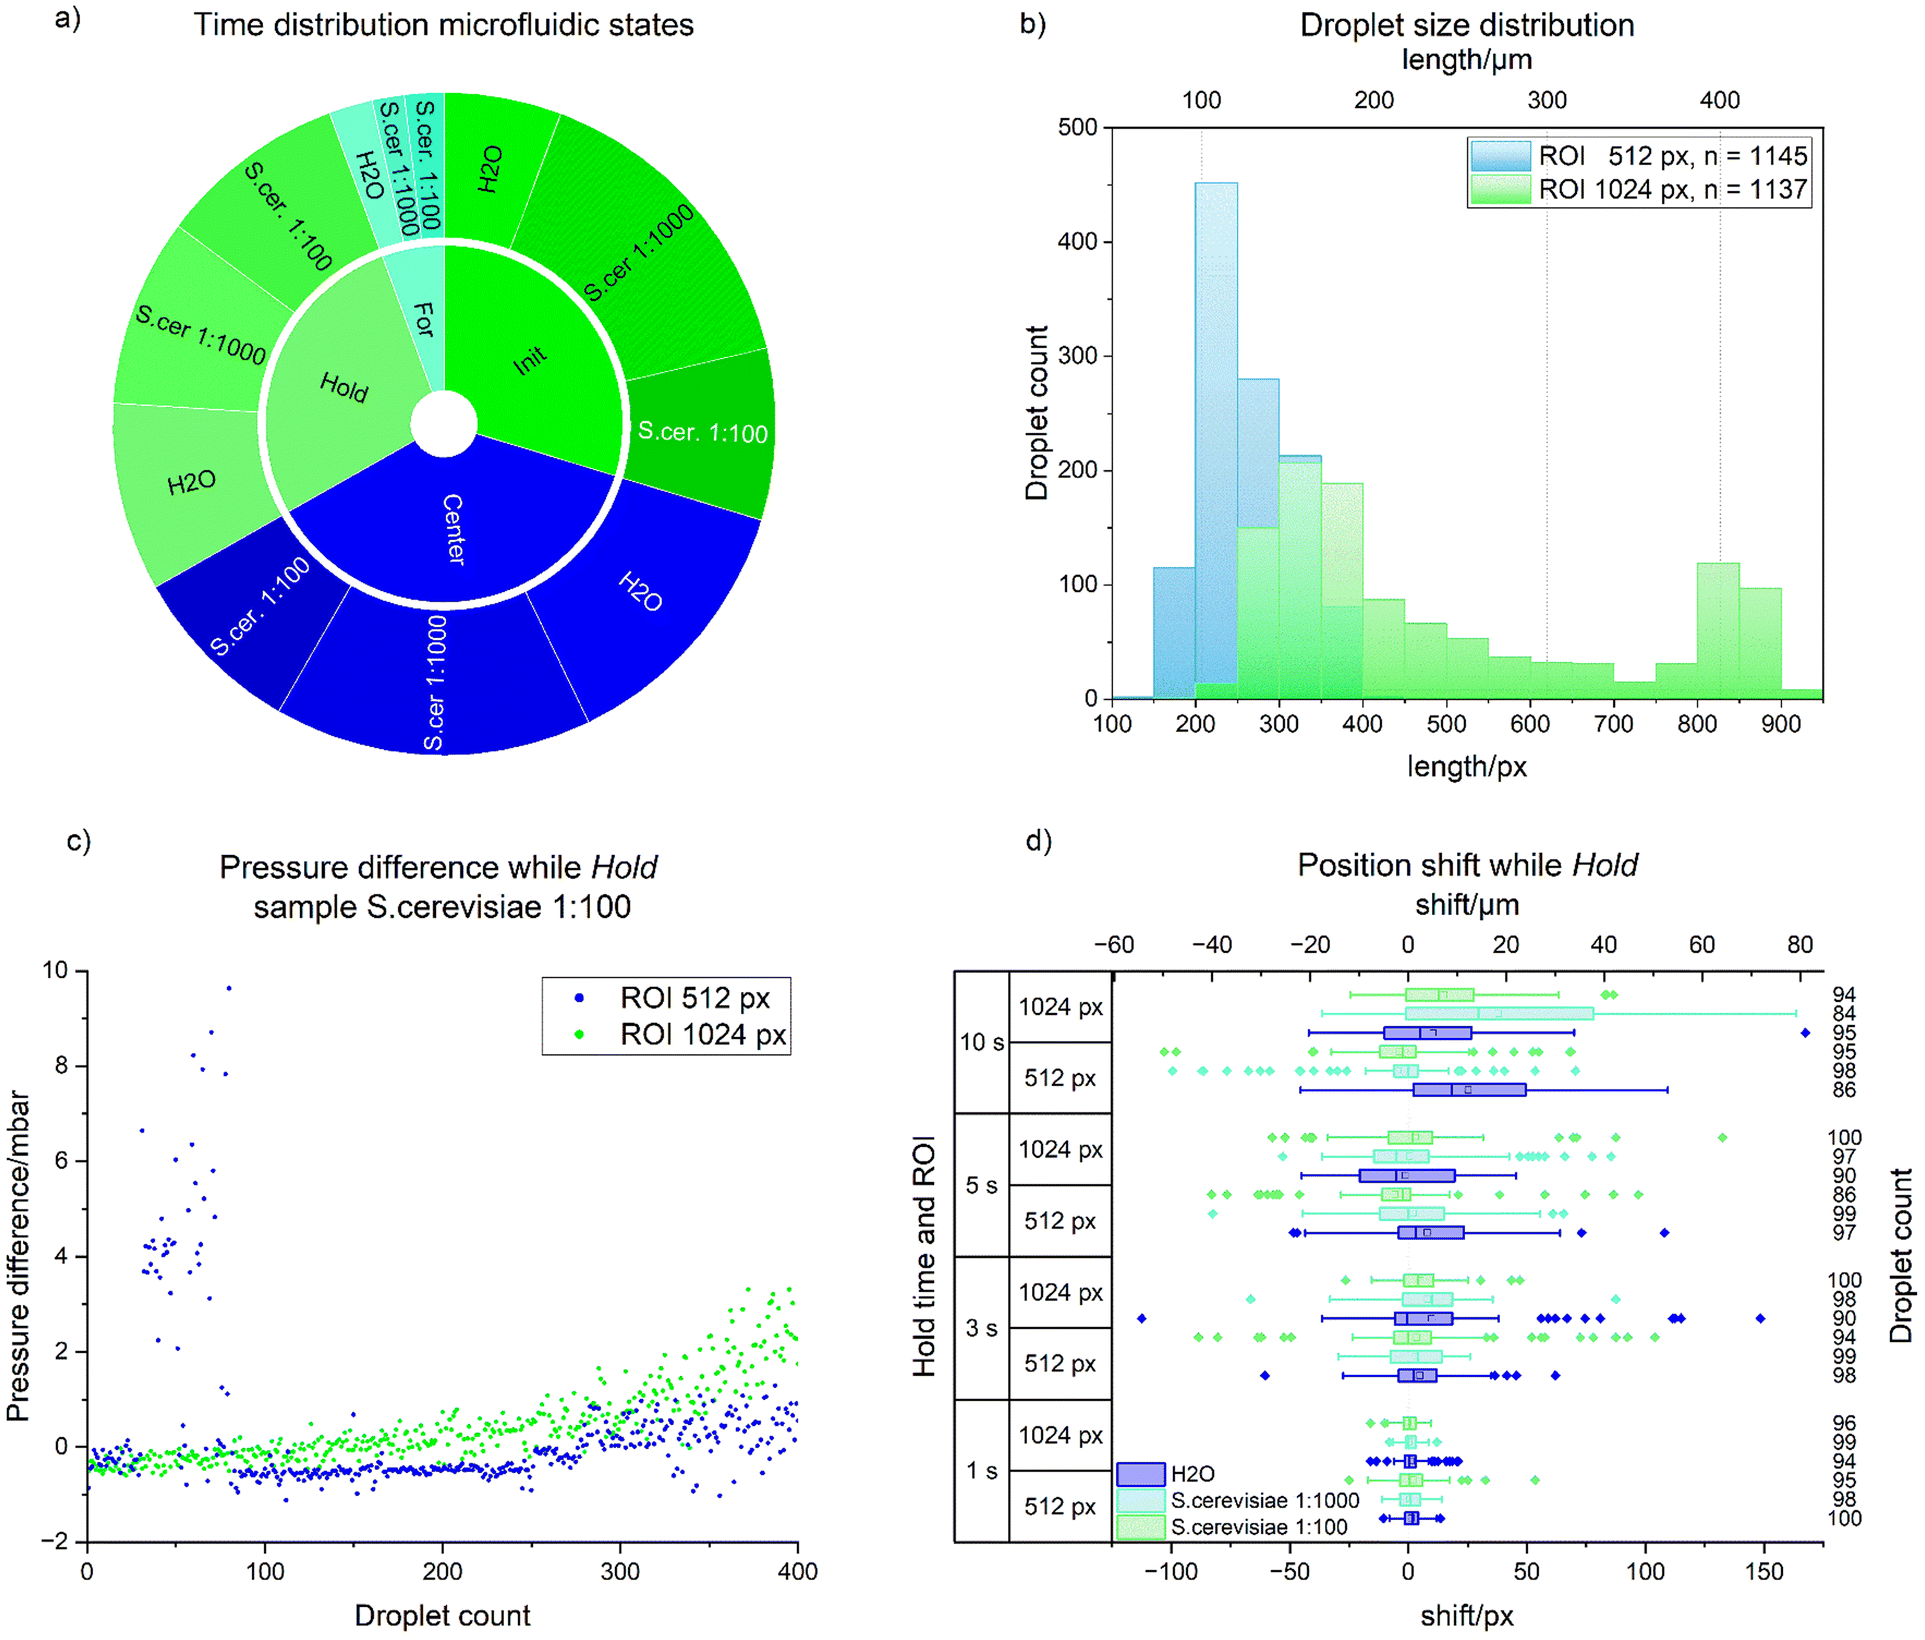 | ||
| Fig. 5 a) Time distribution microfluidic states; b) droplet size distribution; c) pressure difference while Hold; d) position shift while Hold. | ||
Init took a total of 3 h:24 m:41 s, the initialization of a droplet takes 5.1 s on average. The initialization time depends on the pressure difference (ΔP) between the inlet and outlet. Alternatively, the maximum ΔP of the pressure regulator could be applied at the beginning instead of gradually increasing it. Then the flow velocity would immediately increase and the droplets would move into the ROI much faster. However, this increases the probability that droplets will pass through the detection area without being positioned. Furthermore, if the distance between the droplets is small, this would facilitate the system to oscillate. Another decisive factor is when a droplet is transported into the channel. If the ratio of continuous to disperse phase is shifted in favor of the disperse phase, the probability that a droplet will flow into the channel increases. As the two phases have different densities, a phase separation occurs in the reservoir and the denser continuous phase (1.61 g cm−3) is therefore transported into the channel first. To test the setup thoroughly, samples with a polydisperse size distribution were prepared for this experiment. This means that an indeterminate number of droplets do not fulfil the differentiation criteria. In case of a sample with a well-defined monodisperse distribution, the limit values can be set precisely so that every droplet is processed, which reduces the average initialization time.
Center (4 h:15 min:58 s) takes an average of 6.4 s and is therefore the longest process step. A reduction in pressure to zero mbar results in a sudden decrease in the flow rate. The manufacturer of the pressure controller states that both the rise and fall of 100 mbar take 17 ms.27 In some cases setting pinlet and poutlet to zero is not sufficient to slow down the droplet exactly in the detection area. Ideally, the flow should stop immediately when the pressure difference is set to zero. However, due to the elasticity of the tube connectors, sample reservoir, sealing ring and the microfluidic chip, there is a compliance which causes a delay time before the flow velocity in the microchannel approaches zero.23 The silicone tubing between the controller and the sample reservoir makes the largest contribution. In order to shorten delay time and thus also response time of the system, the above-mentioned components should have the lowest possible elasticity and the connection distances should be kept as short as possible. If the delay time is too long or the flow velocity is too high, the droplet passes the ROI without being controlled by the FLC. To avoid this case, the rules of the FLC could be further extended, e.g. with MSFs for the current pressure and associated rules. However, such an adaptation requires many attempts to optimally adapt the rules to the system. Another potential cause for this phenomenon is that the center_stablizing_timer is reset when neither the cLx nor cRx are detected in a single frame. This issue could be solved by implementing a moving average to suppress false negative detections.
The hold time of 3 h:10 m is specified by the defined hold times of 1 s, 3 s, 5 s and 10 s. However, this hold time can also be specified by the acquisition time defined by the microscope imaging software and synchronized by triggering for the respective imaging modality used. Typical acquisition times for brightfield images are in the range of μs to ms. However, it is planned to combine the application presented here with non-linear imaging modalities such as two-photon excited fluorescence (TPEF) and coherent anti-Stokes Raman scattering (CARS). Depending on pixel dwell time and resolution, acquisition times in the seconds range can be expected for these non-linear modalities.28,29
The state For (38 m:51 s) lasted on average 1 s. However, the image acquisition process itself can also take several seconds, depending on the resolution and number of images required, for example, in the case of z-stacks or time series. In that case the times required for droplet handling and imaging are of comparable order of magnitude. It should be noted that the total acquisition time is not well suited for high throughput approaches with hundred thousand of droplets. Nevertheless, a few hundred droplets can be examined within a reasonable time frame. In the event that a considerable number of samples is present, it is advisable to presort them according to the characteristics of interest.30,31
The histogram depicted in Fig. 5b encompasses droplets whose standard deviation (SD) of droplet_length between Center, Hold and For was ≤12 px. This comparison of lengths is necessary to eliminate droplets from the evaluation that might have left the detection area during the Hold phase or have been caused by false positive contour detection. A total of 55 droplets (ROI 512 px) and 63 droplets (ROI 1024 px) were excluded from the analysis. This means a mean relative error of 4.9% for holding both droplet contours inside the ROI. To reduce this error, the detection could be further improved. Instead of just comparing the droplet contour per frame with the previous, a more robust tracking algorithm could be implemented. A balance should be found between the image processing time and the response time of the microfluidic system. In any case, for the optical system a factor of 2.068 px μm−1 was determined with the calibration target. This means that the largest group of 512 px ROI is 109 μm in length. The second largest population with a length of approx. 157 μm belongs to the 1024 px ROI, as does the third largest with 400 μm. The absolute minimum length was 71 μm, and the maximum was 442 μm. This means that min_droplet_length and max_droplet_length have been undercut and exceeded. The reason for this is that the discriminators decide while Init, but the values of the diagram originate from the For state. Another consideration is droplet deformation at high flow velocities, which causes a contour modification between flowing and floating droplets.20 The length discriminators also serve to achieve a more effective regulation. For this, min_droplet_length must be at least 10% greater than the channel width and height. This ensures that it fills the channel cross-section. Similarly, max_droplet_length must be at least 10% smaller than the ROI. Otherwise the control distance of the MSF contour position will be insufficient. A simplified approximation is Vdroplet = droplet_length × width_channel × height_channel for estimating the droplet volume. Vdroplet extends from 262.7 pl up to 1.6 nl. It is possible to control both smaller and larger volumes, but there are some limitations. These include the channel cross-section, the pressure range of the controller and the ROI defined by the optical system. Furthermore, other pressure controllers can be used with the presented algorithm. If these controllers do not support negative pressures, it is possible to configure the MSFs to an overpressure regime to provide the necessary pressure difference.
The droplets are positioned by the ΔP between the two liquid surfaces in the sample reservoirs (Fig. 5c). This pressure difference results from several factors, including the liquid height in the reservoirs, the channel geometry, the number, size, distribution and composition of the droplets and the continuous phase.20 A rapid change in ΔP is also an indicator of leaks in the fluidic or pneumatic system. Furthermore, impurities such as dust can lead to an increase. This was almost certainly the case between the 25th and 75th droplet (Fig. 5c, ROI 512 px), where there was a sudden, abrupt increase followed by a drop below the starting level. The system can compensate for impurities of this kind. The controller has a maximum ΔP limitation. If the foreign particle cannot be sufficiently deformed by this differential or exceeds the adhesion force, a blockage will occur in the channel.
The displacement of the droplets during Hold (Fig. 5d) is calculated from the averaged difference between cLinv and cR from each first execution of the states Hold and For. It is clear that the scatter width of the boxplots increases with longer hold time. Furthermore, the data clearly demonstrate that droplet are drifting towards the outlet (Table 1, column: average, minimum, maximum). When grouped by time, it is clear that the SD increases with longer holding times. When the data is grouped according to sample type, it becomes clear that the average shift decreases. The mean and SD increase with increasing ROI size when grouped. This shift has several causes.
| Group | Sample | N | Average | SD | Minimum | Median | Maximum |
|---|---|---|---|---|---|---|---|
| Time | 1 s | 582 | 0.2 | 3.0 | −12.1 | 0.2 | 25.9 |
| 3 s | 579 | 1.3 | 10.8 | −54.4 | 1.7 | 71.8 | |
| 5 s | 569 | 0.3 | 12.3 | −40.1 | −0.2 | 64.1 | |
| 10 s | 552 | 3.0 | 16.9 | −49.8 | 1.9 | 81.0 | |
| Sample | H2O | 750 | 1.7 | 12.4 | −54.4 | 1.0 | 81.0 |
|
S. cer. 1:1000 |
772 | 1.3 | 12.6 | −48.1 | 0.5 | 79.1 | |
|
S. cer. 1:100 |
760 | 0.6 | 10.8 | −49.8 | 0.2 | 64.1 | |
| ROI | 512 px | 1145 | 0.7 | 11.4 | −49.8 | 0.2 | 52.9 |
| 1024 px | 1137 | 1.7 | 12.5 | −54.4 | 1.0 | 81.0 |
Firstly, the values of the pressure controller fluctuate around the set target value. Secondly, the difference in density between the continuous and disperse phases can cause individual droplets to escape from the channel into the reservoirs. This results in a pressure change in the channel. To correct any shifts that occur as a result, the system must be readjusted accordingly. A permanent control can be carried out when imaging in brightfield mode. If the image modality does not allow constant illumination, it can be interrupted for repositioning and continued afterwards. An alternative solution is to implement parallel acquisition of the camera for positioning and other imaging modalities. In conclusion image recognition of the droplet contours is the most important factor for successful positioning. The algorithm is currently designed to recognize the first contour that fulfills the criteria. The response time of the microfluidic controller for the pressure change of ±100 mbar is approx. 17 ms, the communication time between computer and controller is approx. 22 ms. The edge detection and FLC process requires approx. 10 ms. Each pressure value change is based on the analysis of two consecutive images and the edge information obtained from them. Thus, image processing time and response time of the microfluidic controller are on the same time scale. To make the system less error-prone in terms of recognition, all droplet contours in the ROI could be recognized. This would double the FLC MSF contour position width, which would also double the control path of the FLC system. This would reduce the probability that a droplet is not detected. However, there is a disadvantage in that it will take longer to process the images. This must be coordinated with the response time of the microfluidic system. The measurements with S. cerevisiae have demonstrated that contour recognition is not significantly affected by cellular content and positioning can be carried out successfully. We assume that the functionality remains guaranteed for cell types with the same or smaller diameter and the same or lower cell concentrations. It is clear that higher cell density implies a lower shift during Hold (Table 1, group: sample; average). However, further measurements with different cell densities are needed to confirm this assumption.
This system has been designed to analyze in detail pre-sorted droplets from HTS experiments, e.g., in an antibiotic susceptibility assay.32 In such experiments, millions of droplets are generated and presorting is performed by e.g., fluorescence33 or elastic light scattering34 at up to kHz rate, which results in several hundred up to thousand droplets, which need to be automatically analysed in detail.
Another application includes the automated evacuation of pre-sorted droplets from microfluidic chips for transfer to a culture substrate.35
Conclusions
The presented system can position a defined number of microfluidic droplets fully automatically in the center of the ROI. The positioning could also be carried out successfully with droplets containing S. cerevisiae. In other tests, droplets containing E. coli 992 mCherry, E. coli 081 GFP, Microbacteria, Bacillus DSM 1970 were positioned. The selection was programmed to be length-depending, ranging from 150 px to 900 px. However, these values are variable and can be adjusted on the software side depending on the expected droplet size. The channel cross-section of the chip allows us to calculate an approximate and calibrated droplet volume of 270 pl to 1.6 nl. However, the system can be easily adjusted to larger and smaller droplet volumes, which are related to the channel sizes of the microfluidic chips. So far, the system has been successfully tested with commercial chips 100 μm wide, 37 μm deep made of glass, 50 μm wide, 50 μm deep made of PMMA (both microfluidic ChipShop GmbH, Jena, Germany), custom glass chips 570 μm wide, 270 μm deep as described previously,36 and chips made of PDMS of 50 μm channel depth.37 Thus, the control algorithm is applicable to various droplet volumes, droplet content and chip materials.Two MISO FLCs are executed in parallel to calculate the pressure values for centering. The average time for initializing, centering and forwarding a single droplet was 12.5 s. This period of time makes it necessary to presort droplets of interest from previous HTS. We successfully held 95.1% of 2400 droplets within the ROI for a hold time between 1 s and 10 s. During this time the droplets shifted by an average of 2.5 μm with a standard deviation of 11.9 μm. This is better than recently published stop-flow methods, which result in residual flow velocities of 10–200 μm s−1.23 In the hold span the image modality can be changed and acquisition can be carried out. An advantage of the system is the mobility and access to droplets. This makes it possible to use contained cells for subsequent cultivation after label-free image analysis. We will further develop the system's potential by adapting it to a microfluidic chip capable of generating, merging, storing droplets and observing them at different time points.
Data availability
The data supporting this article have been included as part of the ESI.†Author contributions
Conceptualization (J. P., T. M.-Z., F. O.), data curation (F. O.), formal analysis (F. O.), funding acquisition (J. P.), investigation (F. O.), methodology (F. O.), project administration (T. M.-Z., M. S., J. P.), resources (J. P.), software (F. O.), supervision (T. M.-Z., M. S., J. P.), validation (F. O.), visualization (F. O.), writing – original draft (F. O.), writing – review & editing (T. M.-Z., M. S., J. P.).Conflicts of interest
There are no conflicts to declare.Acknowledgements
This work was supported by the Leibniz Association via the ScienceCampus ‘InfectoOptics’ for the project ‘VersaDrop’ and by the BMBF, funding program Photonics Research Germany (FKZ: 13N15464 and is integrated into the Leibniz Center for Photonics in Infection Research (LPI). The LPI initiated by Leibniz-IPHT, Leibniz-HKI, UKJ and FSU Jena is part of the BMBF national roadmap for research infrastructures.References
- K. Martin, T. Henkel, V. Baier, A. Grodrian, T. Schön, M. Roth, J. M. Köhler and J. Metze, Lab Chip, 2003, 3, 202–207 RSC.
- J. M. Köhler, T. Henkel, A. Grodrian, T. Kirner, M. Roth, K. Martin and J. Metze, Chem. Eng. J., 2004, 101, 201–216 CrossRef.
- T. Kawakatsu, Y. Kikuchi and M. Nakajima, J. Am. Oil Chem. Soc., 1997, 74, 317–321 CrossRef CAS.
- C. Fütterer, N. Minc, V. Bormuth, J. H. Codarbox, P. Laval, J. Rossier and J. L. Viovy, Lab Chip, 2004, 4, 351–356 RSC.
- M. Joanicot and A. Ajdari, Science, 2005, 309, 887–888 CrossRef CAS.
- T. Henkel, T. Bermig, M. Kielpinski, A. Grodrian, J. Metze and J. M. Köhler, Chem. Eng. J., 2004, 101, 439–445 CrossRef CAS.
- A. Gupta, S. M. S. Murshed and R. Kumar, Appl. Phys. Lett., 2009, 94, 164107 CrossRef.
- J. H. Xu, P. F. Dong, H. Zhao, C. P. Tostado and G. S. Luo, Langmuir, 2012, 28, 9250–9258 CrossRef CAS.
- T. Thorsen, R. W. Roberts, F. H. Arnold and S. R. Quake, Phys. Rev. Lett., 2001, 86, 4163–4166 CrossRef CAS.
- X. Wang, Y. Ma, C. Zhang, Y. Pang and Z. Liu, Exp. Therm. Fluid Sci., 2023, 149, 111019 CrossRef.
- K. R. Ackermann, T. Henkel and J. Popp, ChemPhysChem, 2007, 8, 2665–2670 CrossRef CAS PubMed.
- A. März, K. R. Ackermann, D. Malsch, T. Bocklitz, T. Henkel and J. Popp, J. Biophotonics, 2009, 2, 232–242 CrossRef PubMed.
- A. Walter, A. März, W. Schumacher, P. Rösch and J. Popp, Lab Chip, 2011, 11, 1013–1021 RSC.
- S. Hengoju, M. Tovar, D. K. W. Man, S. Buchheim and M. A. Rosenbaum, in Microfluidics in Biotechnology, ed. J. Bahnemann and A. Grünberger, Springer International Publishing, Cham, 2022, pp. 129–157, DOI:10.1007/10_2020_140.
- J. C. Rolando, E. Jue, N. G. Schoepp and R. F. Ismagilov, Anal. Chem., 2019, 91, 1034–1042 CrossRef CAS PubMed.
- A. C. Hatch, J. S. Fisher, A. R. Tovar, A. T. Hsieh, R. Lin, S. L. Pentoney, D. L. Yang and A. P. Lee, Lab Chip, 2011, 11, 3838–3845 RSC.
- A. Mehrnezhad, T. J. Kwak, S. Kim, W.-J. Chang and K. Park, Microsyst. Technol., 2019, 25, 3417–3423 CrossRef.
- N. R. Beer, K. A. Rose and I. M. Kennedy, Lab Chip, 2009, 9, 838–840 RSC.
- J. D. Tice, H. Song, A. D. Lyon and R. F. Ismagilov, Langmuir, 2003, 19, 9127–9133 CrossRef CAS.
- C. N. Baroud, F. Gallaire and R. Dangla, Lab Chip, 2010, 10, 2032–2045 RSC.
- M. Kasterke, J. Thien, C. Flake, T. Brands, L. Bahr, A. Bardow and H.-J. Koß, Fluid Phase Equilib., 2023, 567, 113718 CrossRef CAS.
- F. Mehmood, Z. Haider, U. Farooq and Y. Baoqun, Meas. Control, 2019, 52, 1517–1531 CrossRef.
- M. A. Sahin, M. Shehzad and G. Destgeer, Small, 2024, 20, 2307956 CrossRef CAS PubMed.
- Z. Li, S. Y. Mak, A. Sauret and H. C. Shum, Lab Chip, 2014, 14, 744–749 RSC.
- D. F. Crawford, C. A. Smith and G. Whyte, Sci. Rep., 2017, 7, 10545 CrossRef CAS PubMed.
- J. Schindelin, I. Arganda-Carreras, E. Frise, V. Kaynig, M. Longair, T. Pietzsch, S. Preibisch, C. Rueden, S. Saalfeld, B. Schmid, J.-Y. Tinevez, D. J. White, V. Hartenstein, K. Eliceiri, P. Tomancak and A. Cardona, Nat. Methods, 2012, 9, 676–682 CrossRef CAS PubMed.
- https://biophysical-tools.de/de/microfluidic-flow-control-precision-pressure-control-system/, (accessed 13/05/ 2024).
- T. Meyer, N. Bergner, C. Krafft, D. Akimov, B. Dietzek, J. Popp, C. Bielecki, B. Romeike, R. Reichart and R. Kalff, J. Biomed. Opt., 2011, 16, 021113 CrossRef PubMed.
- D. Akimov, S. Chatzipapadopoulos, T. Meyer, N. Tarcea, B. Dietzek, M. Schmitt and J. Popp, J. Raman Spectrosc., 2009, 40, 941–947 CrossRef CAS.
- M. Budden, S. Schneider, G. A. Groß, M. Kielpinski, T. Henkel and J. M. Köhler, Chem. Eng. J., 2013, 227, 166–173 CrossRef CAS.
- E. Zang, S. Brandes, M. Tovar, K. Martin, F. Mech, P. Horbert, T. Henkel, M. T. Figge and M. Roth, Lab Chip, 2013, 13, 3707–3713 RSC.
- A. Samimi, S. Hengoju and M. A. Rosenbaum, Sens. Actuators, B, 2024, 417, 136162 CrossRef CAS.
- S. Hengoju, S. Wohlfeil, A. S. Munser, S. Boehme, E. Beckert, O. Shvydkiv, M. Tovar, M. Roth and M. A. Rosenbaum, Biomicrofluidics, 2020, 14, 024109 CrossRef CAS PubMed.
- A.-S. Munser, M. Trost, S. Schröder, M. Graf, M. A. Rosenbaum and A. Tünnermann, Appl. Opt., 2023, 62, 411–418 CrossRef PubMed.
- T. Weber, S. Hengoju, A. Samimi, M. Roth, M. Tovar and M. A. Rosenbaum, Sens. Actuators, B, 2022, 369, 132289 CrossRef CAS.
- K. R. Strehle, D. Cialla, P. Rösch, T. Henkel, M. Köhler and J. Popp, Anal. Chem., 2007, 79, 1542–1547 CrossRef CAS PubMed.
- M. Tovar, T. Weber, S. Hengoju, A. Lovera, A.-S. Munser, O. Shvydkiv and M. Roth, Biomicrofluidics, 2018, 12, 024115 CrossRef PubMed.
Footnote |
| † Electronic supplementary information (ESI) available. See DOI: https://doi.org/10.1039/d4lc00583j |
| This journal is © The Royal Society of Chemistry 2025 |