
 Open Access Article
 This Open Access Article is licensed under a Creative Commons Attribution-Non Commercial 3.0 Unported Licence
Turning sewage sludge and medical waste into energy: sustainable process synthesis via surrogate-based superstructure optimization†
Jianzhao
Zhou
a,
Jingzheng
Ren
 *ab and
Chang
He
c
*ab and
Chang
He
c
aDepartment of Industrial and Systems Engineering, Research Institute for Advanced Manufacturing, The Hong Kong Polytechnic University, Hung Hom, Kowloon, Hong Kong SAR, China. E-mail: jzhren@polyu.edu.hk
bResearch Center for Resources Engineering Towards Carbon Neutrality, The Hong Kong Polytechnic University, Kowloon, Hong Kong SAR, China
cSchool of Chemical Engineering and Technology, Guangdong Engineering Centre for Petrochemical Energy Conservation, Sun Yat-sen University, Guangzhou, 510275, China
First published on 2nd January 2025
Abstract
Waste-to-energy (WtE) conversion offers a promising solution for sustainable waste management, but identifying economically viable and environmentally sustainable pathways remains a significant challenge. To address this issue, this study presents an optimal process design for simultaneously converting medical waste and sewage sludge into energy based on a novel superstructure optimization framework. The superstructure integrates waste plasma gasification, CO2 capture, and fuel production, with economic profit and carbon emissions of each unit quantified through high-fidelity process simulations. To reduce the computational complexity, high dimensional model representation (HDMR)-based surrogate models are developed utilizing simulation data. With a compact surrogate model, efficient mixed-integer nonlinear programming is employed to identify the optimal pathway toward maximizing profit. The results reveal that producing hydrogen is the most economically favorable option, yielding a profit of 228.68 $ per h and carbon emissions of 3.82 t CO2 equivalent (CO2-eq) per h in the case study. Sensitivity analysis shows that increasing the ratio of medical waste enhances economic benefits but also raises carbon emissions. Additionally, the critical role of carbon tax in selecting low-carbon pathways while balancing economic viability is demonstrated. Compared to traditional waste treatment and energy production methods, the identified optimal processes demonstrate superior performance in carbon reduction, with emissions of 1.35 kg CO2-eq per kg mixed waste under carbon tax conditions. This research highlights the effectiveness of HDMR surrogating in superstructure optimization and offers valuable insights for sustainable WtE conversion.
Green foundation1. This study presents a high dimensional model representation-based superstructure optimization for identifying economically viable and environmentally sustainable waste-to-energy pathways, exemplified for co-valorization of medical waste and sewage sludge.2. The optimization can be achieved efficiently based on the proposed framework. Detailed analysis reveals that producing hydrogen from mixed waste is the most economically and environmentally favorable option, with emissions of 1.35 kg CO2-eq per kg mixed waste under carbon tax conditions. 3. In future work, the presented superstructure optimization framework may facilitate process design and synthesis for sustainable monetization of different wastes. |
1 Introduction
With population growth and societal advancement, the global energy demand is surging. By 2040, energy consumption is projected to reach 860 EJ, a 48% increase from 579 EJ in 2012.1 The current energy landscape remains heavily reliant on fossil fuels, contributing significantly to approximately 87% of greenhouse gas (GHG) emissions.2 On a global scale, addressing GHG emissions is widely recognized as one of the most critical challenges for achieving sustainable development.3,4 In response to this challenge,56 a key strategy is to facilitate a secure transition toward net-zero emissions in energy systems, as outlined in the World Energy Outlook 2022.5 Smart energy technologies, defined as tailored energy solutions that meet specific regional needs, have garnered significant attention.6 Notably, converting solid waste into energy has emerged as a widely accepted solution, given the substantial volume and high calorific value of waste. According to a UN Environment Programme report, municipal waste reached 2.1 billion tonnes in 2023, and is estimated to increase to 3.8 billion tonnes by 2050.7 Recently, researchers have focused on advancing waste-to-energy (WtE) systems, offering an environmentally beneficial approach for waste reduction and energy production. Thermochemical conversion processes such as incineration, pyrolysis, and gasification are considered effective and efficient methods for primary WtE conversion.8 These technologies decompose organic matter in waste into smaller molecules, which can be further processed through downstream upgrading to produce final energy products.9 Chu et al.10 proposed a process for medical waste (MW) treatment by integrating incineration with combined heat and power (CHP) generation, achieving a net electricity efficiency of 22.4%. Gasification, due to its low pollutant emissions,11 has been extensively studied for valorizing various wastes, such as MW,12 sewage sludge (SS)13 and biomass waste.14 Through gasification, H2 can be separated from syngas, with the carbon emissions of biomass waste-to-H2 processes typically ranging from 6–11 kg CO2 equivalent (CO2-eq) per kg H2.15 This emission is generally lower than that of the widely used steam methane reforming.15 Additionally, by further upgrading syngas derived from gasification, processes have been designed and assessed for converting waste into high-value energy carriers such as methanol,16 dimethyl ether (DME),17 and Fischer–Tropsch (FT) fuels.18With the increasing volume of waste, the co-valorization of different types of waste has gained significant attention. The co-treatment strategy not only ensures a sufficient feedstock supply to meet the operational capacity of desired processes,18 but it also has the potential to generate synergistic effects. For example, biomass has a relatively low heating value of around 16–20.5 MJ kg−1,19,20 which is lower than that of fossil fuels and limits its use in thermochemical applications. To enhance the feedstock's heating value, mixing waste plastic with biomass is an appealing option, as plastics have a considerable heating value of 43–45 MJ kg−1.21 Previous studies have demonstrated that co-gasification is a promising thermal technique for processing mixed waste streams.22 Given its substantial potential, it is crucial to explore technically and economically viable pathways to comprehensively manage this mixed waste.
WtE processes can be synthesized by assembling various operational units. Traditionally, most of these processes are designed incrementally using hierarchical decomposition methods.23 Through comparative analysis, these processes can be initially screened. For example, Li et al.24 compared three pathways for producing energy (hydrogen/methanol) from MW. Their findings indicated that hydrogen production was the most economically viable, with a dynamic payback period of 3.83 years and a higher net present value of 13![[thin space (1/6-em)]](https://www.rsc.org/images/entities/char_2009.gif) 783.57 k$. A more effective approach, however, involves considering a comprehensive set of network design options within a unified framework and then identifying the optimal solution based on specific evaluation criteria. This approach, known as superstructure-based optimization, facilitates accurate and informed decision making.25 Significant efforts have been made to apply superstructure optimization in WtE process synthesis. For instance, Galanopoulos et al.26 developed a superstructure framework with seven process stages, formulating the optimal pathway selection as a mixed-integer nonlinear programming (MINLP) problem. By solving this problem, they identified the most cost-effective pathway for an algae biorefinery, achieving a biodiesel production cost of 4.02 $ per liter. In another study, Ma et al.8 used biomass waste as the feedstock to construct a superstructure optimization for poultry litter valorization, maximizing the return on investment for alternative processes. Similarly, a gasification-based biomass valorization superstructure was developed, achieving a maximum net profit of 0.124 $ per kg biomass and minimum net emissions of 0.58 kg CO2-eq per kg biomass.23 However, most of these studies have focused on single waste streams, and a few WtE superstructures involve comprehensive pathways that integrate carbon capture and utilization (CCU), a promising approach to large-scale carbon reduction.27
783.57 k$. A more effective approach, however, involves considering a comprehensive set of network design options within a unified framework and then identifying the optimal solution based on specific evaluation criteria. This approach, known as superstructure-based optimization, facilitates accurate and informed decision making.25 Significant efforts have been made to apply superstructure optimization in WtE process synthesis. For instance, Galanopoulos et al.26 developed a superstructure framework with seven process stages, formulating the optimal pathway selection as a mixed-integer nonlinear programming (MINLP) problem. By solving this problem, they identified the most cost-effective pathway for an algae biorefinery, achieving a biodiesel production cost of 4.02 $ per liter. In another study, Ma et al.8 used biomass waste as the feedstock to construct a superstructure optimization for poultry litter valorization, maximizing the return on investment for alternative processes. Similarly, a gasification-based biomass valorization superstructure was developed, achieving a maximum net profit of 0.124 $ per kg biomass and minimum net emissions of 0.58 kg CO2-eq per kg biomass.23 However, most of these studies have focused on single waste streams, and a few WtE superstructures involve comprehensive pathways that integrate carbon capture and utilization (CCU), a promising approach to large-scale carbon reduction.27
To address the abovementioned challenges associated with sustainable mixed WtE conversion, this study employs superstructure optimization to identify the optimal pathway for co-valorization of MW and SS. By incorporating CCU units, we aim to synthesize a carbon-reduction oriented process. MW, rich in high-calorific plastic, and SS, with lower calorific values (11-20 MJ kg−1 (ref. 28)), are selected due to their complementary energy profiles and the urgent need for treatment (MW contains toxic components, while SS is generated daily in wastewater treatment). Both waste streams are rapidly increasing due to population growth, urbanization, and rising living standards.29,30 By leveraging their calorific complementarities, a comprehensive technology superstructure is developed for converting MW and SS into energy. High-fidelity model for each unit is constructed in Aspen Plus, followed by rigorous techno-economic analysis and life cycle assessment. Surrogate models based on high-dimensional model representation (HDMR) are then constructed to estimate output composition, economic performance, and environmental impact. The optimization is then formulated as a MINLP problem to determine the optimal pathway. Finally, a detailed analysis was conducted for the optimal solutions under different scenarios to gain insights into the co-valorization of MW and SS. Major novelties of this work are summarized as follows:
(1) The design of an innovative and comprehensive superstructure that incorporates CCU technologies for the sustainable conversion of mixed waste into multiple energy products including H2, methanol, DME and FT fuel.
(2) The development of detailed, rigorous models for each operation unit, along with compact surrogate models to enable efficient evaluation of process performance.
(3) The application of MINLP to identify optimal pathways for co-valorization under diverse scenarios, providing valuable insights into the most economically viable and environmentally sustainable solutions
2 Superstructure description
A superstructure for converting mixed waste (MW and SS) into energy has been developed by initial technical and economic evaluation, as illustrated in Fig. 1. The properties of SS (a mixture of primary and secondary sludge) and MW (surgical masks) used in this study are detailed in Table S1 (see the ESI†).31,32 The conversion process involves six major steps: plasma gasification step (PG), syngas upgrading step (SU), syngas cleaning step (SC), fuel production step (FP), tail gas treatment step (TT) and flue gas treatment step (FT). Plasma gasification is employed as the primary treatment technology, recognized as the best method for the disposal of toxic MW.33 In the first step, the waste is converted into syngas through plasma gasification. Five different technological configurations are employed in this step, each corresponding to a different equivalent ratio (ER), a key factor influencing plasma gasification performance.33 Increasing the ER can inhibit hydrogen generation to some extent,34 but the resulting oxidation exotherm can reduce the heat input needed for the plasma gasification process. The unit options 〈PG1〉, 〈PG2〉, 〈PG3〉, 〈PG4〉, and 〈PG5〉 represent plasma gasification with ER values of 0.1, 0.2, 0.3, 0.4, and 0.5, respectively. The ER range in this study is based on prior research.33 In the second step, the syngas can be upgraded via the water-gas shift (WGS) reaction (CO + H2O → H2 + CO2) to increase the H2 fraction, or the reverse water-gas shift (RWGS) reaction (H2 + CO2 → CO + H2O) to decrease the CO2 fraction. Option 〈SU1〉 employs the RWGS reaction using an Fe–Mo/Al2O3 catalyst.35 Options 〈SU2〉 and 〈SU3〉 represent the WGS conducted at a relatively low temperature with a CuO/ZnO/Al2O3 catalyst36 and at a high temperature with iron-based commercial catalysts.37 Option 〈SU4〉 includes two-stage WGS reactors with a cobalt-molybdenum (Co/Mo) catalyst, which has been reported to effectively increase the H2 fraction in syngas.24 The upgraded syngas is then cleaned to remove undesirable components (such as water and CO2) while retaining essential components (such as H2) needed for the subsequent step. The upgraded syngas undergoes cleaning to remove undesirable components, such as water and CO2, while preserving essential components like H2 required for subsequent processes. Given the significant amounts of water and CO2 in the syngas, additional separation steps are necessary to meet the requirements of the downstream units23,38 and to minimize unnecessary processing loads on downstream units. Depending on the pressure of the syngas from the preceding step, both atmospheric and high-pressure cleaning options are considered, represented as options 〈SC1〉 and 〈SC3〉. For producing energy like methanol, DME and FT fuel, external hydrogen supplementation may also be required as a feedstock to facilitate the synthesis reaction.18,39 Thus, options 〈SC2〉 and 〈SC4〉 introduce H2 on the basis of 〈SC1〉 and 〈SC3〉, preparing the syngas for use as the feedstock in DME, FT fuel and methanol synthesis.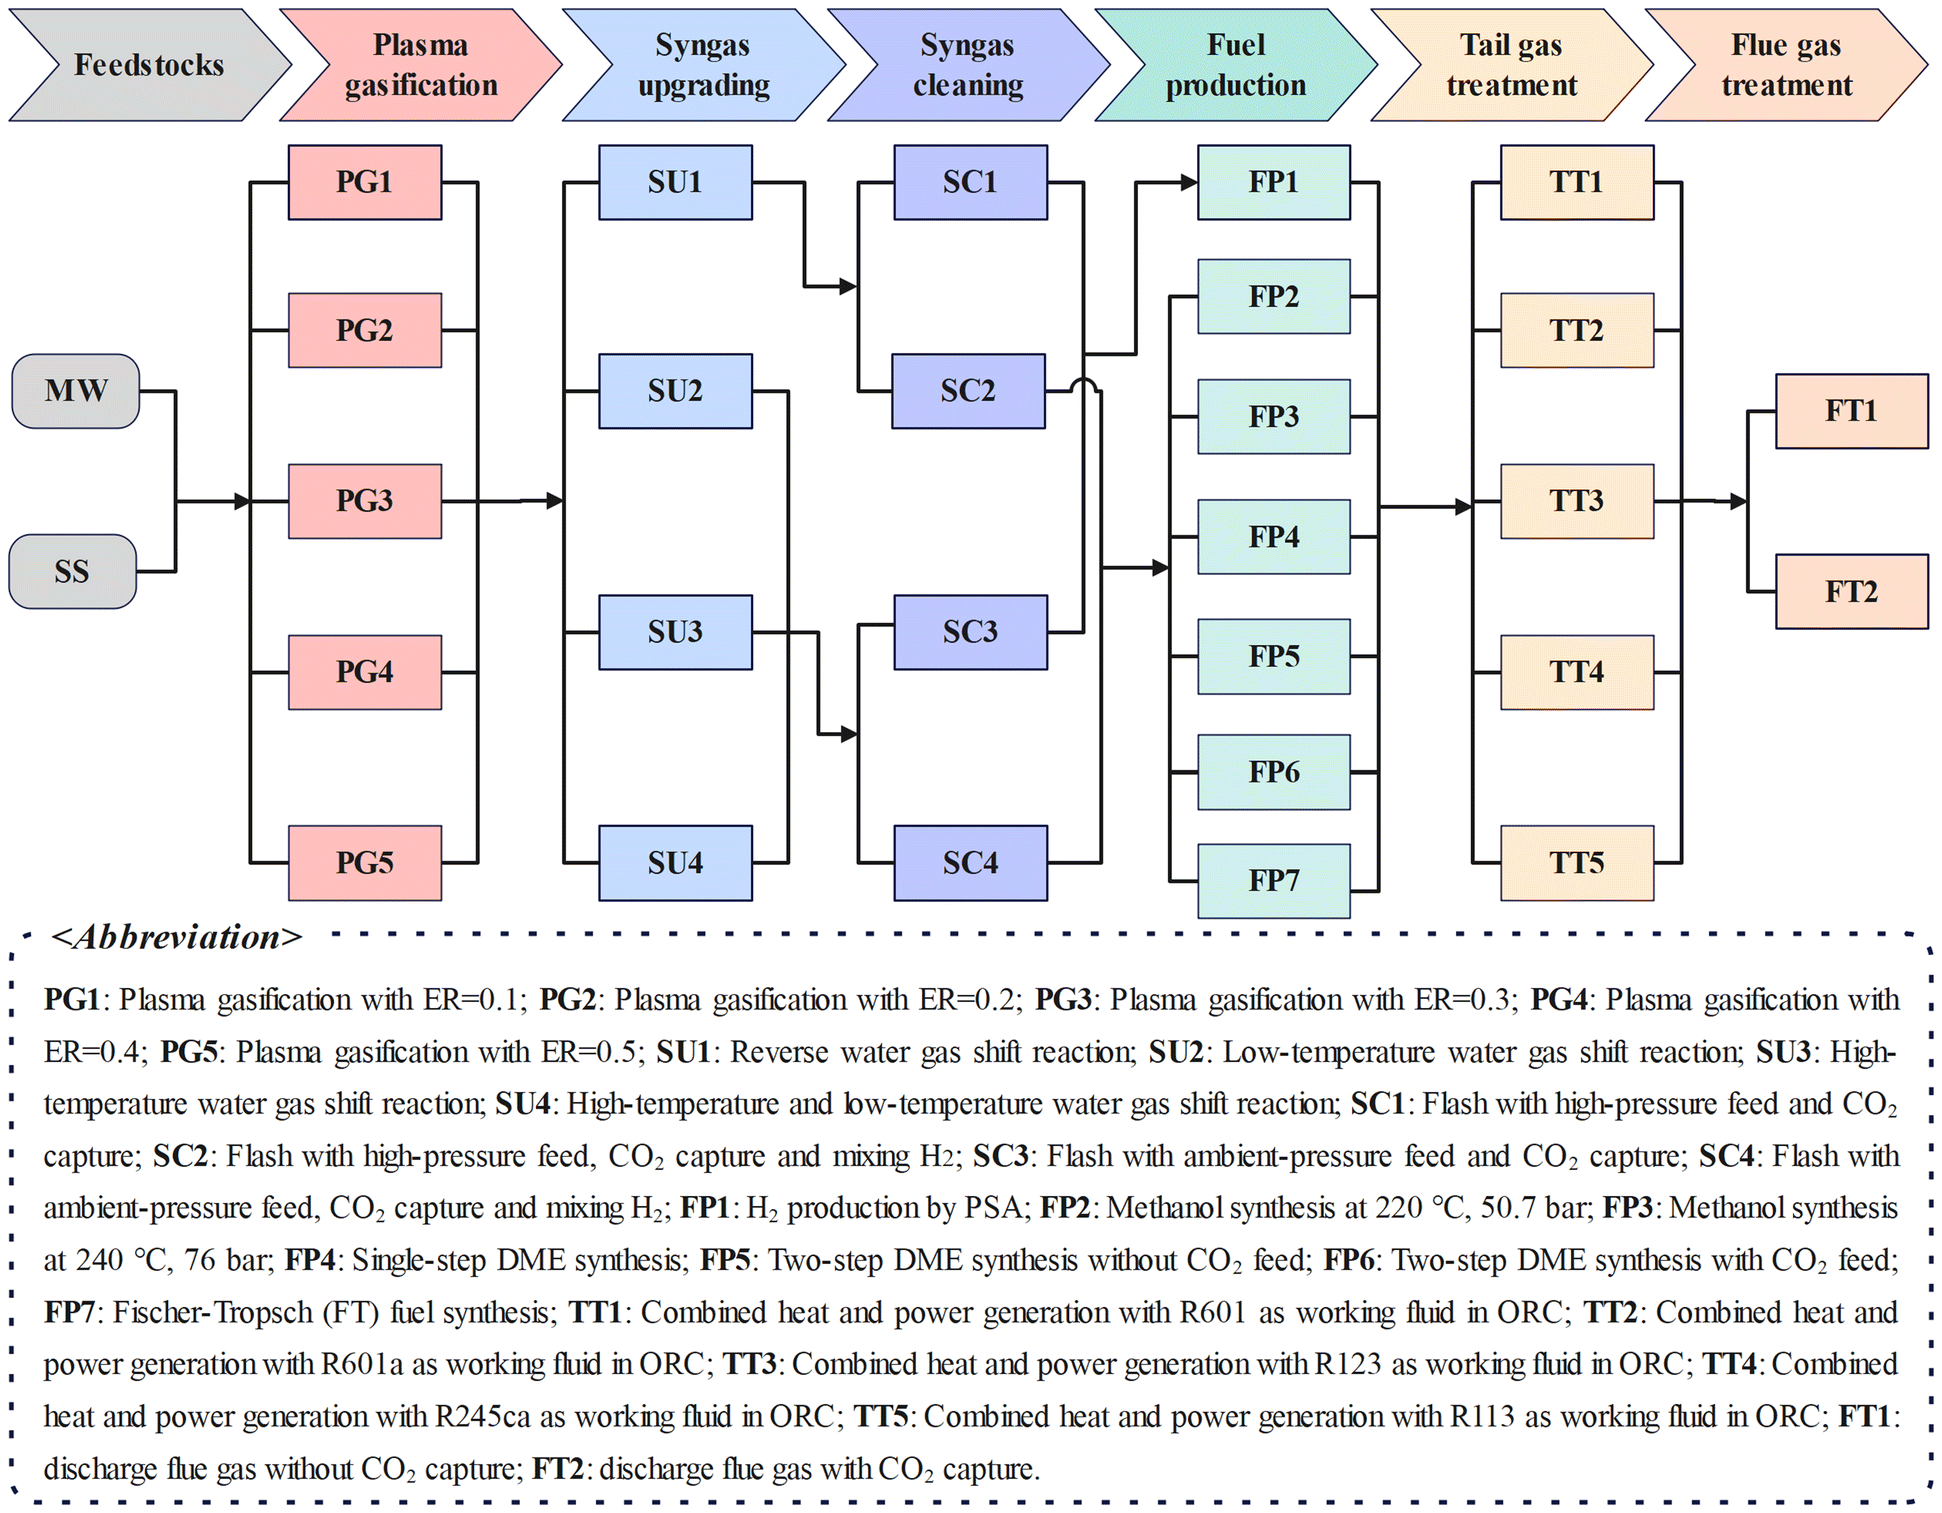 | ||
| Fig. 1 Superstructure of converting MW and SS into energy. | ||
In the energy production stage, four types of energy outputs are considered: hydrogen, methanol, DME and FT fuel. These energy products have been extensively studied in WtE research.40 While power generation through syngas combustion is technically possible, it is excluded as a primary energy product in the superstructure. This decision is based on the fact that waste gasification for power generation has been shown to be both energetically and economically less favourable when compared to hydrogen production.41 Furthermore, direct incineration of waste, although a current method for waste treatment, presents significant environmental concerns, including the high emission of hazardous substances. Instead, the superstructure is focused on the conversion of waste into energy products with large-scale, long-term storage capabilities42,43 and they are more suitable for integration into flexible energy systems and contribute to a sustainable energy transition. Option 〈FP1〉 involves the separation of hydrogen from the syngas using pressure swing adsorption (PSA) technology. Options 〈FP2〉 and 〈FP3〉 are methanol synthesis technologies, with 〈FP2〉 and 〈FP3〉 representing two optimal reactor configurations reported for methanol synthesis using Cu/ZnO catalysts44 and Cu/ZnO/Al2O3 catalysts,45 respectively. DME synthesis is addressed by options 〈FP4〉, 〈FP5〉, and 〈FP6〉, each representing conditions previously identified as favourable for DME production. Option 〈FP4〉 is the single-step DME synthesis technology,46 while 〈FP5〉 and 〈FP6〉 represent two-step synthesis processes, with CO2 in the feedstock for option 〈FP5〉 and without CO2 in the feedstock for option 〈FP6〉.47 Furthermore, FT synthesis, one of the most widely adopted and technologically mature method for producing liquid fuels from syngas,48 is included in the superstructure as option 〈FP7〉. To enhance the overall energy conversion efficiency, the energy in the tail gas is recovered using a CHP generation unit, incorporating both combustion gas turbine and ORC for power generation. For the ORC working fluid, five organic compounds (R601, R601a, R123, R245ca, and R113) with high energy efficiencies are considered.49,50 Options 〈TT1〉 to 〈TT5〉 represent the tail gas treatment units employing ORC with these working fluids. After tail gas treatment, the flue gases still contain a significant amount of CO2. Options 〈FT1〉 and 〈FT2〉 present two flue gas treatment methods: direct emission and recycling to CO2 absorption unit using MEA (in step 3) followed by direct emission. The model development for main operation units is detailed in S1 (see the ESI†) while the key operating parameters for different units are summarized in Table S4 (see the ESI†). Rigorous models for each unit are then developed in the Aspen Plus simulator based on kinetic and thermodynamic equilibrium.51
3 Problem statement
The goal is to identify the optimal pathway for converting SS and MW into energy, with a focus on both economic and environmental performance, measured by net profit per unit time29 and total carbon emissions.18 The net profit per hour is selected as the objective function in this study for the following reasons. Firstly, it enables a streamlined evaluation by requiring surrogate models only for unit costs and product capacity. The final net profit is then derived through simple linear operations on the outputs of these surrogate models, which significantly enhances the computational efficiency of the superstructure optimization process. Secondly, by annualizing capital costs and incorporating the interest rate, this metric accounts for the temporal impact of both capital and operating costs, providing a robust evaluation within the optimization framework.52 In contrast, metrics like net present value (NPV) would necessitate the development of additional surrogate models (for operating costs, capital costs, and product capacity) and involve nonlinear operations, such as division, which would decrease optimization efficiency. Thirdly, the carbon tax is integrated into the profit calculation, directly linking environmental performance (carbon emissions) to economic outcomes. Higher emissions lead to increased tax liabilities, thus reducing the overall net profit. Lastly, this metric aligns with the time scale of operational decisions, offering immediate feedback, which makes it particularly suitable for optimization tasks.29 The key assumptions, parameters, and decision variables involved in this optimization problem are outlined as follows.Assumptions:
(1) The cost and emissions associated with waste collection and transportation are not included.
(2) Income tax is ignored in the calculation of profits.
(3) There is no loss of heat and material during transfer among units.
(4) The process operating conditions are not varied by the processing capacity of each unit.
(5) The relationships between inputs and outputs of each unit are represented by surrogate models.
Parameters:
(1) The prices of utility including steam, cooling water and electricity and consumable materials including hydrogen, processed water, MEA and catalyst.
(2) The emission factors of utility including steam, cooling water and electricity and consumable materials including hydrogen, processed water, MEA and catalyst.
(3) The selling prices of hydrogen, methanol, DME and FT fuel.
(4) Cost for wastewater treatment.
(5) The base capital, capacity and scaling factor of each processing unit.
(6) The lifespan and annual operating time of the plant.
(7) Coefficients for calculating the equipment installation cost, indirect capital, land cost, working capital and operating cost.
(8) The processing capacities of SS and MW.
(9) The carbon tax.
(10) Parameters in surrogate models.
Variables:
(1) Binary variables for the selection of technologies at each step.
(2) The processing capacity of each unit.
(3) The hourly cost and hourly carbon emission of each unit.
(4) The capacities of products.
(5) Hourly profit (HP) and hourly emission (HE) of the whole superstructure.
4 Model formulation
In the optimization model, the HP of the superstructure is calculated by estimating hourly the selling income of products (HI), the hourly cost of the superstructure (HC) and carbon tax (CT), as shown in eqn (1) and (2) | (1) |
| HCu = (ACCu + OPEu)/awh | (2) |
ACCu is calculated by the total capital cost of the u-th unit (TCCu) with consideration of the interest rate (ir) and plant's lifespan (yr), as shown in eqn (3).52 ir and yr are assumed to be 8%52 and 20 years,53 respectively. Notably, these economic parameters, including annual working hours, ir, and yr, play a crucial role in the economic analysis, and were carefully selected. The 8% interest rate reflects the typical rates for long-term industrial projects in our context, while the 8000 annual working hours and 20-year plant lifespan are based on industry standards for similar WtE facilities, which have been widely adopted in previous studies.54,55
TCCu usually includes direct capital cost, indirect capital cost, working capital cost and land cost. The detailed calculation of total capital cost can refer to previous studies.56 OPEu includes variable operating costs (VOCu) and the fixed operating cost (FOCu) of the u-th unit, which is assumed to be 5.1% of the total capital cost,57 as indicated in eqn (4). The VOCu is calculated by the net input (negative value indicates unit output) of consumable materials (Fu,cm) and utilities (Fu,ut) of unit u and their prices (Pcm and Put), as shown in eqn (5).18 Similarly, the carbon emissions of unit u are estimated by Fu,cm and Fu,ut and their emission factors (efcm and efut) are based on the cradle-to-gate life cycle assessment, as shown in eqn (6).18 The prices and emission coefficient of consumable materials and utilities are listed in Table S5 (see the ESI†).
| ACCu = TCCu × (ir × (ir + 1)yr)/((ir + 1)yr − 1) | (3) |
| OPEu = VOCu + FOCu | (4) |
 | (5) |
 | (6) |
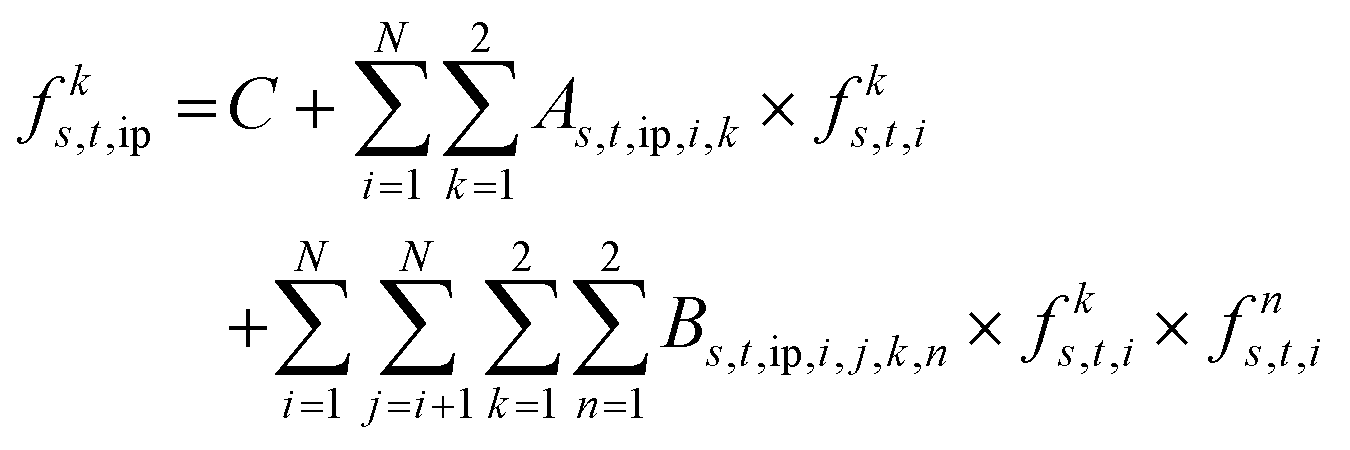
High-fidelity process simulations based on Aspen Plus allow for the calculation of HC and HE. However, due to the complexity of detailed process models, which can result in prohibitively high computational costs or even infeasible solutions during superstructure optimization, surrogate modeling strategies have been widely adopted in such optimization tasks.58,59 Among these techniques, HDMR is employed to capture input-output relationships of high-dimensional systems. HDMR is a mathematically proven and efficient method that reduces computational effort by shifting from exponential scaling to polynomial complexity.60 In this study, a truncated HDMR approach, as shown in eqn (7) is adopted. The parameters in the formulation can be obtained by regression using data from rigorous simulations. This technique is well-suited for capturing nonlinear systems in chemical process modelling61,62 and effectively models the relationships between outlet composition, cost, emissions, and inlet composition for each unit in the process.
 | (7) |
The surrogate-based superstructure optimization problem can be formulated as follows.
Objective function:
The profit is calculated based on the revenue, units’ cost as well as carbon tax by using eqn (8).
 | (8) |
Since the energy is produced in step 4 (fuel production step), PE4,t and FE4,t represent the price and flow rate of energy derived from technology t. Binary variable bs,t indicates the selection of technology t in step s. bs,t equals 1 if the technology t is selected and equals 0 if not. HCs,t and HEs,t are the hourly cost and hourly emission of technology t in step s.
Constraints:
In each step, only one unit can be selected and thus eqn (9) is incorporated. In addition, according to the superstructure constraints (as shown in Fig. 1), the technology selection for the syngas cleaning step (step 3) is affected by the technology selection for the syngas upgrading step (step 2), which in turn affects the technology selection for the fuel production step (step 4), as constrained by eqn (10) and (11).
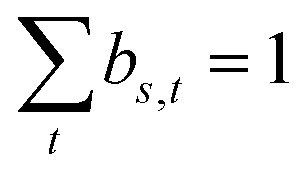 | (9) |
| b2,1 = b3,1 + b3,2 | (10) |
| b3,1 + b3,3 = b4,1 | (11) |
Since in the fuel production step, technology 2 and technology 3 are employed to produce methanol while technology 4, 5 and 6 are for DME production, thus:
| b4,2 = b4,3 | (12) |
| b4,4 = b4,5 = b4,6 | (13) |
With HDMR, the surrogate models for estimating each unit's HC, HE and output mass flow rate of each species can be predicted based on the mass flow rate of each species input to this unit. The mass flow rate of species i input to the technology t in step s is represented by fs,t,i and the number of species considered in the technology is represented by N. Thus, the flow rate of the produced fuel, the hourly cost, hour emission and the outlet mass flow rate of species ip which will be directed to the next step can be calculated by eqn (14)–(17), respectively.
 | (14) |
 | (15) |
 | (16) |
 | (17) |
The outlet mass flow rate of species ip in step s equals to the mass flow rate of species ip in step s + 1, as shown in eqn (18).
 | (18) |
Notably, in the calculation, all mass flow rates have been normalized by specifying the feasible ranges. A base case is designed for analysis and the used parameters are presented in Table S6 (see ESI†). The processing capacity is assumed to be 2000 kg h−1 (the available amount of MW is usually limited). With maximizing HP, a MINLP model can be developed and then solved using the ANTIGONE solver63 equipped in PC with an AMD Ryzen 9 6900HX with a Radeon Graphics processor and 16 GB RAM.
5 Results and discussion
In this study, superstructure optimization based on HDMR surrogates was performed to identify the optimal pathways for co-valorization of SS and MW. The reliability of the surrogate model was first validated, with the prediction of HC for methanol and DME synthesis units in the energy synthesis step serving as the test cases. The rationale behind the selection is: (1) The methanol and DME synthesis units are based on complex process (including reaction and separation units) models. (2) The HC estimation involves relatively complex calculations. Therefore, the accuracy of the HDMR surrogate models was confirmed through their performance in these complex scenarios. Fig. S9 and S10 (see the ESI†) show the results of HC predictions of two methanol synthesis technologies and three DME synthesis technologies based on the HDMR surrogate model, respectively. The R2 value exceeded 0.93 for methanol synthesis and approached 0.9 for DME synthesis, indicating that the surrogate model performs well even for complex tasks. Thus, it is reasonable to use the HDMR model as a global surrogate of detailed process models developed in Aspen Plus for optimization in this work, ensuring reliability. Despite the satisfactory performance of the HDMR surrogate, it should be noted that a global surrogate model can sometimes be coarse, which may impact the accuracy of the optimization results, especially for more complex systems. In those cases, a more refined surrogate approach could be beneficial for greater accuracy. By using surrogate models, the formulated MINLP problem was solved. Our results show that for such a superstructure optimization problem based on the HDMR surrogate model, the optimal solution can be determined within 250 seconds of CPU execution time. With the optimal pathway, further analysis can be performed.5.1 Optimal WtE strategies
Through superstructure optimization, the optimal pathway identified for the base case yields a maximum profit of $228.68 per hour, as illustrated in Fig. 2(a). It is important to note that the optimal results are based on the HDMR surrogate models and may not align perfectly with the detailed process model developed in Aspen Plus. To validate the results, we developed detailed flowsheets for the optimal pathway and ran simulations in Aspen. The results showed an acceptable relative error of 3.16% (228.68 $ per h vs. 221.45 $ per h). However, surrogate models may introduce biases, leading to instances where the initial solution does not converge in simulation. In such cases, fine-tuning of the Aspen model may be required to resolve these issues, as discussed in our previous work.64 The superstructure optimization results indicate that hydrogen production from waste is the most economically favourable option with the highest HP. The mixed waste is first converted into syngas in a plasma gasifier with a medium ER (0.2). The syngas is then upgraded via a high-temperature WGS reaction to increase the H2 content. Following the removal of water and CO2 capture using MEA, the H2 is separated as the final product. The remaining tail gas is combusted for heat and power generation, with R601 serving as the working fluid in the ORC for converting waste heat to electricity. Without accounting for a carbon tax, the flue gas from combustion is recommended for direct emission. | ||
| Fig. 2 Superstructure optimization results of the base case: (a) the optimal pathway; (b) the breakdown of hourly cost; and (c) the carbon emission of each unit. | ||
This pathway's cost and carbon emission performance are further analyzed. As shown in Fig. 2(b), the HC of the process is 1346.92 $ per h. The plasma gasification unit, due to its high energy consumption,18 is the largest cost contributor at around 36% of the total cost. This is followed by the fuel production unit, syngas cleaning unit, tail gas treatment unit, and syngas upgrading unit. The high cost of hydrogen separation (fuel production) is largely driven by the significant power required for compression, accounting for 24% of the total cost. Fig. 2(a) displays the energy demand of each operational unit. Since the WGS reaction is exothermic, the heat generated can be utilized to produce steam,24 which, along with the tail gas treatment for CHP, generates net energy that offsets some cost inputs, resulting in relatively lower costs for these units. Additionally, these net energy outputs result in negative carbon emissions for these units. As shown in Fig. 2(c), the plasma gasification and hydrogen separation units, due to their high energy consumption, are responsible for significant indirect emissions, leading to 1.53 t h−1 and 1.01 t h−1 CO2-eq emissions, respectively. The largest source of carbon emissions is the flue gas derived post-combustion in tail gas treatment, contributing 1.57 t h−1. Without the consideration of the carbon tax, the total carbon emissions of the selected process amount to 3.82 t h−1 (i.e., 1.91 kg CO2-eq per kg waste), with the aim of maximizing profit.
In addition to the economic and environmental assessments, the energetics of the optimal pathway was also investigated. The energy efficiency results are shown in Table S7.† The largest energy losses are observed in the plasma gasification and syngas cleaning units, with values of 7.37 MW and 6.95 MW, respectively. These losses can be attributed to the high energy demands of plasma excitation and the solvent regeneration required for amine-based CO2 capture. In terms of efficiency, the tail gas treatment unit has the lowest energy efficiency, at only 0.50, primarily due to the significant amount of energy wasted as low-grade heat in the power generation cycle.38 Overall, the energy efficiency of the system reaches 0.40, indicating satisfactory technical performance for the optimal pathway.
5.2 Sensitivity analysis of the MW to SS ratio
Superstructure optimization was performed by varying the blending ratios of the two wastes. Fig. 3 illustrates the performance of the optimal pathways at different MW feeding ratios. Our findings indicate that the waste-to-H2 pathway remains the most economical option regardless of the MW ratio. Notably, at a low MW feed ratio (0.2), a low ER (0.1) is more advantageous during plasma gasification and a combination of high-temperature and low-temperature WGS is selected to maximize H2 production. As the MW ratio increases, the optimal pathway aligns with that identified in the base case (with a MW ratio of 0.5), as shown in Fig. 2(a). The configuration of the primary waste conversion unit is influenced by the feedstock composition due to the distinct properties of SS and MW used in this study. During gasification, a high ER enhances oxidation and releases more heat, thereby reducing the required energy input, but it can also decrease hydrogen production.65 MW, with its higher hydrogen content compared to SS, favours a low ER (H2 fraction is the driving factor) when it constitutes a small proportion of the feedstock. In this case, it tends to minimize hydrogen oxidation during gasification and requires a two-stage WGS in the subsequent upgrading to maximize H2 production. | ||
| Fig. 3 Economic performance of the optimal processes with different ratios of MW in the feedstock. | ||
The optimization results also suggest that a higher MW ratio significantly enhances the economic viability of the process. As shown by the bar in Fig. 3, HP increases despite a concurrent rise in HC, and the profit-to-cost (PTC) ratio continues to improve, reaching 0.21 when MW constitutes 80% of the feed. This economic advantage of MW can be attributed to its high volatile matter, high hydrocarbon content, and high calorific value, making it an effective “fuel”. However, it is important to note that the higher carbon content in MW also leads to an increase in carbon emissions during the conversion process, with CO2-eq emissions rising from 3.5 t h−1 to 4.2 t h−1, as indicated by the black line in Fig. 3. While variations in elemental composition could influence the final results, this aspect was not investigated in the presented case study. However, the proposed superstructure optimization framework, based on HDMR, provides a robust and flexible approach to address such variability in the feedstock. This optimization method can adapt to changes in the feedstock composition by identifying the corresponding optimal pathway according to the specific properties of the waste.
5.3 Sensitivity analysis of the energy price
Market conditions play a critical role in determining the optimal WtE pathway. Fig. 4 illustrates how energy prices influence the optimal pathway for converting MW and SS vividly. In the base case, with the prices of H2, methanol, DME and FT fuel as listed in Table S6,† the waste-to-H2 pathway (path-H2) is identified as the most economically viable option. Notably, the relatively high price of H2 reflects its classification as green hydrogen,66 which typically is more expensive.67 The sensitivity analysis reveals that as H2 prices increase, the economic favourability of the waste-to-H2 pathway remains unchanged, with profits rising significantly from approximately 230 $ per h to 320 $ per h, as shown by the green line. However, a 10% drop in H2 prices shifts the economic favourability to the one-step DME synthesis from syngas (path-DME). This shift occurs because the reduced price of hydrogen diminishes the profitability of the H2 production pathway, making DME production more advantageous. Besides, the results suggest that methanol synthesis is less favourable, leading to the exclusion of pathways that produce methanol as the final product (path-MeOH) or involve a two-step DME synthesis that includes methanol as an intermediate. When H2 prices drop by an additional 20%, profits stabilize, indicating that under the path-DME scenario, no extra hydrogen is needed, and thus, the price of hydrogen no longer impacts the economic viability of this pathway. For DME and methanol, a decline in their prices relative to the base case does not alter the optimal pathway, which remains optimal path-H2. However, as their prices increase, the benefits of producing these energy sources become more pronounced. Specifically, a 20% increase in DME and naphtha (one of the main components in FT fuel) prices makes path-DME and path-FT fuel the optimal choice, respectively, while methanol prices would need to rise by 30% for the methanol production pathway (path-MeOH) to become the most economically viable. These results underscore the sensitivity of product selection and pathway design to market conditions, particularly highlighting that a decrease in H2 prices and an increase in the price of other fuels are the key factors that could influence the stability of the optimal pathway identified in the base case. | ||
| Fig. 4 Optimal pathways under price variations of different energy products (turning points where the pathway selection changes due to price variations are highlighted by dotted circles). | ||
5.4 Comparative analysis
The performance of the selected WtE pathways are further evaluated through a comparative analysis. Fig. 5 demonstrates the impact of varying carbon tax levels on the optimal pathway identified by superstructure optimization. The results indicate that with the introduction of a carbon tax, the optimal pathway remains focused on H2 production. However, when dealing with flue gas, MEA-based carbon capture technology (FT2) becomes the preferred option to avoid significant carbon emission costs. The optimal pathway does not change as the carbon tax increases from 20 $ per t CO2-eq emissions to 60 $ per t CO2-eq emissions, maintaining the same minimum total carbon emissions of 2.70 t CO2-eq emissions, which is a 29.32% reduction compared to the scenario without a carbon tax (3.82 t CO2-eq emissions). Since the pathway remains unchanged, product sales revenue remains constant. However, as the carbon tax rises, the total cost increases linearly, leading to a gradual decline in HP, from 190.68 $ per h to 82.55 $ per h, a reduction of 56.71%. These findings illustrate the trade-off between economic performance and carbon emissions as a function of varying carbon tax levels. As the carbon tax increases, a more low-carbon process configuration is selected, which includes the incorporation of carbon capture for flue gases. However, while this transition reduces carbon emissions, it also impacts economic performance due to the additional cost of carbon capture. On the other hand, setting the carbon tax too high can significantly diminish profitability without achieving a proportional reduction in carbon emissions, as the optimal process configuration remains fixed (the pathway with the lowest carbon emission is determined). This highlights the critical role of setting an appropriate carbon tax that effectively balances both economic and environmental objectives in optimizingWtEy pathways. | ||
| Fig. 5 Economic performance of the optimal WtE processes under different carbon taxes. | ||
Through superstructure optimization, the co-valorization of SS and MW for H2 production demonstrated superior economic performance. Additionally, the environmental impact of this WtE process was compared to traditional methods. Based on the same quantities of MW and SS treated (landfilling and incineration) and the same capacity of H2 produced (equivalent to direct hydrogen purchase), Fig. 6 presents the carbon emissions associated with different modes that combine waste treatment and hydrogen production. The carbon emission data for MW and SS treatment were sourced from previous studies.68–70 When MW and SS are landfilled, the HE reaches 4.34 t h−1 CO2-eq emissions, with SS landfilling contributing nearly half of that total. The indirect carbon emissions from the purchased hydrogen are roughly equivalent to those from MW landfilling, both around 1.2 t h−1 CO2-eq emissions. Although incineration increases carbon emissions from MW treatment, it significantly reduces emissions from SS treatment, making incineration the method with a relatively smaller carbon footprint.
 | ||
| Fig. 6 Carbon emissions of different production modes for waste treatment and H2 production. | ||
In comparison, the WtE system that integrates waste treatment and energy production (as determined by superstructure optimization) could lead to 3.82 t h−1 of high carbon emissions because directly emitting flue gas is selected to achieve the maximum HP without considering the carbon tax. This is higher than the emissions from incineration-based waste treatment but still lower than those from landfill-based methods. However, if a carbon tax is applied, the optimal pathway would incorporate a CO2 capture unit to treat the flue gas, reducing hourly carbon emissions to 2.70 t h−1 (i.e., 1.35 kg CO2-eq per kg waste). This figure is lower than emissions from traditional treatment methods (4.34 t h−1 and 3.15 t h−1), highlighting the environmental potential of the identified sustainable WtE process via superstructure optimization.
6 Conclusions
In conclusion, this study successfully addresses the optimal design and synthesis of processes for converting MW and SS into energy. A comprehensive superstructure that integrates waste plasma gasification, CCU, and fuel production was proposed. To achieve superstructure optimization, high-fidelity process models for estimating the outlet composition, HP and HE of each operation unit were developed, which were subsequently surrogated using the HDMR technique. By formulating the optimization problem as a MINLP model, the optimal pathway targeting the maximum profit was determined efficiently within 200 s of CPU time. The results reveal that converting mixed waste into H2 is the most economically viable option, with an HP of 228.68 $ per h and an HE of 3.82 t CO2-eq per h. The analysis highlights key factors influencing the process, such as waste blending ratios, energy prices, and carbon taxes. Specifically:(1) Increasing the ratio of MW could improve economic outcomes but leads to higher carbon emissions.
(2) The optimal waste-to-H2 pathway remains robust against variations in energy prices, unless there are significant changes in the prices of DMF, methanol, or hydrogen.
(3) An appropriate carbon tax is crucial for optimizing process performance. It can drive the selection of a low-carbon pathway while an excessive carbon tax rate may lower economic returns without further reducing emissions.
(4) The processes identified through superstructural optimization demonstrate superior carbon emission performance compared to traditional waste treatment and energy production methods, with emissions of 2.70 t CO2-eq per h under the carbon tax scenario.
Overall, this study underscores the effectiveness of the HDMR model in superstructure optimization, enabling the identification of optimal sustainability-oriented pathways under various scenarios. The findings thus provide valuable insights for informed decision-making in the field of sustainable WtE conversion.
Author contributions
Jianzhao Zhou: conceptualization, data curation, visualization, methodology, model development, formal analysis, writing – original draft, and writing – review & editing. Jingzheng Ren: conceptualization, supervision, methodology, project administration, writing – review & editing, and funding acquisition. Chang He: validation, methodology, software, and writing – review & editing.Data availability
The data supporting this article have been included as part of the ESI.†Conflicts of interest
There are no conflicts to declare.Acknowledgements
The work described in this study received support from a grant from the Research Committee of The Hong Kong Polytechnic University under the student account code RKQ1. The authors would like to express their sincere thanks to the Research Institute for Advanced Manufacturing (RIAM) of The Hong Kong Polytechnic University (Project Code: 1-CDK2, Project ID: P0050827) for financial support. The work described in this paper was also supported by a grant from Research Grants Council of the Hong Kong Special Administrative Region, China-General Research Fund (Project ID: P0042030, Funding Body Ref. No: 15304222, Project No. B-Q97U), a grant from the Research Institute for Advanced Manufacturing (RIAM), The Hong Kong Polytechnic University (PolyU) (Project No. 1-CD4J, Project ID: P0041367), and a grant from the Environment and Conservation Fund (ECF) (Project ID: P0043333, Funding Body Ref. No: ECF 51/2022, Project No. K-ZB5Z).References
- J. Scheffran, M. Felkers and R. Froese, Green Energy to Sustainability: Strategies for Global Industries, 2020, pp. 1–44 Search PubMed.
- M. Roser , The world's energy problem – Our World in Data, https://ourworldindata.org/worlds-energy-problem, (accessed 22 August 2024).
- J. K. Kirkegaard, D. P. Rudolph, S. Nyborg, H. Solman, E. Gill, T. Cronin and M. Hallisey, Nat. Energy, 2023, 8(7), 655–664 CrossRef.
- Y. Lei, Z. Wang, D. Wang, X. Zhang, H. Che, X. Yue, C. Tian, J. Zhong, L. Guo, L. Li, H. Zhou, L. Liu and Y. Xu, Nat. Clim. Change, 2023, 13(7), 693–700 CrossRef.
- IEA , World Energy Outlook 2022 – Analysis – IEA, https://www.iea.org/reports/world-energy-outlook-2022, (accessed 22 August 2024).
- I. Dincer and C. Acar, Appl. Energy, 2017, 194, 225–235 CrossRef.
- UNEP, Global Waste Management Outlook 2024, UNEP – UN Environment Programme, 2024 Search PubMed.
- J. Ma and F. You, J. Cleaner Prod., 2019, 228, 1111–1121 CrossRef.
- L. Nazari, C. (Charles) Xu and M. B. Ray, Advanced Technologies (Biological and Thermochemical) for Waste-to-Energy Conversion, in Advanced and Emerging Technologies for Resource Recovery from Wastes. Green Chemistry and Sustainable Technology, Springer, Singapore, 2021, pp. 55–95, DOI:10.1007/978-981-15-9267-6_3.
- Y. T. Chu, J. Zhou, J. Ren, W. Shen and C. He, J. Hazard. Mater., 2023, 455, 131551 CrossRef CAS PubMed.
- P. C. Kuo, B. Illathukandy, W. Wu and J. S. Chang, Bioresour. Technol., 2020, 314, 123740 CrossRef CAS PubMed.
- H. Amirahmadi, H. FarshiFasih, S. Saviz and M. H. Nobakhti, Waste Manage., 2024, 186, 198–204 CrossRef CAS PubMed.
- L. Rong, T. Maneerung, J. C. Ng, K. G. Neoh, B. H. Bay, Y. W. Tong, Y. Dai and C. H. Wang, Waste Manage., 2015, 36, 241–255 CrossRef CAS PubMed.
- C. Yang, S. Wang, J. Yang, D. Xu, Y. Li, J. Li and Y. Zhang, Green Chem., 2020, 22, 8210–8232 RSC.
- M. Buffi, M. Prussi and N. Scarlat, Biomass Bioenergy, 2022, 165, 106556 CrossRef CAS.
- J. Zhou, T. Shi, Q. Qian, C. He and J. Ren, STAR Protoc., 2023, 4, 102685 CrossRef CAS.
- L. A. Litheko and B. Patel, Comput. – Aided Chem. Eng., 2021, 50, 1641–1646 CAS.
- J. Zhou, Y. Ayub, T. Shi, J. Ren and C. He, Energy, 2024, 288, 129803 CrossRef CAS.
- P. McKendry, Bioresour. Technol., 2002, 83, 37–46 CrossRef CAS.
- A. Demirbaş, Fuel, 1997, 76, 431–434 CrossRef.
- V. I. Sharypov, N. G. Beregovtsova, B. N. Kuznetsov, V. L. Cebolla, S. Collura, G. Finqueneisel, T. Zimny and J. V. Weber, J. Anal. Appl. Pyrolysis, 2007, 78, 257–264 CrossRef CAS.
- C. Chu, P. Wang, A. Boré, W. Ma, G. Chen and P. Wang, Energy, 2023, 262, 125385 CrossRef CAS.
- A. AlNouss, M. Alherbawi, G. McKay and T. Al-Ansari, J. Cleaner Prod., 2023, 414, 137667 CrossRef CAS.
- J. Li, H. Wang, H. Chen, H. Wu, G. Xu, Y. Dong, Q. Zhao and T. Liu, Appl. Therm. Eng., 2023, 221, 119762 CrossRef CAS.
- R. Smith, Chemical process: design and integration[M], John Wiley & Sons, 2005 Search PubMed.
- C. Galanopoulos, P. Kenkel and E. Zondervan, Comput. Chem. Eng., 2019, 130, 106530 CrossRef CAS.
- A. Y. Goren, I. Dincer, S. B. Gogoi, P. Boral and D. Patel, Int. J. Hydrogen Energy, 2024, 79, 551–578 CrossRef CAS.
- S. Di Fraia, N. Massarotti, M. R. Uddin and L. Vanoli, Smart Energy, 2022, 5, 100061 CrossRef CAS.
- J. Zhou, J. Ren and C. He, Process Saf. Environ. Prot., 2023, 178, 342–359 CrossRef CAS.
- A. Carotenuto, S. Di Fraia, N. Massarotti, S. Sobek, M. R. Uddin, L. Vanoli and S. Werle, Energy, 2023, 263, 125838 CrossRef CAS.
- Q. Xie, P. Peng, S. Liu, M. Min, Y. Cheng, Y. Wan, Y. Li, X. Lin, Y. Liu, P. Chen and R. Ruan, Bioresour. Technol., 2014, 172, 162–168 CrossRef CAS.
- A. Brillard, D. Kehrli, O. Douguet, K. Gautier, V. Tschamber, M. A. Bueno and J. F. Brilhac, Fuel, 2021, 306, 121644 CrossRef CAS.
- D. K. Singh and J. V. Tirkey, Environ. Technol., 2022, 43, 4291–4305 CrossRef CAS PubMed.
- P. N. Sheth and B. V. Babu, Int. J. Hydrogen Energy, 2010, 35, 10803–10810 CrossRef CAS.
- F. Ghodoosi, M. R. Khosravi-Nikou and A. Shariati, Chem. Eng. Technol., 2017, 40, 598–607 CrossRef CAS.
- D. Mendes, V. Chibante, A. Mendes and L. M. Madeira, Ind. Eng. Chem. Res., 2010, 49, 11269–11279 CrossRef CAS.
- S. S. Hla, D. Park, G. J. Duffy, J. H. Edwards, D. G. Roberts, A. Ilyushechkin, L. D. Morpeth and T. Nguyen, Chem. Eng. J., 2009, 146, 148–154 CrossRef CAS.
- J. Zhou, C. Liu, J. Ren and C. He, Energy, 2024, 310, 133272 CrossRef CAS.
- B. Cañete, C. E. Gigola and N. B. Brignole, Ind. Eng. Chem. Res., 2014, 53, 7103–7112 CrossRef.
- G. L. M. A. Van Rens, G. H. Huisman, H. De Lathouder and R. L. Cornelissen, Biomass Bioenergy, 2011, 35, S145–S154 CrossRef CAS.
- K. Ma, T. Shi, Y. Hu, S. Yang, W. Shen, C. He, Y. Liu, Z. Liu and J. Ren, Energy Convers. Manage., 2022, 269, 116135 CrossRef CAS.
- A. Risco-Bravo, C. Varela, J. Bartels and E. Zondervan, Renewable Sustainable Energy Rev., 2024, 189, 113930 CrossRef CAS.
- M. Qi, D. N. Vo, H. Yu, C. M. Shu, C. Cui, Y. Liu, J. Park and I. Moon, Renewable Sustainable Energy Rev., 2023, 179, 113282 CrossRef.
- M. Puig-Gamero, J. Argudo-Santamaria, J. L. Valverde, P. Sánchez and L. Sanchez-Silva, Energy Convers. Manage., 2018, 177, 416–427 CrossRef CAS.
- Y. Su, L. Lü, W. Shen and S. Wei, Front. Chem. Sci. Eng., 2020, 14, 614–628 CrossRef CAS.
- A. T. Aguayo, J. Ereña, D. Mier, J. M. Arandes, M. Olazar and J. Bilbao, Ind. Eng. Chem. Res., 2007, 46, 5522–5530 CrossRef CAS.
- W. H. Chen, C. L. Hsu and X. D. Wang, Energy, 2016, 109, 326–340 CrossRef CAS.
- M. M. B. Noureldin, B. Bao, N. O. Elbashir and M. M. El-Halwagi, Clean Technol. Environ. Policy, 2014, 16, 37–44 CrossRef.
- K. A. Barse and M. D. Mann, Appl. Therm. Eng., 2016, 100, 11–19 CrossRef CAS.
- C. Wang, Y. Zhuang, L. Zhang, L. Liu and J. Du, Chem. Eng. Trans., 2022, 81, 655–660 Search PubMed.
- K. I. M. Al-Malah, A Aspen plus: chemical engineering applications[M], John Wiley & Sons, 2022 Search PubMed.
- T. N. Do, C. You, H. Chung and J. Kim, Comput. Chem. Eng., 2023, 170, 108136 CrossRef CAS.
- S. Michailos, S. McCord, V. Sick, G. Stokes and P. Styring, Energy Convers. Manage., 2019, 184, 262–276 CrossRef CAS.
- J. L. Padilha and A. L. A. Mesquita, Energy Convers. Manage., 2022, 265, 115743 CrossRef.
- S. C. Wijayasekera, K. Hewage, P. Hettiaratchi, O. Siddiqui, F. Razi, D. Pokhrel and R. Sadiq, Energy Convers. Manage., 2022, 270, 116218 CrossRef CAS.
- X. Zhao and F. You, Appl. Energy, 2021, 283, 116129 CrossRef CAS PubMed.
- T. N. Do, C. You and J. Kim, Energy Environ. Sci., 2022, 15, 169–184 RSC.
- K. S. Won and T. Ray, Eng. Optim., 2005, 37, 685–703 CrossRef.
- T. Shao, S. Krishnamurty and G. C. Wilmes, AIAA J., 2007, 45(11), 2688–2701 CrossRef.
- H. Rabitz and Ö. F. Aliş, J. Math. Chem., 1999, 25, 197–233 CrossRef CAS.
- Y. Ayub, J. Zhou, J. Ren, T. Shi, W. Shen and C. He, Int. J. Energy Res., 2023, 2023, 7787947 CrossRef.
- Q. Xie, H. Liu, D. Bo, C. He and M. Pan, Comput. – Aided Chem. Eng., 2018, 44, 835–840 CAS.
- R. Misener and C. A. Floudas, J. Glob. Optim., 2014, 59, 503–526 CrossRef.
- J. Zhou, Y. T. Chu, J. Ren, W. Shen and C. He, Energy, 2023, 281, 128218 CrossRef CAS.
- M. Z. Siddiqui, M. Sheraz, U. A. Toor, A. Anus, A. Mahmood, M. Haseeb, M. Ibrahim, K. S. Khoo, V. V. Devadas, M. Mubashir, S. Ullah and P. L. Show, Environ. Dev. Sustain., 2022, 2022, 1–29 Search PubMed.
- R. Rauch, Y. Kiros, K. Engvall, E. Kantarelis, P. Brito, C. Nobre, S. M. Santos and P. A. Graefe, Hydrogen, 2024, 5, 70–101 CrossRef CAS.
- T. Shi, J. Zhou, J. Ren, Y. Ayub, H. Yu, W. Shen, Q. Li and A. Yang, Energy, 2023, 272, 127131 CrossRef CAS.
- H. Kumar, A. Azad, A. Gupta, J. Sharma, H. Bherwani, N. K. Labhsetwar and R. Kumar, Environ. Dev. Sustain., 2021, 23, 9418–9432 CrossRef PubMed.
- B. Liu, Q. Wei, B. Zhang and J. Bi, Sci. Total Environ., 2013, 447, 361–369 CrossRef CAS PubMed.
- H. Liu, Y. Wang, X. Liu, D. Gao, G. Zheng, M. Lei, G. Guo, H. Zheng and X. Kong, J. Air Waste Manage. Assoc., 2017, 67, 212–218 CrossRef CAS PubMed.
Footnote |
| † Electronic supplementary information (ESI) available. See DOI: https://doi.org/10.1039/d4gc04628e |
| This journal is © The Royal Society of Chemistry 2025 |