
 Open Access Article
 This Open Access Article is licensed under a Creative Commons Attribution-Non Commercial 3.0 Unported Licence
Multi-omic analysis and platelet function distinguish treatment responses to hydroxytyrosol in cardiovascular risk†
Clara
Noguera-Navarro
a,
Kasper T.
Vinten
bc,
David
Auñón-Calles
d,
Carmen
Carazo-Díaz
e,
Georges E.
Janssens
bc and
Silvia
Montoro-García
 *a
*a
aPreclinical Research of Bioactive Compounds and Drugs (PREBIOF), Izpisúa Lab HiTech, Faculty of Health Sciences, Universidad Católica de Murcia (UCAM), Campus los Jerónimos, 30107 Murcia, Spain. E-mail: smontoro@ucam.edu; Fax: +968278715; Tel: +34 968278603
bLaboratory Genetic Metabolic Diseases, Amsterdam UMC location, University of Amsterdam, Amsterdam, The Netherlands
cAmsterdam Gastroenterology, Endocrinology, and Metabolism, University of Amsterdam, The Netherlands
dMolecular Recognition and Encapsulation Research Group (REM), Health Sciences Department, Universidad Católica de Murcia (UCAM), Campus los Jerónimos, 30107 Murcia, Spain
eCátedra de Estadística “Big data”, Universidad Católica de Murcia (UCAM), Campus los Jerónimos, 30107 Murcia, Spain
First published on 25th June 2025
Abstract
Many phenolic compounds, such as hydroxytyrosol (HT), have been recognized for their antioxidant and cardiovascular (CV) health benefits. To address the efficacy of HT, the present study aimed to identify the relevant mechanisms associated with high-CV risk. Plasma unbiased multi-omics data were compared among two subgroups of high-CV risk patients -HT responders and non-responders. The suppression of platelet reactivity and agonist-induced platelet activation observed after HT intervention were measured by CD61/CD62P expression and apoptotic microparticles with flow cytometry. Microbiota analysis revealed that HT treatment significantly increased and decreased the abundance of Ruminiclostridium sp. and Desulfovidrio sp., respectively. Lipid metabolism and proteomic responses were heterogeneous within the two distinct subgroups, associated mainly with thrombotic and hemostatic signals. The metabolomic analysis further confirmed the differentially expressed metabolites within these two subgroups, highlighting improved glutathione metabolism after HT treatment. The omics datasets integration offers a more comprehensive representation of the glutathione and coagulation pathways affected by the HT treatment. Even though the translation of multi-omics technologies into the clinical landscape is slow, the current interventional study provides an overview of their utility in developing novel therapeutic opportunities to prevent CV diseases, such as suppression of platelet reactivity. Registration number of Clinical Trial: NCT06319417.
Introduction
Cardiovascular (CV) diseases (CVD) are the leading cause of death worldwide.1 The relationship between food intake and CV health has gained tremendous relevance,2 with platelets playing a pivotal role in CVD progression. Dietary platelet-based therapeutic innovations have shown the potential to counteract excessive platelet activation,3 which is implicated in thrombus formation, stroke, and coronary syndromes.4 The European Commissiońs policy prioritizes health promotion and prevention of chronic conditions,5 encouraging the consumption of non-pharmaceutical compounds with health benefits beyond basic nutrition.In particular, phenolic compounds derived from plant-based foods are promising owing to their potential role in preventing cardiometabolic diseases.6,7 Hydroxytyrosol (HT) is a polyhydroxy phenol sourced in free, secoiridoid, or conjugated forms8 from extra virgin olive oil (EVOO) with proven anti-inflammatory, anti-proliferative, and antimicrobial properties.9,10 Its ability to scavenge reactive oxygen species (ROS) confers its potential antioxidant activity.8,11 Nonetheless, the catechol group is also responsible for the relative sensitivity of HT to oxidation and formulation challenges during food storage or processing,10 which is why few human clinical studies have elucidated the beneficial effects of HT alone. Animal and human studies typically administer extracts or a mixture of bioactive compounds but limit the direct association of HT with positive outcomes and molecular pathways.8 Recently, attention has been focused on establishing carrier systems that can improve the physicochemical properties of HT guest molecules.12,13 Among them, β-cyclodextrins (β-CDs) have been highlighted by the European Food Safety Authority (EFSA) as healthy food additives (E-459).14 The encapsulation improves the stability and effectiveness of HT formulations in vivo,15–18 representing a very attractive approach for innovation in the biomedical field.17
Several traditional plasma CV biomarkers have been used to demonstrate the health benefits of polyphenols in humans.19,20 However, data on HT alone are scarce.21 Furthermore, a comprehensive strategy using multi-omics technologies is required to investigate how its oral supplementation modulates complex biological mechanisms.22,23 Hence, applying proteomics and metabolomics approaches together with diagnostic biomarkers in biomedical cohorts could potentially reveal patient-specific responses to treatment,24–27 thus stratifying populations with a better outcome for a wide range of nutraceuticals.28,29 The translation of multi-omics technologies into tools accessible in daily medical routines is slow. Nonetheless, these studies could lay the foundation for precision nutrition, allowing us to determine the effectiveness of nutraceuticals and other drugs, enhancing clinical outcomes.
This study investigates (i) the functional changes in ex vivo platelet activation, (ii) the proteome, (iii) the metabolome, and (iv) the microbiome that accompany clinical benefits in patients at high CV risk after oral HT treatment. It combines classical biomarkers, mass spectrometry (MS), 16S ribosomal RNA amplicon gene sequencing, and flow cytometry. Consequently, this work aims to demonstrate that this integrative strategy could target the therapeutic response following dietary or drug interventions, identifying dynamic pathways (proteins and metabolites) and sensitive biomarkers in CV research.
Methods
Study design and participants
A 10 week, randomized, two-arm crossover, double-blind, controlled exploratory study was conducted between April 2022 and March 2023 at the Catholic University of Murcia (UCAM, Murcia, Spain). A total of twenty-six individuals identified as high CV-risk patients were enrolled from the Centro de Salud de San Andrés (Area 1, Murcia, Spain). Participants were included based on the following inclusion criteria: 20–65 years old, body mass index (BMI): 20.0–35.0 kg m−2, basal cholesterol (>200 mg dL−1), and/or basal glucose (>100 mg dL−1). Exclusion criteria encompassed smoking, diabetes mellitus, treated hypertension, history of CV events (stroke, myocardial infarction, thromboembolism, or peripheral vascular disease), cancer, and inflammatory diseases, and the use of specific medications such as antihypertensives, antiaggregants, anticoagulants, non-steroidal anti-inflammatory drugs, antidepressants, anticholinergic or antispasmodic agents, medications affecting intestinal motility, vasodilators, lipid-lowering therapies, and fish oil supplements were also excluded. The use of other dietary supplements was assessed individually.The study protocol was approved by the Ethics Committees of both Area 1 of the Servicio Murciano de Salud (2022-3-19-HCUVA) and UCAM (CE042213). Additionally, the trial was registered with Clinical Trials (ID: NCT06319417). All participants provided written informed consent in alignment with the Declaration of Helsinki and Spanish Biomedical Research Law.
Hydroxytyrosol encapsulation for caramel production
Hydroxytyrosol with a purity exceeding 99% was synthesised by Seprox Biotech, SL. (Murcia, Spain). Due to industrial confidentiality agreements, the detailed synthetic protocol for this compound cannot be disclosed. Encapsulation followed an established protocol with modifications for this study.30,31 Briefly, a solution containing HiCap-100 (0.066 g mL−1), maltodextrins (0.4 g mL−1), and β-CDs (E-459, 0.018 mg mL−1) was prepared in 500 mL of ultra-pure distilled water. The HT solution (0.605 g mL−1) was added into the primary mixture utilizing a rotor-stator homogenizer (Ultra-Turrax, IKA, Germany) at 500 rpm for 5 minutes. A Mini Spray Dryer B-290 (Buchi, Germany) was used for spray-drying with controlled feed flow rates (2.5 mL min−1) and air temperatures (inlet: 180 °C; outlet: 90 ± 2 °C).HT content and encapsulation efficiency (EE) were quantified using high-performance liquid chromatography (HPLC, Agilent 1200, Germany) with a diode array detector. A C18 Polaris column (150 × 4.6 mm, 5 mm) was maintained at 35 °C. The mobile phase consisted of 0.1% formic acid (A) and methanol (B), applied under a gradient elution program (0.0 min 10% B, 5.0 min 30% B, 17.5 min 100% B, 20 min 100% B, 30.0 min 10% B, 35 min 10% B).32 Before analysis, a calibration curve was constructed using a standard HT sample (Phyproof ® ≥ 90%; reference substance, Phytolab) through serial 1![[thin space (1/6-em)]](https://www.rsc.org/images/entities/char_2009.gif) :2 dilutions from a stock solution (25 mg in 100 mL of the initial solvent mixture). HT was identified at a retention time of 4.846 min and quantified using a calibration curve ranging from 250 to 7.8 mg L−1 (ESI Fig. S1†).
:2 dilutions from a stock solution (25 mg in 100 mL of the initial solvent mixture). HT was identified at a retention time of 4.846 min and quantified using a calibration curve ranging from 250 to 7.8 mg L−1 (ESI Fig. S1†).
Drying and encapsulation efficiencies (DE and EE, respectively) were calculated using established formulas:

After this procedure, 20.20% HT powder (batch no. HT SP 211200) was used to dose the caramels. The 20% HT exhibited specific technical characteristics: bulk density of 0.27 g cm−3, tapped density of 0.43 g cm−3, pH 6.25 (10% in water), compressibility index of 58.69%, and Hausner ratio of 1.59. Caramels were produced by B-organic (Hellín, Spain; https://borganic.es/) using xylitol (96.62 and 99.6%, in HT and placebo caramels, respectively) as the carrier, chosen for its low melting point and sweetening properties. Two sugar-free caramel variants (2.5 g each) were manufactured: one containing encapsulated HT (15 mg per caramel) and another serving as a placebo with empty β-CDs. Stability and HT incorporation were confirmed via HPLC batch analysis, with derivations below 9% of target concentrations.
Throughout the study period, caramel samples were examined by pulverizing four units (average mass 2.582 ± 0.061 g; RDS = 2.38%) into a fine powder using a Restch Grindomix GM 200 (Verder Scientifics GmbH&Co. KG) grinding mill for 15 s at 7000 rpm. From the resulting powder, one gram was taken to dissolve in 10 mL of a 10% methanol–water solution using a Multi Reax Vortexer (Heidolph Scientific Products GmbH) for 15 min at 2000 rpm. The dissolved samples were subsequently filtered through a 0.45 mm PTFE disc and diluted 1:10 with the same solvent mixture before undergoing HPLC analysis.
In vitro digestion protocol
The in vitro digestion of free HT and β-CD-HT was performed following the protocol described by Minekus et al.33 Briefly, simulated fluids were prepared to a final volume of 500 mL. The composition of each fluid was as follows: simulated salivary fluida (SSF) contained 15.1 mL de KCl (37.3 g L−1), 3.7 mL de KH2PO4 (68 g L−1), 6.8 mL de NaHCO3 (84 g L−1), 0.5 mL de MgCl2(H2O)6 (30.5 g L−1), 0.06 mL de (NH4)2CO3 (48 g L−1) and HCl (6 mol L−1) to adjust the pH to 7.0; simulated gastic fluid (SGF) contained 6.9 mL de KCl (37.3 g L−1), 0.9 mL de KH2PO4 (68 g L−1), 12.5 mL de NaHCO3 (84 g L−1), 11.8 mL de NaCl (117 g L−1), 0.4 mL de MgCl2(H2O)6 (30.5 g L−1), 0.5 mL de (NH4)2CO3 (48 g L−1) and HCl (6 mol L−1) to adjust the pH to 3.0; and simulated intestinal fluid (SIF) contained 6.8 mL de KCl (37.3 g L−1), 0.8 mL de KH2PO4 (68 g L−1), 85 mL de NaHCO3 (84 g L−1), 38.4 mL de NaCl (117 g L−1), 0.33 mL de MgCl2(H2O)6 (30.5 g L−1) and HCl (6 mol L−1) to adjust the pH to 7.0.The entire digestion process was carried out at 37 °C, and all samples were prepared in triplicate. The procedure was as follows: 5 mL control (water), 5 mL β-CD-HT (2 g L−1 of HT), 5 mL β-CD (0.018 mg mL−1), and 5 mL HT (2 g L−1) were added separately to a mixture containing 3.5 mL of SSF, 0.5 mL of saliva amilase (1500 U mL−1 SSF dissolved), 25 μL of CaCl2 (0.3 M) and 975 μL of distilled water. The final 10 mL mixture was incubated for 2 minutes; the 10 mL bolus was mixed with 7.5 mL of SGF, 1.6 mL of porcine pepsin (25000 U mL−1 SGF dissolved), 0.5 μL of CaCl2, 0.2 mL of HCl (1 M) and 695 μL of distilled water, reaching a final volume of 20 mL. This mixture was incubated at 37 °C for 2 hours. Finally, the resulting 20 mL gastric chyme was combined with 11 mL of SIF, 5 mL of a pancreatin solution (800 U mL−1 SFI based), 2.5 mL of fresh bile (160 mM), 40 μL of CaCl2 (0.3 M), 0.15 mL of NaOH (1 M) and 1.31 mL of distilled water.
At the end of each digestion phase, the samples were collected in triplicate. The samples were centrifuged at 4000g for 25 minutes at 4 °C. Then, samples were frozen at −80 °C for batch HT quantification by HPLC as described before.
Dietary intervention
Participants were randomly assigned into two groups, with comparable clinical profiles. The intervention group consumed β-CD-HT caramels for 28 days, whereas the placebo group consumed empty β-CDs caramels. A 2 week washout period was followed by a crossover to the alternate intervention for an additional 28 days. Initially, participants receiving the active treatment switched to the placebo, and vice versa.Four clinical visits were scheduled for each participant, occurring before and after both treatment phases. Blood and feces were collected and body composition was measured using Tanita BC-541 (Illinois, USA), at the four clinical visits in the morning. To monitor dietary habits during the study, participants completed a food frequency questionnaire based on the Mediterranean diet serving score (MDSS). During the intervention period, the patients consumed 60 mg of encapsulated HT daily and were distributed into four caramels throughout the day, apart from meals. The HT dose (60 mg day−1) was established due to the safety of the compound even at 500 mg kg−1 day−1 in mice.34 Similarly, during the placebo period, the patients received 0.5 g of empty β-CDs daily, distributed into four caramels throughout the day.
Biological samples collection
Fasting peripheral venous blood samples (serum, ethylenediaminetetraacetic acid [EDTA], and sodium citrate) were extracted by a qualified nurse at the four-time point visits. Fresh blood was analyzed for biochemical, flow cytometry, and metabolomic analyses, while centrifuged plasma (15 min at 2800g) was freeze-dried at −80 °C for proteomic and enzyme-linked immunosorbent assay (ELISA) assessments. Fecal samples were also collected from the patients in sterile duchesses and 15–80 g per sample (quantity and consistency variability), then they were frozen at −80 °C and preserved for microbiota analysis.Biochemical determinations, ELISA, and flow cytometry
Serum biochemical parameters such as lipid profile (total cholesterol, high-density lipoprotein cholesterol [HDL], low-density lipoprotein cholesterol [LDL], and triglycerides [TG]), glucose, creatinine, and insulin levels were kindly provided by the Laboratory for Clinical Analyses of the Hospital Universitario Virgen de la Arrixaca (Murcia, Spain). Homeostasis model assessment of insulin resistance (HOMA-IR) was also calculated. Cardiometabolic markers (leptin and adiponectin), high-sensitivity interleukin-6 (hs-IL-6), and oxidized LDL (oxLDL) were analyzed using ELISA from plasma EDTA samples. All measurements were performed using high-quality kits: hs-IL-6 antigen (1/2 dilution; Invitrogen, Cat. No. BMS213HS), oxLDL (1/100 dilution; ABclonal, Cat. No. RK09047) and adiponectin antigen (1/5000 dilution; ABclonal, Cat. No. RK00060), and leptin antigen (1/100 dilution; ABclonal, Cat. No. RK00035). The lower detection limits for hs-IL-6, oxLDL, adiponectin, and leptin were 2.5 pg mL−1, 0.12 ng mL−1, 30.2 pg mL−1 and 15.6 pg mL−1, respectively.Citrated blood (450 μL), freshly obtained, underwent incubation with 0.02 mmol L−1 adenosine diphosphate (ADP) for 2 min. The expression of membrane-constitutive CD42a (GP IX) and platelet activation and aggregation markers (P-selectin and CD61, respectively) on the cell surface was evaluated using previously described methods.35 Additionally, annexin V+ (AnV+) microparticles (MPs) were also examined using 0.5 and 1 μm gating beads.36 Following ADP incubation, 5 μL of blood was stained with 0.05 μg anti-CD42a-BV395 (clone HIP1), anti-CD62P-BV786 (clone AC1.2), CD61-FITC (clone VI-PL2) (which recognizes the activated conformation of GPIIβ/IIIα), and AnV-PE (all from BD Biosciences, Oxford, UK) for 15 min in AnV 5× buffer. The sample was then diluted with 1 mL AnV 1× buffer and analyzed using a FACS Celesta flow cytometer (Becton Dickinson, Oxford, UK). Each sample was run in duplicate, with twenty thousand platelets counted per run.
Microbiota analysis
Fecal samples underwent total genomic DNA extraction using a modified repeated bead-beating technique, based on a protocol previously outlined by the University of Amsterdam (The Netherlands).37 The process involved double extraction in S.T.A.R. lysis buffer (Roche, Switzerland), followed by centrifugation. The obtained supernatants were pooled and subsequently purified using the Maxwell RSC Blood DNA kit (Promega, Madison, USA).37 Following this, 16S genes were amplified using a modified one-step PCR method, with the amplification products verified by agarose gel electrophoresis, as detailed in previous studies.38,39 The final steps included purification and equimolar pooling of samples before sequencing, which was performed using Illumina Miseq (V3, 600) technology (Illumina, Inc., San Diego, USA).38,39A vsearch (v2.15.2) pipeline was employed to process amplicon sequences.40 Merging of paired-end reads was performed, allowing for a maximum of 100 differences and accommodating staggered overlap. ASVs were identified from reads with an error rate lower than 1.5 using the cluster_unoise with centroids algorithm, requiring a minimum size of four. Subsequently, chimeras were eliminated using the uchime3 de novo method. ASV abundance in each sample was determined by mapping merged reads against ASV sequences using usearch_global with a 0.97 distance cut-off. Taxonomic assignment was conducted using R (4.2.0), and the dada241,42 assigned taxonomy functions, utilizing the Silva (v132)43 reference database. A phylogenetic tree was constructed using mafft (v7.310)44 and FastTree (2.1.11).45
The sample data underwent filtering based on size (greater or lower than the sample mean) and ASV count (fewer reads). Subsequently, samples with a read count significantly deviating from the mean (16380 reads) were excluded. ASV with less than four reads were eliminated, and only those present in at least 20% of the study samples were retained. This filtering process resulted in the removal of 1495 ASV due to low abundance, leaving 569 ASV for analysis. The results were then normalized using cumulative sum scaling (CSS).46 R v.3.6.2 and various R packages, including Phyloseq v.1.30.0., were employed for downstream analyses and graphical outputs. Phyloseq facilitated normalization, visualization of microbial taxonomic composition abundance, and estimation of alpha and beta diversity metrics. Statistical significance was established at P < 0.05. Bray–Curtis dissimilarity distance was applied for assessing beta divertisty, with PERMANOVA used to determine statistically significant differences between treatments and groups. Principal coordinate analysis (PCoA) was utilized for data representation. In addition to PERMANOVA, ANOSIM (analysis of group similarities, similar to PERMANOVA), and PERMDISP (analysis of the homogeneity of group dispersions) were also calculated across treatments.
Proteomic analysis
The Medical Oncology Laboratory Amsterdam UMC (The Netherlands) conducted proteomic analyses. A modified method based on published literature47 was used for high-pH fractionation of pooled peptides from plasma EDTA samples collected at the start and end of treatment. Fractionation tips were prepared by loading ReproSil-Pur C18-AQ beads (2 mg, 5 μm, Dr. Maisch, Germany) on two C18 membrane disks (3M Empore, Bracknell, UK) within a 200 μL pipette tip. The tips underwent conditioning with methanol and 60% acetonitrile in aqueous NH4FA (40 mM, pH 10), followed by NH4FA (40 mM, pH 10). Peptide pools, dissolved in NH4FA (40 mM, pH 10), were loaded onto the fractionated tips and eluted in 12 steps using elution buffers with increasing acetonitrile concentrations (2, 4, 6, 8, 10, 12.5, 15, 17.5, 20, 25, 30%, and 60%) in aq. NH4FA (40 mM, pH 10). Every sixth elution step was combined and concentrated to dryness, resulting in six fractions per pool.The peptides underwent solubilization in 0.1% FA and were loaded onto Evotips (Evosep, Denmark) following the manufactureŕs instructions. An Evosep One liquid chromatography system (Evosep, Denmark) was utilized to separate the peptides through nanoflow reversed-phase liquid chromatography using standardized gradients. The mobile phases consisted of 0.1% FA and a mixture of 0.1% FA/99.9% ACN. The analysis utilized a method designed for processing 30 samples per day (SPD), employing a C18 reverse-phase column (Bruker Daltonics) and connected to a silica emitter (Bruker Daltonics). Peptide analysis was performed on a TimsTOF HT instrument (Bruker Daltonics), with peptides introduced via nano-electrospray ion source (Captive spray source, Bruker Daltonics) operated at a spray voltage of 1400 V.
For the creation of the spectral library, peptides fractionated at high pH underwent analysis using TimsTOF HT, operating in DDA-PASEF mode. The system was configured with a 200 ms ramp time and acquired ten PASEF scans per topN acquisition cycle, yielding a 2.2s cycle time. The analysis targeted precursors within a mass range from 100–1700 m/z, an ion mobility range from 1.5–0.7 V s cm−2, and charge states from 0 (unassigned) to +5 Precursors that either achieved this target or reached full scheduling capacity were excluded from analysis for 0.4 min. Singly charged precursors underwent filtering based on their m/z ion mobility. A quadrupole isolation width of 2 Th was applied for precursors below 700 Da, while those above 700 Da were isolated with a 3 Th width. Ion mobility dimension was calibrated among the experiments using distinctly selected ions from the Agilent ESI LC/MS Tuning Mix.
The TimsTOF HT (Bruker Daltonics) instrument, operating in the DIA-PASEF mode, examined peptides in plasma specimens. The method encompassed an ion mobility range of 1.5 to 0.7 V s cm−2 and an m/z range of 300 to 1200, using 10 DIA-PASEF scans with dual isolation windows per scan, yielding a cycle time of 1.1 s. The py_diAID tool48 optimized DIA-PASEF windows for the specific sample type. Collision energy decreased from 59 eV at 1.6 V s cm−2 to 20 eV at 0.6 V s cm−2. The ion mobility dimension was calibrated among the experiments using three chosen ions from the Agilent ESI LC/MS Tuning Mix [m/z, 1/K0: (322.0481, 0)].
FragPipe v20.0 was employed to generate a spectral library from the DDA-PASEF data, utilizing the present DIA_SpecLib_Quant.49 A database was created by incorporating reverse entries and contaminants into the curated human proteome (Uniprot, March 2023, 42420 entries, including isoforms). The DDA-PASEF data was analyzed using MSFragger50,51 (version 3.8) with default parameters. During the validation phase, MSBooster (version 1.1.11) was applied equally at spectra and RT levels, followed by percolator52 and proteinProphet53 integrated within philosopher54 (version 5.0.0), for PSM validation and protein inference, respectively. The library was created using EasyPQP (version 0.1.37) and it was calibrated by RT (ciRTs based). The lowest fraction set to 0.01.7318 V s cm−2; 622.0289, 0.9848 V s cm−2; 922.0097, 1.1895 V s cm−2.
DIA data analysis was conducted using DIA-NN 1.8.1, employing a spectral library generated using FragPipe.55,56 Several parameters were adjusted from their default settings: charge state was limited from 2 to 4, precursor m/z range was determined by 300 to 1200, and both mass and MS1 accuracy were configured to 14 ppm. The “match between runs” feature was activated, while “Heuristic protein inference” was turned off. Library precursors underwent re-annotated using the reviewed human proteome (Uniprot, March 2023; 42420 entries, including isoforms). The output tables were filtered to ensure a maximum q-value of 1% at both precursor and global protein levels. The MaxLFQ algorithm, implemented in R package iq, was utilized for protein quantification.57
Metabolomic analysis
The Laboratory of Genetic Metabolic Diseases at Amsterdam UCM (The Netherlands) conducted targeted metabolomics analysis using a previously established method.58 Briefly, metabolic activity in a 10 μL blood sample was halted by introducing 500 μL of ice-cold methanol. Subsequently, a mixture of internal standards dissolved in 500 μL of milli-Q water was added according to the established method.58The samples underwent sonication for 10 min at 40 kHz, after which 1 mL chloroform was added and thoroughly mixed. Subsequently, the samples were centrifuged (14000g; 10 min; 4 °C), and the uppermost layer containing polar metabolites was extracted and transferred to new Eppendorf tubes. Samples were dried using a vacuum concentrator (90 °C), and then the pellets were resuspended in 100 μL of 3:2 (methanol:milli-Q water). Another round of centrifugation was performed at equal conditions, collecting the resulting supernatant in vials for MS analysis. A waters acquity ultra-HPLC system linked to a Bruker impact II™ ultra-high resolution Qq-time-of-flight mass spectrometer was employed for metabolite analysis. The 5 μL samples were maintained at 12 °C throughout the analysis and injected.
Merck Millipore SeQuant ZIC-cHILIC column (PEEK 100 × 2.1 mm, 3 μm particle size) was utilized for chromatographic division. The column temperature did not vary from 30 °C. The mobile phase components were (A) acetonitrile:water in a 1:9 ratio (v/v) and (B) acetonitrile:water in a 9:1 ratio (v/v), both containing 5 mmol L−1 ammonium acetate. The LC gradient (0.25 mL min−1 flow rate) proceeded as described in the previously published methodology [42]. Negative and positive ionization was used in MS data collection (50–1200 m/z covering). Bruker TASQ software version 2.1.22.3 was utilized for data analyses, with further normalization of the metabolites discovered.
Omics integration and statistical analysis
The mixOmics R package (version 6.24.0) employs the DIABLO (data integration analysis for biomarker discovery using latent orthogonal components) approach for performing multivariate analysis (stacked partial least-squares discriminant analysis (SPLSDA)) in biological datasets.60 Microbiome and flow cytometry parameters were excluded because of sample dataset limitations. Firstly, an initial model was created with two components, with the most discriminative features for each omics dataset (ten variables in each component for proteome and metabolome, and three variables for each component for biomarkers).Continuous parameters are presented as mean ± standard deviation and confidence interval [CI 95%]. The normality of the distribution of continuous variables was determined using the Kolmogorov–Smirnov test.59 The present analyses focused on estimating the effects of HT and the interventional period (crossover design) on outcome variables (glucose, total cholesterol, TG, LDL, HDL, oxLDL, leptin, adiponectin, and hs-IL6). The level of statistical significance was set at P < 0.05. To this end, differences were evaluated using a random linear regression model to control for individual variations, utilizing R v4.1.3 software and the lme4 package. For family, genus, and species, statistical significance was determined based on a P-value < 0.05, and a >±1 fold change (log2 gold change) value.
Results
Hydroxytyrosol encapsulation protects stability during caramelization
To produce caramels with a high content of pure HT, and protect the integrity of the phenolic compound from the mid-high temperatures reached during the crystallization of xylitol, HT was encapsulated in a mixture of β-CDs and maltodextrins to a fine powder by spray drying from a concentrated solution of the main components (ESI Fig. S1†). The process was adapted and satisfactorily optimized (DE = 73.4 ± 1.4%; RDS = 1.9%, EE = 97.5 ± 0.4%, RDS = 0.4%).The HT composition used in this study was analysed after caramelization in order to test the chemical stability of the compound. Three HT caramel samples (mean weight 1.0039 ± 0.0023 g; RDS = 0.23%) were characterized under standard HPLC working conditions, rendering 15.002 ± 0.149 mg HT (RDS = 1%) per caramel. Furthermore, the stability of encapsulated HT in caramels was retained after the completion of the exploratory study (ESI Fig. S2†). No HT signal was detected in placebo caramel samples within the HT retention time (ESI Fig. S2†).
In vitro digestion stability of encapsulated hydroxytyrosol
The in vitro digestion analysis revealed that although the encapsulation process safeguards HT from caramelization, less than 20% of the compound was found in the final intestinal phase, with no significant differences observed between free HT (10.3% ± 0.7) and HT-β-CD (9.9% ± 1.3) conditions (P > 0.05). As expected, neither the control or the β-CD samples exhibited any detectable HT levels (ESI Fig. S3†).The hydroxytyrosol treatment improves lipid metabolism and suppresses platelet activation
The detailed anthropometric and biochemical parameters of the entire cohort are presented in Table 1. The 26 enrolled patients were randomly allocated, and no significant differences (P > 0.05) were found between the two groups (starting HT or placebo). Total cholesterol and LDL levels were above 225.2 and 135.8 mg dL−1, respectively, reflecting the CV risk of the population. Importantly, throughout the 2.5 month study period, there were no discernible changes in dietary habits compared to baseline conditions, as observed in the MDSS questionnaire (data not shown). No adverse effects were found after the study.| Total (n = 26) | Start HT (n = 15) | Start placebo (n = 11) | P-Value | |
|---|---|---|---|---|
| Values are mean ± SD or median [25–75% quartiles]. T-student's and Mann–Whitney's tests were used for parametric and non-parametric parameters, respectively. | ||||
| Baseline characteristics | ||||
| Age (years) | 48.9 ± 10.9 | 50.3 ± 11 | 46.8 ± 10.9 | 0.426 |
| Male (n, %) | 11 (42%) | 6 (40%) | 5 (45%) | 0.822 |
| BMI (Kg m−2) | 27.6 ± 5.9 | 27.57 ± 6.3 | 27.7 ± 5.7 | 0.971 |
| Fat content, % | 34.8 ± 12 | 33.2 ± 11.2 | 37.1 ± 13.3 | 0.419 |
| Lean mass, % | 26.8 ± 8.5 | 28.5 ± 7.9 | 24.6 ± 9.2 | 0.259 |
| Visceral fat, % | 9.3 ± 4.3 | 9.1 ± 3.2 | 9.5 ± 5.6 | 0.813 |
| Biochemical parameters | ||||
| Glucose (mg dL−1) | 86.6 ± 10.2 | 85.6 ± 8.3 | 88.2 ± 12.9 | 0.544 |
| Total cholesterol (mg dL−1) | 225.2 ± 29.5 | 221.9 ± 30.4 | 230.2 ± 28.8 | 0.504 |
| HDL cholesterol (mg dL−1) | 66.4 ± 15.2 | 66.3 ± 15.5 | 66.6 ± 15.7 | 0.962 |
| LDL cholesterol (mg dL−1) | 135.8 ± 23.6 | 136.4 ± 24.7 | 135.1 ± 23.2 | 0.904 |
| Triglycerides (mg dL−1) | 97 [81–165] | 87 [79–99] | 151 [114.3–177.5] | 0.081 |
| Creatine (mg dL−1) | 0.8 ± 0.2 | 0.8 ± 0.2 | 0.8 ± 0.1 | 0.520 |
| GOT (U L−1) | 18.4 ± 3.6 | 19.1 ± 3.8 | 17.8 ± 3.6 | 0.468 |
| GPT (U L−1) | 20 [13–23.3] | 20 [14.5–26.5] | 19.5 [11.25–14.75] | 0.459 |
| Insulin (U mL−1) | 9.8 [5–14.4] | 9.6 [4.9–14.3] | 11.2 [7.7–14.8] | 0.659 |
| HOMA-IR | 2.1 [1.1–3.3] | 2 [1–2.5] | 2.6 [1.9–3.4] | 0.403 |
The intervention period significantly improved the lipid profile (Fig. 1 and ESI Table S1†). LDL levels were notably reduced (P = 0.025) and better in the oxidized state (P = 0.0007). Additionally, TG levels were significantly decreased (P = 0.002) following HT treatment. Moreover, the hormonal balance was enhanced, as evidenced by an increase in adiponectin levels (p = 0.026) after HT treatment (Fig. 1).
 | ||
| Fig. 1 HT and placebo treatment's effect sizes (± 95% confidence interval) on the plasma biomarkers. When the confidence interval does not intersect the dotted line (which reflects r = 0), the effect size is statistically significant. | ||
Under unstimulated conditions, decreased platelet reactivity was detected after regular HT intake, as indicated by the higher CD61 expression (P < 0.0001, Fig. 2D, and ESI Table S1†). This lower platelet aggregation was abolished by ADP stimulation (before or after HT). Moreover, platelets increased P-selectin (CD62P) expression after ADP stimulation (Fig. 2D, P < 0.0001), but this effect was also reversed by HT treatment (Fig. 2D, Table S1,†P < 0.0001), suggesting lower platelet reactivity in the presence of HT. Finally, apoptotic MPs, as quantified by AnV+ expression in MPs, increased in response to ADP before HT treatment (Fig. 2D, P = 0.023); however, AnV+ expression in MPs after ADP stimulation was similar to that in unstimulated baseline conditions (P = 0.713, Table S1† and Fig. 2D).
 | ||
| Fig. 2 Flow cytometric analysis of platelet activation in fresh blood. (A). Platelet (PTL) gating strategy in FCS/SSC diagram. (B) The platelet membrane antigen CD62P (P-selectin) expression before HT treatment. (C) The platelet membrane antigen CD62P (P-selectin) expression after HT treatment. (D) Influence of HT and ADP treatments on the membrane expression of CD61 and CD62P in total platelets (PTL) and annexin V (AnV) in microparticles (MPs). Data are presented as the mean fluorescence intensity (MFI). | ||
To categorize patients according to their response to HT treatment, CV biomarkers were used to separate patients with major and minimal clinical evidence after the intervention (ESI Table S2†). The categorization, based on the effect of HT treatment on statistically significant biochemical parameters such as LDL (P = 0.004), oxLDL (P = 0.004, before HT), adiponectin (P = 0.026), and TG (P = 0.046), identified “responders” patients with major clinical improvement and “non-responders” patients with little clinical evidence after HT treatment (Table S2†). This approach allowed us to categorize 15 (58%) patients as responders, and 11 (42%) as non-responders to HT treatment.
Microbiome analysis shows differential microbial genus and species after the hydroxytyrosol treatment
The relative abundances of different bacterial taxa between treatments were compared at the family, genus, and species levels, using stacked bar plots as shown in ESI Fig. S4.† At the genus level, after HT treatment patients showed a lower abundance of bacteria from the genus Agathobacter than those who received a placebo. A similar effect can be found in other bacterial genera such as Faecalibacterium and Bifidobacterium. However, the opposite effect was observed with the genus Collinsella, which showed a higher relative abundance in patients after HT treatment compared with placebo. The genus Blautia decreased after HT treatment, and Subdoligranulum or Anaerostipes increased after the same treatment.Three indices were used to evaluate alpha diversity: community richness (Chao1) and uniformity of community diversity (Shannon and Simpson indices). Statistical analyses revealed no significant differences following HT treatment or placebo (Fig. 3). Next, we compared the impact of each intervention period on the microbial communities. Beta diversity was evaluated by the Bray–Curtis metric, conducting a permutational multivariate analysis of variance (PERMANOVA) to determine whether there was a significant separation of samples by treatment or time point due to differences in microbiome structure. PERMDISP assesses whether the distribution or spread of the two sample groups is significantly different and is conducted in parallel with the PERMANOVA. Results from these analyses showed that although most treatment groups at 28 days were significantly separated from each other, HT and placebo treatments did not exhibit a significantly different community structure from the basal conditions (ESI Fig. S4†).
 | ||
| Fig. 3 Alpha and beta diversity of microbial communities. Boxplots depicting alpha diversity metrics of richness, (A) Chao1 and evenness, (B) Shannon, and (C) Simpson, categorized according to treatment. Statistical differences were determined using the value of each index for each sample and employing the Kruskal–Wallis test, with a correction for multiple hypotheses applied according to Benjamín's procedure. (D) Two-dimensional graphical representation of beta diversity for each microbial community based on the Bray–Curtis index as a measure of diversity through PCoA. Colours denote the treatment group. | ||
Subsequently, genus and species were compared at distinct time points (Fig. 4). As shown in Fig. 4A, the three genera displayed differential abundances following HT treatment. Ruminiclostridium sp. and Holdemanella sp. exhibited increased abundance, whereas Desulfovibrio sp. decreased in abundance after HT treatment (all P < 0.05). Comparison between HT treatment and the placebo period (Fig. 4A) also revealed changes in the genus; Catenibacterium sp. increased after HT treatment, whereas Holdemanella sp. increased in abundance after the placebo period.
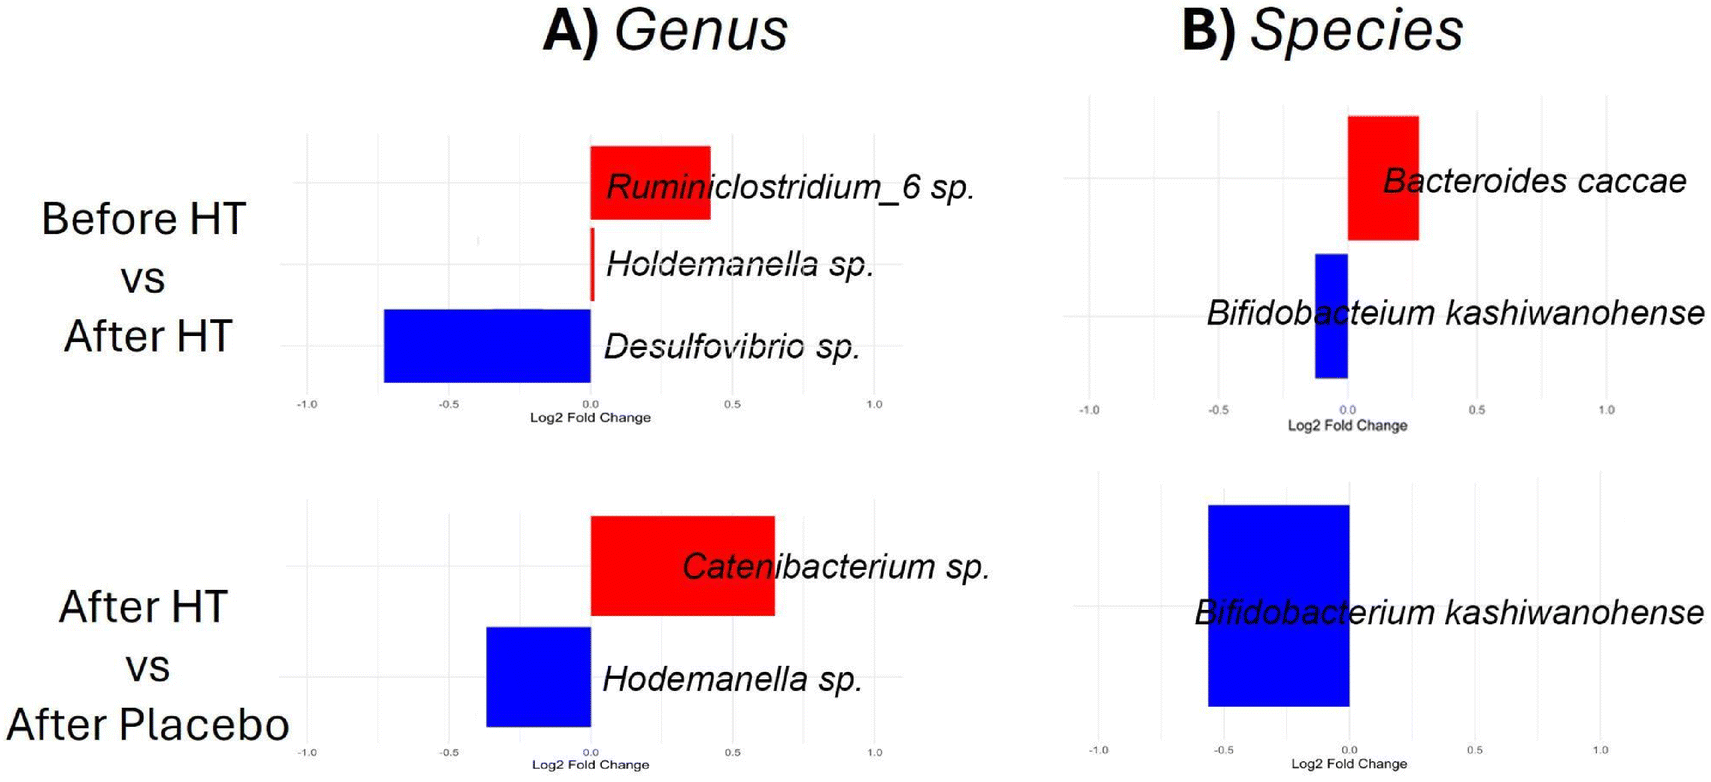 | ||
| Fig. 4 Logarithmic fold changes in bacteria abundance. (A) Genus and (B) species, according to ANCOM-BC analysis comparing After vs. Before HT treatment and after HT vs. After Placebo. A positive value of fold change indicates a higher level of abundance in the patients after HT treatment. Conversely, a negative value of fold change indicates a higher level of abundance in patients before HT treatment or the placebo group, respectively. | ||
Notably, Bacteroides caccae and Bifidobacterium kashiwanohense exhibited increased and decreased abundances, respectively, after HT treatment (Fig. 4B). Comparing the HT and placebo periods, we found that HT treatment decreased the abundance of Bifidobacterium kashiwanohense (Fig. 4B). No changes in lower taxonomic ranks, such as family, genus, or species, were found after HT treatment in the responder and non-responder groups (data not shown).
Proteomics profiling monitors the clinical improvement after hydroxytyrosol treatment
In the present study, we conducted a detailed proteomic analysis of plasma samples to gain a deeper understanding of the biological effects of HT. The data processing method described herein allowed us to investigate 673 proteins. The HT intervention led to statistically significant changes in only 19 proteins. Among these, HT treatment resulted in the overexpression of 15 proteins, whereas four proteins were under-expressed (Table 2). To identify alterations in the biological functions of differentially expressed proteins (DEPs), biological enrichment analyses were performed using Metascape (ESI Fig. S5†). The most enriched proteins in the entire cohort (n = 22) were related to three main protein clusters participating in platelet degranulation [log(q-value) = −2.275], negative regulation of protein binding [log(q-value) = −1.412], and regulation of insulin-like growth factor (IGF) [log(q-value) = −1.023]. Some of the identified proteins related to these pathways were IBP6 (P = 0.009), IBP4 (P = 0.037), and ECM1 (P = 0.015) (Table 2).| Protein name | Difference | Pathways related | P-Value |
|---|---|---|---|
| The negative values in the Difference section represent higher expression, while positive values represent a lower expression after HT treatment. | |||
| FHR1_HUMAN | −0.49 | Can be associated with lipoproteins and may play a role in lipid metabolism | 0.046 |
| PROF1_HUMAN | −0.40 | Binds to actin and affects the structure of the cytoskeleton | 0.020 |
| PLEK_HUMAN | −0.39 | Major protein kinase C substrate of platelets | 0.026 |
| CC126_HUMAN | −0.33 | Undescribed function | 0.046 |
| ACTB_HUMAN | −0.29 | This gene encodes one of six different actin proteins | 0.046 |
| PRAP1_HUMAN | −0.29 | Lipid-binding protein which promotes lipid absorption | 0.041 |
| IBP6_HUMAN | −0.27 | Enables identical protein binding activity and insulin-like growth factor II binding activity. | 0.009 |
| TALDO_HUMAN | −0.27 | Catalyzes the rate-limiting step of the non-oxidative phase in the pentose phosphate pathway | 0.044 |
| KV228_HUMAN | −0.25 | V region of the variable domain of immunoglobulin light chains that participates in the antigen recognition | 0.048 |
| HV316_HUMAN | −0.24 | V region of the variable domain of immunoglobulin light chains that participates in the antigen recognition | 0.002 |
| IBP4_HUMAN | −0.21 | Positive regulation of insulin-like growth factor receptor signalling pathway | 0.037 |
| PTPRF_HUMAN | −0.19 | Possible cell adhesion receptor | 0.001 |
| KV224_HUMAN | −0.18 | V region of the variable domain of immunoglobulin light chains that participates in the antigen recognition | 0.021 |
| GGH_HUMAN | −0.15 | May play an important role in the bioavailability of dietary pteroylpolyglutamates and the metabolism of pteroylpolyglutamates and antifolates | 0.043 |
| NGAL_HUMAN | −0.12 | Iron-trafficking protein involved in multiple processes | 0.049 |
| TRFE_HUMAN | 0.13 | It is responsible for the transport of iron from sites of absorption and heme degradation to those of storage and utilization | 0.049 |
| PIP_HUMAN | 0.17 | Enables IgG binding activity; aspartic-type endopeptidase activity; and identical protein binding activity | 0.045 |
| ECM1_HUMAN | 0.19 | Stimulates the proliferation of endothelial cells and promotes angiogenesis | 0.015 |
| HV348_HUMAN | 0.22 | V region of the variable domain of immunoglobulin light chains that participates in the antigen recognition | 0.041 |
To further validate the specific biological responses of the categorized patient- responder and non-responder subgroups- (ESI Table S2†), their proteomic profiles were compared at two-time points (before and after HT treatment). Among the 24 DEPs identified under basal conditions (before HT), the non-responder and responder subgroups indicated a distinct initial status in coagulation and inflammatory pathways within the two subgroups (Fig. 5A). However, HT treatment produced an increase in the number of DEPs (from 24 to 139), with 113 exhibiting overexpression in the non-responder group, compared to 26 in the responder subgroup (Fig. 5B). The proteins that differentiate both subgroups (before and after HT treatment) were involved in similar clusters and signaling cascades. Interestingly, HT treatment strongly affected the complement and coagulation cascades [log(q-value) = −34.055], platelet degranulation [log(q-value) = −20.916], processes regulated by IGF [log(q-value) = −16.452], and proteins associated with extracellular matrix remodelling and wounding [log(q-value) = −20.341]. Some of the identified proteins related to these pathways were FA5 (P = 0.002), IL-6RB (P = 0.001), VCAM-1 (P = 0.002), APOB (P = 0.006), and TSP4 (P = 0.013) (data not shown).
 | ||
| Fig. 5 Functional enrichment analysis of the proteome comparing the responder and non-responder subgroups. (A) Comparison of responder and non-responder groups before HT treatment (basal conditions); (B) comparison of responder and non-responder groups after HT treatment. A network of enriched terms coloured according to cluster identity, where nodes that share the same cluster identity are typically nearby. The most significant functions were identified based on the statistically significant differences in protein expression before and after HT treatment. Log10 (q-value) represents each function's significance, as shown in the table below. Process enrichment analyses were conducted using Metascape software. The pathways are listed in descending order of statistical significance. | ||
Upon further investigation, 44 proteins exhibited significant differences in the responder subgroup after HT treatment, with 13 and 31 overexpressed and underexpressed proteins, respectively. ESI Fig. S6† shows that changes in the proteome of patients with clinical improvement included hemostasis (log(q-value) = −11.549), blood coagulation (log(q-value) = −11.190), and cell–cell adhesion processes (log(q-value) = −6.473). Additionally, regulators of the NABA ECM pathway also exhibited notable changes (log(q-value) = −5.240). Some of the identified proteins related to these pathways were MRC-1 (P = 0.028), VCAM-1 (P = 0.041), and GP1BA (P = 0.047) (data not shown).
Targeted metabolomics show changes in the amino acid and lipid metabolism following hydroxytyrosol treatment
Targeted analysis was used to identify the metabolites associated with amino acids, oxidative status, and lipid metabolism. The whole blood metabolome analysis after HT treatment was carried out by comparing metabolite changes between the responder and non-responder subgroups, which were defined based on their clinical improvement (ESI Table S2†). To determine whether the HT effect was associated with differences in whole blood metabolite patterns a PLS-DA model was performed in the two categorized subgroups (ESI Fig. S7†). The responder subgroup showed a significant increase and decrease in hippuric acid and CDP-ethanolamine levels, respectively, before HT treatment (Fig. 6 and ESI Fig. S7A†). In contrast, kyneurine and xanthosine were more abundant in the responder subgroup after HT treatment (Fig. 6 and ESI Fig. S7B†). Additionally, 2-hydroxybutyric acid and hypoxanthine levels were lower in the responder subgroup than in the non-responder subgroup (ESI Fig. S7B†). Notably, we observed an evident separation pattern within the two subgroups, as shown in Fig. 6C and the score plots (ESI Fig. S7B†), indicating a more distinct metabolic signature after HT treatment.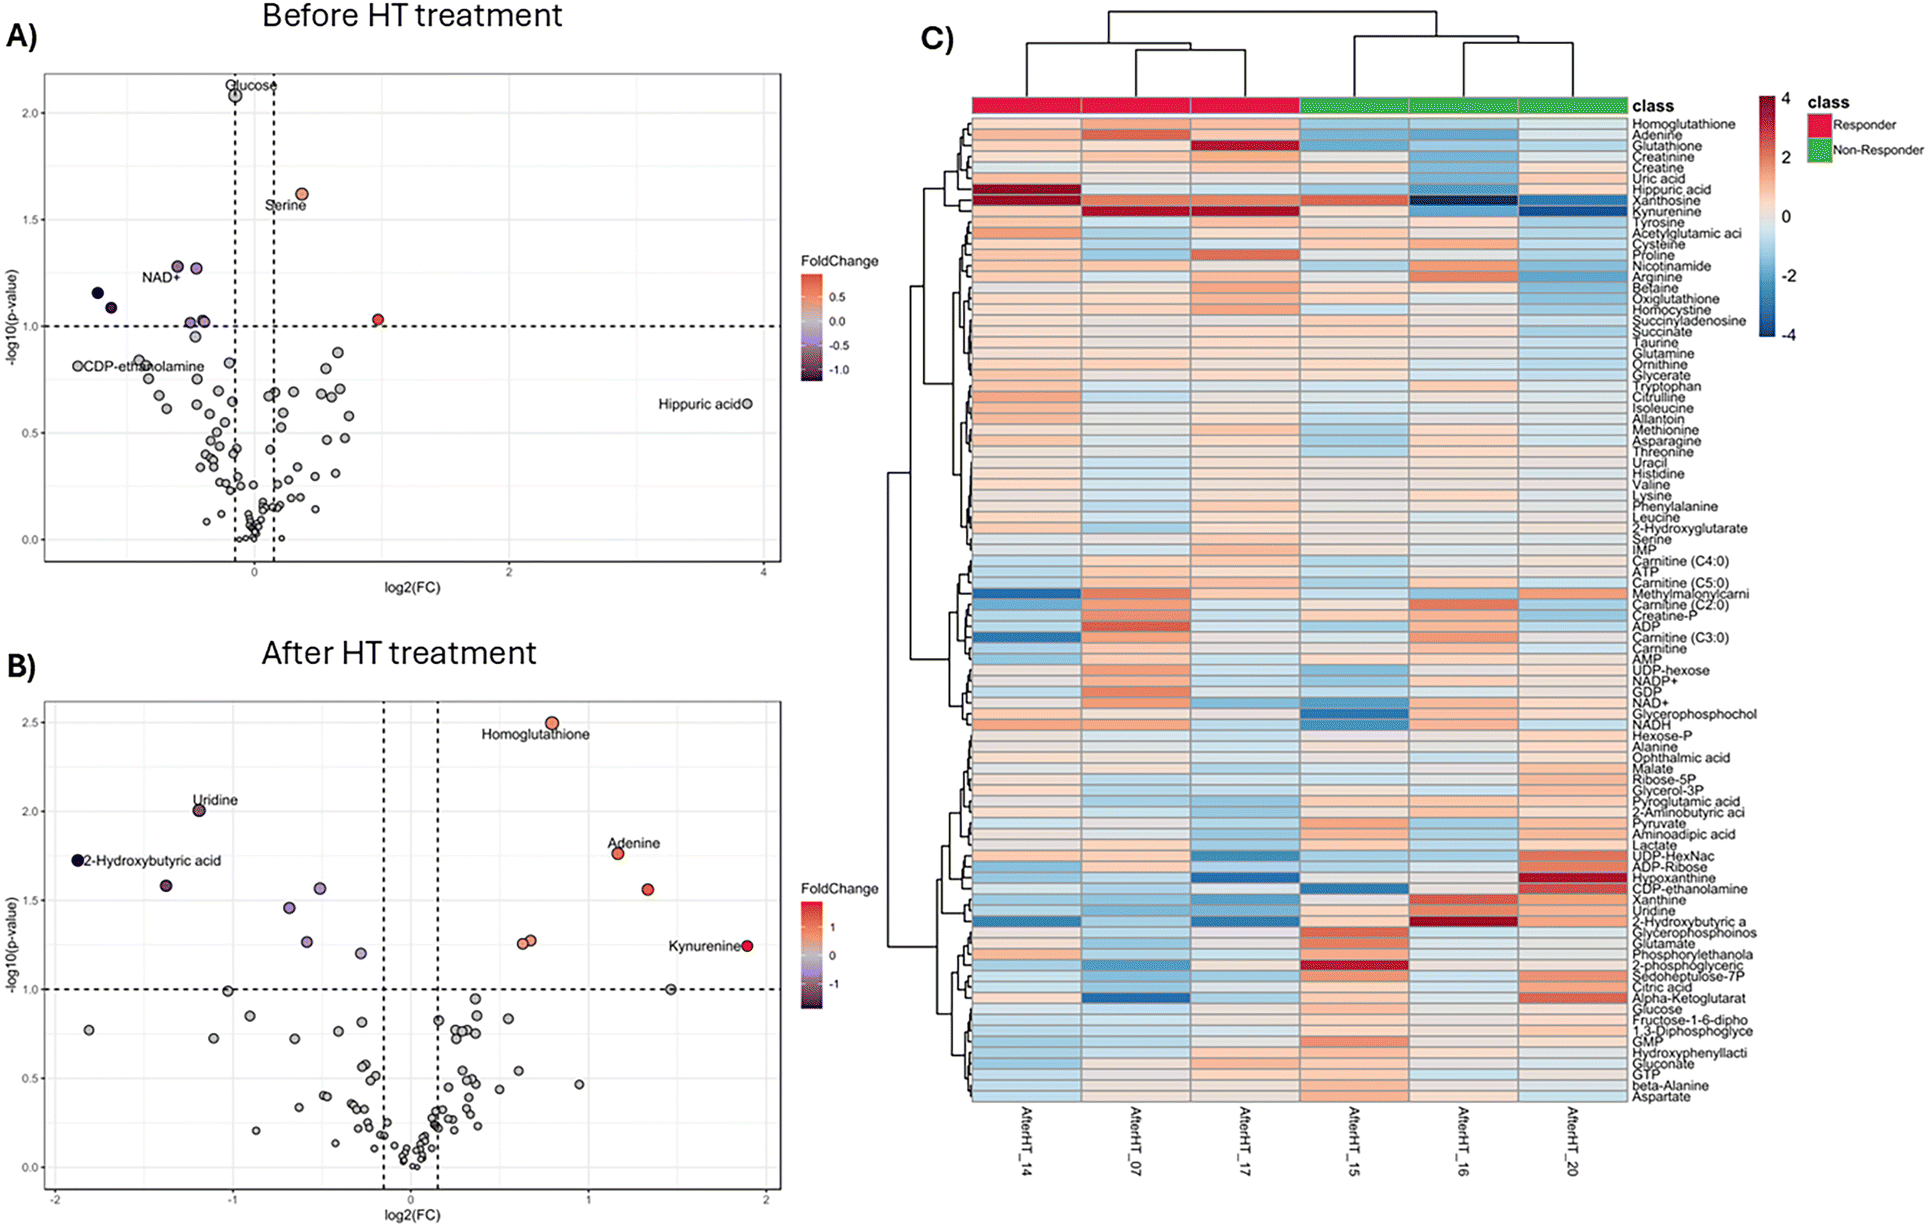 | ||
| Fig. 6 Targeted metabolomics of the whole blood metabolome comparing the responder and non-responder subgroups. Volcano plot analysis of the differentially abundant metabolites. (A) Before HT treatment. (B) After HT treatment. The graphs depict the relative abundance of each metabolite to its statistical significance, expressed as the difference between log2(FC) and −log10 (q-value). (C) Heatmap of metabolites after HT treatment. The heatmap scale ranged from −2 to 2. Three patients were included in each subgroup. | ||
The comparison in the two categorized subgroups revealed an association with changes in glutathione, nucleotide, and amino acid metabolism (Fig. 6). Especially, in the responder subgroup, HT intake induced relative increases in homoglutathione (P = 0.0032), glutathione (P = 0.027), and adenine (P = 0.017) (Fig. 6B). Conversely, uridine (P = 0.010), 2-hydroxybutyric acid (P = 0.019), xanthine (P = 0.026), 1,3-diphosphoglyceric acid (P = 0.027), and pyroglutamic acid (P = 0.035) levels decreased after HT treatment (Fig. 6B), suggesting the metabolic basis for the observed clinical improvement (ESI Fig. S8†).
Proteomic and metabolomic data correlated in the responder subgroup with glutathione and amino acids metabolism
Correlation analyses were performed to test possible associations between significant proteins, metabolites, and CV biomarkers (adiponectin, LDL, oxLDL, TG) in the responder subgroup (Table 3). Pearson's correlation analysis after the HT treatment identified 23 proteins with strong associations (P < 0.05). Specifically, LDL levels were positively associated with APOF (r = 0.82, P = 0.006), APOL1 (r = 0.7, P = 0.037), and thrombospondin (r = 0.76, P = 0.018). Adiponectin was also positively correlated with angiotensinogen (r = 0.87, P = 0.002), serpinc1 (r = 0.72, P = 0.03) and serpins (r = 0.67, P = 0.049). Proteins related to lipid metabolism (APOF and APOL1), regulation of blood coagulation (THBS1, CFHR, F13B, F13A1, HABP2, TFPI, F5, F7 and F12), inflammation (CRP, VCAM-1, CPN1, F2, and CSF1R), and proteolysis (SERPINs, MMP2, HABP2, and CPN) were correlated to these classical biomarkers of the CV status.| Biological marker | Gene | Function | R value | P-Value |
|---|---|---|---|---|
| ADIPONECTIN | AGT | Potent regulator of blood pressure | 0.87 | 0.002 |
| SERPINC1 | The most important serine protease inhibitor in plasma that regulates the blood coagulation cascade | 0.72 | 0.03 | |
| SERPINA1; SERPINA2 | Inhibitor of serine proteases. It has a moderate affinity for thrombin | 0.67 | 0.049 | |
| TRIGLYCERIDES | THBS1 | Adhesive glycoprotein that mediates cell-to-cell and cell-to-matrix interactions | −0.9 | 0.002 |
| TFPI | It possesses an antithrombotic action and the ability to be associated with lipoproteins in plasma | −0.71 | 0.047 | |
| LDL CHOLESTEROL | HPR | It contains HDL cholesterol | 0.97 | 8.13×10⁻⁶ |
| MMRN2 | It acts as a negative regulator of angiogenesis | 0.94 | 0.0002 | |
| GPX3 | It protects cells and enzymes from oxidative damage | 0.89 | 0.001 | |
| F10 | It converts prothrombin to thrombin | 0.86 | 0.003 | |
| APOF | It is an important regulator of cholesterol transport | 0.82 | 0.006 | |
| TFPI | It possesses an antithrombotic action and the ability to associate with lipoproteins in plasma | 0.79 | 0.01 | |
| THBS1 | Adhesive glycoprotein that mediates cell-to-cell and cell-to-matrix interactions | 0.76 | 0.018 | |
| APOL1 | May play a role in lipid exchange and transport throughout the body | 0.7 | 0.037 | |
| OXIDIZED LDL | SERPIND1 | Thrombin inhibitor | −0.94 | 0.005 |
| CPN1 | It protects the body from potent vasoactive and inflammatory peptides | −0.94 | 0.005 | |
| F13B | It regulates the rate of transglutaminase formation by thrombin | −0.89 | 0.019 | |
| CFHR2 | Associated with lipoproteins and may play a role in lipid metabolism | −0.89 | 0.019 | |
| F2 | It has a role in blood homeostasis, inflammation, and wound healing | −0.89 | 0.019 | |
| HABP2 | It activates the coagulation factor VII | −0.89 | 0.019 | |
| F13A1 | It is activated by thrombin and calcium ions to a transglutaminase, stabilizing the fibrin clot | −0.89 | 0.019 | |
| MMP2 | Diverse functions such as remodelling of the vasculature, angiogenesis, tissue repair, tumor invasion, inflammation, and atherosclerotic plaque rupture | −0.89 | 0.019 | |
| KIT | It acts as a cell-surface receptor for the cytokine KILTG/SCF | −0.89 | 0.019 | |
| CSF1R | It acts as a cell-surface receptor for CSF1 and IL34 | −0.83 | 0.042 |
To further dissect the molecular dynamics after HT treatment, correlations between metabolites were determined in the responder subgroup (Table 4). In general, most metabolites and diagnostic biomarkers that correlate are related to glutathione (glutathione, glutamate, and NADH), amino acids (ornithine, pyruvate, arginine, aspartame, glutamate, leucine, carnitine, and NADH), and the urea cycle (Ornithine, NADH, and glutamate) (ESI Fig. S9†). Platelet parameters strongly correlated with de novo triacylglycerol and cardiolipin biosynthesis (carnitine, glycerol-3P, glycerophosphoinositol, and phosphorylethanolamine).
| Biological marker | Metabolite | P-Value |
|---|---|---|
| Abbreviations: LDL – low-density lipoproteins cholesterol, MFI – mean fluorescence intensity, AnV+: annexin V+. | ||
| Adiponectin | Ornithine | 0.043 |
| LDL cholesterol | Aminoadipic acid | 0.017 |
| Glycerol-3P | 0.019 | |
| Citric acid | 0.025 | |
| Pyruvate | 0.027 | |
| Alpha-Ketoglutarate | 0.036 | |
| Sedoheptulose-7P | 0.037 | |
| Uric acid | 0.041 | |
| Arginine | 0.017 | |
| Nicotinamide | 0.027 | |
| Oxidized LDL | NADH | 0.008 |
| Carnitine (C5:0) | 0.04 | |
| Phosphorylethanolamine | 0.001 | |
| Aspartate | 0.035 | |
| Glutamate | 0.035 | |
| AnV+ microparticles (n = 4) | Uric acid | 0.014 |
| Carnitine (C4:0) | 0.038 | |
| Phosphorylethanolamine | 0.011 | |
| Ribose-5P | 0.04 | |
| Platelet CD61 expression, MFI (n = 4) | IMP | 0.004 |
| Glycerophosphoinositol | 0.012 | |
| Leucine | 0.032 | |
| Carnitine | 0.019 | |
| Carnitine (C3:0) | 0.025 | |
| Platelet CD62P expression, MFI (n = 4) | Glycerol-3P | 0.008 |
| Hypoxanthine | 0.009 | |
| Carnitine (C2:0) | 0.018 | |
| Aspartate | 0.018 | |
| Glutathione | 0.016 | |
Multivariate analyses with the mixOmics package
“MixOmics” R package was applied for omics feature selection and multiple data integration in responders vs. non-responders subgroups after HT treatment. Firstly, variables with a high expression in responders were adiponectin, kynurenine, homoglutatione, creatinine, homocysteine and 1433Z_Human (Proteome). Variables with a high expression in non-responders are triglycerides, xanthine, uridine (among others), and C1R (complement system C1), A1BG (Alpha-1-B Glycoprotein). To effectively visualize the global relationships among the metabolome, proteome, and clinical biomarkers, a Circos plot (Fig. 7A) was performed. Fig. 7A highlights that the first components from each dataset are highly correlated to each other (r > 0.9). Omics integration indicates a decrease in proteins such as APOA1, APOC1, KNG1, and FA9, in the responder subgroup. These proteins are associated with the lipidomic profile and coagulation state (A1BG, C1R, and CO6). Conversely, metabolites such as homoglutathione, pyroglutamic acid, adenine, homocysteine, and kynurenine, among others, were elevated in the responder subgroup after HT treatment. | ||
| Fig. 7 Stacked partial least-squares discriminant analysis (sPLS-DA) with DIABLO. (A) Circos plot. The plot represents the correlations greater than 0.9 between variables of the different samples, represented on the side quadrants. (B) Clustered image map (Euclidean distance, complete linkage) of the multi-omics signature. Samples are represented in rows, selected features on the first component in columns. | ||
Besides, the clustered image map (cimDIABLO) based on the features selected on the first component displayed a good classification within the two phenotypic subgroups (Fig. 7B).
Discussion
One major obstacle to the translation of multi-omics technologies to routine clinical applications is its uneven maturity. As the prevalence of CV risk factors is reaching epidemic rates and healthy dietary habits are still a pending subject worldwide. This study evaluates the therapeutic landscape targeted by these integrated approaches and identifies the dynamic changes (platelet reactivity, microbiome, proteins, and metabolites) directly affected by HT in the CV context. Moreover, the analytical chromatographic assay showed that β-CDs were efficient protective carriers during the crystallization process, which has not been previously reported in the literature for interventional human diet studies. However, as shown in this study, encapsulation made no difference in terms of HT stability during in vitro digestion. Consistent with our findings, β-CDs do not alter HT bioavailability either61 due to their propensity to dissolve upon contact with aqueous solutions (oral, gastric, and intestinal fluids).The results of this clinical study demonstrated an improvement in lipid biomarkers (LDL, TG, oxLDL), adiponectin, and platelet reactivity following 60 mg day−1 HT. The HT dosage range used in this study aligns with the doses reported in a recent meta-analysis on olive-derived polyphenols.62 It is important to note that participants did not modify their dietary habits during the study period; therefore, the observed changes can be attributed solely to the nutritional intervention. Elevated LDL, TG, and ox-LDL levels play a major role in the pathogenesis of CV diseases such as atherosclerosis.63–65 In agreement with these data, previous human studies have shown the positive effects of HT on LDL and TG levels. However, these trials involved healthy volunteers66 and used a lower amount of HT combined with other compounds, which cannot grant the specific effects of this monophenol alone.67 While reductions in ox-LDL levels have been previously reported, other lipid parameters remained unaffected in previous reports.68 Verhoeven et al. reported similar results attributed to a complex supplement containing monacolins in addition to HT.69 In parallel with these findings, adiponectin levels were also increased after HT treatment in the current study. Adiponectin is the most abundant adipokine secreted by adipocytes, and its levels are typically reduced in individuals with CVD.70,71 An in vitro study demonstrated that HT increased adiponectin levels and speculated that this effect mitigated the inflammatory state of adipocytes.72 Clinical studies have also attempted to investigate the in vivo effects of HT; however, confounding factors, such as a caloric-deficit diet, oral medications, and a combination of other bioactive compounds mask the real effects on adiponectin levels.73,74 Conversely, the current study, characterized by a higher age range, CV risk, and elevated HT concentration intake, consistently demonstrated the ability of HT alone to enhance adiponectin levels.73,74
Upon platelet activation, the degranulation leads to upregulation of CD62P (P-selectin) on the platelet surface. CD61, also known as glycoprotein IIIa (GPIIIa), is a key protein involved in platelet aggregation. In the current study, platelets activate and aggregate in the presence of ADP, leading to a higher and lower mean fluorescence intensity of CD62P and CD61, respectively. However, after the HT supplementation, an increase in CD61 expression together with a decrease in cellular adhesion molecules (CD62P), and AnV expression in MPs confirmed a decrease of platelet reactivity, which is generally associated with a lower risk of thrombotic events in various clinical settings.75 The potential effects of phytochemicals have been previously noticed in animal studies, in which HT administration led to a decrease in thromboxane 2 (TxB2) levels across a dosage range of 5–100 mg kg−1 day−176,77 Some human blood studies have used HT extracts (not HT alone) or elevated HT concentrations to mitigate platelet aggregation as well.78,79 Notably, a study involving five patients with type I diabetes supplemented with an HT concentrate extract (comprising 53% HT and 13% tyrosol) demonstrated a decrease in TxB2 levels,80 underscoring the potential efficacy of our exploratory study in which patients were supplemented with HT alone. Overall, our study provides convincing evidence regarding the potential of HT in managing lipid levels, adipocyte inflammation, and platelet activation profiles associated with CV risk. However, the mechanisms by which HT coordinates such mechanisms have not been defined. Therefore, combining in vivo studies (animal and human) with -omics may be useful for elucidating complex pathways and targets in vivo.
One possible way to modulate the gut microbiota and CVD is through dietary interventions. Previous studies have linked HT to probiotic effects and reduction in certain bacteria associated with inflammatory diseases.81 After HT, patients showed significant changes in three gut microbial genera with increased levels of Ruminiclostridium sp. and Holdemanella sp., both of which are associated with beneficial effects on blood pressure82 and glucose tolerance,83 respectively. However, these results suggest that gut microbiome alterations after HT were not related to the patient clinical benefit -responder and non-responder subgroups-, perhaps, because of the low number of patients included in the microbiome study (n = 15 and n = 11, respectively).
Although most studies have focused on the clinical benefits of HT, the molecular pathways involved are also of paramount importance. The current study identified 673 proteins, of which 19 showed significant differential expression after the intervention period. Notably, IBP6 and IBP4 were up-regulated, whereas ECM1 was down-regulated. Previous studies have confirmed low levels of IBP6 in patients with unstable plaques,84 indirectly indicating the beneficial effect of HT treatment. Additionally, elevated ECM1 levels were observed during the inflammatory phase of myocardial infarction,85 further suggesting a protective role of HT in our interventional study. While some animal studies have determined the proteome changes in adipose tissue, liver, aorta, and heart following HT supplementation, no human studies have evaluated the proteome changes resulting from this polyhydroxylphenol.86,87
Significant biochemical markers were used to ensure a clear distinction between individuals exhibiting distinct clinical responses to HT, enabling a more focused examination of proteomic alterations associated with CV risk. This careful selection process was aimed at facilitating a deeper investigation of the molecular mechanisms underlying HT treatment. Thus, 44 proteins were identified in the responder subgroup after HT supplementation. Of these, 13 were over-expressed and 31 were under-expressed. Most of these proteins are involved in homeostasis and coagulation. Notably, MRC-1, VCAM-1, and GP1BA levels decreased. Investigators have also found that HT can reduce VCAM-1 levels in vitro and animal studies,88,89 which is in agreement with current results in humans. One of the more significant findings of this study is that proteomics confirmed higher changes in coagulation and platelet-related pathways in the subgroup benefiting from HT.
Metabolomics has received increasing attention in recent years.90 When comparing the responder and non-responder subgroups, pathways involving nucleotide and amino acid metabolism were found to be altered, which has a potential role in overall metabolism.91 The metabolites showing increased levels after HT treatment were kynurenine, glutathione, adenine, homoglutathione, and creatinine. A significant body of data suggests that increased glutathione is associated with the CV prevention,92 whilst a increase of 2-hydroxybutyric acid can predict the development of insulin resistance.93 These findings may be related to the clinical benefits of HT supplementation. This approach identified platelet functional parameters that were positively correlated with de novo triacylglycerol and negatively correlated with cardiolipin biosynthesis. Currently, we can only speculate why this is the case, but an increase in cardiolipin levels is associated with higher platelet reactivity through platelet-activating factor receptors, and clinically with a high risk of spontaneous thrombosis.94
In addition, the combination of omics data offers possibilities that exceed those of the single biomarkers.95,96 Based on previous studies,97,98 we stratified our cohort into responders and non-responders. In responders, classical biomarkers were significantly associated with proteomic, metabolomics changes, reflecting beneficial effects on lipid metabolism, blood coagulation, inflammation, and proteolysis. These findings are consistent with other phenolic compounds, which exert cardioprotective effects.99,100 Integrating omics and classical biomarkers have already proven useful for patient stratification and predicting cardiometabolic risk.101 The multivariate analysis confirmed the two distinct groups, with responders displaying coordinated downregulation of apolipoproteins, particularly APOA1 and increase in homoglutathione and homocysteine, markers of oxidative stress.102,103 Translating this multi-omics features onto the clinical landscape indicated a more favourable cardiometabolic profile in responders. Thus, these integrative findings support the hypothesis that HT exerts synergistic effects across lipid metabolism, coagulation, and antioxidant pathways.
Finally, this study has several important limitations. First, with a small sample size, caution must be applied as the findings might not apply to the general population. Moreover, to assess long-term benefits, a follow-up study is needed. Investigating different dosages of HT in combination with other therapeutic compounds could also provide valuable insights into optimizing preventive strategies for CV diseases and other pathologies. Overall, this study raises many questions that require further investigation such as the molecular pathways or receptors for HT in platelets.
Conclusions
Mainly, we provide an overview of the utility of multi-omics in CV-nutraceutical development, which might be translated to other clinical landscapes. Our study provides convincing evidence regarding the beneficial effects of HT, showing reductions in traditional blood biomarkers (oxLDL, LDL, and TG) and increased adiponectin. Furthermore, our research offers, for the first time, insights into the antithrombotic properties of HT, such as platelet degranulation, hemostasis, and cell–cell adhesion. Integrative omics indicates the potential modulation of previously unidentified metabolic routes. From a scientific point of view, improving diagnostics and detecting patients that could benefit better from treatment, particularly in patients with multiple comorbidities such as CVD, is of paramount importance, and -omics has the potential to be used in the medical field.Author contributions
Clara Noguera-Navarro: methodology, investigation, formal analysis, data curation, validation, writing – original draft, writing – review, and editing. Kasper T. Vinten: methodology, investigation, metabolomics. David Auñón-Calles: methodology, investigation. Carmen Carazo-Díaz: data curation and formal analysis. Georges E. Janssens: methodology, investigation, metabolomics. Silvia Montoro-García: visualization, validation, resources, methodology, investigation, formal analysis, data curation, conceptualization, funding acquisition, project administration, writing – review and editing, supervision.Conflicts of interest
The authors declare that they have no known competing financial interests or personal relationships that could influence the work reported in this study.Materials availability
This study did not generate new unique materials. Any additional information required to reanalyze the data reported in this article is available from the lead contact upon request.Abbreviations
| ADP | Adenosine diphosphate |
| AnV + MPs | Annexin V+ microparticles |
| β-CDs | β-Cyclodextrins |
| BMI | Body mass index |
| CV | Cardiovascular |
| CVDs | Cardiovascular diseases |
| EDTA | Ethylenediaminetetraacetic acid |
| EFSA | European Food Safety Authority |
| ELISA | Enzyme-linked immunosorbent assay |
| EVOO | Extra virgin olive oil |
| GP | Glycoprotein |
| HDL | High-density lipoprotein cholesterol |
| HPLC | High-performance liquid chromatography |
| HT | Hydroxytyrosol |
| HOMA-IR | Homeostasis model assessment insulin resistance |
| Hs-IL-6 | High sensitive interleukin-6 |
| IGF | Insulin-like growth factor |
| LDL | Low-density lipoprotein cholesterol |
| MS | Mass spectrometry |
| ox-LDL | Oxidized LDL |
| PCoA | Principal coordinate analysis |
| ROS | Reactive oxygen species |
| TG | Triglycerides |
| UCAM | Catholic University of Murcia |
Data availability
Raw 16S rRNA gene-sequencing reads generated for this study have been deposited in the European Nucleotide Archive (ENA) under accession PRJEB84474 and can be accessed at https://www.ebi.ac.uk/ena/browser/view/PRJEB84474.Proteomics raw mass-spectrometry data are available via the ProteomeXchange Consortium through the PRIDE repository under dataset identifier PXD060820 (https://www.ebi.ac.uk/pride/archive/projects/PXD060820).
Untargeted metabolomics peak tables and associated metadata have been deposited in MetaboLights with study identifier MTBLS12336 accessed at https://www.ebi.ac.uk/metabolights/MTBLS12336.
All remaining supporting information is provided in the ESI† of this article.
Acknowledgements
CNN belongs to the “Health Sciences PhD Program, Universidad Católica de Murcia (UCAM), Campus de los Jerónimos no. 135, Guadalupe 30107, Murcia, Spain” and holds a PhD grant from the UCAM. The authors are grateful to Servicio Murciano de Salud (Area 1) for patient recruitment, to the Hospital Universitario Virgen de la Arrixaca for biochemical analysis, to Marbyt Smart Solutions for Biotechnology (Murcia, Spain) (https://marbyt.com/) for biotechnological services. Finally, the authors are grateful to the Medical Oncology Laboratory (VUmc) (Amsterdam, NL) for the proteomic and microbiome services and to the Core facility Metabolomics (Amsterdam NL9) for metabolomic services. This research was funded by the Fundación Séneca de la Región de Murcia (20646/JLI/18, Jóvenes Líderes en Investigación).References
- A. S. Chan, S. Wu, S. T. Vernon, O. Tang, G. A. Figtree, T. Liu, J. Y. H. Yang and E. Patrick, Overcoming cohort heterogeneity for the prediction of subclinical cardiovascular disease risk, iScience, 2023, 26(5), 106633 CrossRef PubMed.
- A. F. G. Cicero, F. Fogacci and A. Colleti, Food and plant bioactives for reducing cardiometabolic disease risk: an evidence based approach, Food Funct., 2017, 8, 2076–2088 RSC.
- D. Diptimayee, A. Shubhamay, D. R. Kumar, B. Antara, R. A. Kumar, P. Sujay, P. Surajit and A. K. Duttaroy, Bioactive food components and their inhibitory actions in multiple platelet pathways, J. Food Biochem., 2022, 46(12), e14476 Search PubMed.
- I. Andredau, G. Vilahur and P. Kleinbongard, The platelet paradox of injury versus protection in myocardial infarction—has it been overlooked?, Basic Res. Cardiol., 2021, 116(1), 37 Search PubMed.
- World-Health-Organization, WHO expert meeting on prevention and control of noncommunicable diseases: learning from the arts. Opera House Budapest, Hungary, 15–16 December 2022: meeting report, https://www.who.int/europe/publications/i/item/WHO-EURO-2023-8280-48052-71230).
- P. Ditano-Vazquez, J. D. Torres-Pena, F. Galeano-Valle, A. I. Perez-Caballero, P. Demelo-Rodriguez, J. Lopez-Miranda, N. Katsiki, J. Delgado-Lista and L. A. Alvarez-Sala-Walther, The Fluid Aspect of the Mediterranean Diet in the Prevention and Management of Cardiovascular Disease and Diabetes: The Role of Polyphenol Content in Moderate Consumption of Wine and Olive Oil, Nutrients, 2019, 11(11), 2833 CrossRef CAS PubMed.
- Y. Luo, R. Liu, G. Yuan and Y. Pan, Polyphenols for stroke therapy: the role of oxidative stress regulation, Food Sci., 2024, 15, 11383–11399 Search PubMed.
- D. Raederstorff, Antioxidant activity of olive polyphenols in humans: a review, Int. J. Vitam. Nutr. Res., 2009, 79, 152–165 CrossRef CAS PubMed.
- C. Noguera-Navarro, S. Montoro-Garcia and E. Orenes-Pinero, Hydroxytyrosol: Its role in the prevention of cardiovascular diseases, Heliyon, 2023, 9, e12963 Search PubMed.
- T. A. Wani, F. A. Masoodi, M. M. Dar, R. Akhter and O. C. Sharma, Subcritical treatment of olive oil: Minor phenolic composition and antioxidant properties of the solvent extracts, Food Sci. Technol., 2021, 147, 111584 CAS.
- A. M. Kountouri, A. Mylona, A. C. Kaliora and N. K. Andrikopoulos, Bioavailability of the phenolic compounds of the fruits (drupes) of Olea europaea (olives): Impact on plasma antioxidant status in humans, Phytomedicine, 2007, 14, 659–667 Search PubMed.
- R. Aguado, D. Murtinho and A. J. M. Valente, Association of antioxidant monophenolic compounds with beta-cyclodextrin-functionalized cellulose and starch substrates, Carbohydr. Polym., 2021, 267, 118189 CrossRef CAS PubMed.
- S. Ntuli, M. Leuschner, M. J. Bester and J. C. Serem, Stability, Morphology, and Effects of In Vitro Digestion on the Antioxidant Properties of Polyphenol Inclusion Complexes with beta-Cyclodextrin, Molecules, 2022, 27(12), 3808 CrossRef CAS PubMed.
- R. C. F. Aguilar, A. D. Domenico, B. Dusemund, M. J. Frutos, P. Galtier, D. Gott, U. Gundert-Remy, C. Lambré, J. C. Leblanc, O. Lindtner, P. Moldeus, A. Mortensen, P. Mosesso, D. Parent-Massin, A. Oskarsson, I. Stankovic, I. Waalkens-Berendsen, R. A. Woutersen, M. Wright and M. Younes, Re-evaluation of β-cyclodextrin (E 459) as a food additive, EFSA J., 2016, 14(12), e04628 Search PubMed.
- S. Paolacci, M. C. Ergoren, D. De Forni, E. Manara, B. Poddesu, G. Cugia, K. Dhuli, G. Camilleri, G. Tuncel, H. K. Suer, N. Sultanoglu, M. Sayan, M. Dundar, T. Beccari, M. R. Ceccarini, I. S. Gunsel, A. Dautaj, T. Sanlidag, S. T. Connelly, G. M. Tartaglia and M. Bertelli, In vitro and clinical studies on the efficacy of alpha-cyclodextrin and hydroxytyrosol against SARS-CoV-2 infection, Eur. Rev. Med. Pharmacol. Sci., 2021, 25, 81–89 CAS.
- Y. Qiang, H. Wei, B. Huang, H. Chi and J. Fu, Inclusion complex of turmeric essential oil with hydroxypropyl-β-cyclodextrin: Preparation, characterization and release kinetics, Curr. Res. Food Sci., 2024, 8, 100668 CrossRef CAS PubMed.
- A. Malapert, E. Reboul, M. Tourbin, O. Dangles, A. Thiéry, F. Ziarelli and V. Tomao, Characterization of hydroxytyrosol-β-cyclodextrin complexes in solution and in the solid state, a potential bioactive ingredient, Food Sci. Technol., 2019, 102, 317–323 Search PubMed.
- J. H. Miyoshi, T. d. S. Crozatti, J. de Brito, H. dos Santos, J. C. Castro, F. Sato, L. H. da Silva, A. C. N. Mulati, G. D. M. Costa and G. Matioli, Complexation of essential oils with beta-cyclodextrin: Characterization of complexes, determination of antimicrobial, antioxidant activities and application, Food Sci. Technol., 2024, 214, 117143 CAS.
- L. M. Harms, A. Scalbert, R. Zamora-Ros, S. Rinaldi, M. Jenab, N. Murphy, D. Achaintre, A. Tjonneland, A. Olsen, K. Overvad, F. R. Mancini, Y. Mahamat-Saleh, M. C. Boutron-Ruault, T. Kuhn, V. Katzke, A. Trichopoulou, G. Martimianaki, A. Karakatsani, D. Palli, S. Panico, S. Sieri, R. Tumino, C. Sacerdote, B. Bueno-de-Mesquita, R. C. H. Vermeulen, E. Weiderpass, T. H. Nost, C. Lasheras, M. Rodriguez-Barranco, J. M. Huerta, A. Barricarte, M. Dorronsoro, J. Hultdin, J. A. Schmidt, M. Gunter, E. Riboli and K. Aleksandrova, Plasma polyphenols associated with lower high-sensitivity C-reactive protein concentrations: a cross-sectional study within the European Prospective Investigation into Cancer and Nutrition (EPIC) cohort, Br. J. Nutr., 2020, 123, 198–208 CrossRef CAS PubMed.
- S. Hurtado-Barroso, P. Quifer-Rada, J. F. Rinaldi de Alvarenga, S. Perez-Fernandez, A. Tresserra-Rimbau and R. M. Lamuela-Raventos, Changing to a Low-Polyphenol Diet Alters Vascular Biomarkers in Healthy Men after Only, Two Weeks, Nutrients, 2018, 10(11), 1766 CrossRef PubMed.
- C. Colica, L. D. Renzo, D. Trombetta, A. Smeriglio, S. Bernardini, G. Cioccoloni, R. C. de Miranda, P. Gualtieri, P. S. Salimei and A. D. Lorenzo, Antioxidant Effects of a Hydroxytyrosol-Based Pharmaceutical Formulation on Body Composition, Metabolic State, and Gene Expression: A Randomized Double-Blinded, Placebo-Controlled Crossover Trial, Oxid. Med. Cell. Longevity, 2017, 2017, 2473495 CrossRef PubMed.
- M. Sopic, E. L. Robinson, C. Emanueli, P. Srivastava, C. Angione, C. Gaetano, G. Condorelli, F. Martelli, T. Pedrazzini and Y. Devaux, EU-CardioRNA, COST Action CA17129 and EU-AtheroNET COST Action CA21153, Integration of epigenetic regulatory mechanisms in heart failure, Basic Res. Cardiol., 2023, 118(1), 16 Search PubMed.
- C. Shi, Z. Liang, T. Li, Q. Hao, H. Xiang and Q. Xie, Metabolome and microbiome analyses of the anti-fatigue mechanism of Acanthopanax senticosus leaves, Food Funct., 2024, 15, 3791–3809 RSC.
- J. Gao, P. Zhang, X. Nie, M. Tang, Y. Yuan, L. He, X. Wang, J. Ma and L. Li, Proteomic and metabolomic profiling of plasma predicts immune-related adverse events in older patients with advanced non-small cell lung cancer, iScience, 2024, 27(6), 109946 Search PubMed.
- I. Guillas, M. Lhomme, C. Pionneau, L. Matheron, M. Ponnaiah, S. Galier, S. Lebreton, M. Delbos, F. Ma, M. Darabi, P. E. Khoury, M. Abifadel, P. Couvert, P. Giral, P. Lesnik, M. Guerin, W. L. Goff and A. Kontush, Identification of the specific molecular and functional signatures of pre-beta-HDL: relevance to cardiovascular disease, Basic Res. Cardiol., 2023, 118, 33 CrossRef CAS PubMed.
- L. Fan, Y. Peng and X. Li, Brain regional pharmacokinetics of hydroxytyrosol and its molecular mechanism against depression assessed by multi-omics approaches, Phytomedicine, 2023, 112, 154712 Search PubMed.
- H. Xu, H. Tu, J. Fu, Z. W. Zhang, J. C. Hu, J. Y. Lu, X. Y. Yang, M. M. Bu, J. D. Jiang and Y. Wang, Metabolites analysis of plantamajoside based on gut microbiota-drug interaction, Phytomedicine, 2023, 116, 154841 Search PubMed.
- L. Xiang, S. Zhuo, W. Luo, C. Tian, S. Xu, X. Li, Y. Zhu, R. Feng and M. Chen, Decoding polyphenol metabolism in patients with Crohn’s disease: Insights from diet, gut microbiota, and metabolites, Food Res. Int., 2024, 192, 114852 CrossRef CAS PubMed.
- S. Wang, L. Y. Su, J. Chen, Y. Tian and H. Zhou, Integrated multi-omics profiling highlights the diet-gut-brain axis in low-calorie diets promoted novelty-seeking behavior, Curr. Res. Food Sci., 2024, 9, 100897 Search PubMed.
- J. A. Pellicer, M. I. Fortea, J. Trabal, M. I. Rodríguez-López, J. A. Gabaldón and E. Núñez-Delicado, Stability of microencapsulated strawberry flavour by spray drying, freeze drying and fluid bed, Powder Technol., 2019, 347, 179–185 CrossRef CAS.
- J. A. Pellicer, M. I. Fortea, J. Trabal, M. I. Rodríguez-López, C. Carazo-Díaz, J. A. Gabaldón and E. Núñez-Delicado, Optimization of the microencapsulation of synthetic strawberry flavour with different blends of encapsulating agents using spray drying, Powder Technol., 2018, 338, 591–598 CrossRef CAS.
- C. Ding, Y. Li, X. Li, L. Meng, R. Fu, X. Wang, Y. Li, Y. Ma and Z. Dong, QiShenYiQi pills, a Chinese patent medicine, increase bioavailability of atorvastatin by inhibiting Mrp2 expression in rats, Pharm. Biol., 2022, 60, 185–194 CrossRef CAS PubMed.
- M. Minekus, M. Alminger, P. Alvito, S. Ballance, T. Bohn, C. Bourlieu, F. Carrière, R. Boutrou, M. Corredig, D. Dupont, C. Dufour, L. Egger, M. Golding, S. Karakaya, B. Kirkhus, S. Le Feunteun, U. Lesmes, A. Macierzanka, A. Mackie, S. Marze, D. J. McClements, O. Ménard, I. Recio, C. N. Santos, R. P. Singh, G. E. Vegarud, M. S. J. Wickham, W. Weitschies and A. Brodkorb, A standardised static in vitro digestion method suitable for food - an international consensus, Food Funct., 2015, 6, 1113–1124 Search PubMed.
- M. Robles-Almazan, M. Pulido-Moran, J. Moreno-Fernandez, C. Ramirez-Costa, C. Rodriguez-Garcia, J. L. Quiles and M. C. Ramirez-Tortosa, Hydroxytyrosol: Bioavailability, toxicity, and clinical applications, Food Res. Int., 2018, 105, 654–667 CrossRef CAS PubMed.
- S. M. Martinez-Sanchez, A. Minguela, D. Prieto-Merino, M. P. Zafrilla-Rentero, J. Abellan-Aleman and S. Montoro-Garcia, The Effect of Regular Intake of Dry-Cured Ham Rich in Bioactive Peptides on Inflammation, Platelet and Monocyte Activation Markers in Humans, Nutrients, 2017, 9(4), 321 CrossRef PubMed.
- S. Montoro-Garcia, E. Shantsila, B. J. Wrigley, L. D. Tapp, J. Abellan-Aleman and G. Y. Lip, Small-size Microparticles as Indicators of Acute Decompensated State in Ischemic Heart Failure, Rev. Esp. Cardiol., 2015, 68(11), 951–958 CrossRef.
- A. Salonen, J. Nikkila, J. Jalanka-Tuovinen, O. Immonen, M. Rajilic-Stojanovic, R. A. Kekkonen, A. Palva and W. M. de Vos, Comparative analysis of fecal DNA extraction methods with phylogenetic microarray: effective recovery of bacterial and archaeal DNA using mechanical cell lysis, J. Microbiol. Met., 2010, 81, 127–134 CrossRef CAS PubMed.
- J. Ramiro-Garcia, G. D. A. Hermes, C. Giatsis, D. Sipkema, E. G. Zoetendal, P. J. Schaap and H. Smidt, NG-Tax, a highly accurate and validated pipeline for analysis of 16S rRNA amplicons from complex biomes, F1000Research, 2016, 5, 1791 Search PubMed.
- J. J. Kozich, S. L. Westcott, N. T. Baxter, S. K. Highlander and P. D. Schloss, Development of a dual-index sequencing strategy and curation pipeline for analyzing amplicon sequence data on the MiSeq Illumina sequencing platform, Appl. Environ. Microbiol., 2013, 79, 5112–5120 Search PubMed.
- T. Rognes, T. Flouri, B. Nichols, C. Quince and F. Mahe, VSEARCH: a versatile open source tool for metagenomics, PeerJ, 2016, 4, e2584 CrossRef PubMed.
- B. J. Callahan, J. Wong, C. Heiner, S. Oh, C. M. Theriot, A. S. Gulati, S. K. McGill and M. K. Dougherty, High-throughput amplicon sequencing of the full-length 16S rRNA gene with single-nucleotide resolution, Nucleic Acids Res., 2019, 47, e103 Search PubMed.
- A. I. Celis, A. Aranda-Díaz, R. Culver, K. Xue, D. Relman, H. Shi and K. C. Huang, Optimization of the 16S rRNA sequencing analysis pipeline for studying in vitro communities of gut commensals, iScience, 2022, 25(4), 103907 CrossRef CAS PubMed.
- P. Yilmaz, L. W. Parfrey, P. Yarza, J. Gerken, E. Pruesse, C. Quast, T. Schweer, J. Peplies, W. Ludwig and F. O. Glockner, The SILVA and “All-species Living Tree Project (LTP)” taxonomic frameworks, Nucleic Acids Res., 2014, 42, D643–D648 CrossRef CAS PubMed.
- K. Katoh, K. Misawa, K. Kuma and T. Miyata, MAFFT: a novel method for rapid multiple sequence alignment based on fast Fourier transform, Nucleic Acids Res., 2002, 30, 3059–3066 CrossRef CAS PubMed.
- M. N. Price, P. S. Dehal and A. P. Arkin, FastTree 2–approximately maximum-likelihood trees for large alignments, PLoS One, 2010, 5, e9490 Search PubMed.
- J. N. Paulson, O. C. Stine, H. C. Bravo and M. Pop, Differential abundance analysis for microbial marker-gene surveys, Nat. Methods, 2013, 10, 1200–1202 CrossRef CAS PubMed.
- H. Kim, K. Dan, H. Shin, J. Lee, J. I. Wanga and D. Han, An efficient method for high-pH peptide fractionation based on C18 StageTips for in-depth proteome profiling, Anal. Methods, 2019, 11, 4693–4698 Search PubMed.
- P. Skowronek, M. Thielert, E. Voytik, M. C. Tanzer, F. M. Hansen, S. Willems, O. Karayel, A. D. Brunner, F. Meier and M. Mann, Rapid and In-Depth Coverage of the (Phospho-)Proteome With Deep Libraries and Optimal Window Design for dia-PASEF, Mol. Cell. Proteomics, 2022, 21, 100279 CrossRef CAS PubMed.
- F. Yu, S. E. Haynes, G. C. Teo, D. M. Avtonomov, D. A. Polasky and A. I. Nesvizhskii, Fast Quantitative Analysis of timsTOF PASEF Data with MSFragger and IonQuant, Mol. Cell. Proteomics, 2020, 19, 1575–1585 CrossRef CAS PubMed.
- A. T. Kong, F. V. Leprevost, D. M. Avtonomov, D. Mellacheruvu and A. I. Nesvizhskii, MSFragger: ultrafast and comprehensive peptide identification in mass spectrometry-based proteomics, Nat. Methods, 2017, 14, 513–520 CrossRef CAS PubMed.
- G. C. Teo, D. A. Polasky, F. Yu and A. I. Nesvizhskii, Fast Deisotoping Algorithm and Its Implementation in the MSFragger Search Engine, J. Proteome Res., 2021, 20, 498–505 CrossRef CAS PubMed.
- L. Kall, J. D. Canterbury, J. Weston, W. S. Noble and M. J. MacCoss, Semi-supervised learning for peptide identification from shotgun proteomics datasets, Nat. Methods, 2007, 4, 923–925 CrossRef PubMed.
- A. I. Nesvizhskii, A. Keller, E. Kolker and R. Aebersold, A statistical model for identifying proteins by tandem mass spectrometry, Anal. Chem., 2003, 75, 4646–4658 CrossRef CAS PubMed.
- F. da Veiga Leprevost, S. E. Haynes, D. M. Avtonomov, H. Y. Chang, A. K. Shanmugam, D. Mellacheruvu, A. T. Kong and A. I. Nesvizhskii, Philosopher: a versatile toolkit for shotgun proteomics data analysis, Nat. Methods, 2020, 17, 869–870 CrossRef CAS PubMed.
- V. Demichev, C. B. Messner, S. I. Vernardis, K. S. Lilley and M. Ralser, DIA-NN: neural networks and interference correction enable deep proteome coverage in high throughput, Nat. Methods, 2020, 17, 41–44 CrossRef CAS PubMed.
- V. Demichev, L. Szyrwiel, F. Yu, G. C. Teo, G. Rosenberger, A. Niewienda, D. Ludwig, J. Decker, S. Kaspar-Schoenefeld, K. S. Lilley, M. Mulleder, A. I. Nesvizhskii and M. Ralser, dia-PASEF data analysis using FragPipe and DIA-NN for deep proteomics of low sample amounts, Nat. Commun., 2022, 13, 3944 CrossRef CAS PubMed.
- T. V. Pham, A. A. Henneman and C. R. Jimenez, iq: an R package to estimate relative protein abundances from ion quantification in DIA-MS-based proteomics, Bioinformatics, 2020, 36, 2611–2613 CrossRef CAS PubMed.
- B. V. Schomakers, J. Hermans, Y. R. J. Jaspers, G. Salomons, F. M. Vaz, M. van Weeghel and R. H. Houtkooper, Polar metabolomics in human muscle biopsies using a liquid-liquid extraction and full-scan LC-MS, STAR Protoc., 2022, 3, 101302 CrossRef CAS PubMed.
- A. Poli, C. M. Barbagallo, A. F. G. Cicero, A. Corsini, E. Manzato, B. Trimarco, F. Bernini, F. Visioli, A. Bianchi, G. Canzone, C. Crescini, S. de Kreutzenberg, N. Ferrara, M. Gambacciani, A. Ghiselli, C. Lubrano, G. Marelli, W. Marrocco, V. Montemurro, D. Parretti, R. Pedretti, F. Perticone, R. Stella and F. Marangoni, Nutraceuticals and functional foods for the control of plasma cholesterol levels. An intersociety position paper, Pharmacol. Res., 2018, 134, 51–60 CrossRef CAS PubMed.
- A. Singh, C. P. Shannon, B. Gautier, F. Rohart, M. Vacher, S. J. Tebbutt and K.-A. Lê Cao, DIABLO: an integrative approach for identifying key molecular drivers from multi-omics assays, Bioinformatics, 2019, 17, 3055–3062 CrossRef PubMed.
- A. Malapert, V. Tomao, O. Dangles and E. Reboul, Effect of Foods and β-Cyclodextrin on the Bioaccessibility and the Uptake by Caco-2 Cells of Hydroxytyrosol from Either a Pure Standard or Alperujo, J. Agric. Food Chem., 2018, 18, 4614–4620 CrossRef PubMed.
- O. Frumuzachi, H. Kieserling, S. Rohn and A. Mocan, The impact of oleuropein, hydroxytyrosol, and tyrosol on cardiometabolic risa factors: a meta-analysis of randomized controlled trials, Crit. Rev. Food Sci. Nutr., 2025, 1–21 CrossRef PubMed.
- E. Jung, S. Y. Kong, Y. S. Ro, H. H. Ryu and S. D. Shin, Serum Cholesterol Levels and Risk of Cardiovascular Death: A Systematic Review and a Dose-Response Meta-Analysis of Prospective Cohort Studies, Int. J. Environ. Res. Public Health, 2022, 19(14), 8272 CrossRef CAS PubMed.
- V. J. van den Berg, M. M. Vroegindewey, I. Kardys, E. Boersma, D. Haskard, A. Hartley and R. Khamis, Anti-Oxidized LDL Antibodies and Coronary Artery Disease: A Systematic Review, Antioxidants, 2019, 8(10), 484 CrossRef CAS PubMed.
- J. Liu, F. F. Zeng, Z. M. Liu, C. X. Zhang, W. H. Ling and Y. M. Chen, Effects of blood triglycerides on cardiovascular and all-cause mortality: a systematic review and meta-analysis of 61 prospective studies, Lipids Health Dis., 2013, 12, 159 CrossRef PubMed.
- R. Quiros-Fernandez, B. Lopez-Plaza, L. M. Bermejo, S. P. Milla, A. Zangara and C. G. Candela, Oral Supplement Containing Hydroxytyrosol and Punicalagin Improves Dyslipidemia in an Adult Population without Co-Adjuvant Treatment: A Randomized, Double-Blind, Controlled and Crossover Trial, Nutrients, 2022, 14(9), 1879 CrossRef CAS PubMed.
- S. D'Addato, L. Scandiani, G. Mombelli, F. Focanti, F. Pelacchi, E. Salvatori, G. D. Loreto, A. Comandini, P. Maffioli and G. Derosa, Effect of a food supplement containing berberine, monacolin K, hydroxytyrosol and coenzyme Q(10) on lipid levels: a randomized, double-blind, placebo controlled study, Drug Des., Dev. Ther., 2017, 11, 1585–1592 CrossRef.
- N. Hermans, A. Van der Auwera, A. Breynaert, A. Verlaet, T. De Bruyne, L. Van Gaal, L. Pieters and V. Verhoeven, A red yeast rice-olive extract supplement reduces biomarkers of oxidative stress, OxLDL and Lp-PLA(2), in subjects with metabolic syndrome: a randomised, double-blind, placebo-controlled trial, Trials, 2017, 18, 302 CrossRef PubMed.
- V. Verhoeven, A. Van der Auwera, L. Van Gaal, R. Remmen, S. Apers, M. Stalpaert, J. Wens and N. Hermans, Can red yeast rice and olive extract improve lipid profile and cardiovascular risk in metabolic syndrome?: A double blind, placebo controlled randomized trial, BMC Complementary Altern. Med., 2015, 15, 52 CrossRef PubMed.
- S. S. Shklyaev, G. A. Melnichenko, N. N. Volevodz, N. A. Falaleeva, S. A. Ivanov, A. D. Kaprin and N. G. Mokrysheva, Adiponectin: a pleiotropic hormone with multifaceted roles, Probl. Endokrinol., 2021, 67, 98–112 CrossRef CAS PubMed.
- Z. Zhou, C. Liu, S. Xu, J. Wang, F. Guo, S. Duan, Q. Deng, J. Sun, F. Yu, Y. Zhou, M. Wang, Y. Wang, L. Zhou, H. Jiang and L. Yu, Metabolism regulator adiponectin prevents cardiac remodeling and ventricular arrhythmias via sympathetic modulation in a myocardial infarction model, Basic Res. Cardiol., 2022, 117, 34 CrossRef CAS PubMed.
- E. Scoditti, M. Massaro, M. A. Carluccio, M. Pellegrino, M. Wabitsch, N. Calabriso, C. Storelli and R. D. Caterina, Additive regulation of adiponectin expression by the mediterranean diet olive oil components oleic Acid and hydroxytyrosol in human adipocytes, PLoS One, 2015, 10, e0128218 CrossRef PubMed.
- J. Ruano, J. López-Miranda, R. de la Torre, J. Delgado-Lista, J. Fernández, J. Caballero, M. I. Covas, Y. Jiménez, P. Pérez-Martínez, C. Marín, F. Fuentes and F. Pérez-Jiménez, Intake of phenol-rich virgin olive oil improves the postprandial prothrombotic profile in hypercholesterolemic patients, Am. J. Clin. Nutr., 2007, 86(2), 341–346 CrossRef CAS PubMed.
- P. Binou, A. Stergiou, O. Kosta, N. Tentolouris and V. T. Karathanos, Positive contribution of hydroxytyrosol-enriched wheat bread to HbA(1)c levels, lipid profile, markers of inflammation and body weight in subjects with overweight/obesity and type 2 diabetes mellitus, Eur. J. Nutr., 2023, 62, 2165–2176 CrossRef CAS PubMed.
- M. Kannan, F. Ahmad and R. Saxena, Platelet activation markers in evaluation of thrombotic risk factors in various clinical settings, Blood Rev., 2019, 37, 100583 CrossRef CAS PubMed.
- J. P. De La Cruz Cortes, L. Vallejo-Carmona, M. M. Arrebola, E. Martin-Aurioles, M. D. Rodriguez-Perez, L. Ortega-Hombrados, C. Verdugo, M. A. Fernandez-Prior, A. Bermudez-Oria and J. A. Gonzalez-Correa, Synergistic Effect of 3′,4′-Dihidroxifenilglicol and Hydroxytyrosol on Oxidative and Nitrosative Stress and Some Cardiovascular Biomarkers in an Experimental Model of Type 1 Diabetes Mellitus, Antioxidants, 2021, 10(12), 1983 CrossRef CAS PubMed.
- J. A. Gonzalez-Correa, M. D. Navas, J. Munoz-Marin, M. Trujillo, J. Fernandez-Bolanos and J. P. de la Cruz, Effects of hydroxytyrosol and hydroxytyrosol acetate administration to rats on platelet function compared to acetylsalicylic acid, J. Agric. Food Chem., 2008, 56, 7872–7876 CrossRef CAS PubMed.
- D. Mizutani, T. Onuma, K. Tanabe, A. Kojima, K. Uematsu, D. Nakashima, T. Doi, Y. Enomoto, R. Matsushima-Nishiwaki, H. Tokuda, S. Ogura, H. Iida, O. Kozawa and T. Iwama, Olive polyphenol reduces the collagen-elicited release of phosphorylated HSP27 from human platelets, Biosci., Biotechnol., Biochem., 2020, 84, 536–543 CrossRef CAS PubMed.
- B. de Roos, X. Zhang, G. R. Gutierrez, S. Wood, G. J. Rucklidge, M. D. Reid, G. J. Duncan, L. L. Cantlay, G. G. Duthie and N. O'Kennedy, Anti-platelet effects of olive oil extract: in vitro functional and proteomic studies, Eur. J. Nutr., 2011, 50, 553–562 CrossRef PubMed.
- C. L. Leger, M. A. Carbonneau, F. Michel, E. Mas, L. Monnier, J. P. Cristol and B. Descomps, A thromboxane effect of a hydroxytyrosol-rich olive oil wastewater extract in patients with uncomplicated type I diabetes, Eur. J. Clin. Nutr., 2005, 59, 727–730 CrossRef CAS PubMed.
- L. Micheli, L. Bertini, A. Bonato, N. Villanova, C. Caruso, M. Caruso, R. Bernini and F. Tirone, Role of Hydroxytyrosol, Oleuropein in the Prevention of Aging and Related Disorders: Focus on Neurodegeneration, Skeletal Muscle Dysfunction and Gut Microbiota, Nutrients, 2023, 15(7), 1767 CrossRef CAS PubMed.
- P. Louca, A. Nogal, P. M. Wells, F. Asnicar, J. Wolf, C. J. Steves, T. D. Spector, N. Segata, S. E. Berry, A. M. Valdes and C. Menni, Gut microbiome diversity and composition is associated with hypertension in women, J. Hypertens., 2021, 39, 1810–1816 CrossRef CAS PubMed.
- M. Romani-Perez, I. Lopez-Almela, C. Bullich-Vilarrubias, L. Rueda-Ruzafa, E. M. Gomez Del Pulgar, A. Benitez-Paez, G. Liebisch, J. A. Lamas and Y. Sanz, Holdemanella biformis improves glucose tolerance and regulates GLP-1 signaling in obese mice, FASEB J., 2021, 35, e21734 CrossRef CAS PubMed.
- Y. Liu, W. Huan, J. Wu, S. Zou and L. Qu, IGFBP6 Is Downregulated in Unstable Carotid Atherosclerotic Plaques According to an Integrated Bioinformatics Analysis and Experimental Verification, J. Atheroscler. Thromb., 2020, 27, 1068–1085 CrossRef CAS PubMed.
- S. A. Hardy, L. Liesinger, R. Patrick, M. Poettler, L. Rech, J. Gindlhuber, N. S. Mabotuwana, D. Ashour, V. Stangl, M. Bigland, L. A. Murtha, M. R. Starkey, D. Scherr, P. M. Hansbro, G. Hoefler, G. Campos Ramos, C. Cochain, R. P. Harvey, R. Birner-Gruenberger, A. J. Boyle and P. P. Rainer, Extracellular Matrix Protein-1 as a Mediator of Inflammation-Induced Fibrosis After Myocardial Infarction, JACC Basic Transl. Sci., 2023, 8(12), 1539–1554 CrossRef PubMed.
- J. Tome-Carneiro, M. C. Crespo, E. Garcia-Calvo, J. L. Luque-Garcia, A. Davalos and F. Visioli, Proteomic evaluation of mouse adipose tissue and liver following hydroxytyrosol supplementation, Food Chem. Toxicol., 2017, 107, 329–338 CrossRef CAS PubMed.
- U. Catalán, L. Rubio, M. C. López de las Hazas, P. Herrero, P. Nadal, N. Canela, A. Pedret, M. J. Motilva and R. Solà, Hydroxytyrosol and its complex forms (secoiridoids) modulate aorta and heart proteome in healthy rats: Potential cardio-protective effects, Mol. Nutr. Food Res., 2016, 60(10), 15 CrossRef PubMed.
- U. Catalán, M. C. López, de las Hazas, L. Rubio, S. Fernández-Castillejo, A. Pedret, R. de la Torre, M. J. Motilva and R. Solà, Protective effect of hydroxytyrosol and its predominant plasmatic human metabolites against endothelial dysfunction in human aortic endothelial cells, Mol. Nutr. Food Res., 2015, 59(12), 2523–2536 CrossRef PubMed.
- J. A. López-Villodres, M. Abdel-Karim, J. P. de la Cruz, M. D. Rodríguez-Pérez, J. J. Reyes, R. Guzmán-Moscoso, G. Rodríguez-Pérez, J. Fernández-Bolaños and J. A. González-Correa, Effects of hydroxytyrosol on cardiovascular biomarkers in experimental diabetes mellitus, J. Nutr. Biochem., 2016, 37, 94–100 CrossRef PubMed.
- O. Bakhta, A. Pascaud, X. Dieu, J. Beaumont, J. K. Nzoughet, R. Kamel, M. Croyal, S. Tamareille, G. Simard, J. M. C. de la Barca, P. Reynier, F. Prunier and D. Mirebeau-Prunier, Tryptophane–kynurenine pathway in the remote ischemic conditioning mechanism, Basic Res. Cardiol., 2020, 115, 13 CrossRef CAS PubMed.
- P. O. Ljungdahl and B. Daignan-Fornier, Regulation of amino acid, nucleotide, and phosphate metabolism in Saccharomyces cerevisiae, Genetics, 2012, 190, 885–929 CrossRef CAS PubMed.
- H. Jefferies, J. Coster, A. Khalil, J. Bot, R. D. McCauley and J. C. Hall, Glutathione, ANZ J. Surg., 2003, 73, 517–522 CrossRef PubMed.
- A. P. Sousa, D. M. Cunha, C. Franco, C. Teixeira, F. Gojon, P. Baylina and R. Fernandes, Which Role Plays 2-Hydroxybutyric Acid on Insulin Resistance?, Metabolites, 2021, 11(12), 835 CrossRef CAS PubMed.
- D. Tsoukatos, C. A. Demopoulos, A. D. Tselepis, M. C. Moschidis, A. Donos, A. Evangelou and J. Benveniste, Inhibition by cardiolipins of platelet-activating factor-induced rabbit platelet activation, Lipids, 1993, 28, 1119–1124 CrossRef CAS PubMed.
- M. Buyukozkan, S. Álvarez-Mullet, A. C. Racanelli, F. Schmidt, R. Batra, K. L. Hoffman, H. Sarwath, R. Engelke, L. Gomez-Escobar, W. Simmons, E. Benedetti, K. Chetnik, G. Zhang, E. Schenck, K. Suhre, J. J. Choi, Z. Zhao, S. Racine-Brzostek, H. S. Yang, M. E. Choi, A. M. K. Choi, S. J. Cho and J. Krumsiek, Integrative metabolomic and proteomic signatures define clinical outcomes in severe COVID-19, iScience, 2022, 25(7), 104612 CrossRef CAS PubMed.
- Y. Zhang, L. Yuan, J. Shi, J. Zhao, C. Tan, Y. Liu and Y. J. Xu, Multi-omics revealed anti-fatigue property of polyphenol from areca nut, Phytomedicine, 2024, 132, 155838 CrossRef CAS PubMed.
- E. Sanz-Girgas, O. M. Peiró, G. Bonet, J. Rodríguez-López, C. Scardino, M. Ferrero-Guillem, K. Vásquez, A. Romeu-Nieto and A. Bardají, A simple combination of biomarkers for risk stratification in octogenarians with acute myocardial infarction, Rev. Cardiovasc. Med., 2021, 4, 1711–1720 CrossRef PubMed.
- X. R. Zhang, W. F. Zhong, R. Y. Liu, J. L. Huang, J. X. Fu, J. Gao, P. D. Zhang, D. Liu, Z. H. Li, Y. He, H. Zhou and Z. Li, Improved prediction and risk stratification of major adverse cardiovascular events using an explainable machine learning approach combining plasma biomarkers and traditional risk factors, Cardiovasc. Diabetol., 2025, 1, 153 CrossRef PubMed.
- A. Pedret, U. Catalán, S. Fernández-Castillejo, M. Farràs, R. M. Valls, L. Rubió, N. Canela, G. Aragonés, M. Romeu, O. Castañer, R. de la Torre, M. I. Covas, M. Fitó, M. J. Motilva and R. Solà, Impact of Virgin Olive Oil and Phenol-Enriched Virgin Olive Oils on the HDL Proteome in Hypercholesterolemic Subjects: A Double Blind, Randomized, Controlled, Cross-Over Clinical Trial (VOHF Study), PLoS One, 2015, 6, e129160 Search PubMed.
- A. Romani, F. Leri, S. Urciuoli, A. Noce, G. Marrone, C. Nediani and R. Bernini, Health Effects of Phenolic Compounds Found in Extra-Virgin Olive Oil, By-Products, and Leaf of Olea europaea L, Nutrients, 2019, 8, 1776 CrossRef PubMed.
- M. Babu and M. Snyder, Multi-Omics Profiling for Health, Mol. Cell. Proteomics, 2023, 6, 100561 CrossRef PubMed.
- M. S. Kim, M. Song, B. Kim, I. Shim, D. S. Kim, P. Natarajan, R. Do and H.-H. Won, Prioritization of therapeutic targets for dyslipidemia using integrative multi-omics and multi-trait analysis, Cell. Rep. Med., 2023, 9, 101112 CrossRef PubMed.
- M. A. Aon, M. Bernier, S. J. Mitchell, C. D. Germanio, J. A. Mattison, M. R. Ehrlich, R. J. Colman, R. M. Anderson and R. de Cabo, Untangling Determinants of Enhanced Health and Lifespan through a Multi-omics Approach in Mice, Cell Metab., 2020, 1, 100–116 CrossRef PubMed.
Footnote |
| † Electronic supplementary information (ESI) available. See DOI: https://doi.org/10.1039/d5fo00874c |
| This journal is © The Royal Society of Chemistry 2025 |