 Open Access Article
 This Open Access Article is licensed under a
 Creative Commons Attribution 3.0 Unported Licence
Nanobeam-scanning X-ray fluorescence microscopy reveals the elemental composition of dense intracellular bodies in biomineralizing coccolithophores†
Daniel M.
Chevrier
 *a,
Shristy
Gautam
a and
André
Scheffel
b
*a,
Shristy
Gautam
a and
André
Scheffel
b
aAix-Marseille Université, CNRS, CEA, BIAM, UMR7265 Institut de Biosciences and Biotechnologies d’Aix-Marseille, CEA Cadarache, F-13108 Saint-Paul-lez-Durance, France. E-mail: daniel.chevrier@cea.fr
bUniversity of Greifswald, Institute of Microbiology, Felix-Hausdorff-Straße 8, 17489 Greifswald, Germany
First published on 5th March 2025
Abstract
Coccolithophore microalgae intracellularly produce nanostructured calcitic platelets, known as coccoliths, through a biologically-controlled mineralization process. Mature coccoliths are secreted to the cell surface and assembled into a shell that envelops the cell. The large-scale global production of coccoliths, followed by their sedimentation to the ocean floor, significantly contributes to carbon cycling. Despite progress in understanding the biomineralization pathway of coccoliths, we are still limited in our ability to predict how future climate conditions will impact coccolith formation and thus ocean carbon fluxes. Investigating coccolith biomineralization at the single-cell level is therefore critical to advance our understanding but remains challenging since current imaging techniques lack the combined spatial and temporal resolution coupled with element-specific detection to follow processes in situ. In light of this gap, nanobeam-scanning X-ray fluorescence microscopy (nano-XRF) in the hard X-ray regime is employed here to investigate the intracellular elemental distribution of the coccolithophore Gephyrocapsa huxleyi (formerly Emiliania huxleyi) achieving a resolution of 100 nm and elemental detection from phosphorus (P) to zinc (Zn). Calcium- and phosphorus-rich intracellular bodies, previously proposed to be involved in coccolith biomineralization, were observed in cells initially prepared ex situ by drying. Interestingly, nano-XRF imaging reveals metal species (e.g., Mn, Fe, Zn) within these bodies that were not detected in earlier studies, suggesting multiple biological roles for these structures. Moving towards native-state imaging, G. huxleyi was then imaged in the hydrated state using a dedicated liquid cell device. Measurements were performed on G. huxleyi cells both with and without coccolith shell in sea water medium and compared to those of dried cells, demonstrating comparable image quality. The future potential and limitations of liquid cell nano-XRF imaging for coccolithophores and other microorganisms are further discussed.
Introduction
Coccolithophore microalgae are single-cell phytoplankton that produce calcite platelets called coccoliths. Coccolithophores and detached coccoliths are found in the surface waters of most marine environments. Coccoliths are intricate, nanostructured calcium carbonate (CaCO3) biominerals, which vary in shape, crystal organization and size according to species. They are formed inside the cell and eventually exocytosed to the cell surface, creating an exterior layer known as a coccosphere, which covers the microalgal cell.Although coccoliths are relatively small, ranging from 0.5–15 μm in size,1 the immense quantity and wide distribution of coccolithophores makes them one of the most productive calcium carbonate builders on the planet.2 Therefore, in addition to their ecological importance as primary producers (i.e., converting sunlight and CO2 into organic material), calcification activity of coccolithophores (e.g., production and sedimentation of coccoliths) has a major impact on the oceanic carbon cycle.3 A large number of studies have revealed mixed responses of coccolithophores to future climate change conditions, specifically ocean acidification.4–6 Therefore, understanding calcite biomineralization in coccolithophores is not only of fundamental research interest but also of environmental importance.
Coccoliths are typically produced one by one within an intracellular space known as the coccolith vesicle.3 Here, nanocrystals of calcite precipitate and grow under strict (bio-)chemical conditions and spatial confinement that direct the final coccolith architecture. Electron microscopy studies are now shedding light on crystal growth mechanisms.7,8 Before these processes take place in the coccolith vesicle, the coccolithophore cell must uptake and transport the precursor ions for calcite formation (e.g., HCO3−, Ca2+) to the site of mineralization. The recent discovery of calcium- and phosphorus-rich intracellular bodies in coccolithophores has inspired the hypothesis that these bodies serve as concentrated reservoirs of Ca2+, assisting in the storage and transport of calcium for calcification.9,10 Such Ca-rich bodies have been observed in Gephyrocapsa huxleyi (formerly Emiliania huxleyi) and Chrysotila carterae (formerly Pleurochrysis carterae) within vacuole-like compartments and small Golgi-derived vesicles, respectively.11–13 These bodies are also concentrated in (poly-)phosphate or acidic polysaccharides, which likely acts as a chelator of Ca2+ and other cations.11,14 It has been proposed that these bodies may resemble acidocalcisomes15 though the biological link between them is undetermined.
A remaining gap in understanding coccolithophore calcification is how the intracellular composition, in particular the composition and presence of the reported Ca-rich bodies, changes in response to mineralization activity or external environmental factors. While previous research efforts employ cryo-electron and cryo-X-ray microscopy techniques to provide high spatial resolution imaging,7,11,13 they are relatively low-throughput techniques considering the dedicated sample preparation required, which impedes investigations on single-cell level dynamics of biomineralization. At the lower spatial resolution regime, confocal microscopy can follow individual cells with high temporal resolution at timescales of coccolith formation.16,17 However, confocal microscopy relies on fluorophore staining and has limited sensitivity to detect biological and chemical changes. Recent studies on microalgal cell composition and structure are turning to X-ray fluorescence-based microscopy techniques that provide full cell imaging with subcellular resolution and a broad range of detectable elements.18–21 X-ray-based imaging methods generally allow for deeper penetration into biological samples compared to electron-based imaging. However, radiation damage should still be considered, especially for imaging at high spatial resolution.22 For instance, X-ray beam-scanning imaging at high resolution (i.e., scanning step equal to X-ray beam size) requires longer acquisition times to maintain adequate signal-to-noise levels compared to lower resolution imaging, which in turn increases the radiation dose.
The work presented herein demonstrates how synchrotron-based nanobeam-scanning X-ray fluorescence microscopy (nano-XRF) can reveal the elemental composition from P to Zn of individual coccolithophores with 100 nm spatial resolution and under ambient conditions dried or in liquid. Samples of G. huxleyi were first prepared from actively calcifying cultures for ex situ measurements to identify detectable elements pertaining to coccolith structures and the microalgae. Particular emphasis was made on ion-rich intracellular bodies in G. huxleyi and how the composition changes across cells and sample condition. After demonstrating the imaging possibilities of nano-XRF for dry coccolithophore cells, samples were measured in their hydrated native-state by employing a liquid cell device. G. huxleyi was measured with and without exterior coccoliths to demonstrate single-cell imaging in liquid and to measure the dense intracellular body composition. Further discussion is then given on employing liquid cell nano-XRF for the study of coccolithophores and other microorganisms.
Materials and methods
Coccolithophore culturing and sample preparation for nano-XRF
Gephyrocapsa huxleyi (strain AWI1516 and RCC1731) were cultivated in the artificial sea water medium Aquil at 20 °C with a 12/12 h light/dark cycle using a full spectrum LED light source (Sansi) at 100 μE. Cultures were grown in batch condition using sterile and stoppered glass flasks with a large headspace. Coccolithophore samples were deposited on either TEM grids or Si3N4 substrates for nano-XRF imaging. Specifically, 5 μL of coccolithophore culture was deposited on the sample substrate and left to sediment for at least 10 min before the drop of media was removed by filter paper. A washing solution of 50 mM NaHCO3 (pH 8.0) was then used to dilute the salt concentration by successive washing steps of the substrate surface. Finally, alkaline Milli-Q water (18.2 Ω cm) was used to wash the substrates before final drying.Decalcification treatment and re-calcification of G. huxleyi
Cells without extracellular coccoliths were prepared according to previous protocols.10,11 Briefly, a 0.5 M ethylenediaminetetraacetic acid (EDTA) solution (pH 8.0) was added to a culture of G. huxleyi at 1/100 volume to obtain a final concentration of 5 mM EDTA. EDTA is a chelating agent that binds to divalent cations such as calcium (Ca2+), effectively sequestering them and thus dissolving calcite minerals. After 5–10 min of incubation at 20 °C with gentle mixing, the culture is virtually free of all exterior coccoliths. Samples were centrifuged at 1000g for 10 min, resuspended in fresh Aquil medium and prepared for nano-XRF measurement using the abovementioned protocol. For samples at early stage coccosphere formation, the EDTA-treated culture was washed three times with fresh Aquil medium and left to incubate at 20 °C and 100 μE for 4 h.Liquid cell device for native-state measurements of G. huxleyi
Silicon nitride membrane (SiN) materials and liquid cell device used for liquid phase measurements were acquired from Protochips (Echips, Poseidon Select). These materials are composed of a Si wafer base with a 50 nm layer of SiNx (x ≈ 1.3–1.5) on top. Distinct top and bottom SiN materials are used (see Fig. 6), both having an imaging window of 50 × 550 μm2 (etched from Si substrate side, leaving exposed SiN). The bottom layer had a spacer height of 5 μm. The spacer material is made of SU-8 photoresist. A custom-made liquid cell holder fabricated by the I14 beamline of Diamond Light Source (Oxfordshire, UK) was used to assemble and house the two SiN materials. SiN materials were first plasma cleaned (Fischione NanoClean, Model 1070) before preparing the liquid cell. Directly after plasma cleaning, the SiN material with SU-8 spacer is placed spacer side-up in the custom liquid cell holder. 1–2 μL of coccolithophore culture (cell concentration ∼1 × 10⁷ cells per mL, concentrated by centrifugation at 1000g for 10 min) is deposited on the bottom SiN material. The second SiN material is then placed on top of the deposited drop of coccolithophores and aligned with the imaging window region of the SiN material below. Once sufficient overlap of the imaging windows is made, which ensures X-ray and ambient light transmission through the liquid cell, a faceplate is secured over the two SiN materials to create a seal between them. The liquid cell device is first imaged with an optical microscope before mounting on the sample stage in the beamline. Coccolithophores were measured under static liquid cell condition, meaning no media flow was applied.Nanobeam-scanning X-ray fluorescence microscopy
Measurements were conducted at the I14 nanoprobe of Diamond Light Source (Oxfordshire, UK). Samples measured in dried condition were prepared on transmission electron microscopy grids or Si3N4 membranes (Silson Ltd). All measurements were conducted under ambient pressure and temperature using an incident photon energy of 8, 10 or 11.5 keV. In particular, dried EDTA-treated and early stage calcification samples were imaged with 8 keV incident X-ray energy. As a result, Zn Kα XRF signal could not be measured for these datasets (Fig. 3 and 4). The focused X-ray beam was ∼60 nm (FWHM) in diameter. X-ray fluorescence (XRF) was collected from the front of the sample using a four-element silicon drift detector (RaySpec, UK).23 A raster scanning step size of 50–100 nm was used with an exposure time of 30–60 ms per pixel to collect high-resolution XRF maps. High-resolution mapping of liquid cell samples used 100 nm and 15–30 ms exposure time. A photon-counting Merlin detector (Quantum Detectors, UK) was used in transmission configuration to collect X-ray scattering for generating phase gradient images (referred to as phase contrast imaging below). Detailed information on how the transmitted signal was transformed, including masking of the beam, background intensity adjustment, and phase integration, is described by Quinn et al.24 PyMCA 5.6.7 software was used to energy calibrate XRF spectra, background subtraction, fit XRF sum-spectra and export XRF maps for individual emission lines (e.g., Ca Kα). ImageJ was used to further render XRF maps. ImageJ was also used to measure the diameter of dense intracellular bodies using the full width half maximum distance from line profiles. All XRF maps are presented with linear-based intensity scales unless otherwise mentioned in the figure caption.Scanning electron microscopy
Scanning electron microscopy (SEM) imaging was conducted with a Zeiss Sigma 300 VP. G. huxleyi was prepared for imaging according to the protocol mentioned above for nano-XRF except for the use of silicon as substrate. A thin layer of carbon (∼10 nm) was deposited on the samples before loading samples into the instrument. Imaging was conducted using secondary electron detection mode under vacuum (1 × 10⁻⁶ bar) at 3 kV.Results
Intact coccospheres and detached coccoliths of Gephyrocapsa huxleyi are shown in Fig. 1a. From this scanning electron microscopy image, only coccoliths are discernible since the microalgal cell is fully enveloped by them. When G. huxleyi cells were examined by nanobeam-scanning X-ray fluorescence microscopy (nano-XRF) a combination of structural and elemental information can be collected. Fig. 1b outlines a simplified experimental set-up for nano-XRF imaging. An incident X-ray beam ∼60 nm in diameter is focused on a sample mounted in the normal position to the beam. The sample is raster-scanned in two dimensions using continuous on-the-fly scanning where data is collected at each recorded pixel or step size. X-ray fluorescence (XRF) events from core-level excitation/de-excitation processes (e.g., Ca Kα fluorescence) are collected in the forward scattering direction. Deflected X-rays from elastic scattering are detected behind the sample to produce a phase contrast image. The total XRF spectrum from a coccolithophore cell is presented below in Fig. 1b with all major elemental fluorescence contributions. While many elements are detected, some are from the materials used to construct the beamline (e.g., Cr, Al), elements found in the atmosphere (e.g., Ar), from sample substrate (e.g., Si, Cu) or from salt impurities (e.g., Cl). Nevertheless, the change in XRF intensity of each element across the sample reveals the elements that pertain to coccolithophores. | ||
| Fig. 1 (a) Scanning electron microscopy image of G. huxleyi. (b) Experimental set-up for nanobeam-scanning X-ray fluorescence microscopy and phase contrast measurements with example of fitted X-ray fluorescence (XRF) spectrum of G. huxleyi below. Dried G. huxleyi cell with coccosphere shown with (c) X-ray phase contrast, (d) Ca Kα XRF, (e) S Kα XRF and (f) a composite map of Ca and S XRF. The arrow in (c) points to high contrast material which is likely to represent the majority of the collapsed cell, which has shrunk upon drying. Intensity scale shown as XRF counts. Scale bar 2 μm. | ||
Fig. 1c presents the X-ray phase contrast image of a single G. huxleyi cell. Elliptical structures resembling coccoliths within a circular ring representing the coccosphere are evident due to their high contrast, along with high contrast material within the coccosphere likely representing the dry algal cell. Note that the high energy X-ray beam penetrates the entire sample. For this reason, the phase contrast image is convoluted by overlapping coccoliths opposite to each other in the coccosphere and the dried microalgal cell. Fig. 1d and e present Ca Kα and S Kα X-ray fluorescence of the same cell as in Fig. 1c, respectively. The XRF intensity of each pixel is presented on a continuous color scale, which was extrapolated from the fitted XRF peak for each element (see Fig. 1b for example). The Ca Kα XRF map shows coccoliths from opposite sides of the coccosphere as explained for the phase contrast image. The S Kα XRF shows a weaker emission and distribution pattern that is distinct from that of calcium. As sulfur is present in proteins and also in certain lipids and polysaccharides, the S Kα XRF signal provides a marker for cellular material that would otherwise give low contrast at hard X-ray energies. A composite image of these two XRF signals is shown in Fig. 1f to distinguish the coccosphere outside and the cellular material inside.
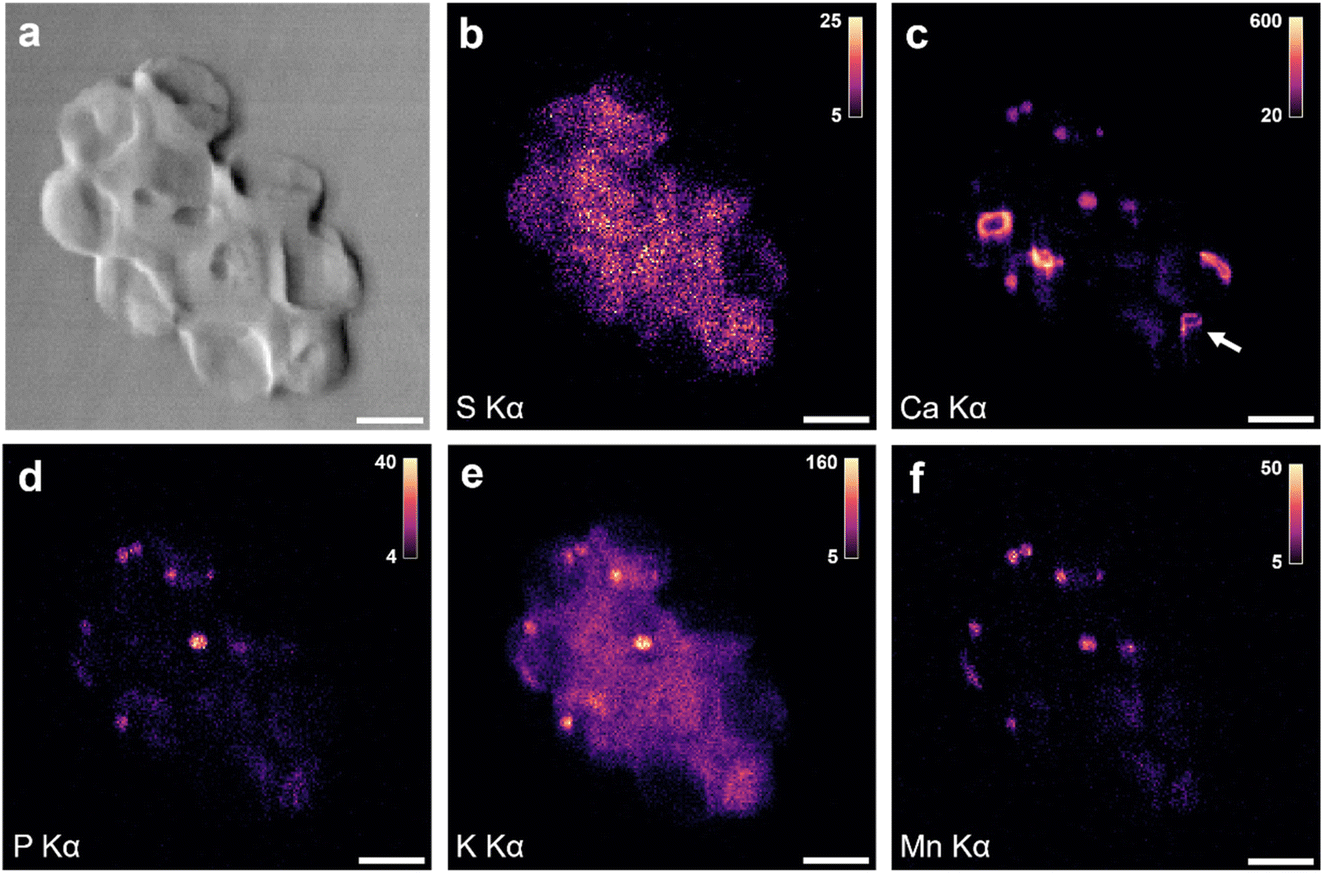
When more cells were imaged, additional structures were found. Fig. 2 shows XRF maps of an aggregate of four coccolith-bearing G. huxleyi. Once more, Ca Kα XRF (Fig. 2a) shows coccoliths and S Kα XRF (Fig. 2b) the distribution of cellular material. For two of the four cells, XRF signals from P, K, Mn, Fe and Zn are detected (Fig. 2c–g), pertaining mainly to small round bodies. The overlay of Mn, Fe and Zn XRF maps reveals significant co-localization (Fig. 2h). This pattern aligns with the characteristics of acidocalcisomes in other organisms, which are known to store such ions together.20 We therefore propose that the P, K, Mn, Fe, and Zn XRF signals originate from the same subcellular structures, and, due to their diverse metal ion content, we designate them as “ion-rich” bodies in this study. Nano-XRF cannot distinguish the valence of transition metal ion species, therefore the charge of each metal ion is not specifically indicated but is assumed to be divalent (e.g., Mn2+, Zn2+) or trivalent (Fe3+) under ambient conditions. A composite XRF image of S and a few of the detected metal ions (Fig. 2h) shows that the location of these bodies coincides with the organic material of individual cells, which suggests them to be of cellular origin rather than extracellular contaminations. Previous cytological studies of G. huxleyi have not revealed bodies with metal ions such as Mn, Fe and Zn.11,13,25 Additional structures are observed in the K Kα XRF map (Fig. 2d) that coincide with parts of the S signal, suggesting a cellular origin of the signal. Indeed, K is an important component of cells, used alongside other ions to regulate osmotic pressure and pH.26,27 The presence of Ca in the ion-rich bodies could not be determined for this sample due to the strong XRF intensities from calcite crystals in coccoliths that made extracting the weaker Ca XRF signal from other structures unreliable. This raised the question of whether Ca could also be a component of the detected ion-rich bodies.
 | ||
| Fig. 2 Nano-XRF analysis of dried, coccolith-bearing G. huxleyi showing (a) Ca Kα XRF, (b) S Kα XRF, (c) P Kα XRF, (d) K Kα XRF, (e) Mn Kα XRF, (f) Fe Kα XRF, and (g) Zn Kα XRF maps. (h) Composite map of Mn, Fe, Zn, and S XRF signals. Intensity scale shown as XRF counts. Scale bar 2 μm. | ||
To clarify this question, a chemical treatment with EDTA (see Materials and methods) was performed to dissolve the coccoliths in the coccosphere. Fig. 3 presents X-ray phase contrast and XRF maps for an aggregate of 10 coccosphere-free (i.e., naked) G. huxleyi cells. The S Kα XRF (Fig. 3b) signal shows the position of the cells and coincides with the high density material in the phase contrast image (Fig. S1† displays fitted XRF spectrum). In the Ca Kα XRF map, four ring-like structures are visible (Fig. 3c), which look reminiscent of coccoliths. Coccoliths can escape EDTA dissolution only when being still within the coccolith vesicle, as EDTA cannot pass intact membranes, and therefore these rings are presumably nascent coccoliths. The arrow in Fig. 3c points to one ring structure that appears to be in the proto-coccolith stage, containing only small calcite nanocrystals, as shortly after the nucleation phase and before the crystals start growing. Additionally, several small bodies are visible in the Ca Kα XRF map, all at locations suggesting them to be intracellular components. Examining P, K and Mn Kα XRF maps (Fig. 3c–f), several small bodies are identified, being present at the same position in all maps and also containing calcium as revealed by the Ca map. The average diameter of these ion-rich bodies was measured to be 550 ± 150 nm from nano-XRF data (see Fig. 5 for example of line profile plots). This size corresponds with Ca–P-rich bodies previously imaged with cryo-FIB-SEM for G. huxleyi.11 This complex elemental composition of the Ca–P-rich bodies was not recognized before with other techniques, demonstrating the potential of nano-XRF in advancing our knowledge on ion-storage pathways and their involvement in calcite formation in coccolithophores. The K Kα XRF map (Fig. 3e) shows strong signal intensity over the area at which the cells are located, as concluded from co-localization with the S XRF signal, and from ion-rich bodies. Fe is weakly detected in the sample and only slightly concentrated in ion-rich bodies compared to the XRF intensity of cell material (Fig. S2†).
 | ||
| Fig. 3 A cluster of dried EDTA-treated G. huxleyi cells shown with (a) X-ray phase contrast imaging, (b) S Kα XRF, (c) Ca Kα XRF, (d) P Kα XRF, (e) K Kα XRF, and (f) Mn Kα XRF. Intensity scale shown as XRF counts. A logarithmic-base intensity scale is used for (c). Arrow in (c) points to proto-coccolith. Scale bar 3 μm. | ||
Previous work hypothesized that Ca- and P-rich bodies in coccolithophores assist in the delivery and/or storage of calcium ions for calcification in the coccolith vesicle.10,11 How these bodies change in composition due to external factors or during calcite formation in the coccolith vesicle is left to be investigated. Nano-XRF could serve as a tool in this regard to probe such intracellular transformations. To investigate this, EDTA-decalcified G. huxleyi cells were returned to standard medium and growth conditions, then left to start rebuilding their coccolith shell for a few hours (see Materials and methods). Fig. 4 shows G. huxleyi cells after 4 h of calcification. The X-ray phase contrast image shows two intact cells and a third likely damaged cell, which is concluded from its horseshoe-like shape (top left of Fig. 4a). In between these three cells there appears to be intracellular material that likely leaked out from the damaged cell, as evidenced by the S XRF signal (Fig. 4b). In Fig. 4c (Ca Kα XRF), coccolith structures are seen in various states of completion and orientation; most of them seem fully formed, due to the presence of shield elements (see larger arrow in Fig. 4c, coccolith from side view), while one lacks shield elements and thus must be an early proto-coccolith stage coccolith (see smaller arrow). Three intracellular bodies rich in Ca are visible in Fig. 4c. For P, K and Mn (Fig. 4d–f), higher XRF intensities can be found in these three Ca-rich bodies but also in two others. These five ion-rich bodies are numbered in Fig. 4d. Similar to the XRF signals from ion-rich bodies in Fig. 3, the relative amount of P, K and Mn appears to differ from one body to another. Additional unidentifiable structures are found at the bottom of the map for Ca, P, K and Mn XRF signals (see asterisks in Fig. 4c). No appreciable Fe XRF signal pertaining to coccolithophore cells or ion-rich bodies was found.
 | ||
| Fig. 4 A collection of dry G. huxleyi cells decalcifying and allowed to recalcify for 4 h shown with (a) X-ray phase contrast imaging, (b) S Kα XRF, (c) Ca Kα XRF (top arrow, coccolith on its side; bottom arrow, proto-coccolith), (d) P Kα XRF (ion-rich bodies are numbered), (e) K Kα XRF and (f) Mn Kα XRF. Intensity scale shown as XRF counts. A logarithmic-base intensity scale is used for (c). Scale bar 3 μm. | ||
To survey the change in ion-rich body elemental composition, select bodies were analyzed from EDTA-treated and calcifying samples (data from Fig. 3 and 4). Bodies with minimal interference from the Ca XRF signal of coccoliths were selected. Fig. 5 displays composite images of these samples with Ca Kα XRF in red and K Kα XRF in yellow, with inspected bodies numbered. XRF intensities are extracted via line profiles associated with each numbered body (see horizontal dotted lines in Fig. 5a and b) and are plotted beside each composite map. Although a quantitative analysis of elemental amounts cannot be made here, since a calibration standard was not measured together with the samples, the relative XRF intensities between elements can be compared because the samples were measured under identical experimental conditions (e.g., the same incident energy, sample substrate, exposure time and step size). Of the mapped elements, Ca, K, Mn and P are consistently found at higher concentrations in ion-rich bodies compared to the surrounding cell material. Fe and S XRF intensities do not vary significantly across ion-rich bodies.
 | ||
| Fig. 5 Composite maps of Ca and K XRF for (a) EDTA-decalcified G. huxleyi and (b) early-stage recalcifying G. huxleyi. Inspected ion-rich bodies are numbered along with a horizontal dotted line that indicates the pixels used to create XRF intensity line profile plots found beside each composite map. Scale bar 3 μm. | ||
The relative composition between Ca, K, Mn and P elements varies from body to body. This is inferred by comparing the maximum XRF intensity for each element across the line profiles in Fig. 5. Therefore, the proportionality of XRF intensities is examined for each body. For EDTA-decalcified G. huxleyi (Fig. 5a), all bodies are rich in Ca and K except for one body having lower amount of Ca (body 2). Mn and P quantities relative to K appear to be similar for this sample. For early stage calcifying cells (Fig. 5b), two out of three bodies are rich in Ca and K except for body 2, which has a lower K XRF intensity compared to Ca. In this body, the relative quantity of Mn is higher compared to all other bodies. The relative intensities of P and Ca XRF appear to be the most conserved across the investigated bodies. From this comparison (Fig. 5a and b), the relative amount of K appears to decrease for ion-rich bodies in the early stage calcifying cells. A conservative conclusion is that bodies are generally rich in Ca, K, Mn and P but that changes in elemental stoichiometry are possible. Whether this is due to body size, the biological state of the coccolithophore before sample preparation, biological heterogeneity or an effect of preparation is to be clarified.
Liquid cell X-ray microscopy is an underdeveloped experimental approach when compared to liquid cell transmission electron microscopy.28 Nevertheless, one advantage for hard X-ray nanoprobe beamlines is that measurements can be performed under ambient conditions with a relatively unencumbered sample environment. This means custom sample environments and liquid cell devices can be implemented at the beamline for in situ measurements.29,30 The advantages of measuring coccolithophores directly in liquid (i.e., native-state) would avoid uncertainties regarding effects of sample preparation. Furthermore, it would allow for the intracellular composition to be directly measured when coccolithophores are exposed to controlled media conditions in the liquid cell environment. Fig. 6 presents the preparation of a liquid cell device for nano-XRF measurement with silicon nitride membrane (SiN) materials (full details in Materials and methods). Importantly, one of the SiN materials used to prepare the liquid cell has a spacer height of 5 μm, which is similar to the typical diameter of a G. huxleyi cell. This ensured minimal cell sedimentation when the liquid cell device is mounted for measurement and minimizes XRF signal from the medium. Coccolithophores are first deposited on a SiN material (containing the spacer) placed horizontally and positioned in the liquid cell device holder (Fig. 6a). A second SiN material is then placed on top and aligned so that the two window regions overlap for light transmission (Fig. 6b). A faceplate cover is then secured and the assembly is turned upright (90°) (Fig. 6c). The liquid cell device is further installed in the beamline (Fig. 6d).
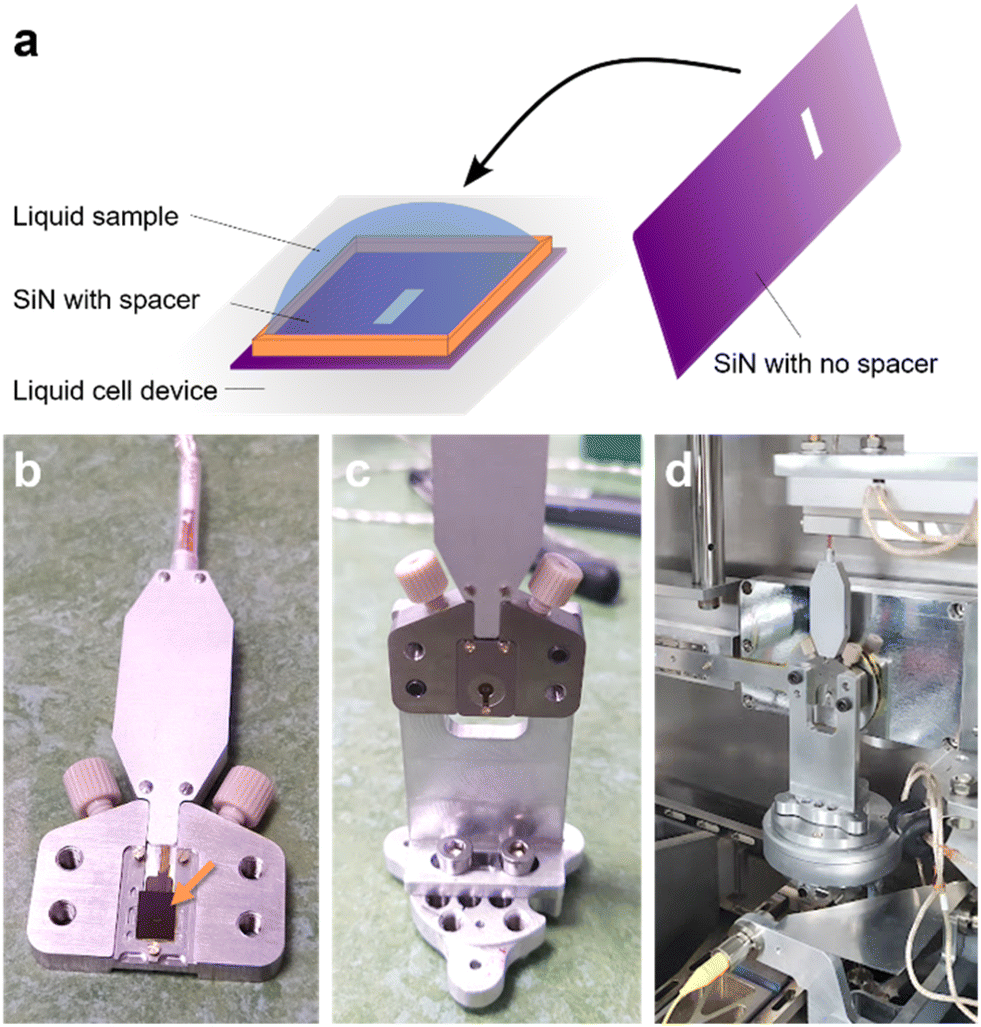 | ||
| Fig. 6 Sample preparation for liquid cell nano-XRF analysis. (a) Schematic illustrating the addition of liquid sample to SiN material situated in liquid cell device holder and a second SiN material being placed on top afterwards. (b) Photo of SiN materials (arrow) assembled in liquid cell sample holder without faceplate cover. (c) Liquid cell holder with faceplate secured and mounted on stage holder. (d) Liquid cell device mounted for measurement at the I14 hard X-ray nanoprobe beamline. | ||
Fig. 7a–d presents X-ray phase contrast image and XRF maps for a single coccosphere-bearing G. huxleyi cell in sea water medium at low scanning resolution. Phase contrast (Fig. 7a) and Ca Kα XRF (Fig. 7b) reveal the coccosphere along with detached coccoliths. Due to the high concentration of chloride salts in the sea water medium, the Cl Kα XRF signal can be used to ensure the liquid cell is retaining the medium by inspecting the background signal (Fig. 7c). The gradient of Cl XRF signal in the medium is likely due to the bulging of the SiN window region under positive pressure from the sealed liquid cell device. Importantly, the Cl XRF signal can also be used to determine the location of hydrated coccolithophore cells since they displace the sea water medium and exhibit a lower Cl concentration in the cytosol than the medium (Fig. 7c). The P Kα XRF signal (Fig. 7d) shows low intensity in the medium but reveals an intracellular body within the coccolithophore cell with higher signal intensity. Fig. S3† shows K and Mn XRF correspond with the intracellular body and S XRF more with the coccolithophore cell. When the same coccolithophore was measured again at higher scanning resolution (Fig. 7e–h), phase contrast and Ca Kα XRF images show a similar level of detail for coccolith structures as found for samples measured in the dried condition (e.g., Fig. 1c and d). An intracellular body is further revealed by the P Kα XRF signal (Fig. 7h). This first liquid cell nano-XRF analysis demonstrates the recovery of ample XRF signal from both coccolith and intracellular body structures in saline medium. It shows that the stability of the liquid cell device on a nano-scanning sample stage can yield datasets of similar quality to those obtained from dried samples.
 | ||
| Fig. 7 A coccosphere-bearing G. huxleyi cell in sea water medium measured at 300 nm scanning resolution with (a) X-ray phase contrast imaging, (b) Ca Kα XRF, (c) Cl Kα XRF, and (d) P Kα XRF. The same coccolithophore cell measured with 100 nm scanning resolution shown with (e) X-ray phase contrast imaging, (f) Ca Kα XRF, (g) Cl Kα XRF and (h) P Kα XRF. Intensity scale shown as XRF counts. Scale bars (a–d) 5 μm and (e–h) 2 μm. | ||
To further examine ion-rich bodies of G. huxleyi in the native-state, EDTA-decalcified G. huxleyi cells were prepared for liquid cell nano-XRF imaging. G. huxleyi cells loaded in the liquid cell device were first confirmed to be in the measurement region by optical microscopy (Fig. S4a†). Once mounted for X-ray measurement, a low resolution XRF map with fast exposure time (500 nm step, 15 ms exposure time) was collected to confirm individual cell locations (Fig. S4b and c†). Fig. 8 presents X-ray phase contrast image and XRF maps for several G. huxleyi cells at higher resolution (Fig. S5† shows the fitted XRF spectrum). The phase contrast image in Fig. 8a shows both intracellular coccoliths and dense bodies, but not the cell bodies as when imaging dry cells. For naked, hydrated coccolithophore cells, the cell body is not apparent likely due to the similar density of the cytosol and the medium. The Cl Kα XRF map (Fig. 8b), however, shows the location of individual cells by the displacement of the sea water medium. Due to the smaller size of decalcified cells (∼3 μm) and the larger spacer height (5 μm), there appears to be some overlap between cells, which is also evident from the optical micrograph (Fig. S4a†).
 | ||
| Fig. 8 A collection of EDTA-treated G. huxleyi cells measured in sea water medium at 100 nm scanning resolution with (a) X-ray phase contrast imaging (top of image cropped because of artifact), (b) Cl Kα XRF, (c) Ca Kα XRF, (d) P Kα XRF, (e) K Kα XRF, and (f) Mn Kα XRF. Intensity scale shown as XRF counts. Line profiles and numbered intracellular bodies are shown in (f) with corresponding XRF intensity plots in the right-side of the figure. Fig. S6† shows S Kα XRF map. Scale bar 2 μm. | ||
The Ca Kα XRF map (Fig. 8c) shows several nascent coccoliths and Ca-rich bodies in the measured region. Some coccolith structures have lower contrast in the phase gradient image, possibly due to the smaller size of the proto-coccoliths compared to mature coccoliths, orientation to the X-ray beam, or the additional background contribution from the liquid cell. The P Kα XRF map shows higher concentrations in six features, with five similar in appearance to ion-rich bodies and the other more dilute and elongated. There is a slightly higher concentration of K in some features (Fig. 8e), although the contrast is weak due to the high background XRF signal from the medium. Features observed in the Mn Kα XRF map align with those in the P Kα XRF map from intracellular bodies (see line profiles), as do Zn XRF signals (Fig. S6†). Fe was also detected, but not in bodies containing Mn, Zn, and P; instead, it appeared as irregular structures. An overlay of Fe and Cl XRF maps suggests this Fe-rich material to be extracellular (Fig. S6†), indicating that they may have been introduced during sample preparation. The Zn signal coincides with the ion-rich bodies. Line profiles for three intracellular bodies were made to extract the XRF intensity for the fitted elements (shown in Fig. 8f, with associated XRF intensity plots presented on the right). For this dataset the relative Ca, P and Mn quantities appear to be similar across the three bodies. Body 1 shows a higher concentration of K compared to the background whereas bodies 2 and 3 do not show higher K content.
Discussion
While nano-XRF has been used to investigate the elemental composition of coccoliths from culture,31,32 it is just beginning to be used to measure entire coccolithophore cells.33 Compared to electron-based spectromicroscopy techniques, the hard X-ray incident beam can penetrate entire coccolithophore cells, circumventing sample thickness limitations and the need for thin-sectioning. The elemental composition of dense intracellular bodies in G. huxleyi was further revealed in this work thanks to the large range of detectable biologically-relevant elements. Notably, the incident hard X-ray energy provided evidence of high Mn content for several of the imaged ion-rich bodies. We note that Mn was in fact detected in Ca-rich bodies of G. huxleyi by Gal et al. using scanning transmission electron microscopy with energy dispersive X-ray spectroscopy (STEM-EDX) but was not discussed in their results.10 Considerable Fe content was found in ion-rich bodies for dried coccosphere-bearing G. huxleyi (Fig. 2f) but was mostly absent in the other samples. At incident X-ray energies >10 keV, Zn was detected in ion-rich bodies (Fig. 2g and S6b†). The modest Zn Kα XRF counts in these maps are due to the high efficiency of core-level electron excitation (i.e., small difference between incident X-ray energy and Zn K-edge absorption energy). Therefore, the quantity of Zn in these structures is likely low. Careful XRF measurements with a calibrated standard (e.g., AXO standard material) will reveal more on the quantitative amounts of these metal species in ion-rich bodies.33,34 The presence of several metal ions in dense intracellular bodies for G. huxleyi strongly suggests these bodies to be involved in biological processes besides calcification (e.g., metal ion and phosphate storage, osmoregulation, pH homeostasis). In fact, the presence of Fe and Zn in addition to Ca, P and K shows a stronger resemblance to acidocalcisome composition observed in other microorganisms.15,20,35Nano-XRF was able to detect intracellular coccoliths at early proto-coccolith stage and ion-rich bodies for G. huxleyi in both dried and liquid condition. For the most part, one ion-rich body was observed per cell. For decalcified G. huxleyi imaged dried (Fig. 3), however, more than one ion-rich body per cell was observed. Previous studies of G. huxleyi have identified the presence of dilute amounts of Ca and P in contact with the more dense ion-rich body11 and a second, presumably polyphosphate-rich body.16 Nevertheless, the drying effects from sample preparation complicate this observation in the presented data. For liquid cell imaging of decalcified cells (Fig. 8), the lower exposure time makes it challenging to detect these additional features. To avoid overlapping cells in the scanning beam direction, which could help distinguish structures from individual cells, the spacer material could be reduced for experiments with G. huxleyi (e.g., 3 μm) to improve the monolayer arrangement of cells. Cryogenic nano-XRF imaging of ice-vitrified G. huxleyi should be pursued to determine whether these additional features are detectable by enhancing weaker XRF signals with longer exposure times, increasing scanning resolution and measuring under vacuum conditions. Applying ptychography-based approaches with nano-XRF would also improve the spatial resolution to better distinguish intracellular structures.36 Using nano-XRF to characterize the intracellular elemental composition of larger coccolithophore species such as C. carterae, which have several ion-rich bodies per cell and produce more than one coccolith at a time,37 would offer a chance to capture the more complex organization of these structures during coccolith formation.33
This work demonstrates that nano-XRF is capable of imaging microalgae in native-state using a liquid cell device, which can avoid potential artifacts from dried or fixed samples. The relative XRF signals of Ca, P and Mn for ion-rich bodies were more consistent under hydrated conditions compared to dried condition, for example. Another advantage for the hydrated condition was that X-ray phase contrast imaging produced images where nascent coccoliths and intracellular bodies were discernible (comparing Fig. 3a and 4a with 8a). One limitation for liquid cell imaging is the salt water medium typically used for coccolithophores. The high concentration of K in the medium will make it challenging to follow intracellular composition changes of K under different conditions.
Intracellular bodies and nascent coccoliths could be imaged for G. huxleyi in liquid using relatively short exposure times (e.g., 20 ms per pixel used in Fig. 8) to minimize X-ray damage. While the XRF signal is weaker compared to dry measurements because of faster scanning, the relevant elements for a single coccolithophore can be detected with 100 nm spatial resolution in less than one minute (i.e., 5000 × 5000 nm2 with 100 nm step size and 20 ms exposure time). To increase XRF signal counts but maintain total exposure time or to reduce total scanning time, a sparse-scanning approach could be implemented.38
Although measuring directly in liquid opens up possibilities for in situ experimentation with living cells, the effects of X-ray exposure from a typical nano-XRF measurement need to be assessed and, most likely, reduced. For example, when the coccosphere-bearing cell in Fig. 7 was imaged again, but at higher resolution and longer exposure time (e.g., 50 ms), K and Mn XRF signals were no longer associated with the ion-rich body (Fig. S3†). In response, more conservative imaging parameters were used when EDTA-treated G. huxleyi cells were imaged (i.e., lower scanning resolution and shorter exposure time). Therefore, the total exposure time should be managed carefully to avoid changes to the sample. Brighter fourth generation X-ray sources and faster readouts of future detector technology should decrease scanning times for nano-XRF measurements with similar or better XRF detection levels. This will reduce the amount of time the X-ray beam impinges on the sample, which could help preserve cell viability within the liquid cell device. With faster data collection a higher number of cells can be measured per condition, improving statistical and biological significance. Optimization of the liquid cell device design and construction should be pursued to provide media flow to the measurement region, reduce reactive oxygen species generation and isolate different measurement regions, thereby safeguarding the viability of living cells in the liquid device and further advancing the in situ capabilities of liquid cell nano-XRF imaging. The choice of incident X-ray beam energy and resultant energy of photoelectrons that dissipate through the sample could also be considered to lower beam-related damage to biological material.39
A limitation of liquid cell nano-XRF imaging of coccolithophores, and most microalgae, is the representation of a 3D object in 2D datasets. The orientation of the coccolithophore and the organization of its intracellular structures can complicate the interpretation of the generated image. For example, the Ca XRF signal from an intracellular coccolith can overlap with an intracellular body. Tilt-series image collection could provide additional perspectives to help build a 3D understanding of the imaged object.19 However, the time for collecting these additional nano-XRF datasets and the limited number of cells in the central axis of rotation are setbacks. Developments in new X-ray imaging modalities could offer alternative strategies for collecting 3D information. An example would be multi-slice ptychographic tomography,40 where the depth of field is moved through the sample (i.e., in the z-direction or X-ray beam direction) and no sample rotation is needed.
As mentioned above, there are improvements to be made to reduce beam dosage before in situ experiments can be conducted. Nevertheless, this work demonstrates that imaging can be conducted for hydrated, living microorganisms in high salinity conditions (i.e., strong background signal, complex media) to retrieve elemental and physical information at the single-cell level. Hard X-ray nanoprobe techniques are particularly advantageous for measuring biomineralizing microorganisms in liquid in this regard as many relevant elements and heavier metal ion species from the mineral and mineral precursors can be detected via XRF. X-ray phase contrast imaging can simultaneously add structural information from the biomineral and dense intracellular compartments to the collected nano-XRF datasets. The liquid cell design can be modified to accommodate smaller or larger objects by changing the spacer height of SiN materials. The window size could also be enlarged to provide more imaging regions of microorganisms.
Conclusion
Nano-XRF and complementary X-ray phase contrast imaging were used to investigate the elemental composition and structure of the coccolithophore G. huxleyi at subcellular resolution. Coccolithophores imaged without exterior coccoliths enabled identification of intracellular nascent coccolith structures and dense ion-rich bodies. Nano-XRF analysis showed additional metal ions (Mn, Fe and Zn) are present in ion-rich bodies, which could put the function of these bodies in a larger context beyond biomineralization. Harnessing the high energy X-ray beam, whole G. huxleyi cells were directly imaged in sea water medium using a liquid cell device. The stability of the liquid cell device in the nanobeam-scanning sample stage was demonstrated, yielding elemental and structural information of coccolithophores similar in fidelity to dried samples. For single-cell level studies on coccolithophore biomineralization, nano-XRF provides a balance between elemental sensitivity and spatial–temporal resolution to image entire cells without lengthy sample preparation. Liquid cell nano-XRF imaging offers direct native-state information that could be extended to other biomineralizing microorganisms. Future work should assess the effects of beam damage and develop strategies to minimize them.Data availability
The data supporting this article have been included as part of the ESI.†Conflicts of interest
There are no conflicts of interest to declare.Acknowledgements
We would like to acknowledge the staff at the I14 hard X-ray nanoprobe of Diamond Light Source for technical support and helpful scientific discussions. We acknowledge awarded synchrotron beamtimes at I14 of the Diamond Light Source (Standard proposal MG23602 and Long term proposal MG28688). The authors would like to thank the Laboratoire de Maîtrise de la Contamination, de la Chimie des Caloporteurs et du Tritium (LMCT) at CEA Cadarache (DES/IRESNE) for scanning electron microscopy access. This work was supported by the French National Research Agency (microCOCCO: ANR-21-CE42-0022). This project has received financial support from the CNRS through the MITI interdisciplinary programs (PhysChemCocco). A. S. is grateful for financial support from the Deutsche Forschungsgemeinschaft (DFG), grant Sche1637/5-1.References
- J. Young, M. Geisen, L. Cros, A. Kleijne, C. Sprengel, I. Probert and J. Østergaard, J. Nannoplankton Res., 2003, 1–125 CrossRef CAS , Special Issue..
- J. D. Milliman, Global Biogeochem. Cycles, 1993, 7, 927–957 CrossRef CAS.
- A. R. Taylor, C. Brownlee and G. Wheeler, Ann. Rev. Mar. Sci., 2017, 9, 283–310 CrossRef PubMed.
- L. Beaufort, I. Probert, E. M. Bendif, N. Metzl, C. Goyet, N. Buchet, P. Coupel, M. Grelaud, B. Rost, R. E. M. Rickaby and C. D. Vargas, Nature, 2011, 476, 80–83 CrossRef CAS PubMed.
- S. A. O. Dea, S. J. Gibbs, P. R. Bown, J. R. Young, A. J. Poulton, C. Newsam and P. A. Wilson, Nat. Commun., 2014, 5, 5363 CrossRef PubMed.
- J. Meyer and U. Riebesell, Biogeosciences, 2015, 12, 1671–1682 CrossRef.
- Y. Kadan, F. Tollervey, N. Varsano, J. Mahamid and A. Gal, Proc. Natl. Acad. Sci. U. S. A., 2021, 118, e2025670118 CrossRef CAS PubMed.
- E. M. Avrahami, Z. Eyal, N. Varsano, I. Zagoriy, J. Mahamid and A. Gal, Adv. Mater., 2024, 36, 2309547 CrossRef CAS PubMed.
- K. Kahil, S. Weiner, L. Addadi and A. Gal, J. Am. Chem. Soc., 2021, 143, 21100–21112 CrossRef CAS PubMed.
- A. Gal, S. Sviben, R. Wirth, A. Schreiber, B. Lassalle-Kaiser, D. Faivre and A. Scheffel, Adv. Sci., 2017, 4, 1700088 CrossRef PubMed.
- S. Sviben, A. Gal, M. A. Hood, L. Bertinetti, Y. Politi, M. Bennet, P. Krishnamoorthy, A. Schertel, R. Wirth, A. Sorrentino, E. Pereiro, D. Faivre and A. Scheffel, Nat. Commun., 2016, 7, 11228 CrossRef CAS PubMed.
- M. E. Marsh, Protoplasma, 1996, 190, 181–188 CrossRef CAS.
- A. Gal, A. Sorrentino, K. Kahil, E. Pereiro, D. Faivre and A. Scheffel, Proc. Natl. Acad. Sci. U. S. A., 2018, 115, 11000–11005 CrossRef CAS PubMed.
- M. E. Marsh, D. K. Chang and G. C. King, J. Biol. Chem., 1992, 267, 20507–20512 CrossRef CAS PubMed.
- R. Docampo, W. de Souza, K. Miranda, P. Rohloff and S. N. J. Moreno, Nat. Rev. Microbiol., 2005, 3, 251–261 CrossRef CAS PubMed.
- H. Peled-Zehavi and A. Gal, Adv. Biol., 2021, 5, 2000296 CrossRef CAS PubMed.
- E. Fox, E. Meyer, N. Panasiak, A. R. Taylor and A. R. Taylor, Front. Mar. Sci., 2018, 5, 326 CrossRef.
- J. Deng, D. J. Vine, S. Chen, Y. S. G. Nashed, Q. Jin, N. W. Phillips, T. Peterka, R. Ross, S. Vogt and C. Jacobsen, Proc. Natl. Acad. Sci. U. S. A., 2015, 112, 2314–2319 CrossRef CAS PubMed.
- J. Deng, Y. H. Lo, M. Gallagher-Jones, S. Chen, A. Pryor, Q. Jin, Y. P. Hong, Y. S. G. Nashed, S. Vogt, J. Miao and C. Jacobsen, Sci. Adv., 2018, 4, eaau4548 CrossRef CAS PubMed.
- S. Schmollinger, S. Chen, D. Strenkert, C. Hui, M. Ralle and S. S. Merchant, Proc. Natl. Acad. Sci. U. S. A., 2021, 118, e2026811118 CrossRef CAS PubMed.
- S. Schmollinger, S. Chen and S. S. Merchant, Metallomics, 2023, 15, mfad025 CrossRef PubMed.
- C. Y. J. Hémonnot and S. Köster, ACS Nano, 2017, 11, 8542–8559 CrossRef PubMed.
- P. D. Quinn, L. Alianelli, M. Gomez-Gonzalez, D. Mahoney, F. Cacho-Nerin, A. Peach and J. E. Parker, J. Synchrotron Radiat., 2021, 28, 1–8 CrossRef.
- P. D. Quinn, F. Cacho-Nerin, M. A. Gomez-Gonzalez, J. E. Parker, T. Poon and J. M. Walker, J. Synchrotron Radiat., 2023, 30, 200–207 CrossRef PubMed.
- Y. Kadan, L. Aram, E. Shimoni, S. Levin-Zaidman, S. Rosenwasser and A. Gal, J. Struct. Biol., 2020, 210, 107465 CrossRef CAS PubMed.
- R. A. Leigh and R. G. Wyn Jones, New Phytol., 1984, 97, 1–13 CrossRef CAS.
- H.-H. Kunz, M. Gierth, A. Herdean, M. Satoh-Cruz, D. M. Kramer, C. Spetea and J. I. Schroeder, Proc. Natl. Acad. Sci. U. S. A., 2014, 111, 7480–7485 CrossRef CAS PubMed.
- H. G. Liao and H. Zheng, Annu. Rev. Phys. Chem., 2016, 67, 719–747 CrossRef CAS PubMed.
- D. M. Chevrier, E. Cerdá-Doñate, L. Gandarias, M. A. Gomez-Gonzalez, S. Swaraj, P. E. D. Soto-Rodriguez, A. Fraisse, T. Robinson and D. Faivre, Chem. Sci., 2025 10.1039/D4SC08375J.
- J. E. Parker, M. Gomez-Gonzalez, Y. Van Lishout, H. Islam, D. D. Martin, D. Ozkaya, P. D. Quinn and M. E. Schuster, J. Synchrotron Radiat., 2022, 29, 431–438 CrossRef CAS PubMed.
- C. Bottini, M. Dapiaggi, E. Erba, G. Faucher and N. Rotiroti, Sci. Rep., 2020, 10, 9825 CrossRef CAS PubMed.
- J. M. Walker, H. J. M. Greene, Y. Moazzam, P. D. Quinn, J. E. Parker and G. Langer, Environ. Sci.: Processes Impacts, 2024, 26, 966–974 RSC.
- A. Triccas, D. M. Chevrier, M. Verezhak, J. Ihli, M. Guizar-Sicairos, M. Holler, A. Scheffel, N. Ozaki, V. Chamard, R. Wood, T. Grünewald and F. Nudelman, bioRxiv, 2024, preprint, DOI:10.1101/2024.11.15.623571.
- L. Lemelle, A. Simionovici, T. Schoonjans, R. Tucoulou, E. Enrico, M. Salomé, A. Hofmann and B. Cavalazzi, TrAC, Trends Anal. Chem., 2017, 91, 104–111 CrossRef CAS.
- D. A. Scott, R. Docampo, J. A. Dvorak, S. Shi and R. D. Leapman, J. Biol. Chem., 1997, 272, 28020–28029 CrossRef CAS PubMed.
- J. Deng, D. J. Vine, S. Chen, Q. Jin, Y. S. G. Nashed, T. Peterka, S. Vogt and C. Jacobsen, Sci. Rep., 2017, 7, 445 CrossRef PubMed.
- M. E. Marsh, Comp. Biochem. Physiol., Part B: Biochem. Mol. Biol., 2003, 136, 743–754 CrossRef CAS PubMed.
- P. D. Quinn, M. Sabaté Landman, T. Davis, M. Freitag, S. Gazzola and S. Dolgov, Chem. Biomed. Imaging, 2024, 2, 283–292 CrossRef CAS PubMed.
- K. Sauer, I. Zizak, J.-B. Forien, A. Rack, E. Scoppola and P. Zaslansky, Nat. Commun., 2022, 13, 7829 CrossRef CAS PubMed.
- P. Li and A. Maiden, Sci. Rep., 2018, 8, 2049 CrossRef PubMed.
Footnote |
| † Electronic supplementary information (ESI) available. See DOI: https://doi.org/10.1039/d5fd00021a |
| This journal is © The Royal Society of Chemistry 2025 |