
 Open Access Article
 This Open Access Article is licensed under a
 Creative Commons Attribution 3.0 Unported Licence
Self-assembled metal cluster/perovskite catalysts for efficient acidic hydrogen production with an ultra-low overpotential of 62 mV and over 1500 hours of stability at 1 A cm−2†
Yalei
Fan‡
ab,
Jianfa
Zhao‡
c,
Jing
Zhou
 d,
Wei-Hsiang
Huang
e,
Jianqiu
Zhu
a,
Chang-Yang
Kuo
ef,
Shengjie
Zhang
a,
Chih-Wen
Pao
e,
Ting-Shan
Chan
e,
Yuxuan
Zhang
a,
Su-Yang
Hsu
e,
Jin-Ming
Chen
e,
Chien-Te
Chen
e,
Changqing
Jin
c,
Liu Hao
Tjeng
g,
Jian-Qiang
Wang
*ab,
Zhiwei
Hu
*g and
Linjuan
Zhang
*ab
d,
Wei-Hsiang
Huang
e,
Jianqiu
Zhu
a,
Chang-Yang
Kuo
ef,
Shengjie
Zhang
a,
Chih-Wen
Pao
e,
Ting-Shan
Chan
e,
Yuxuan
Zhang
a,
Su-Yang
Hsu
e,
Jin-Ming
Chen
e,
Chien-Te
Chen
e,
Changqing
Jin
c,
Liu Hao
Tjeng
g,
Jian-Qiang
Wang
*ab,
Zhiwei
Hu
*g and
Linjuan
Zhang
*ab
aKey Laboratory of Interfacial Physics and Technology, Shanghai Institute of Applied Physics, Chinese Academy of Sciences, Shanghai 201800, P. R. China. E-mail: wangjianqiang@sinap.ac.cn; zhanglinjuan@sinap.ac.cn
bUniversity of Chinese Academy of Sciences, Beijing 100049, P. R. China
cBeijing National Laboratory for Condensed Matter Physics, Institute of Physics, Chinese Academy of Sciences, Beijing 100190, P. R. China
dZhejiang Institute of Photoelectronics and Zhejiang Institute for Advanced Light Source, Zhejiang Normal University, Jinhua, Zhejiang 321004, P. R. China
eNational Synchrotron Radiation Research Center, Hsinchu 300, Taiwan, Republic of China
fDepartment of Electrophysics, National Yang Ming Chiao Tung University, Hsinchu 300, Taiwan, Republic of China
gMax Planck Institute for Chemical Physics of Solids, Dresden 01187, Germany. E-mail: Zhiwei.hu@cpfs.mpg.de
First published on 17th June 2025
Abstract
The production of green hydrogen as a promising form of clean energy via water splitting relies on the development of efficient and stable electrocatalysts for the hydrogen evolution reaction (HER). Herein, we present a new electrocatalyst, Ca2CoRuO6 (CCRO), that exhibited a record low overpotential of 62 mV at a high current density of 1 A cm−2 and the smallest Tafel slope of 10 mV dec−1 (vs. more than 400 mV at 1 A cm−2 and 29 mV dec−1 of commercial Pt/C). Moreover, the CCRO catalyst maintains stable performance for over 1500 hours in a proton exchange membrane electrolyzer operating at a current density of 1 A cm−2. In situ X-ray absorption, Raman, and X-ray diffraction spectroscopies indicated a two-step in situ transformation of CCRO. The pristine form of CCRO was reduced from Ru5+/Co3+ to Ru3+/Co2+ within the first few hours under HER conditions. Subsequently, the catalyst slowly self-assembled to form Ru metal nanoclusters doped with Co (denoted as Co–Ru) on top of the CCRO substrate (Co–Ru/CCRO). First-principles calculations revealed that the synergistic effect within the Co–Ru cluster and hydrogen spillover from the metal cluster to the interface between Co–Ru and CCRO contribute to its outstanding hydrogen production performance. This work presents a new promising HER catalyst with record HER activity and reveals an unusual in situ reconstruction process for the catalyst.
Broader contextGreen hydrogen produced via water splitting is a promising clean energy source, but the process is often hindered by the lack of efficient electrocatalysts for the hydrogen evolution reaction (HER). Although Pt-based catalysts display the highest activity for the HER, they are too expensive for industrial applications. This work presents a new HER electrocatalyst, Ca2CoRuO6 (CCRO), that exhibits the lowest overpotential of 62 mV at 1 A cm−2 and the smallest Tafel slope of 10 mV dec−1 with prolonged stability over 1500 hours. Multiple in situ X-ray spectroscopies revealed an unusual two-step reconstruction process during the HER process. The simple perovskite CCRO was first quickly reduced from Ru5+/Co3+ to Ru3+/Co2+ and slowly self-assembled to form Co–Ru metal nanoclusters on the CCRO support (Co–Ru/CCRO) as the final catalyst. Various experiments combined with DFT calculations indicated that hydrogen spillover, together with synergistic effects within Co–Ru clusters, is the origin of the efficient HER activity of the final multiphase catalyst formed during the HER. Our work represents a breakthrough in the development of an efficient HER catalyst, reveals the formation process of real active species and suggests a new way to search for efficient catalysts. |
Introduction
The rapidly increasing energy demand and growing environmental concerns have sparked significant interest in the development of renewable energy sources.1–3 Hydrogen (H2) produced via water splitting has emerged as a sustainable alternative to fossil fuels in the future because of its high energy density and carbon-free properties.4,5 Electrolysis of water can be performed in acidic, neutral, and alkaline environments. However, the kinetics of the HER in alkaline/neutral media is much slower than that of the HER in acidic media owing to the additional water dissociation energy barrier.6–8 Moreover, proton exchange membrane water electrolyzers (PEMWEs) operating under acidic conditions offer advantages such as high hydrogen purity production and the use of pure water as the electrolyte, which minimizes equipment corrosion.8,9Although significant progress has been made in the search for high-performance catalysts for the HER under acidic conditions, achieving efficient and economical HER remains a formidable challenge.10–14 Most electrocatalysts exhibit good performance and stability only at relatively low current densities (<100 mA cm−2) and cannot meet the requirements for high current densities (>500 mA cm−2) in industrial applications.15–17 Therefore, the development of catalysts exhibiting excellent activity and durability at high current densities is crucial for enabling industrial applications.
It is well known that platinum (Pt)-based catalysts exhibit the highest intrinsic activity for the HER in acidic media, but their widespread application in PEMWEs is limited by their scarcity and high cost.18,19 The binding strength of Ru–H (∼65 kcal mol−1) is comparable to that of Pt–H (∼62 kcal mol−1),18–21 suggesting that promising HER catalysts can be designed using Ru-based materials. Moreover, the price of Ru has remained approximately only 30% of that of Pt over the past decade. However, the overpotential of Ru powder at a current density of 10 mA cm−2 is 183 mV in acidic media, which is significantly higher than that of Pt/C (35 mV), indicating that the intrinsic activity of pure Ru is significantly lower than that of Pt/C.22 Mixing low-cost 3d transition metal (TM) elements with Ru can not only further reduce costs, but also lead to a strong enhancement of HER activity due to synergistic effects.23–26 Co has significant electronic tunability because of its spin, charge (from +2 to +4) and orbital degrees of freedom.27,28 It is well known that Co3+/Co4+ ions can have low-spin, high-spin and even intermediate-spin states in oxides.29,30 For example, the heterogeneous Ru/Co3O4-VO catalyst enhances the synergistic charge transfer between the Ru metal and the oxygen vacancy-rich Co3O4 phase, resulting in excellent HER performance.26 A RuCo nanoscrew metal with a rough surface structure has been found to exhibit excellent water splitting performance due to the optimization of the binding energy of the reaction intermediate.23 The synergistic effect between Co and Ru in CoRu/NC-700, which consists of Co–Ru alloy nanoparticles and pyridine N, achieved an overpotential of 217 mV at a high current density of 1 A cm−2 in acidic media.31 Therefore, Co–Ru-based catalysts benefit from synergistic effects, substantially enhancing the catalytic activity while reducing costs.
Another phenomenon that enhances HER catalytic activity is hydrogen spillover. A typical example is metal clusters on the top of support.31–35 The process of hydrogen spillover involves the adsorption of hydrogen on metal clusters, the migration of adsorbed hydrogen from the metals to the supports, and the subsequent desorption of hydrogen from the supports.31–36 In 2022, Li et al. initially introduced work function (Δφ) as a critical parameter for assessing the success of hydrogen spillover at the interface.35 If there is a large difference in Δφ between two materials, a high potential barrier occurs at the interface, limiting the activity of HER.33,35 In contrast, a smaller difference in work function between the metal cluster and the support facilitates hydrogen spillover by reducing the interfacial potential barrier. Moreover, hydrogen spillover accelerates charge and proton transfer between metals and supports, alleviating the accumulation of interfacial charges and reducing the energy barrier. The fast migration of hydrogen also leads to more exposed active sites.33,34 Consequently, hydrogen spillover effectively enhances the HER activity through fast hydrogen transfer and the introduction of new active sites. For example, the hydrogen spillover from Rh clusters to the RhO2 support achieves high HER performance (9.8 mV@10 mA cm−2) in the Rh NA/RhO2 catalyst.34 In the Ru1Fe1/CoP catalyst, which consists of Ru clusters with a small work function difference (0.05 eV) relative to CoP substrates, hydrogen is effectively adsorbed on Ru1Fe1 clusters and facilely desorbed from CoP, thereby exhibiting excellent HER performance.35 By incorporating ethylene–glycol ligands into the Pt clusters, hydrogen transfer from Pt clusters to CoP substrate was facilitated. This process not only modulated the local electronic structure but also established a thermally neutral Pt/CoP interface, thereby enhancing the catalytic kinetics for hydrogen evolution.36 Therefore, the catalysts incorporating a hydrogen spillover mechanism play a critical role in enhancing the hydrogen evolution performance.
Perovskite oxide ABO3 and A2BO4 (A = alkaline earth metals or rare earth metals, B = 3d, 4d, and 5d transition metals) exhibit highly tunable electronic structures and rich physicochemical properties due to their abundant elemental composition, structural diversity, and diverse oxidation states, which can be tuned to enhance the HER catalytic activity.37–41 Although single-phase perovskite oxides exhibit excellent adjustability and durability, their inherently low electrical conductivity and limited surface active sites restrict their electrocatalytic HER activity.38,39 Therefore, a variety of strategies have been developed to enhance the electrocatalytic activity of perovskite oxides such as defect engineering,42 heteroatom doping,43–45 surface/interface engineering,46 and morphology/size control.41 Goodenough et al. first presented the A-site-deficient perovskite oxide Sr1−xNbO3−δ (0.05 ≤ x ≤ 0.3) as an HER catalyst under acidic conditions.42 Doping Gd into NaYTiO4 (NaY0.8Gd0.2TiO4) accelerated the electron transfer rate, achieving excellent HER activity (106 mV@10 mA cm−2).43 The SrHf0.7Ru0.3O3−δ perovskite oxide demonstrated a synergistic effect between Hf–Ru pairs, achieving an overpotential of only 48 mV at 10 mA cm−2 in acidic media.44 In SrTi0.5Ru0.5O3, the leaching of Sr2+ ions during the HER induced a surface reconstruction, resulting in the fragmentation of SrTi0.5Ru0.5O3 into small nanoparticles. This process was accompanied by the reduction of high-valent Ru species to metallic Ru, which improved electrical conductivity and catalytic activity, ultimately achieving a low overpotential of 24 mV at 10 mA cm−2 in acidic media.45 The self-assembled Ru clusters on the top of single crystals of Sr2RuO4 exhibit a low overpotential of 182 mV at a high current density of 1 A cm−2 due to their low charge transfer resistance.41 Therefore, it is possible to develop perovskite-based HER catalysts with high activity, reduced precious metal content, and enhanced durability for advancing industrial applications.
In this work, we developed a new HER catalyst, Ca2CoRuO6 (CCRO), which exhibited record-high HER activity and prolonged operational stability for more than 1500 hours at a current density of 1 A cm−2. In situ X-ray absorption spectroscopy (XAS), X-ray diffraction (XRD), and focused ion beam (FIB)-transmission electron microscopy (TEM) revealed the in situ formation of Co-doped Ru clusters on the CCRO substrate (Co–Ru/CCRO) during the HER process. The hydrogen spillover was observed in various experiments, and density functional theory (DFT) calculations further confirmed the hydrogen spillover mechanism from metal clusters to the interface between the Co–Ru cluster and the CCRO support. Moreover, DFT calculations revealed a synergistic effect between the Co and Ru sites within the Co–Ru cluster. This synergistic effect brings the Gibbs free energy of the adsorbed hydrogen (*H) species close to zero, thereby enhancing the adsorption and desorption processes of *H and accelerating hydrogen evolution. This study demonstrates an unusual HER catalyst, Co–Ru/CCRO, in which both synergistic effects and hydrogen spillover cooperatively facilitate the excellent HER activity.
Results and discussion
Synthesis and characterization of pristine CCRO
The pristine form of CCRO with a double-perovskite structure (A2BB′O6, where A represents alkaline earth or rare-earth elements, and B and B′ are typically transition metals) was synthesized via the solid-state reaction method under high-pressure and high-temperature conditions (specific details are provided in the ESI†). In the double-perovskite CCRO, the two B-site cations are arranged in a disordered manner as CoO6 and RuO6 corner-sharing units on a three-dimensional structure (Fig. 1a). The phase structure of the pristine form of CCRO was initially confirmed through XRD. The laboratory- and synchrotron radiation (SR)-based XRD patterns of the pristine form of CCRO exhibited excellent agreement with the theoretical spectra of the Pnma space group, without any observed impurity phases, as shown in Fig. 1b and Fig. S1 (ESI†). Furthermore, the Rietveld refinement results from the laboratory-based XRD pattern indicated that the pristine form of CCRO had a Pnma space group with cell parameters of a = 5.4843 Å, b = 7.6246 Å, and c = 5.3666 Å (Table S1, ESI†). The high-resolution transmission electron microscopic (HRTEM) images are presented in Fig. 1c and Fig. S2 (ESI†), revealing particles of the pristine form of CCRO with a uniform size. In addition, the particle size distribution of the pristine form of CCRO was analyzed based on Fig. 1c, indicating that the average diameters range from 15 to 20 nm (Fig. S3, ESI†). As shown in Fig. 1d, distinct lattice fringes (distance = 0.384 nm) corresponding to the (101) crystal planes of the pristine form of CCRO were observed (Table S1c, ESI†). Furthermore, Fig. 1e shows the selected area electron diffraction (SAED) pattern recorded along the [![[1 with combining macron]](https://www.rsc.org/images/entities/char_0031_0304.gif) 1] band axis, indicating excellent crystallinity of the catalyst. In addition, combined with high-angle annular dark-field scanning transmission electron microscopic (HAADF-STEM) imaging, double-perovskite images with good atomic arrangements were obtained, as shown in Fig. 1f, further confirming the successful synthesis of the pristine CCRO catalyst. The energy-dispersive X-ray spectroscopy (EDX) results based on scanning electron microscopy (SEM), HRTEM and STEM revealed that the pristine CCRO elements were evenly distributed and that the atomic ratio of Ca/Co/Ru/O was in agreement with the expected stoichiometry (Fig. 1g and Fig. S4, S5, and Tables S2, S3, ESI†).
1] band axis, indicating excellent crystallinity of the catalyst. In addition, combined with high-angle annular dark-field scanning transmission electron microscopic (HAADF-STEM) imaging, double-perovskite images with good atomic arrangements were obtained, as shown in Fig. 1f, further confirming the successful synthesis of the pristine CCRO catalyst. The energy-dispersive X-ray spectroscopy (EDX) results based on scanning electron microscopy (SEM), HRTEM and STEM revealed that the pristine CCRO elements were evenly distributed and that the atomic ratio of Ca/Co/Ru/O was in agreement with the expected stoichiometry (Fig. 1g and Fig. S4, S5, and Tables S2, S3, ESI†).
 | ||
| Fig. 1 Structural characterization of pristine CCRO. (a) Schematic representation of the CCRO perovskite structure. (b) Rietveld refined powder XRD patterns. (c) and (d) HRTEM images. (e) Typical SAED pattern. (f) Atomic-resolution HAADF-STEM image. The green and azure dots represent the Co/Ru and Ca atoms, respectively. (g) HRTEM elemental mapping images. | ||
Electronic and local structures of pristine CCRO
The energy position and multiple spectral features in soft X-ray absorption spectroscopy (sXAS) are highly sensitive to the valence states,37,47,48 spin states,38,49 and local environments50,51 of transition metals (TMs). Therefore, sXAS is an important tool for studying the electronic and structural properties of 3d TM-based compounds. Fig. 2a shows the Co L2,3-edge sXAS of the pristine form of CCRO (black line), along with those of CoO (red line), EuCoO3 (green line), and Sr2CoRuO6 (blue line)39 as the Co2+, low-spin (LS) Co3+, and high-spin (HS) Co3+ references, respectively. Both the spectral features and energy positions of Co L2,3-edge sXAS in the pristine form of CCRO were very similar to those of Sr2CoRuO6, indicating that the Co ions of the pristine form of CCRO were in the HS-Co3+ state. The valence state of Ru ions in the pristine form of CCRO was investigated using the Ru L3-edge XAS. We compared the Ru L3-edge spectrum of the pristine form of CCRO (black line) with those of Ru3+Cl3 (red line),52 Sr2Ru4+O4 (blue line), and Sr2GdRu5+O6 (green line). Fig. 2b clearly shows that the Ru L3-edge spectrum of the pristine form of CCRO was at the same energy position as that of Sr2GdRuO6, indicating that the pristine form of CCRO was in a Ru5+ oxidation state. Moreover, the surface-sensitive X-ray photoelectron spectroscopy (XPS) spectra of the pristine form of CCRO are shown in Fig. S6 (ESI†), which exhibit peaks associated with Ca, Co, Ru, and O elements (Fig. S6a, ESI†). In addition, the Co 2p and Ru 3p core levels of the pristine form of CCRO also indicate Co3+ and Ru5+, respectively. | ||
| Fig. 2 Electronic and local environmental structures of pristine CCRO. (a) Co L2,3-edge XAS spectra of CCRO together with those of CoO, EuCoO3, and Sr2CoRuO6 as references for Co2+, LS-Co3+, and HS-Co3+, respectively. (b) Ru L3-edge of the pristine form of CCRO together with those of RuCl3, Sr2RuO4, and Sr2GdRuO6 as references for Ru3+, Ru4+, and Ru5+, respectively. (c) Co-K XANES spectra of the pristine form of CCRO and of the Co foil, CoO, and LaCoO3 as references for Co0, Co2+, and Co3+, respectively. (d) Ru-K XANES spectra of the pristine form of CCRO and of Ru foil, RuCl3, RuO2, and Sr2GdRuO6 as references for Ru0, Ru3+, Ru4+, and Ru5+, respectively. (e) and (f) Fourier transform (FT) EXAFS experimental (red points) and fitting curves (green lines) of CCRO at the Co and Ru K-edge. (g) K-edge WT plots of (a) Co in LaCoO3, (b) Co in CCRO, (c) Ru in Sr2GdRuO6, and (d) Ru in the pristine form of CCRO. | ||
The electronic and local environments of Co and Ru ions in the pristine form of CCRO were further studied using the bulk-sensitive XAS at the Co K-edge and Ru K-edge, whose energy positions at the absorption edge are also sensitive to the valence states.53–56Fig. 2c shows the Co K-edge X-ray absorption near-edge structure (XANES) spectra of the pristine form of CCRO, along with those of Co0 foil (pink line), Co2+O (red line), and LaCo3+O3 (blue line) for comparison. The energy position of the Co-K XANES (at a normalized intensity of 0.8) for CCRO was similar to that of LaCoO3, suggesting a Co3+ valence state in CCRO (Fig. S7a, ESI†). The Ru-K XANES spectra of the pristine form of CCRO together with those of Ru0 foil (pink line), Ru3+Cl3 (red line), Ru4+O2 (blue line), and Sr2GdRu5+O6 (green line) as references are shown in Fig. 2d, which further confirm the Ru5+ state in the pristine form of CCRO (Fig. S7b, ESI†). Thus, we confirmed HS-Co3+ and LS-Ru5+ in the pristine form of CCRO. Additionally, the extended X-ray absorption fine structure (EXAFS) at the K-edges of samples provides local environmental information, such as the bond lengths and coordination numbers.57,58 As shown in Fig. S8 (ESI†), the EXAFS curves of the Co and Ru K-edges show that the first peak positions of the Co–O and Ru–O bonds in the pristine form of CCRO are the same as those in the LaCoO3 and Sr2GdRuO6, respectively. The fitting results suggest that both Co and Ru ions were present in a six-coordinated form, with average bond lengths of approximately 1.97 Å for Co–O and 1.95 Å for Ru–O (Fig. 2e, f and Fig. S9, S10, and Table S4, ESI†). Fig. 2g and Fig. S11 (ESI†) present the Co and Ru K-edge EXAFS wavelet transform (WT) patterns, which provide both high-resolution radial distance information and the ability to distinguish backscattering atoms in k space, providing additional support for our previous results.
Electrocatalytic performance in the HER
The acidic HER performance of CCRO was tested using a standard three-electrode system in an H2-saturated 0.5 M H2SO4 solution. It is noteworthy that when the potential was set at −0.04 V (vs. RHE), the current density of the pristine form of the CCRO catalyst increased from a few mA cm−2 to more than 500 mA cm−2 within 20 hours, after which the current density remained largely unchanged. This suggests that the CCRO catalyst experienced an activation process during the initial 20-hour period (Fig. S12, ESI†). The observed activation of the CCRO catalyst can be attributed to the formation of Co-doped Ru nanoclusters on the CCRO substrate, which will be discussed in detail later. As shown in Fig. 3a and b, the overpotential of the activated CCRO at current densities of 10 and 100 mA cm−2 was merely 7 and 20 mV, respectively, which was substantially lower than those of commercial 20% Pt/C (29 and 75 mV) and the pristine form of CCRO (83 and 234 mV). Moreover, the overpotential of activated CCRO at a current density of 1 A cm−2 was as low as 62 mV. In addition, activated CCRO exhibited a record-low Tafel slope curve of 10 mV dec−1 (Fig. 3c), indicating its enhanced kinetics towards the HER. Additionally, the extension of this remarkably low Tafel slope to approximately 250 mA cm−2 demonstrates that even at high current densities, the desorption of *H and the formation of H2 proceed with high efficiency. Moreover, the overpotential at 10/100 mA cm−2 and the Tafel slope for the activated CCRO were compared with previously reported high-activity Ru-based HER catalysts (Fig. 3d and Table S5, ESI†), revealing that the activated CCRO is one of the best electrocatalysts for hydrogen evolution. Electrochemical impedance spectroscopy (EIS) was also utilized to assess the electrode kinetics. As shown in Fig. S13 (ESI†), the activated CCRO exhibited the lowest charge transfer resistance (Rct), indicating the fastest charge transfer rate during the HER process. | ||
| Fig. 3 Electrochemical HER performance of the CCRO catalyst. (a) LSV polarization curves of pristine CCRO, activated CCRO, and commercial 20% Pt/C. (b) Comparison between the overpotentials of pristine CCRO, activated CCRO, and commercial 20% Pt/C. (c) Tafel plots of pristine CCRO, activated CCRO, and commercial 20% Pt/C. (d) Comparison of the Tafel slopes and overpotentials at 10 mA cm−2 for activated CCRO with those of previously reported high-activity Ru-based HER catalysts. (e) Comparison of MA for pristine CCRO, activated CCRO, and commercial 20% Pt/C. (f) Comparison of TOF values at different overpotentials for pristine CCRO, activated CCRO, and commercial 20% Pt/C. (g) Comprehensive comparisons of the HER performance of activated CCRO and commercial 20% Pt/C. (h) Comparison of activated CCRO with high-performance electrocatalysts at a current density of 1.0 A cm−2. (i) I–V curves of PEMWEs with the prepared catalysts as the cathode. (j) Voltage vs. time curves of the CCRO- and Pt/C-based PEMWEs at a constant current density of 1 A cm−2 at 60 °C. | ||
The mass activity (MA) is another important index for evaluating the electrochemical performance of catalysts. The MA of the activated CCRO at −50 mV (vs. RHE) reached 16.5 A mgRu−1, which is approximately 165 times and 14 times greater than that of the pristine form of CCRO (0.1 A mgRu−1) and commercial 20% Pt/C (1.2 mgPt−1) (Fig. 3e and Fig. S14, ESI†). The turnover frequency (TOF) values of the pristine form of CCRO, the activated CCRO, and commercial 20% Pt/C were calculated to further compare their intrinsic activities. As shown in Fig. 3f, the activated CCRO delivered a high TOF value of 358.7 s−1 at an overpotential of 60 mV, which is approximately 448 times and 51 times higher than that of the pristine form of CCRO (0.8 s−1) and commercial 20% Pt/C (7.0 s−1), respectively, indicating the excellent intrinsic HER activity of the activated CCRO. Moreover, the electrochemically active surface area (ECSA) was determined by collecting cyclic voltammetry (CV) data in the non-faradaic region (Fig. S15, ESI†), where the ECSA was positively correlated with the electrochemical double-layer capacitance (Cdl). As shown in Fig. S15d (ESI†), the Cdl of the activated CCRO was determined to be 3 times and 5 times greater than that of commercial 20% Pt/C and the pristine form of CCRO, respectively, revealing the largest ECSA and a greater number of active sites for the activated CCRO, which are beneficial for catalysing the HER process. Furthermore, LSV curves were normalized by ECSA to investigate the intrinsic HER activity (Fig. S15e, ESI†), and the activated CCRO exhibited the highest intrinsic activity. It is evident that the intrinsic activity of the pristine form of CCRO catalyst is lower than that of commercial 20% Pt/C. However, the activity of the activated CCRO significantly surpasses that of commercial 20% Pt/C. These findings indicate that the pristine form of the CCRO perovskite structure might not represent a genuine HER-active species, and imply that the CCRO catalyst underwent an unconventional transformation process during activation. Moreover, the HER performance of the activated CCRO was comprehensively compared with that of commercial 20% Pt/C in Fig. 3g, revealing that activated CCRO outperforms commercial 20% Pt/C in all respects.
As shown in Fig. 3h and Table S6 (ESI†), compared with numerous recently reported high-performance HER electrocatalysts at a current density of 1 A cm−2, activated CCRO has better HER performance. Furthermore, water-splitting catalysts must achieve extremely large current densities (>500 mA cm−2) at low overpotentials; thus, the possibility of industrial-scale applications of CCRO was also evaluated. The long-term stability of CCRO was assessed at a high current density of 1 A cm−2 using a three-electrode system, as shown in Fig. S16 (ESI†). Over the course of the 200 hours evaluation, the electrocatalyst exhibited negligible degradation in performance, suggesting that CCRO possesses an outstandingly robust stability profile at high current densities, indicating high potential for industrial applications.
Previous theoretical work indicated that Tafel slopes are 120 mV dec−1, 40 mV dec−1, and 30 mV dec−1 for the Volmer, Heyrovsky, and Tafel mechanisms, respectively. When the Tafel slopes are less than 30 mV dec−1, it suggests hydrogen spillover mechanism occurs.43,44,59 To provide evidence for hydrogen spillover in the CCRO catalyst for the acidic HER, a series of comprehensive experiments and electrochemical measurements were conducted. To experimentally verify the facile spillover of hydrogen atoms, a mixture of the pristine form of CCRO and WO3 powders, as well as the activated CCRO and WO3 powders, was treated with H2 at room temperature (Fig. S17, ESI†). The results indicate that in the activated CCRO, spillover hydrogen reduces WO3 to dark blue HxWO3. In contrast, the pristine form of CCRO and pure WO3 powders exhibited no color change. These findings collectively suggest that adsorbed hydrogen may spill over from the Co–Ru clusters onto the CCRO substrate surface to form H2, which is further confirmed by DFT calculations. In addition, the influence of protons on lattice oxygen causes the CCRO substrate to exhibit properties similar to those of WO3.60,61 The electron paramagnetic resonance (EPR) measurement shown in Fig. S18 (ESI†) indicates that, after the HER, the formation of oxygen vacancies (Ov) enhances the proton-storage capacity of the CCRO substrate, further facilitating the migration of *H from the Co–Ru clusters to the CCRO substrate, where it combines with the substrate *H to form H2.
Furthermore, the HER-induced changes in the chemical structure and electrochemical properties of CCRO were investigated via the CV in a 0.5 M H2SO4 solution.62,63 Fig. S19 (ESI†) presents the CV curves for (a) CCRO before (dashed line) and after (solid line) HER treatment, (b) CCRO + WO3 before and after HER treatment, (c) WO3 before and after HER treatment, and (d) 20% Pt/C used as a reference for comparison. The broad hydrogen desorption (Hde) peak for WO3 is located at ∼0.25 V (vs. RHE), which remained unchanged before and after the reaction. In case of 20% Pt/C, our CV curve in Fig. S19d (ESI†) is very similar to that observed in the literature.64 There is an anodic peak at ∼0.17 V (vs. RHE), which corresponds to the desorption of the strongly adsorbed hydrogen.64 Before HER treatment, CCRO showed no hydrogen adsorption/desorption features (Fig. S19a, ESI†). In contrast, CCRO and CCRO + WO3 exhibited a pronounced anodic peak at ∼0.10 V (vs. RHE) after HER treatment (after-activation), revealing easy desorption of hydrogen species. Since hydrogen underpotential deposition occurs exclusively on metallic Ru surfaces and not on Ru oxides, these findings clearly indicate the formation of metallic Co–Ru clusters on the CCRO substrate. Therefore, the low-lying potential and strong intensity of the Hde peak suggest that the activated CCRO catalyst exhibits a more rapid hydrogen desorption process, which reflects high HER performance.62–65
In addition, the kinetic isotope effects (KIEs) of H/D can provide valuable information about the kinetics of hydrogen and proton transfer in chemical reactions. When the KIEs (KIEs = jH/jD) exceed 1.5, it indicates that the reaction rate is influenced by hydrogen or proton transfer processes.66–68 To gain insights into the role of hydrogen transfer during the HER process, we conducted a KIE experiment in a solution containing 0.5 M D2SO4/D2O. Furthermore, to exclude the influence of the electrolyte on the activation process, the pristine form of CCRO was initially activated in a 0.5 M H2SO4/H2O solution. Then, LSV measurements performed in a 0.5 M D2SO4/D2O solution demonstrated that the resulting curve nearly overlapped with the curve obtained when both activation and measurement were carried out in the 0.5 M D2SO4/D2O solution. These results confirm that the electrolyte did not significantly affect the activation of the pristine form of CCRO. Interestingly, compared with that of CCRO in a solution containing 0.5 M H2SO4/H2O, the polarization curve of CCRO in the 0.5 M D2SO4/D2O solution exhibited a significantly lower current density throughout the entire potential range by a factor of more than 1.5 (Fig. S20, ESI†). This observation suggests that one possible step affecting the reaction rate involves hydrogen or proton transfer.
To investigate the application prospects of CCRO electrocatalysts as cathode materials under actual industrial conditions, we constructed a proton exchange membrane water electrolyser (PEMWE). We used a commercial 20% Ir/C catalyst as the anode and separately compared the performance of CCRO with that of commercial 20% Pt/C catalysts at the cathode. The diagram presented in Fig. S21 (ESI†) represents the PEMWEs, which include two collectors with runners, titanium felts and carbon paper (CP) as gas diffusion layers (GDLs), a PEM, and deionized water used for testing. The current–voltage (I–V) characteristic curves depicted in Fig. 3i indicate the superior performance of the CCRO catalyst, which exhibited a higher current density than commercial 20% Pt/C across the entire voltage range. Notably, a remarkable current density of 1 A cm−2 was achieved with a cell voltage of only 1.63 V, surpassing the 1.91 V requirement for commercial 20% Pt/C catalyst (Fig. 3i and Fig. S22, ESI†). To further verify the potential of the electrolyser in application at a nearly industrial scale, its long-term stability was studied for more than 1500 hours at 60 °C and a high current density of 1 A cm−2. As illustrated in Fig. 3j, the voltage decay rate of the CCRO electrolyser is merely 38 μV h−1 over a simulated industrial operation period exceeding 1500 hours. This performance is significantly superior to the decay rate of 498 μV h−1 observed for commercial 20% Pt/C electrolyser during a 200-hour operation. These results suggest the promising prospects of CCRO for industrial hydrogen production.
In situ spectroscopic study exploring active sites under HER conditions
It is well known that the electronic and crystal structures change under HER conditions; therefore, in situ XAS, XRD, and Raman experiments were conducted to explore real active sites for HER activity. For the in situ experiments, a pre-activation process was not conducted and a constant potential was applied for testing (the same as the activation process of CCRO in electrochemical tests). This approach was intended to systematically investigate the reconstruction process of the perovskite catalyst during the reaction and correlate it with the activation process. From the in situ experiments, we observed that the changes in the electronic structure of CCRO during the HER can be categorized into two distinct processes: the first process involves valence state transformation of Co and Ru ions within the first 2–3 hours, which is reversible (Fig. S23, ESI†), and the second process involves the formation of metallic Ru nanoclusters doped with Co on the CCRO substrate (Co–Ru/CCRO) as the reaction time increases, which is irreversible.First process: reduced valence state under HER conditions
The time dependence of the Co-K XANES of the CCRO catalyst was determined at a potential of −0.04 V (vs. RHE) in 0.5 M H2SO4, as shown in Fig. 4a; a magnified view is shown in Fig. S24a (ESI†). Here, LaCoO3 and CoO were employed as references for Co3+ and Co2+, respectively. The absorption energy position of CCRO at air and the open-circuit potential (OCP) were very close to those of LaCoO3, indicating a valence state of approximately Co3+. The energy position of the absorption edge in Co-K XANES gradually shifted by 1.9 eV towards lower energies over 120 min, indicating that the majority of Co3+ ions transformed into Co2+ (Fig. 4c). After the change in the valence state of the Co ions under HER conditions was determined, the valence state of the Ru ions needed to be determined. Fig. 4b and Fig. S24b (ESI†) depict the time-dependent Ru-K XANES spectra of CCRO, together with Sr2GdRuO6, RuO2, and RuCl3 as references for Ru5+, Ru4+, and Ru3+, respectively. Similar to the Co ions, there was a continuous decrease in the energy position of the absorption edge as a function of time under HER conditions. However, the Ru ions exhibited a much greater reducing valence state than the Co ions did. After 120 min, Ru5+ was reduced to Ru3+ (Fig. 4c). In addition, information about the local environment of the TMs can be obtained from the K-edge EXAFS spectra. The FT spectra of the Co/Ru K-edge EXAFS spectra as a function of time are shown in Fig. S25 (ESI†), and the evolution of the Co–O and Ru–O bond lengths was obtained from the best EXAFS fitting, shown in Fig. 4d and Tables S7, S8 (ESI†). The EXAFS fitting curves are shown in Fig. S26 and S27 (ESI†). The lengths of the Co–O and Ru–O bonds increased with time, but the latter changed much more than the former, which is consistent with the reduced valence state. The time dependence of Co/Ru-K WT indicated the absence of any structural changes within 120 min (Fig. S28 and S29, ESI†).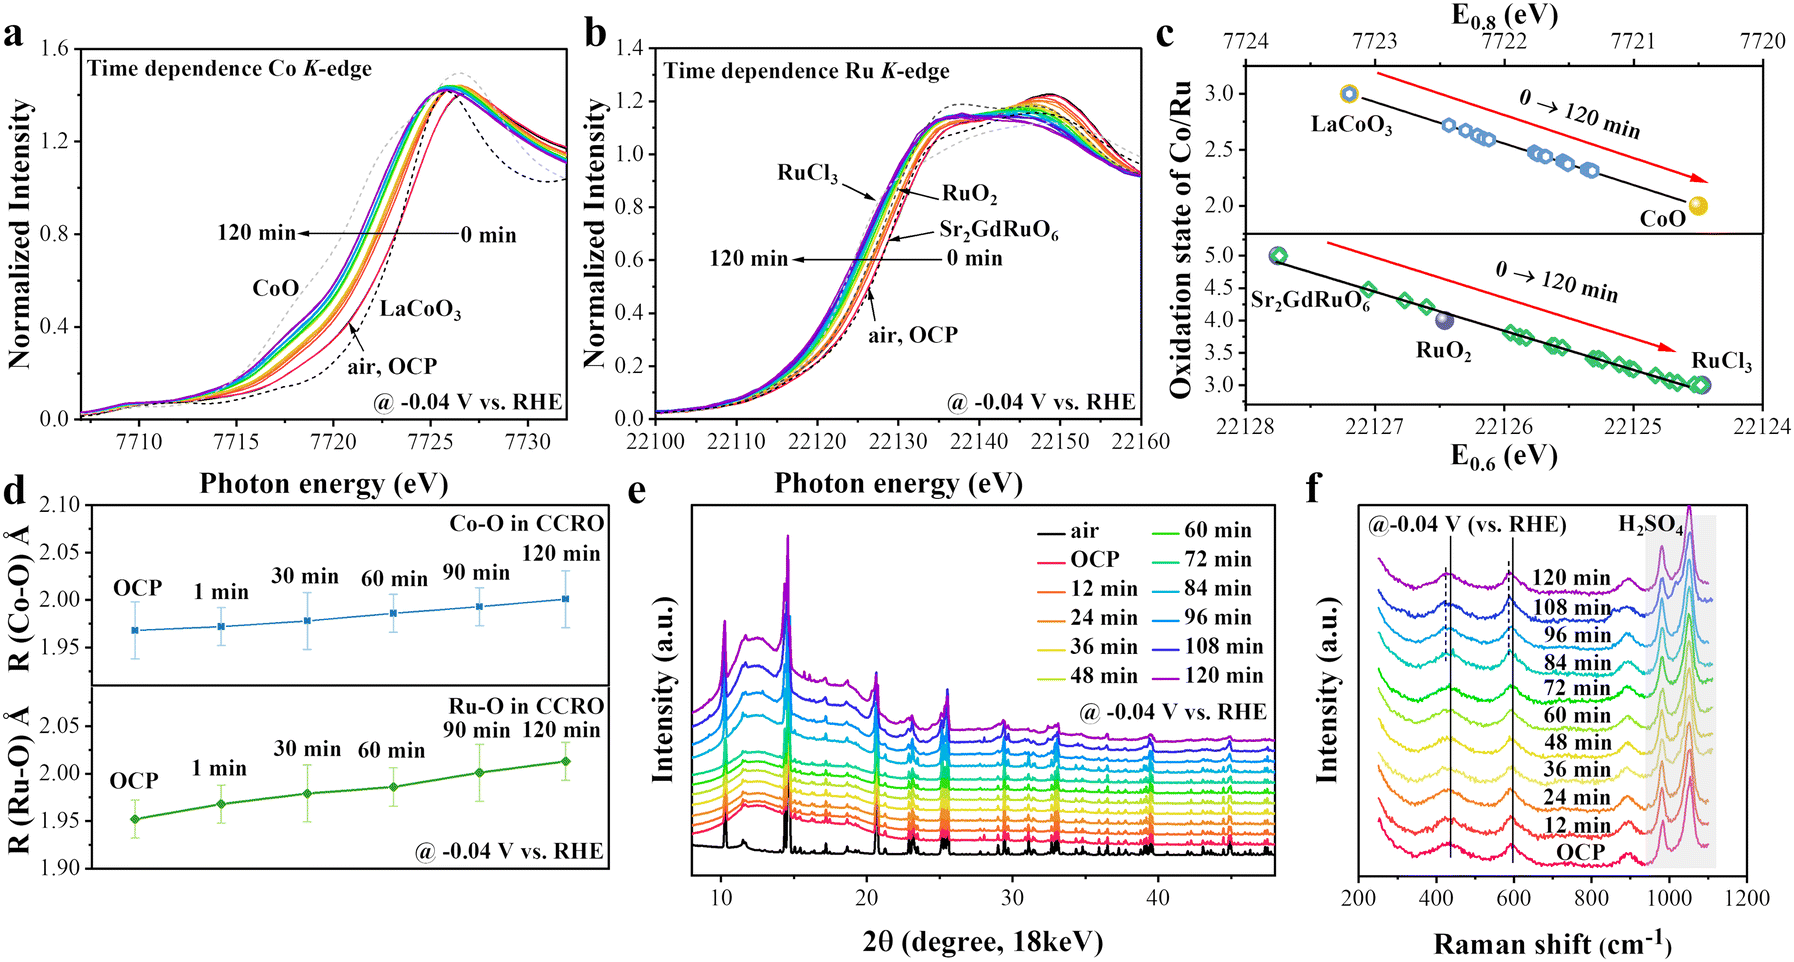 | ||
| Fig. 4 In situ XAS, XRD patterns, and Raman spectra of the CCRO catalyst (during the initial 120 min). (a) and (b) Time-dependent XANES spectra at the Co K-edge and Ru K-edge of the CCRO sample and relative references. (c) Formal oxidation states of Co and Ru as a function of edge energy at a 0.8/0.6 jump height of (E0.8/E0.6), obtained from the normalized XANES spectra at the Co/Ru K-edge. (d) Co–O and Ru–O bond lengths in the CCRO catalyst at different times extracted from the EXAFS fitting results. (e) Time-dependent XRD patterns of CCRO. (f) Time-dependent Raman spectra of CCRO. | ||
This was further confirmed by in situ time-dependent SR-based XRD patterns shown in Fig. 4e and Fig. S30 (ESI†). The XRD patterns consisted of three parts: the amorphous background originating from the cell body and window materials (∼12° and 18°), the diffraction peaks of graphitic carbon from carbon paper (Fig. S1, ESI†), and the diffraction patterns of CCRO. During the 120 min test, no additional diffraction peaks were observed. However, a slight leftward shift in the diffraction peaks occurred at 84 min, indicating that the expansion of the lattice resulted from an increase in the bond length of the CCRO catalyst during the HER process (Fig. S30, ESI†). Furthermore, during the HER process, the intensity of the XRD pattern peaks gradually broadened and weakened. This phenomenon may be attributed to the partial amorphization of CCRO, resulting from the formation of Co-doped Ru metal clusters during the reaction process (in the second step).
Previous studies have shown that Raman spectra are sensitive to structural variations, and this has been widely used under in situ conditions.69,70Fig. 4f shows the in situ Raman spectra of the CCRO catalyst, which contains five main vibration peaks, among which the peaks at ∼981 cm−1 and ∼1052 cm−1 are attributed to SO42−. For the orthorhombic structure of the CCRO perovskite, the peak at ∼437 cm−1 can be ascribed to the bending vibration of Ru–O within the RuO6 octahedral structure. The peak at ∼595 cm−1 is attributable to the stretching vibration of Ru–O. Additionally, the Raman peak at ∼900 cm−1 corresponds to the stretching vibration of the Co–O–Ru structure.71–73 With the increase in reaction time, no changes in the vibration peaks were observed from the OCP up to 72 min. However, at 84 min, the vibration peaks at ∼437 cm−1 and ∼595 cm−1 were red-shifted to ∼426 cm−1 and ∼588 cm−1, respectively. This indicates that lattice expansion occurred during the HER process,73–75 consistent with the previous in situ XAS and in situ XRD results.
Second step: formation of metal clusters on the CCRO substrate
We found that the in situ analysis within the initial two hours was insufficient to accurately reveal the real active species of the CCRO electrocatalyst. Fig. 5a shows the Ru-K XANES spectra of the CCRO catalyst at a potential of −0.04 V (vs. RHE) from 2 hours to 30 hours. From 2 hours to 8 hours, the energy position of the absorption edge for Ru ions in CCRO moved continuously to a lower energy, indicating that the valence state continued to decrease. After 8 hours, the spectral shape changed only slightly, and we found that the spectral weight related to the metal Ru increased. This can be further confirmed from the FT-EXAFS data in Fig. 5b, which show that the height of the Ru metal peaks increased and that the Ru–O-related signal simultaneously decreased with the increasing reaction time. Notably, the Ru–O bond did not completely disappear, as confirmed by further WT analysis results (Fig. S31a, ESI†). The fitting of the Ru-EXAFS data for 30 hours indicates the existence of both Ru–O and Ru–Ru bonds (Fig. 5c and Table S9, ESI†). The fitted scattering paths can be further divided into Ru–O paths and Ru–Ru paths (Fig. S32a, ESI†), which also verified our previous results. | ||
| Fig. 5 In situ XAS, XRD, and Raman spectra of the CCRO catalyst at −0.04 V (from 2 hours to 30 hours). ((a) and (b)) XANES and EXAFS at the Ru K-edge of CCRO and references. (c) Ru K-edge of the EXAFS experimental and fitting curves at 30 hours. ((d) and (e)) XANES and EXAFS at the Co K-edge of CCRO and references. (f) Co K-edge of the EXAFS experimental and fitting curves at 30 hours. (g) FIB-TEM images obtained after the HER for 30 hours. (h) XRD patterns of CCRO at different times. (i) Raman spectra of CCRO at different times. | ||
Next, we discuss the in situ XANES and EXAFS studies of the Co-K edge from 2 hours to 30 hours. Fig. 5d shows that beyond 3 hours, the energy position of the absorption edge for CCRO shifted to a lower energy than that of CoO, suggesting the formation of Co metal, which was indeed observed in the R-space EXAFS in Fig. 5e. Similar to the Ru K-edge peak, the Co–O peak clearly decreased, and the Co–Ru peak clearly increased after 8 hours. In contrast to the Ru K-edge peak, the Co–O peak remained until 30 hours (Fig. 5e). The WT analysis in Fig. S31b (ESI†) also indicated the evolution of Co–Ru and Co–O bonds from 2 hours to 30 hours. Our EXAFS fitting analysis for CCRO collected at 30 hours further confirmed that these two peaks corresponded to Co–O and Co–Ru bonds, respectively (Fig. 5f and Table S9, ESI†). In Fig. S32c (ESI†), the fitted scattering paths can be further categorized into Co–O paths and Co–Ru paths. Notably, the peak at 2.12 Å can be attributed to both the Co–Ru and Co–O paths.
The TEM images obtained after the reaction provided a direct reflection of the actual changes in the catalyst. As depicted in Fig. S33 (ESI†), the TEM images of CCRO subjected to an 8 hours reaction time at a potential of −0.04 V (vs. RHE) revealed the formation of nanoparticles (orange dot circles) on the surface of the CCRO crystals (Fig. S33a, ESI†). Through our lattice fringe analysis conducted on both the black region and the particle junction (green dot box), we observed two distinct types of lattice fringes corresponding to the CCRO and Ru metal phases (Fig. S33b, ESI†). The presence of surface nanoparticles confirmed their composition as a Ru metal phase, while also indicating an increase in the lattice size of CCRO, further validating our previous in situ findings (Fig. S33b, ESI†). As shown in Fig. S33c (ESI†), the EDX images further confirm the uniform distribution of Ca, Co, Ru, and O within the particle-free region, as well as indicate that the nanoparticles were primarily composed of Ru atoms with a minor amount of Co atoms. Furthermore, EDX quantitative analysis was performed separately on area #1, which includes the nanoparticles, and area #2, which represents the crystal regions within these selected areas (Fig. S33d, ESI†). This analysis revealed that there was a small amount of Co within the formed Ru metal phase on the surface, thus corroborating our earlier hypothesis regarding minimal Co doping in Ru metal. Conversely, area #2 remained as a CCRO crystal phase, with Ca, Co, Ru, and O essentially conforming to the stoichiometric ratio of the perovskite structure, as shown in Fig. S33d (ESI†). After 8 hours at a potential of −0.04 V (vs. RHE), the sample was subjected to atomic-resolution HAADF-STEM analysis (Fig. S34, ESI†). Upon comparison with the data in Fig. 1f, a noticeable expansion of the lattice is clearly observed.
The high energy of the K-edge XAS enables the detection of oxides beneath the surface metal layer, facilitating the appearance of both a Ru/Co–O peak and a metal peak in the FT-EXAFS spectrum. To show the surface and internal structure of the catalyst after a long reaction time, we conducted further analysis via an FIB method to prepare samples and characterized them with TEM, with the aim of clarifying the interaction between nanoparticle formation and CCRO. The FIB-TEM results in Fig. 5g show that after the HER at −0.04 V (vs. RHE) for 30 hours, a Ru metal cluster layer with a thickness of approximately 50 nm was observed on the surface, while in the underlying metal, the CCRO perovskite remained unchanged. Consequently, the real catalyst was no longer the CCRO catalyst but the in situ formed Co–Ru/CCRO. The self-assembled structure allowed the dissolved metal nanostructures to enter the bulk oxidation phase, increasing the cohesion between the metal catalyst and its support. This ensured excellent dispersion and stability of the modified catalyst, which, in turn, improved the electrochemical performance due to increased interaction strength and accelerated electron transfer kinetics. Moreover, this new structure is very similar to Rh clusters on top of RhO2, which facilitate hydrogen spillover at high current density, thereby leading to exceptional HER properties.38 In addition, the TEM images revealed the formation of Co–Ru nanoclusters in the CCRO catalyst after more than 1500 hours of operation in a PEMWE (Fig. S35, ESI†).
The L-edge of TMs using the total electron yield (TEY) mode is widely acknowledged to be a surface (∼5 nm)-sensitive method for determining the valence state of materials. Additionally, the Co and Ru L3-edge TEY-sXAS measurements were conducted on CCRO after 30 hours of HER. In Fig. S36 (ESI†), the white line peak intensity for Co was consistent with that of Co foil, and the valence state of Ru was lower than that of RuCl3 and similar to that of Ru foil, indicating the presence of metallic Co and Ru on the catalyst surface. Notably, the right shoulder peak of the white line peak on the Co L3-edge demonstrates characteristics similar to those of CoO. This similarity is attributed to a minor degree of oxidation that occurred during the sample transfer process in air. The XAS results further confirmed the existence of metallic Ru on the surface and provided additional support for our previous in situ XAS findings.
Fig. 5h shows the in situ SR-based XRD patterns of CCRO in a 0.5 M H2SO4 solution for reaction times ranging from 1 hour to 16 hours. Under the applied potential, the XRD patterns of CCRO remained essentially unchanged. However, after a reaction time greater than 5 hours, an additional set of diffraction peaks attributed to metallic Ru emerged, further confirming the formation of the Ru metal phase on the surface during the HER process. Fig. S37 (ESI†) shows the diffraction patterns corresponding to CCRO before and after the in situ tests, providing clearer evidence for both the formation of the metallic Ru phase and a leftward shift in the initial diffraction peak due to an increase in the bond length. Since there is no Raman vibration peak in the metal phase, further in situ Raman spectroscopy revealed only a red shift of the vibration peaks located at ∼430 and ∼590 cm−1 without the appearance of new vibration peaks, as shown in Fig. 5i. This red shift corresponds to the expansion of the CCRO lattice, which was consistent with the results of in situ XAS and XRD.
Theoretical simulation of HER on Co–Ru/CCRO
DFT calculations were further utilized to clarify the underlying mechanisms responsible for the recorded HER activity. On the basis of the reconstructed structure of Co–Ru/CCRO found via TEM, XAS, and XRD, we considered two mechanisms: (1) synergistic effects between single Co atoms and surrounding Ru ions. (2) Hydrogen spillover from the Co–Ru cluster to the CCRO substrate.Since Co has an atomic ratio of only ∼2% and is uniformly distributed in Ru clusters, the formation of Co metal clusters can be negligible, as observed in Co-K EXAFS. We first consider the synergistic effects between single Co atoms inside a Ru cluster. In general, the acidic HER process can be represented by a three-state diagram involving an initial proton (H+), an intermediate adsorbed hydrogen species (*H), and a final state of molecular hydrogen (H2). The Gibbs free energy of hydrogen adsorption (ΔG*H) is widely accepted as a descriptor for evaluating the intrinsic activity of electrocatalysts towards the acidic HER. A thermoneutral active site with an optimal |ΔG*H| value close to zero can facilitate both the adsorption and desorption processes during the HER.
Fig. S38 (ESI†) shows the schematic diagrams of *H adsorbed at (I) the Co site, (II) the point between Co and Ru, and (III, IV, V) Ru sites at different distances from Co within the Co–Ru cluster; Fig. S39a (ESI†) shows *H adsorption on (VI) the Co site, (VII) the Ru site, and (VIII) the O site on top of the CCRO planes. In Fig. 6a, *H adsorbed at the connecting point between the Co and Ru sites has a minimum value of ΔG*H = −0.05 eV, whereas that at the Ru site nearest to Co (Ru-1 site) has a value of ΔG*H = −0.17 eV, and that at the Co site inside the Ru cluster has a value of ΔG*H = −0.26 eV, which are all closer to zero than the values of ΔG*H = −0.43 eV and −0.48 eV at the Ru-2 and Ru-3 sites, respectively. These findings suggest that there is a synergistic effect between Co and the surrounding Ru cluster that enhances the HER activity. Notably, at the connecting point and the nearest Ru to the Co ion, the Gibbs free energy is lower than that of Pt(111) (Fig. S39b, ESI†), which explains why our Co–Ru/CCRO catalyst outperforms the Pt/C electrocatalysts in terms of HER activity. As shown in Fig. S39 (ESI†), we calculated the values at the CCRO sites, considering the expanded lattice. The ΔG*H values at the Co, Ru and O sites were 0.63 eV, 0.78 eV, and −0.98 eV, respectively, indicating that these sites were practically inactive for the HER.
 | ||
| Fig. 6 DFT results of Co–Ru/CCRO. (a) The Gibbs free energy diagram for hydrogen adsorption at different sites on Co–Ru/CCRO. The schematic of hydrogen adsorption sites and the corresponding free energy diagram of hydrogen spillover for (b) Ru/CCRO and (c) Co–Ru/CCRO. (d) The schematic of the roles played by the synergy mechanism and hydrogen spillover mechanism within the Co–Ru/CCRO structure. | ||
The HER activity facilitated by the hydrogen spillover mechanism from the Co–Ru cluster to the CCRO support was subsequently studied via DFT calculations. Hydrogen spillover describes the migration of active hydrogen species (*H) from a favourable hydrogen adsorption site (component/region) to a hydrogen desorption site in order to avoid the trade-off between hydrogen adsorption and desorption on a single active site.33 Generally, hydrogen spillover boosts the HER activity.33 ΔG*H was calculated from the adsorption sites on the metal nanoparticles to the contact interface between the metal nanoparticles and the oxide substrate, for exploring the potential HER active sites and the optimal migration path. In the case of the pure Ru cluster (Fig. 6b and Fig. S40a, ESI†), the optimal ΔG*H are −0.11 eV at site-4 through path-1 (① → ② → ③ → ④ → ⑤, red line) and −0.09 eV at site-7 through path-2 (① → ② → ⑥ → ⑦ → ⑧, green line). Both values are close to zero, indicating favourable HER activity when accounting for a free proton in solvation. In path-1, ΔG*H becomes more negative from −0.29 eV at ② to −0.77 eV at ③ and from −0.11 eV at ④ to −1.34 eV at ⑤ (O atom of CCRO), indicating stronger H adsorption at ③ and at ⑤. In particular, such a negative value of ΔG*H at ⑤ reflects strong *H trapping by the O site on the oxide surface. Therefore, path-1 is unfavourable for hydrogen spillover. However, in path-2, the ΔG*H only slightly changes from −0.29 eV at ② to −0.39 eV at ⑥, then changes from a negative value to a positive value of +0.38 eV at ⑧ (Ru atom of CCRO) through −0.09 eV at ⑦, indicating a change from *H adsorption (negative ΔG*H) to *H desorption (positive ΔG*H), namely favourable for hydrogen spillover.
Moreover, as shown in Fig. 6b, the highest energy barrier along the ① → ② → ⑥ → ⑦ segment of path-2 (0.46 eV) is lower than that along the ① → ② → ③ → ④ segment of path-1 (0.71 eV). This indicates that *H migration from the top of the Ru cluster to the interface site is more favorable along path-2. From our results, we can see facilitated *H desorption at the Ru atom (ΔG*H is +0.38 eV at ⑧) on the CCRO surface versus strong *H trapping at the O site (ΔG*H is −1.34 eV at ⑤). Thus, our DFT calculations suggest that site ⑧ is more favourable for H2 formation than site ⑤.
However, in path-2, the energy barrier for the migration of *H across the interface (⑦ → ⑧) is 0.60 eV, slightly higher than 0.47 eV (④ → ⑤) in path-1, which originates from the limitations of modeling the Co–Ru/CCRO interface formed by in situ self-assembling. Different from the metal/support catalysts formed by evaporating or depositing metal on the support, in situ self-assembly can create a gradual metal-to-oxide transition without a distinct interface, thus avoiding a high energy barrier. Accurate simulation of this realistic interface requires enormous computational resources and time. Moreover, the migration of *H across the interface is not essential for the hydrogen spillover mechanism, since the formation of H2 could occur at the interface. For example, hydrogen spillover between metal and interface (desorption of H2 at the interface),34 or even at different atomic scale sites,68 has been proposed to explain high HER performance. Hydrogen spillover can also occur via high *H concentration to overcome the barrier across the interface.33,36 Although our theory suggests that desorption of H2 could occur at interface site-7 similar to Rh/RhO2,34 we cannot exclude the possibility of hydrogen migration across the interface in real catalysts.
When Co is embedded in Ru nanoparticles (Fig. 6c and Fig. S40b, ESI†), the favourable path is now path-3 (① → ② → ③ → ④, blue line). The optimal ΔG*H is −0.10 eV at site-3—very close to −0.09 eV for the pure Ru cluster (path-2). The ΔG*H value gradually increases from ① → ② → ③ → ④ and changes the sign from negative to positive from ③ → ④, indicating a transition from adsorption to desorption. The largest energy barrier is about 0.28 eV for the migration from the top of the Co–Ru cluster (site-1) to the interface active site (site-3), which is lower than 0.46 eV for the migration in the pure Ru cluster from the top of Ru (site-1) to the active site (site-7) in path-2. This suggests that path-3 is even more favourable for hydrogen spillover than path-2. By contrast, the optimal ΔG*H increases to −0.18 eV (at site-7) in path-4 (① → ⑤ → ⑥ → ⑦ → ⑧, pink line), and the ΔG*H value remains negative (indicating adsorption). We can again see *H desorption at the Co atom (ΔG*H is +0.47 eV at ④) at the CCRO surface in path-3 versus strong *H trapping by the O site (ΔG*H is −1.34 eV at ⑧) at the CCRO surface in path-4. In conclusion, our calculations indicate that path-3 is the most favourable path for hydrogen spillover.
Similar to the case of Ru/CCRO, there is an energy barrier of 0.61 eV in Fig. 6c for the migration across the metal/oxide interface from site-3 to site-4 (Co atom of CCRO) in path-3, slightly higher than 0.41 eV for the migration from site-7 to site-8 (O atom of CCRO) in path-4 due to limitations of modeling a sharp interface. Our theory can only suggest hydrogen spillover through a short-range hydrogen migration from the Co–Ru cluster to the interfacial Ru site, but we cannot exclude a further migration to the oxide layer, since there is no distinct metal/oxide interface to form a high energy barrier in our in situ self-assembled Co–Ru/CCRO. Thus, two mechanisms, namely, the synergistic effects between Co and surrounding Ru and the hydrogen spillover, work together to achieve the record-low overpotential and small Tafel slope, as shown in Fig. 6d.
Conclusion
In this work, we observed, for the first time, that a CCRO catalyst underwent two steps of transformation during the HER process. First, the original CCRO catalyst underwent fast reduction from Ru5+/Co3+ to Ru3+/Co2+ within only the first few hours. Subsequently, a gradual structural transformation occurred, resulting in single Co atoms inside Ru nanoclusters on top of the CCRO substrate, referred to as the Co–Ru/CCRO catalyst. This new catalyst exhibited excellent HER performance, with an overpotential of only 62 mV at a high current density of 1 A cm−2 and a small Tafel slope of 10 mV dec−1, as well as long-term operational stability for more than 1500 hours in an assembled PEM electrolyser. The self-assembled structure accelerated electron transfer kinetics and facilitated hydrogen spillover from Co–Ru metal clusters to the CCRO substrate. DFT calculations indicated a synergistic effect between Co and the surrounding Ru within the Co–Ru clusters, which is combined with hydrogen spillover to yield an unusual mechanism of HER performance. Our work presents a novel type of HER catalyst with promising industrial applications and reveals an unconventional in situ reconstruction process for catalysis.Author contributions
L. Z., Z. H., and J.-Q. W. conceived the project and designed the experiments. Y. F. performed the electrochemical measurements and data analysis. J. F. Z. and C. Q. J. conducted the material synthesis. C.-Y. K., W.-H. H., C.-W. P., T.-S. C., S.-Y. H., J.-M. C., C.-T. C., and Z. H. performed the synchrotron experiments. J. Q. Z., Y. Z., and J. F. Z. performed the structural characterization. Y. F., J. Z., and S. Z. carried out the DFT calculations. Y. F. and L. Z. wrote the manuscript. Z. H., L. T., and J. Z. provided the interpretation of XAS. Z. H., L. Z., S. Z., and J. Z. modified the manuscript. All the authors discussed the results and commented on the manuscript.Conflicts of interest
The authors declare no competing interests.Data availability
The data supporting this article have been included as part of the ESI.†Acknowledgements
This work was supported by the Strategic Priority Research Program of the Chinese Academy of Sciences (No. XDA0400000); the National Key R&D Program of China (Grant No. 2021YFA1502400, 2022YFB4002502, and 2022YFA1403800); the National Science Foundation of China (Grant No. 22179141 and 12204515); the Photon Science Center for Carbon Neutrality; the Talent Plan of Shanghai Branch, Chinese Academy of Sciences (CASSHB-QNPD-2023-006); and the Shanghai Municipal Science and Technology Program (Grant No. 21DZ1207700). J. F. Z. acknowledges the support of the Young Elite Scientists Sponsorship Program by CAST (Grant No. 2022QNRC001). The authors acknowledge the support from the Max Planck-POSTECH-Hsinchu Center for Complex Phase Materials. Open Access funding provided by the Max Planck Society.References
- A. Odenweller, F. Ueckerdt, G. F. Nemet, M. Jensterle and G. Luderer, Nat. Energy, 2022, 7, 854 CrossRef.
- X. Yang, C. P. Nielsen, S. Song and M. B. McElroy, Nat. Energy, 2022, 7, 955 CrossRef CAS.
- S. Wei, R. Sacchi, A. Tukker, S. Suh and B. Steubing, Energy Environ. Sci., 2024, 17, 2157 RSC.
- F. Podjaski, D. Weber, S. Zhang, L. Diehl, R. Eger, V. Duppel, E. Alarcon-Llado, G. Richter, F. Haase, A. Fontcuberta i Morral, C. Scheu and B. V. Lotsch, Nat. Catal., 2020, 3, 55 CrossRef CAS.
- Z. Shi, X. Zhang, X. Lin, G. Liu, C. Ling, S. Xi, B. Chen, Y. Ge, C. Tan, Z. Lai, Z. Huang, X. Ruan, L. Zhai, L. Li, Z. Li, X. Wang, G.-H. Nam, J. Liu, Q. He, Z. Guan, J. Wang, C.-S. Lee, A. R. J. Kucernak and H. Zhang, Nature, 2023, 621, 300 CrossRef CAS PubMed.
- Z. W. Seh, K. D. Fredrickson, B. Anasori, J. Kibsgaard, A. L. Strickler, M. R. Lukatskaya, Y. Gogotsi, T. F. Jaramillo and A. Vojvodic, ACS Energy Lett., 2016, 1, 589 CrossRef CAS.
- Z. J. Wang, M. X. Li, J. H. Yu, X. B. Ge, Y. H. Liu and W. H. Wang, Adv. Mater., 2020, 32, 1906384 CrossRef CAS PubMed.
- L. Cheng, W. Huang, Q. Gong, C. Liu, Z. Liu, Y. Li and H. Dai, Angew. Chem., Int. Ed., 2014, 53, 7860 CrossRef CAS PubMed.
- Y. Zhu, Q. Lin, Y. Zhong, H. A. Tahini, Z. Shao and H. Wang, Energy Environ. Sci., 2020, 13, 3361 RSC.
- T. Reier, H. N. Nong, D. Teschner, R. Schlögl and P. Strasser, Adv. Energy Mater., 2017, 7, 1601275 CrossRef.
- J. Kibsgaard and T. F. Jaramillo, Angew. Chem., Int. Ed., 2014, 53, 14433–14437 CrossRef CAS PubMed.
- N. Han, K. R. Yang, Y. Li, W. Xu, T. Gao, Z. Cai, Y. Zhang, V. S. Batista, W. Liu and X. Sun, Nat. Commun., 2018, 9, 924 CrossRef PubMed.
- Y. Liu, J. Wu, K. P. Hackenberg, J. Zhang, Y. M. Wang, Y. Yang, K. Keyshar, J. Gu, T. Ogitsu, R. Vajtai, J. Lou, P. M. Ajayan, B. C. Wood and B. I. Yakobson, Nat. Energy, 2017, 2, 1 Search PubMed.
- J. Zhang, Y. Zhao, X. Guo, C. Chen, C.-L. Dong, R.-S. Liu, C.-P. Han, Y. Li, Y. Gogotsi and G. Wang, Nat. Catal., 2018, 1, 985 CrossRef CAS.
- N. Chen, S. Y. Paek, J. Y. Lee, J. H. Park, S. Y. Lee and Y. M. Lee, Energy Environ. Sci., 2021, 14, 6338 RSC.
- Z.-Y. Wu, F.-Y. Chen, B. Li, S.-W. Yu, Y. Z. Finfrock, D. M. Meira, Q.-Q. Yan, P. Zhu, M.-X. Chen, T.-W. Song, Z. Yin, H.-W. Liang, S. Zhang, G. Wang and H. Wang, Nat. Mater., 2023, 22, 100 CrossRef CAS PubMed.
- Y. Hu, L. Li, J. Zhao, Y.-C. Huang, C.-Y. Kuo, J. Zhou, Y. Fan, H.-J. Lin, C.-L. Dong and C.-W. Pao, Appl. Catal., B, 2023, 333, 122785 CrossRef CAS.
- J. Mahmood, F. Li, S.-M. Jung, M. S. Okyay, I. Ahmad, S.-J. Kim, N. Park, H. Y. Jeong and J.-B. Baek, Nat. Nanotechnol., 2017, 12, 441–446 CrossRef CAS PubMed.
- M. Zhang, H. Li, J. Chen, L. Yi, P. Shao, C.-Y. Xu and Z. Wen, Chem. Eng. J., 2021, 422, 130077 CrossRef CAS.
- F. Zhang, Y. Zhu, Y. Chen, Y. Lu, Q. Lin, L. Zhang, S. Tao, X. Zhang and H. Wang, J. Mater. Chem. A, 2020, 8, 12810–12820 RSC.
- Y. Feng, W. Feng, J. Wan, J. Chen, H. Wang, S. Li, T. Luo, Y. Hu, C. Yuan, L. Cao, L. Feng, J. Li, R. Wen and J. Huang, Appl. Catal., B, 2022, 307, 121193 CrossRef CAS.
- Y. Li, J. Abbott, Y. Sun, J. Sun, Y. Du, X. Han, G. Wu and P. Xu, Appl. Catal., B, 2019, 258, 117952 CrossRef CAS.
- T. Zhu, J. Huang, B. Huang, N. Zhang, S. Liu, Q. Yao, S.-C. Haw, Y.-C. Chang, C.-W. Pao, J.-M. Chen, Q. Shao, Z. Hu, Y. Ma and X. Huang, Adv. Energy Mater., 2020, 10, 2002860 CrossRef CAS.
- R. Yao, K. Sun, K. Zhang, Y. Wu, Y. Du, Q. Zhao, G. Liu, C. Chen, Y. Sun and J. Li, Nat. Commun., 2024, 15, 2218 CrossRef CAS PubMed.
- G. Wang, W. Chen, G. Chen, J. Huang, C. Song, D. Chen, Y. Du, C. Li and K. K. Ostrikov, Nano Energy, 2020, 71, 104637 CrossRef CAS.
- W. Tian, X. Xie, X. Zhang, J. Li, G. I. Waterhouse, J. Ding, Y. Liu and S. Lu, Small, 2024, 20, 2309633 CrossRef CAS PubMed.
- C.-F. Chang, Z. Hu, H. Wu, T. Burnus, N. Hollmann, M. Benomar, T. Lorenz, A. Tanaka, H.-J. Lin, H. Hsieh, C. Chen and L. Tjeng, Phys. Rev. Lett., 2009, 102, 116401 CrossRef CAS PubMed.
- Z. Hu, H. Wu, M. Haverkort, H. Hsieh, H.-J. Lin, T. Lorenz, J. Baier, A. Reichl, I. Bonn, C. Felser, A. Tanaka, C. Chen and L. Tjeng, Phys. Rev. Lett., 2004, 92, 207402 CrossRef CAS PubMed.
- J.-M. Chen, Y.-Y. Chin, M. Valldor, Z. Hu, J.-M. Lee, S.-C. Haw, N. Hiraoka, H. Ishii, C.-W. Pao, K.-D. Tsuei, J.-F. Lee, H.-J. Lin, L.-Y. Jang, A. Tanaka, C.-T. Chen and L. Tjeng, J. Am. Chem. Soc., 2014, 136, 1514 CrossRef CAS PubMed.
- M. W. Haverkort, Z. Hu, J. C. Cezar, T. Burnus, H. Hartmann, M. Reuther, C. Zobel, T. Lorenz, A. Tanaka, N. B. Brookes, H. H. Hsieh, H. J. Lin, C. T. Chen and L. H. Tjeng, Phys. Rev. Lett., 2006, 97, 176405 CrossRef CAS PubMed.
- J. Chen, J. Huang, Y. Zhao, L. Cao, K. Kajiyoshi, Y. Liu, Z. Li and Y. Feng, Chem. Eng. J., 2022, 450, 138026 CrossRef CAS.
- J. Park, S. Lee, H. E. Kim, A. Cho, S. Kim, Y. Ye, J. W. Han, H. Lee, J. H. Jang and J. Lee, Angew. Chem., Int. Ed., 2019, 58, 16038 CrossRef CAS PubMed.
- S. Zhao, Z.-H. Wang, J.-Y. Wang, P.-F. Wang, Z.-L. Liu, J. Shu and T.-F. Yi, Coord. Chem. Rev., 2025, 524, 216321 CrossRef CAS.
- Z. Fan, F. Liao, Y. Ji, Y. Liu, H. Huang, D. Wang, K. Yin, H. Yang, M. Ma, W. Zhu, M. Wang, Z. Kang, Y. Li, M. Shao, Z. Hu and Q. Shao, Nat. Commun., 2022, 13, 5828 CrossRef CAS PubMed.
- J. Li, Y. Tan, M. Zhang, W. Gou, S. Zhang, Y. Ma, J. Hu and Y. Qu, ACS Energy Lett., 2022, 7, 1330 CrossRef CAS.
- J. Li, H.-X. Liu, W. Gou, M. Zhang, Z. Xia, S. Zhang, C.-R. Chang, Y. Ma and Y. Qu, Energy Environ. Sci., 2019, 12, 2298 RSC.
- J. Dai, Y. Zhu, H. A. Tahini, Q. Lin, Y. Chen, D. Guan, C. Zhou, Z. Hu, H.-J. Lin, T.-S. Chan, C.-T. Chen, S. C. Smith, H. Wang, W. Zhou and Z. Shao, Nat. Commun., 2020, 11, 5657 CrossRef CAS PubMed.
- Y. Zhu, Z. Tang, L. Yuan, B. Li, Z. Shao and W. Guo, Chem. Soc. Rev., 2025, 54, 1027 RSC.
- D. Guan, J. Zhou, Z. Hu, W. Zhou, X. Xu, Y. Zhong, B. Liu, Y. Chen, M. Xu, H.-J. Lin, C.-T. Chen, J.-Q. Wang and Z. Shao, Adv. Funct. Mater., 2019, 29, 1900704 CrossRef.
- Y. Zhu, H. A. Tahini, Z. Hu, J. Dai, Y. Chen, H. Sun, W. Zhou, M. Liu, S. C. Smith, H. Wang and Z. Shao, Nat. Commun., 2019, 10, 149 CrossRef PubMed.
- Y. Zhang, K. E. Arpino, Q. Yang, N. Kikugawa, D. A. Sokolov, C. W. Hicks, J. Liu, C. Felser and G. Li, Nat. Commun., 2022, 13, 7784 CrossRef CAS PubMed.
- J. B. Goodenough, R. Manoharan and M. Paranthaman, J. Am. Chem. Soc., 1990, 112, 2076 CrossRef CAS.
- S. Jaiswal, R. Mondal, V. Kushwaha, A. Gupta and P. Singh, ACS Appl. Energy Mater., 2023, 6, 7323 CrossRef CAS.
- Y. Wang, Q. Lu, F. Li, D. Guan and Y. Bu, Adv. Funct. Mater., 2023, 33, 2213523 CrossRef CAS.
- F. Le, W. Jia, W. Shu, Z. Lu, Y. Lv, T. Wang, X. Wu, X. Yang, F. Ma and D. Jia, Small, 2024, 20, 2404894 CrossRef CAS PubMed.
- L. Zhao, Z. Tao, M. You, H. Xiao, S. Wang, W. Ma, Y. Huang, B. He and Q. Chen, Adv. Sci., 2024, 11, 2309750 CrossRef CAS PubMed.
- Y. Chin, Z. Hu, H.-J. Lin, S. Agrestini, J. Weinen, C. Martin, S. Hébert, A. Maignan, A. Tanaka, J. Cezar, N. Brookes, Y.-F. Liao, K.-D. Tsuei, C. Chen, D. Khomskii and L. Tjeng, Phys. Rev. B, 2019, 100, 205139 CrossRef CAS.
- J. Zhou, L. Zhang, Y.-C. Huang, C.-L. Dong, H.-J. Lin, C.-T. Chen, L. Tjeng and Z. Hu, Nat. Commun., 2020, 11, 1984 CrossRef CAS PubMed.
- Z. Hu, H. Wu, T. Koethe, S. Barilo, S. Shiryaev, G. Bychkov, C. Schüßler-Langeheine, T. Lorenz, A. Tanaka, H. Hsieh, H.-J. Lin, C. Chen, N. Brookes, S. Agrestini, Y.-Y. Chin, M. Rotter and L. Tjeng, New J. Phys., 2012, 14, 123025 CrossRef.
- N. Hollmann, Z. Hu, M. Valldor, A. Maignan, A. Tanaka, H. Hsieh, H.-J. Lin, C. Chen and L. Tjeng, Phys. Rev. B: Condens. Matter Mater. Phys., 2009, 80, 085111 CrossRef.
- T. Burnus, Z. Hu, H. Wu, J. Cezar, S. Niitaka, H. Takagi, C. F. Chang, N. B. Brookes, H.-J. Lin, L. Jang, A. Tanaka, K. Liang, C. Chen and L. Tjeng, Phys. Rev. B: Condens. Matter Mater. Phys., 2008, 77, 205111 CrossRef.
- S. Agrestini, C.-Y. Kuo, K.-T. Ko, Z. Hu, D. Kasinathan, H. B. Vasili, J. Herrero-Martin, S. M. Valvidares, E. Pellegrin, L.-Y. Jang, A. Henschel, M. Schmidt, A. Tanaka and L. H. Tjeng, Phys. Rev. B, 2017, 96, 161107 CrossRef.
- S. Agrestini, K. Chen, C.-Y. Kuo, L. Zhao, H.-J. Lin, C.-T. Chen, A. Rogalev, P. Ohresser, T.-S. Chan, S.-C. Weng, G. Auffermann, A. Völzke, A. C. Komarek, K. Yamaura, M. W. Haverkort, Z. Hu and L. H. Tjeng, Phys. Rev. B, 2019, 100, 014443 CrossRef CAS.
- H. Huang, Y.-C. Chang, Y.-C. Huang, L. Li, A. C. Komarek, L. H. Tjeng, Y. Orikasa, C.-W. Pao, T.-S. Chan, J.-M. Chen, S.-C. Haw, J. Zhou, Y. Wang, H.-J. Lin, C.-T. Chen, C.-L. Dong, C.-Y. Kuo, J.-Q. Wang, Z. Hu and L. Zhang, Nat. Commun., 2023, 14, 2112 CrossRef CAS PubMed.
- X. Lin, Y.-C. Huang, Z. Hu, L. Li, J. Zhou, Q. Zhao, H. Huang, J. Sun, C.-W. Pao, Y.-C. Chang, H.-J. Lin, C.-T. Chen, C.-L. Dong, J.-Q. Wang and L. Zhang, J. Am. Chem. Soc., 2021, 144, 416 CrossRef PubMed.
- Y. Fan, C. Zhang, L. Zhang, J. Zhou, Y. Li, Y.-C. Huang, J. Ma, T.-S. Chan, C.-T. Chen, C. Jing, E. Mijit, Z. Hu, J.-Q. Wang and L. Zhang, Chem. Catal., 2024, 4, 5 Search PubMed.
- J. Zhou, J. Li, L. Zhang, S. Song, Y. Wang, X. Lin, S. Gu, X. Wu, T.-C. Weng, J. Wang and S. Zhang, J. Phys. Chem. C, 2018, 122, 14447 CrossRef CAS.
- L.-J. Zhang, J.-Q. Wang, J. Li, J. Zhou, W.-P. Cai, J. Cheng, W. Xu, G. Yin, X. Wu, Z. Jiang, S. Zhang and Z.-Y. Wu, Chem. Commun., 2012, 48, 91 RSC.
- Q. Wang, J. Chen, S. Chen, D. Zhou, Y. Du, Y. Ji, Y. Xiong, J. Ke, W. Zhu, Y. Wang, D. Gao, W.-H. Huang, C.-W. Pao, Y. Sun, Y. Li, M. Shao, Z. Hu, X. Huang and Q. Shao, Adv. Mater., 2025, 37, 2415978 CrossRef CAS PubMed.
- J. Chen, C. Chen, M. Qin, B. Li, B. Lin, Q. Mao, H. Yang, B. Liu and Y. Wang, Nat. Commun., 2022, 13, 5382 CrossRef CAS PubMed.
- X. Zheng, X. Shi, H. Ning, R. Yang, B. Lu, Q. Luo, S. Mao, L. Xi and Y. Wang, Nat. Commun., 2023, 14, 4209 CrossRef CAS PubMed.
- U. Lacnjevac, R. Vasilic, T. Tokarski, G. Cios, P. Zabinski, N. Elezovic and N. Krstajic, Nano Energy, 2018, 47, 527 CrossRef CAS.
- U. Lacnjevac, R. Vasilic, A. Dobrota, S. Durdic, O. Tomanec, R. Zboril, S. Mohajernia, N. Nhat Truong, N. Skorodumova, D. Manojlovic, N. Elezovic, I. Pasti and P. Schmuki, J. Mater. Chem. A, 2020, 8, 22773 RSC.
- Y. Feng, Y. Xie, Y. Yu, Y. Chen, Q. Liu, H. Bao, F. Luo, S. Pan and Z. Yang, Angew. Chem., Int. Ed., 2025, 64, e202413417 CrossRef CAS PubMed.
- Y. Wang, G. Wang, G. Li, B. Huang, J. Pan, Q. Liu, J. Han, L. Xiao, J. Lu and L. Zhuang, Energy Environ. Sci., 2015, 8, 177 RSC.
- W. Li, F. Li, H. Yang, X. Wu, P. Zhang, Y. Shan and L. Sun, Nat. Commun., 2019, 10, 5074 CrossRef CAS PubMed.
- H. Li, F. Xie and M.-T. Zhang, ACS Catal., 2021, 11, 68 CrossRef CAS.
- J. Dai, Y. Zhu, Y. Chen, X. Wen, M. Long, X. Wu, Z. Hu, D. Guan, X. Wang, C. Zhou, Q. Lin, Y. Sun, S.-C. Weng, H. Wang, W. Zhou and Z. Shao, Nat. Commun., 2022, 13, 1189 CrossRef CAS PubMed.
- S. Hao, H. Sheng, M. Liu, J. Huang, G. Zheng, F. Zhang, X. Liu, Z. Su, J. Hu, Y. Qian, L. Zhou, Y. He, B. Song, L. Lei, X. Zhang and S. Jin, Nat. Nanotechnol., 2021, 16, 1371–1377 CrossRef CAS PubMed.
- C. Jing, T. Yuan, L. Li, J. Li, Z. Qian, J. Zhou, Y. Wang, S. Xi, N. Zhang, H.-J. Lin, C.-T. Chen, Z. Hu, D.-W. Li, L. Zhang and J.-Q. Wang, ACS Catal., 2022, 12, 10276 CrossRef CAS.
- M. Dhilip, J. S. Punitha, R. Rameshkumar, S. Rameshkumar, P. Karuppasamy, M. S. Pandian, P. Ramasamy, K. S. Kumar, V. Anbarasu and K. Elangovan, Appl. Phys. A: Mater. Sci. Process., 2022, 128, 324 CrossRef CAS.
- D. N. Singh, D. K. Mahato and T. P. Sinha, Physica B, 2018, 550, 400 CrossRef CAS.
- Pooja, K. S. Chikara, Aprajita, S. N. Sarangi, D. Samal, S. Saha, A. K. Bera, S. M. Yusuf and C. Sow, Phys. Rev. B, 2024, 110, 184425 CrossRef CAS.
- E. Sediva, T. Defferriere, N. H. Perry, H. Tuller and J. L. M. Rupp, Adv. Mater., 2019, 31, 1902493 CrossRef PubMed.
- F. X. Zhang, M. Lang, Z. Liu and R. C. Ewing, Phys. Rev. Lett., 2010, 105, 015503 CrossRef CAS PubMed.
Footnotes |
| † Electronic supplementary information (ESI) available. See DOI: https://doi.org/10.1039/d5ee01422k |
| ‡ Y. F. and J. Z. contributed equally to this work. |
| This journal is © The Royal Society of Chemistry 2025 |