
 Open Access Article
 This Open Access Article is licensed under a Creative Commons Attribution-Non Commercial 3.0 Unported Licence
Neutral and ionic Co(II) metal–organic frameworks with 2-methylimidazole and trimesate: design and evaluation for molecule encapsulation and slow release†
Jose de Jesus
Velazquez Garcia
 *a,
Luis
de los Santos Valladares
bc,
Crispin H. W.
Barnes
b,
Sandra
König
d,
Michael
Fröba
d,
Volodymyr
Baran
a,
Bassima
Knjo
e,
Faegheh
Khademhir
e,
Aliyenur
Ekineken
e,
Fabienne
Hain
e,
Evke
Carstensen
e,
Tom
Spillner
e,
Lina
Asprilla Herrera
f,
Weronika
Łukaszczyk
g and
Simone
Techert
ah
*a,
Luis
de los Santos Valladares
bc,
Crispin H. W.
Barnes
b,
Sandra
König
d,
Michael
Fröba
d,
Volodymyr
Baran
a,
Bassima
Knjo
e,
Faegheh
Khademhir
e,
Aliyenur
Ekineken
e,
Fabienne
Hain
e,
Evke
Carstensen
e,
Tom
Spillner
e,
Lina
Asprilla Herrera
f,
Weronika
Łukaszczyk
g and
Simone
Techert
ah
aDeutsches Elektronen-Synchrotron DESY, Notkestr. 85, 22607 Hamburg, Germany. E-mail: jose.velazquez@desy.de
bCavendish Laboratory, Department of Physics, University of Cambridge, CB3 0HE Cambridge, UK
cLaboratorio de Ceramicos y Nanomateriales, Facultad de Ciencias Fisicas, Universidad Nacional Mayor de San Marcos, 14-0149, Lima, Peru
dInstitute of Inorganic and Applied Chemistry, University of Hamburg, 20146 Hamburg, Germany
eBS 06 Berufliche Schule Chemie, Biologie, Pharmazie, Agrarwirtschaft, Ladenbeker Furtweg 151, 21033 Hamburg, Germany
fDepartment of Chemistry, Faculty of Natural and Exact Sciences, Universidad del Valle, Calle 13 No. 100-00, 760042 Cali, Colombia
gFaculty of Chemistry, Jagiellonian University in Kraków, Gronostajowa 2, 30-387, Kraków, Poland
hInstitut für Röntgenphysik, Georg-August-Universität Göttingen, Friedrich-Hund-Platz 1, 37077 Göttingen, Germany
First published on 9th January 2025
Abstract
Two Co(II) mixed-ligand metal–organic frameworks (MOFs) based on 2-methylimidazole and trimesate were synthesised at room temperature. The structure and properties of the two MOFs, named material Deutsches Elektronen Synchrotron-1 and -2 (mDESY-1 and mDESY-2), were verified by single crystal X-ray diffraction (SCXRD), powder X-ray diffraction (PXRD), SQUID magnetic susceptibility and N2 adsorption. The structural analysis indicates that mDESY-1 is a 3D ionic framework with 2-methyl-1H-imidazol-3-ium counterions residing in its pores, while mDESY-2 is a 2D neutral framework isostructural to ITH-1, with water as a co-crystallising solvent. PXRD data demonstrates that mDESY-1 exhibits better crystallinity than mDESY-2. Magnetic measurements indicate that both MOFs are paramagnetic with a weak ferromagnetic transition above room temperature. Although both structures suggest the presence of voids, N2 adsorption data confirms that these voids are not accessible in either MOF. Nevertheless, mDESY-1 was capable of encapsulating azobenzene during synthesis, which was observed via SCXRD. The encapsulated molecules were then slowly released in ethanol, with a release of up to 30 mg of azobenzene per g of MOF in a period of 60 days.
Introduction
Metal–organic frameworks are porous materials constructed from metal ions or clusters and organic bridging ligands.1,2 The ability to fine-tune their properties by varying metal ions, ligands and synthesis conditions have made MOFs significantly attractive for a wide range of applications such as carbon capture,3 gas storage and separation,4 heterogeneous catalysis,5 luminescence,6 chemical sensing,7 biological imaging,8 and drug delivery.9Among the various combinations of MOFs, the ionic MOFs (iMOFs) subclass remains relatively unexplored with just over 1000 publications as of 2021.10 Ionic MOFs are charged frameworks (either positive or negative) containing uncoordinated counter ions inside the framework, which maintain the overall charge neutrality. This subclass can be further divided into cationic MOFs (iMOFs-C) and anionic MOFs (iMOFs-A). While iMOFs-C bear free counter anions inside their pores, iMOFs-A contain free counter cations.11 The ions inside the charged frameworks are often exchanged with other exogenous ions, which makes them ideal candidates for application in ion exchange resins.11–13
The selection of metal ions/cluster, ligands and counter ions is crucial for developing new iMOFs.11 Imidazolium derivatives and benzene 1,3,5-tricarboxylic acid (H3btc) are frequently used as ligands for the synthesis of ionic frameworks.10,11,14,15 For example, Hupp et al. utilised 1,3-bis(2,6-dimethyl-3,5-dicarboxylphenyl)imidazolium as a ligand to synthesise the cationic framework [Cu2(C23H17N2O4)(DMSO)2][Cl],16 while Wang et al. used H3btc to develop a 12-connected anionic MOF with the formula H2Na4[Cu12(OH)6(pz−)6(btc)6]·23H2O (pz− = pyrazolate).17 However, a 3D iMOF-A based on the common ligands 2-methylimidazole (mIm) and benzene 1,3,5-tricarboxylic acid with 2-methylimidazolium (HmIm) counter ions has not yet been reported.
Benzene 1,3,5-tricarboxylic acid, also known as trimesic acid, and 2-methylimidazole are two well-known organic compounds used in the synthesis of MOFs and other small molecules. For instance, mIm is employed in the synthesis of zeolitic imidazolate frameworks (ZIFs), such as ZIF-818 and ZIF-67,19 while H3btc is used in the production of HKUST-1.20 The ligands have also been combined with zinc ions to synthesise a 2D mixed-ligand MOF named ITH-1.21 This MOF possesses a neutral network with linking btc linkers and mono coordinated mIm moieties as pendants throughout the framework. In the case of small molecules, we have previously demonstrated that the protonated HmIm and the deprotonated btc can form a hexaaquacobalt-based complex with 1H-imidazol-3-ium cations when mixed with CoCl6·6H2O in EtOH![[thin space (1/6-em)]](https://www.rsc.org/images/entities/char_2009.gif) :water:DMF solution.22 Additionally, we have demonstrated that the organic ligands can form a crystal structure containing 1H-imidazol-3-ium as cation and the singly deprotonated 3,5-dicarboxybenzoate as anion.23
:water:DMF solution.22 Additionally, we have demonstrated that the organic ligands can form a crystal structure containing 1H-imidazol-3-ium as cation and the singly deprotonated 3,5-dicarboxybenzoate as anion.23
The combination of imidazolates and polycarboxylates with metal salts to produce MOFs and coordination polymers is a well-established strategy, with many compounds synthesised through this approach.24–36 For example, Zhu and et al. reported the synthesis of a mixed-ligand MOF [Co7(bdc)6(nIm−)2(H2O)6]·3H2O·3DFM, (H2bdc = 1,4-benzenedicarboxylic acid, nIm = 2-nitroimidazole), which formed a 3D framework with polyhedral cages measuring up to 31.019 Å in diagonal length, and exhibited a CO2 uptake capacity of 14.5 wt% at 273 K and 1 atm.34 Another example has been provided by Kirillov et al., who synthesised the 3D network [Zn2(μ4-Clta)(μ4-biim2−)]n and the 1D coordination polymer [Cd(μ-Clta)(μ4-biim)]n, (H2Clta = 2-chloroterephthalic acid, biim = 2,2′-biimidazole), both of which showed catalytic potential in the coupling of CO2 with epoxides.35 Finally, Balkus and et al. developed two 2D mixed-linker MOFs by incorporating a secondary linker (1,4-benzenedicarboxylic acid or 2,6-naphthalenedicarboxylic acid) into the 1D coordination polymer Cu(L1−)(Cl)2, (L1 = 2,2′-(1H-imidazole-4,5-diyl)di-1,4,5,6-tetrahydropyrimidine). In these compounds, hydrogen bonding between two different linkers promotes layer stacking, resulting in a 3D structure with internal pore channels.36 While these materials exemplify the versatility of the mixed-ligand strategy in constructing a variety of metal–organic structures, none of these examples form an iMOF, highlighting the rarity of this type of material.
Here, we present two CoII mixed-ligand MOFs using the well-known mIm and btc ligands (Fig. 1). The structural analysis demonstrates that the iMOF designated as mDESY-1 forms an anionic 3D framework with btc linkers, mono coordinated mIm as pendants and HmIm as counterions residing in the channels of the framework. On the contrary, the neutral MOF, named mDESY-2 (also Co-ITH-1), is a 2D network isostructural to the previously reported ITH-1.21 Adsorption measurements indicate that both frameworks are non-porous. However, azobenzene molecules can be captured inside the channels of mDESY-1 during synthesis, which can later be slowly released in ethanol.
 | ||
| Fig. 1 Lewis structure for (a) mIm and (b) btc− ligands. | ||
Synthesis and methods
Materials
Ethanol (≥99.8%), mIm (99%) and H3btc (95%) were purchased from Sigma-Aldrich, while CoCl2·6H2O (98%) and azobenzene (>97%) were bought from Alfa Aesar. The chemicals were used as received.Synthesis of MOFs
Characterisation
The crystal structures of mDESY-1, azobenzene and Azo@mDESY-1 were determined at room temperature (∼290 K) using a single-crystal diffractometer at DESY, Hamburg, Germany. The crystals were mounted on an APEX Duo Bruker diffractometer equipped with a monochromatic X-ray source (Mo Kα, λ = 0.71073 Å) and an APEX CCD detector. Data frames were collected through multiple φ and ω scans of crystal orientations, with a step size of 0.5° and an exposure time of 15 seconds per frame for azobenzene and mDESY-1. The encapsulation of azobenzene in mDESY-1 reduced the crystallinity of the MOF, and therefore, the exposure time was increased to 60 seconds per frame to obtain a maximum resolution of 0.88 Å. The sample-to-detector distance was maintained at 50 mm. Data reduction was performed using the SAINT program.38
The crystal structures of all collected data were solved with the SHELXT39 structure solution program within the Olex2 software package.40 Subsequently, the structures were refined against F2 isotropically, followed by full matrix anisotropic least squares refinement by SHELXL.41 In the final cycle of the refinement, hydrogen atoms were fixed geometrically in idealised positions and allowed to ride with the respective C or N atoms to which each was bonded. The solvent mask routine incorporated in Olex2 was used to remove the disordered HmIm cations in mDESY-1.
Figures of the asymmetric unit and packing of the mDESY-1 with refinement of one counter ion laying in a symmetry element are provided in Fig. S2.† Crystal data and structure refinement parameters for mDESY-1 (after solvent mask) and mDESY-2 at 100 K are provided in Table S1,† while the corresponding data for mDESY-1, azobenzene and Azo@mDESY-1 at room temperature (RT) is presented in Table S2.† Ortep plots for all structures are available in ESI (ESI, Fig. S3–S7†) along with images of mDESY-1 and mDESY-2 view down all axes (Fig. S8 and S9†). Selected bond lengths and angles for all structures in this work are reported in Tables S3 and S4.†
PXRD data for mDESY-1 sample was collected at P02.1 beamline, PETRA III.42 Crystals of the sample were grounder in agate mortar under solution, transferred together with the solution into 0.8 mm in diameter special glass capillary, and held vertically to let the powder sediment to increase the density of powder at the measurement point. Data was collected for capillary sput at 5000 Hz for 180 s using the VAREX CT 4343 detector (150 × 150 μm pixel size and 2880 × 2880 pixel area). The wavelength was 0.20734 Å and the detector configuration was calibrated using the LaB6 SRM 660c standard. The calibration and integration were performed using the pyFAI software.43 The LeBail fit of the data was performed using the FullProf software.44
Adsorption measurements
Nitrogen physisorption measurements were performed using a 3Flex Analyzer (Micromeritics Instrument Corp.). Prior to the measurements, the samples were activated at 120 °C for 20 h under reduced pressure using a Smart VacPrep Degasser (Micromeritics Instrument Corp.). For data reduction, the software MicroActive, Version 6.00, was used. The Brunauer–Emmett–Teller (BET) method was used to determine the specific surface area (p/p0 range from 0.1 to 0.3) as well as the total pore volume at 0.99 p/p0.Release of azobenzene
An 8 ml vial containing 10 mg of Azo-mDESY-1 was filled with 6 ml of ethanol. The resulting heterogeneous mixture was left in the vial for a period of 2 months. UV-visible (UV-vis) spectroscopy was used to analyse the solution at specific time intervals: 1, 3, 7 and 10 hours after the addition of ethanol, and subsequently after 1, 3, 7, 10, 30 and 60 days. In each measurement, 2 ml aliquots were taken from the vial and placed in a cuvette of 12.5 × 12.5 × 45 mm dimensions. The aliquots were returned to the vial after each measurement. The experiments were conducted in triplicate. UV-vis spectra at room temperature were collected on a Varian Caray-5E UV-vis Spectrometer. All UV-vis data was collected at a scan rate of 0.2 nm s−1 over the wavelength range of 200–800 nm with an interval size of 0.5 nm.Results
Structural information
The crystal structures for mDESY-1 and mDESY-2 are quite different. mDESY-1 crystallises in the tetragonal space group I41/a; the asymmetric unit contains one cobalt(II) ion, one btc ligand and one disordered mIm, which is split into two sites. The Co(II) ion adopts a tetrahedral geometry, defined by one Nimidazole and three Ocarboxylate atoms (Fig. 2a). Based on these connections, Co(II) ions are bridged by btc ligands to generate an anionic 3D framework with square channels along the c axis (Fig. 2b). However, the counter ion HmIm resides disorderly inside of the channels, obstructing the pores (Fig. S2†). Topological features of mDESY-1 were obtained by means of the ToposPro45 software. The analysis reveals 3-c deh net for mDESY-1 (point symbol = 82.10 and vertex symbol = [8.8(2).12], Fig. 3a). On the other hand, mDESY-2 crystallises in the C2/c space group with an asymmetric unit formed by two crystallographically independent Co atoms (Co1 and Co2). Each Co atom is tetrahedrally coordinated to two nitrogen atoms from the mIm ligands and two oxygen atoms from btc linkers (Fig. 2c). A non-coordinated water molecule resides within the lattice. The compound forms neutral 2D layers parallel to the (010) plane (Fig. 2d). These layers are interconnected via hydrogen bonds Owater–H⋯Ocarboxylate, and Nimidazole–H⋯Ocarboxylate. Topological features for mDESY-2 obtained by the ToposPro software show a 3-c hcb topology with point symbol = 63 and vertex symbol = [6.6.6] (Fig. 3b). | ||
| Fig. 2 Structure of mDESY-1 and mDESY-2 (Co-ITH-1). Hydrogen atoms, water and disorder molecules were omitted for clarity. | ||
 | ||
| Fig. 3 Underlaying nets of (a) mDESY-1 and (b) mDESY-2 calculated by the ToposPro software. | ||
The distortion of the coordination polyhedra in both MOFs was evaluated according to the Avnir46,47 method, based on the continuous shape measure (CShM). The SHAPE48 program was employed for this analysis, and the results have been summarised in Table 1. A CShM value of 0 corresponds to a perfect shape match, indicating no distortion from the ideal geometry. As the value increased, the degree of distortion or deviation from the ideal shape also increased. The CShM values for mDESY-1 and mDESY-2 showed a slight deviation from the ideal tetrahedral shape [S(T) = 0] and significantly larger deviation from the ideal square planar geometry [S(SP) = 0]. The greatest distortion in the coordination environment of the Co(II) ion was observed in mDESY-1, with S(T) values ranging from 1.161 to 1.400.
| Ion | mDESY-1 | mDESY-2 | |
|---|---|---|---|
| Co(1) | Co(1) | Co(2) | |
| Coordination | 4 | 4 | 4 |
| S(SP) | 29.647–29.856 | 26.901 | 27.948 |
| S(T) | 1.161–1.400 | 0.842 | 0.361 |
| τ 4 | 0.828 | 0.887 | 0.905 |
For comparison, the τ4 parameter was also employed to assess the distortion of the coordination polyhedra in both MOFs. This is a very simple geometry index for four-coordinate complexes, defined as:49

The τ4 values were consistent with the CShM values, both indicating slight deviation from the ideal tetrahedral geometry (Table 1). The smallest τ4 value was found in mDESY-1 (0.828), indicating a larger distortion compared to the Co(II) centres in mDESY-2, which exhibited τ4 values closer to 1 (ranging from 0.887 to 0.905), suggesting a geometry closer to the perfect tetrahedron.
Fig. 4a shows the PXRD of mDESY-1, alongside its calculated pattern obtained through Le Bail fit, based on the structural model of mDESY-1 at 290 K (see Encapsulation of azobenzene section). The strong agreement between the observed data (black line) and the calculated pattern (red circles) demonstrates the reliability of the fit. The cell parameters obtain from the Le Bail fit (Table S5†) agrees with that observed by the structural model at 290 K (Table S2†). The final fitting parameters are Rp = 9.08, Rwp = 8.12, Rexp = 4.22 and χ2 = 3.70.
 | ||
| Fig. 4 (a) PXRD of mDESY-1 and Le Bail fit of the structure model from single crystal data on PXRD data collected at P02.1, PETRA III (λ = 0.20734 Å), and (b) PXRD of mDESY-2 collected in Bruker D8 Discover (λ = 1.5406 Å) alongside its corresponding simulated pattern generated by the software Mercury. | ||
The difference curve reveals some unfitted peaks or changes in unit cell parameters, which confirm phase purity. These variations could result from minor impurities in the synthesis process or a decomposition product during capillary preparation for PXRD measurements. The fitted cell parameters (see Table S5†) are matching well to those from single crystal data of mDESY-1 at 290 K.
The PXRD pattern of mDESY-2 and its simulated pattern generated from its crystal structure using the Mercury software50,51 is illustrated in Fig. 4b. In contrast to mDESY-1, the fast precipitation of the mDESY-2 framework results in a product with poor crystallinity. Additionally, a second phase is observed, as the prominent peaks between 2θ angles of 25° and 30° do not correspond to mDESY-2. This suggest that further improvements in the synthesis are required to obtain a pure phase of mDESY-2.
Adsorption properties
Crystallographic structures of mDESY-1 and mDESY-2 were analysed in the Mercury CSD software package using the void analysis tools to determine the limiting pore diameter.50,51 Disordered counter ions, if present in the pore, were removed before void analysis. The grid spacing was set to 0.7 Å and the probe size to 1.2 Å. This probe size diameter corresponded to the largest sphere that could be inserted without overlapping the framework atoms.52Fig. 5a shows that mDESY-1 contains several interconnected square channels that run along all of the axes. The total calculated pore volume reaches 4303.85 Å, which represents 45.6% of the unit cell volume. However, as observed by the structural analysis, the pores are blocked by the HmIm counter ions. Fig. 5b demonstrates that mDESY-2 contains three nanopores per unit cell; the pores have a volume of 260.09 Å, which represent 5.1% of the unit cell volume.
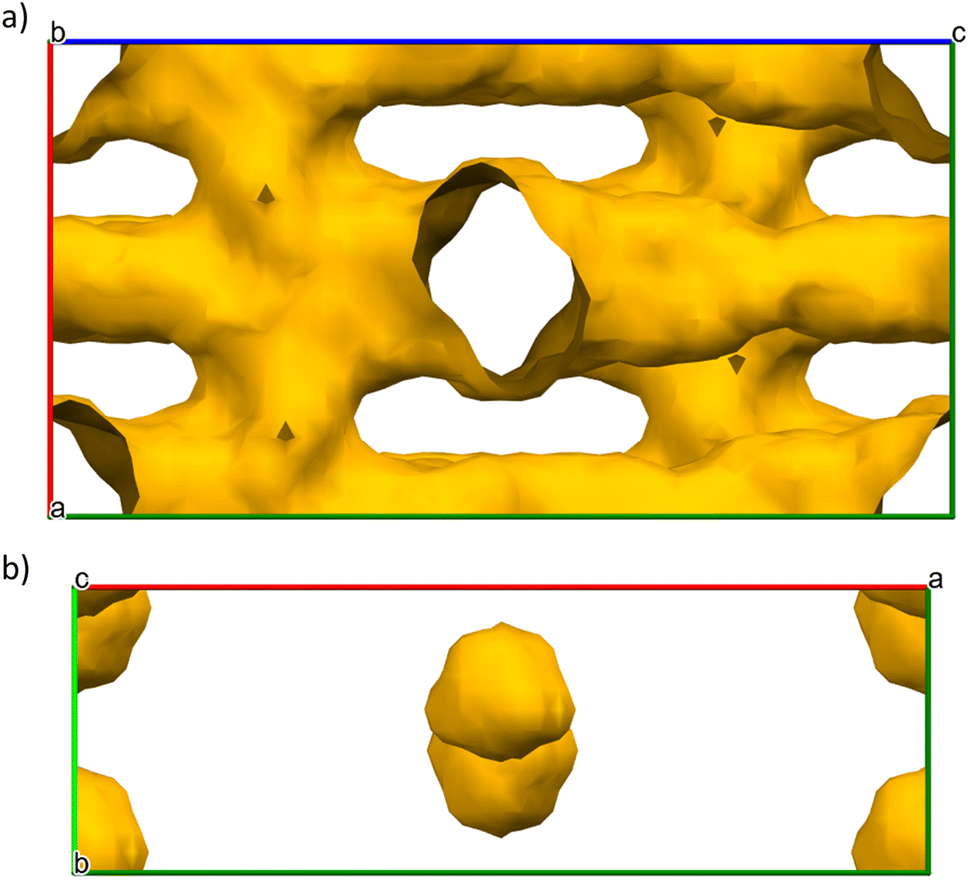 | ||
| Fig. 5 Calculated voids in (a) mDESY-1 and (b) mDESY-2. | ||
The N2 adsorption–desorption isotherms for both MOFs are shown in Fig. 6. The calculated BET surface areas are 2.2 m2 g−1 for mDESY-1 and 9.4 m2 g−1 for mDESY-2. These low adsorption capacities of both MOFs suggest that the voids calculated from the structural models are not accessible. For mDESY-1, the large channels found in the structure are blocked by the HmIm counter ion, while in mDESY-2, the small pores do not have possible access.
 | ||
| Fig. 6 N2 adsorption measurements at 77 K of (a) mDESY-1 and (b) mDESY-2. | ||
Magnetic properties
Fig. S10(a) and (b)† shows the temperature dependence of the magnetic moment for mDESY-1 and mDESY-2. In both cases, the signals are indicative of paramagnetic materials with the magnetic moment decreasing as temperature increases due to thermal vibration. Fig. S10(c) and (d)† displays the χM−1 vs T plots, where the linear response, in both FH and FC modes, intersects the origin (0,0), confirming their paramagnetic behaviour. However, above 340 K for mDESY-1 and 350 K for mDESY-2, the slopes of these linear responses change, suggesting a ferromagnetic rearrangement of the spins in both MOFs. By extrapolating the linear behaviour to the zero level, Curie temperatures (TC) of 110 K mDESY-1 and 52 K for mDESY-2 were determined. Additionally, χMT vs T plots (Fig. S10e and f†) were constructed to better identify any irreversibility in the FH and FC loops. These plots indicate a weak ferromagnetic transition above 300 K for mDESY-1 and 320 K for mDESY-2, possibly signalling the onset alignment of some spins in the sample. Remarkably, an irreversible behaviour was noted in the FC loop, possibly due to these aligned spins.To verify the magnetic behaviour of the samples, the measurement was repeated under a 0.2 T applied field. The temperature range was varied from 282 to 3 K in FC mode, then from 3 to 350 K in FH mode and finally from 350 to 200 K in FC mode (Fig. S11a and b†). Fig. S11(c)† confirms that mDESY-1 retained its ferromagnetic transition with a change in the TC to 83 K. On the contrary, the inset plot in Fig. S11(d)† reveals an absent ferromagnetic transition for mDESY-2. The χMT vs T plots were constructed again to better differentiate if the irreversibility and magnetic transition persisted (Fig. S11e and f†). For mDESY-1, the magnetic transition reappears around 300 K, confirming that although most of the spins in the sample were miss-oriented, some spins realigned at this temperature. In the case of mDESY-2, the ferromagnetic alignment persisted at 320 K, but the loop became reversible, indicating a lack of thermal coercivity and that the spins in the sample were primarily affected by thermal vibrations.
Encapsulation of azobenzene
The encapsulation of azobenzene in mDESY-1 was demonstrated by single crystal diffraction at room temperature. Upon incorporating azobenzene into mDESY-1, the structure could still be solved in the I41/a space group, albeit with a significantly higher redundancy-independent R factor (Rint). Additionally, azobenzene molecules were not discernible. To solve this, the structure of Azo@mDESY-1 was solved in the P![[1 with combining macron]](https://www.rsc.org/images/entities/char_0031_0304.gif) space group. In this way, the azobenzene molecules were clearly identified within the pores of the MOF. Fig. 7 (a) and (b) displays the structure of the loaded mDESY-1 and its packing in a ball-and-stick style, with the counterions HmIm omitted for clarity. Fig. 7a reveals that the azobenzene molecules exhibit orientational disorder. This disorder is dynamic, consistent with observations from structural studies of free trans-azobenzene at room temperature.53–55 This dynamic disorder is attributed to the torsional vibration of the N–Ph bonds. Fig. 7b demonstrates that the azobenzene molecules are located within the channels of the MOF, with the longest axis of the azobenzene aligned along the channel direction. The azobenzene molecule is located near the walls of the channel but does not exhibit strong interactions with the metal ions or the framework's ligands. The Hirshfeld isosurface analysis demonstrates that the primary interaction of the azobenzene is with the closest HmIm counterion (Fig. 7c). Other interaction between azobenzene molecules and other counterions or residual linkers within the pores are not visible, as the solvent mask was used for molecules that could not be modelled during the structure solution and refinement process.
space group. In this way, the azobenzene molecules were clearly identified within the pores of the MOF. Fig. 7 (a) and (b) displays the structure of the loaded mDESY-1 and its packing in a ball-and-stick style, with the counterions HmIm omitted for clarity. Fig. 7a reveals that the azobenzene molecules exhibit orientational disorder. This disorder is dynamic, consistent with observations from structural studies of free trans-azobenzene at room temperature.53–55 This dynamic disorder is attributed to the torsional vibration of the N–Ph bonds. Fig. 7b demonstrates that the azobenzene molecules are located within the channels of the MOF, with the longest axis of the azobenzene aligned along the channel direction. The azobenzene molecule is located near the walls of the channel but does not exhibit strong interactions with the metal ions or the framework's ligands. The Hirshfeld isosurface analysis demonstrates that the primary interaction of the azobenzene is with the closest HmIm counterion (Fig. 7c). Other interaction between azobenzene molecules and other counterions or residual linkers within the pores are not visible, as the solvent mask was used for molecules that could not be modelled during the structure solution and refinement process.
 | ||
| Fig. 7 (a) Structure of Azo@mDESY-1 at 290 K, counterions were omitted for clarity. (b) Packing of Azo@mDESY-1 at 290 K showing the position of the azobenzene molecule (green) in the channels of the MOF, counterions were omitted for clarity. (c) Hirshfeld isosurface of azobenzene inside of mDESY-1, showing the main interactions. | ||
A comparative analysis of bond lengths was made between encapsulated trans-azobenzene and free trans-azobenzene in single crystal form. The structure of the free trans-azobenzene at room temperature was determined, revealing a P21/c space group with two crystallographically independent molecules in the asymmetric unit. In agreement with previous results in literature,53–55 both crystallographically independent molecules lay at inversion centres and were nearly planar. Molecules at one of the crystal sites showed no disorder (site 1), while those at the other site (site 2) exhibited orientational dynamic disorder as previously mentioned (Fig. S6†).53–55 The degree of misorientation was determined to be 11.3%, which is slightly smaller than the reported value in literature (17–18%).53,55
Table 2 compares the main bond lengths and angles of the encapsulated azobenzene and both crystallographically independent molecules of the free azobenzene. The table highlights both the differences and similarities between the free and the encapsulated forms. The encapsulated and free azobenzene exhibit similar benzene centroid-to-centroid distances. While the –C–N![[double bond, length as m-dash]](https://www.rsc.org/images/entities/char_e001.gif) N– angles are shorter in the encapsulated azobenzene, this is compensated by longer –NN– bond lengths. Interestingly, the –C–NN–C– torsion angles and the angle between benzene rings indicate a non-parallel orientation of the rings in the encapsulated azobenzene, contrasting with the parallel arrangement observed in the free azobenzene molecules.
N– angles are shorter in the encapsulated azobenzene, this is compensated by longer –NN– bond lengths. Interestingly, the –C–NN–C– torsion angles and the angle between benzene rings indicate a non-parallel orientation of the rings in the encapsulated azobenzene, contrasting with the parallel arrangement observed in the free azobenzene molecules.
| Free trans-azobenzene | Encapsulated trans-azobenzene | ||
|---|---|---|---|
| Site 1 | Site 2 | ||
| Benzene ring centroid to centroid distance (Å) | 6.266 | 6.266 | 6.269 |
| –NN– (Å) |
1.241 (2) | 1.205 (3), 1.380 (2) | 1.33 (2) |
| –C–NN– (°) |
114.0 (1) | 112.1 (3), 105 (1) | 105 (2)–106 (2) |
| –C–NN–C– (°) |
180.0 (1) | −180.0 (2), −180.0 (8) | −172 (2), −180 (2) |
| Angle between benzene rings (°) | 0 | 0 | 9.91 |
As mentioned earlier, the best method to observe azobenzene molecules within the pores of Azo@mDESY-1 involved solving the structure using a P space group. To compare the contents and the structural change of the ionic framework with and without azobenzene, the structure of mDESY-1 at room temperature was also solved using the P space group, applying a solvent mask for the pore's contents that could not be modelled. The comparison of both structures revealed that more HmIm ions can be modelled in Azo@mDESY-1 as the azobenzene molecules occupied the space between counterions, forcing more HmIm ion to align (Fig. S12†). In the structure of mDESY-1, one HmIm ion was disordered across two positions, while in Azo@mDESY-1, four HmIm ions were present, with two refined with 50% occupancy. The remaining 50% of those counter ions were disordered and suppressed by the solvent mask.
A comparative analysis of the metal ions’ coordination environment shows a slight change in the framework. Table 3 indicates that while there is no significant difference in the average Co–N or Co–O bond lengths, the main difference lies in the distortion of the Co ion's coordination environment relative to a perfect tetrahedron. In Azo@mDESY-1, this distortion is more pronounced, suggesting that the incorporation of azobenzene into the MOF induces a distortion in the overall network. This distortion also leads to a change in the unit cell dimensions, with the a axis of Azo-mDESY-1 being 0.25 Å shorter than that of mDESY-1 (Table S2†).
| mDESY-1 | Azo@mDESY-1 | |
|---|---|---|
| 〈Co–N〉 (Å) | 2.019 (3) | 2.022 (5) |
| 〈Co–O〉 (Å) | 1.982 (2) | 1.983 (4) |
| S(SP) | 30.140–30.266 | 28.459–30.368 |
| S(T) | 0.957–0.993 | 0.955–1.449 |
| τ 4 | 0.840–0.842 | 0.802–0.840 |
The PXRD pattern of Azo@mDESY-1 (Fig. 8) shows some agreement with the calculated pattern obtained from the single crystal using Mercury software.50,51 However, Fig. 8 also highlights the sample's poor crystallinity. The inclusion of azobenzene during synthesis accelerates the compound's precipitation, which diminishes crystal quality. Additionally, the encapsulation of azobenzene distorts the network, which may introduce defects that further reduce the crystallinity. Efforts to synthesise Azo@mDESY-1 with lower amounts of azobenzene result in better crystal quality, but the azobenzene is not detectable in the crystal structure.
 | ||
| Fig. 8 PXRD pattern of Azo@mDESY-1 alongside its simulation pattern. | ||
Attempts to capture the thermal isomerisation of the encapsulated azobenzene within Azo@mDESY-1 using SCXRD were unsuccessful. However, optical images of the single crystal at different temperatures revealed a colour change with increasing temperature. To start, optical images of Azo@mDESY-1 at room temperature (Fig. 9 a and b) were taken with the microscope in transmission mode. Unlike mDESY-1 (Fig. S13a and b†), the colour of the Azo@mDESY-1 crystal varied depending on its orientation, displaying a red hue in specific orientations. For temperature-dependent images, the crystal was placed on a slide over a heating plate, and the images were taken in reflection mode. Fig. 9c shows the Azo@mDESY-1 crystal at room temperature (∼17 °C), with the crystal exhibiting a purple colour when illuminated from above. After heating the crystal to 130 °C for 20 min to ensure the isomerisation of the azobenzene – which has been measured to occur around 68 °C (Fig. S14†) – the crystal changed colour to dark blue (Fig. 9d). This colour change was attributed to the isomerisation of azobenzene within the MOFs. After cooling the crystal to room temperature for 2 hours, it partially returned to its original colour (Fig. 9e). On the contrary, the optical images of mDESY-1, taken in reflection mode, showed a blue crystal at both room temperature and 130 °C, with the crystal degrading after more than one minute at 130 °C without any colour change (Fig. S13c–e†).
 | ||
| Fig. 9 (a) and (b) Optical images of Azo@mDESY-1 at room temperature at two different orientations in transmission mode. Optical images at different temperatures in reflectance mode: (c) room temperature, (d) 130 °C and (e) 2 h room temperature after heating at 130 °C. | ||
Release of azobenzene
The release of the encapsulated azobenzene from Azo@mDESY-1 was monitored over a two-month period. The UV-Vis spectra from one sample is shown in Fig. S15a,† while Fig. S15b and S15c† present the UV-Vis spectra and the corresponding calibration curve used for quantification. Fig. 10 illustrates the amount of azobenzene released per g of loaded MOF over the 2-month period. The data shows that approximately 30 mg of azobenzene per gram of Azo@mDESY-1 was released over this period. A linear fit of the first 10 hours of release in ethanol indicates a delivery rate of 0.26 mg of azobenzene per hour per gram of Azo@mDESY-1.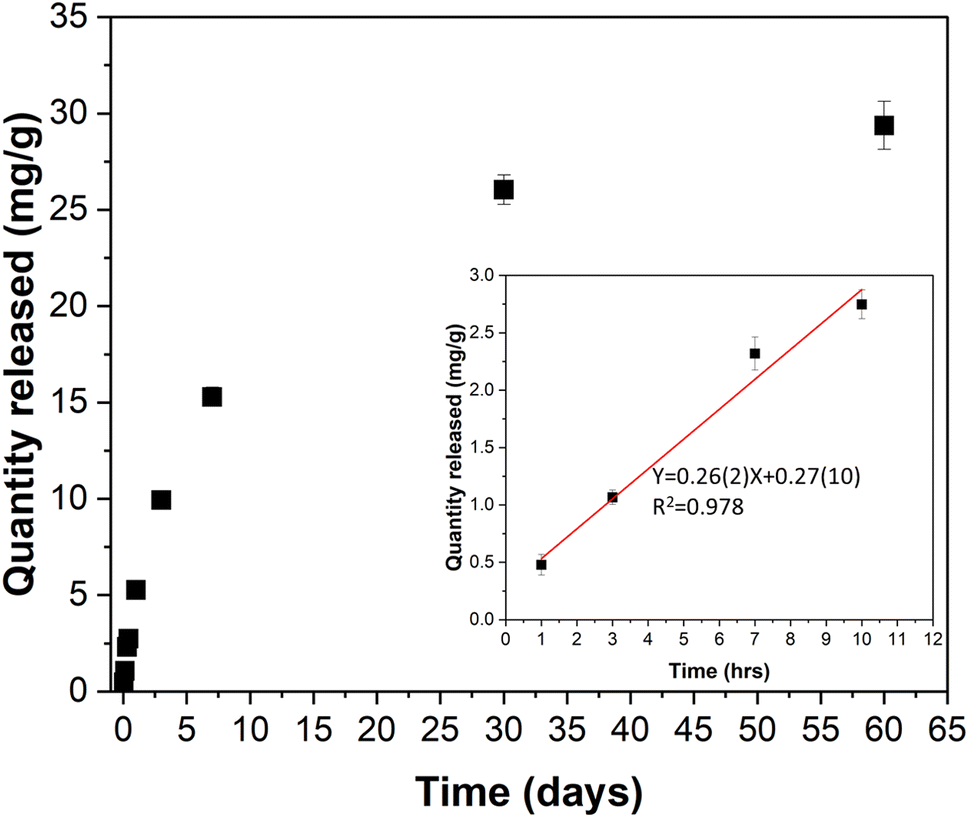 | ||
| Fig. 10 Release of azobenzene from mDESY-1 in ethanol. Inset: Release of azobenzene during the first 10 h and its linear fitting. | ||
The PXRD patterns of Azo@mDESY-1 before and after the release of azobenzene in ethanol are compared in Fig. S16a.† The PXRD patterns indicate that the sample retained some crystallinity, albeit poor, even prior to the release of the azobenzene. However, diffraction images from the SCXRD before and after azobenzene release (Fig. 16b and c†) exhibit a significant deterioration in the sample's quality following the release. This marked change suggests that the MOF is not suitable for reuse in subsequent applications after the release of the small molecules.
The crystallographic structure of Azo@mDESY-1 provide more information about the position of most of the cations within the framework. Therefore, the structural model of the Azo@mDESY-1 (excluding the azobenzene molecules) was examined using the void analysis tool in the Mercury CSD.
Fig. S17† shows the calculated voids in the structure, revealing constricted areas within the channel (red circle). These constrictions indicate a reduction in void space that impact the adsorption or release of molecules within the pores. Additionally, the total calculated pore volume is reduced to 1413.39 Å, accounting for 29.4% of the unit cell volume, compared with the 45.6% obtained in the structural model of mDESY-1 without counterions.
The release of azobenzene requires that the molecule diffuse through the constricted channels of Azo@mDESY-1. This diffusion places considerable stress on the framework, leading structural damage on the crystal, as observed in the diffraction images.
Discussion
Metal–organic frameworks are among the most important classes of materials due to their exceptional tunability, making them promising candidates for a wide range of applications. However, most of the reported MOFs are electrically neutral, with only a small subset classified as ionic MOFs.10 This leaves significant room for exploration in the field of iMOFs, from the synthesis to potential application. While some strategies have been developed to obtain iMOFs, synthesising new iMOFs remains challenging and often occurs by chance.11,14 Therefore, it is crucial to report the synthesis, structure, properties and potential applications of new iMOFs, particularly those that are easily synthesised and do not require complex ligands.The present anionic mDESY-1 is synthesised at room temperature, employing only ethanolic solutions containing the metal source and ligands. This iMOF also has the advantage of being synthesised from cobalt chloride, 2-methylimidazole and trimesic acid, which are well-known inexpensive chemicals. Although the synthesis is straightforward, varying the concentration of the reactants can lead to the formation of the neutral mDESY-2, which is isostructural to the reported ITH-121 and may have similar applications in CO2 fixation due to the nitrogen-rich content. However, the potential application of mDESY-1 extends beyond catalysis or the classical ion-exchange process, as it demonstrates capability of encapsulation and slow release of small molecules. This feature can be exploited for studying photoswitches in confined spaces, as well as for drug delivery.
Photoswitchable molecules are extensively studied because they can serve as building blocks for synthetic molecular machines. Molecular confinement enhances the interaction between photoswitches and their environment by physically trapping the molecules, thereby limiting their diffusion and constraining their movement.56 However, these constraints can significantly reduce their switchability, as observed in some azo compounds within confined spaces.57,58
Here, we have encapsulated azobenzene within mDESY-1, and the change in colour observed through optical images at different temperatures suggests the possibility of thermal isomerisation occurring inside the iMOF. Hirshfeld isosurface analysis indicates that the primary interaction of the encapsulated molecule is with HmIm counterions, raising the possibility that the thermal or photoisomerisation of azobenzene could induce a molecular rearrangement of these counterions. Further investigation is needed to fully explore the thermal- and photoswitchability of azobenezene and its interaction with the environment within mDESY-1. Nonetheless, this study underscores the utility of this ionic MOF.
Another potential application of mDESY-1 could be in the biomedical field, although the cytotoxicity of the cobalt ion is an impairment for its application. In recent years, the application of MOFs in biomedicine has become a rapidly growing area of interest.59–61 Research into MOFs for biomedical application has included the use of iMOFs, as their charged frameworks allow for the encapsulation of ionic drugs.62,63 However, non-ionic drugs, such as 5-fluorouracil, can also be encapsulated by ionic MOFs as demonstrated by Zhang et al.64 In this study, we have shown that mDESY-1 can encapsulate and release a relatively small molecule like azobenzene. Therefore, small drugs such as 5-fluorouracil could be promising candidates for encapsulation and slow release using mDESY-1. Cationic drugs are also good candidates, as they can replace the HmIm counterions inside mDESY-1. However, the cytoxicity of cobalt ions makes mDESY-1 less suitable candidate for in vivo applications. Nevertheless, these tests with mDESY-1 can serve as a valuable proof of concept. If a hydrophobic, isostructural MOF based on a less cytotoxic metal were developed, it could provide a foundation for potential application in the biomedical field.
It is important to note that in this work, we have focused on presenting the structure and some properties of the two mixed-ligand MOFs based on the well-known btc and mIm ligands. Additionally, we have explored the potential applications of the ionic mDESY-1 beyond the well-known ion-exchange process. However, a more in-depth study into the isomerisation of azobenzene, as well as the encapsulation and slow release of molecules within mDESY-1, is necessary and will be detailed in separate publications.
Conclusions
We have successfully synthesised and characterised two new MOFs, utilising inexpensive and well-known chemicals: 2-methylimidazole, trimesic acid and cobalt chloride. The first, mDESY-1, is an iMOF with btc linkers, pendant mIm groups and HmIm counterions. Despite the pore blockage by counterions, the mDESY-1 can encapsulate small molecules like azobenzene when added during the synthesis. SCXRD analysis confirms the presence of the trapped azobenzene, revealing subtle differences compared with its free form.Moreover, the controlled release of azobenzene in ethanol was observed, achieving a release of 30 mg of azobenzene per g of loaded MOF (Azo@mDESY-1) in a period of 2 months. During the first 10 h of the experiment, a delivery rate of 0.26 mg of azobenzene per hour per gram of Azo@mDESY-1 was recorded.
The second MOF, mDESY-2, is a 2D neutral framework that is isostructural to ITH-1 but contains cobalt ions instead of zinc ions. Similar to mDESY-1, the framework in mDESY-2 is formed by btc linkers and pendant mIm groups. However, the material exhibits poor crystallinity and non-accessible pores.
This work highlights the vast potential still left in the field of MOF synthesis. Despite using conventional chemicals, the successful synthesis of mDESY-1 and mDESY-2 demonstrate that novel MOFs with distinct properties can still be discovered. The ongoing exploration of MOF synthesis, particularly in the ionic subclass, is likely to yield further breakthroughs, advancing the capabilities of these versatile materials.
Author contributions
JJVG and ST designed the project. JJVG drafted the manuscript, performed the single crystal crystallographic experiment and analysed all results. LSV and CHWB conducted the first PXRD and magnetic measurements. LSV made the analysis of the magnetic measurements. VB performed the PXRD experiment using synchrotron radiation and the Le Bail fitting. SK and MF carried out the adsorption measurements. BK, FK, AE, FH, as interns, synthesised the MOFs under planning and supervision of JJVG. EC and TS, as interns, synthesised Azo@mDESY-1 and made the calibration curve for the release of azobenzene under the planning and guidance of JJVG. LAH and WŁ, as summer students, re-synthesised mDESY-1 and solved its structure at room temperature and captured its optical images under the guidance of JJVG. All authors provided input and agreed on the final manuscript.Data availability
The authors declare that data supporting the findings of this study are available within the paper and its ESI.† All crystallographic data for this work has been deposited at the CCDC: 2289350, 2289467, 2377931, 2377933 and 2377934.†Conflicts of interest
There are no conflicts to declare.Acknowledgements
Portions of this research were carried out at the light source PETRA-III at DESY, a member of the Helmholtz Association (HGF). We would like to thank P11 and P02.1 staff for assistance in using beamlines. The current work has been funded by the Deutsche Forschungsgemeinschaft (DFG, German Research Foundation) – 217133147/SFB 1073, project B06. HG-recruitment, HG-Innovation “FISCOV” and the CMWS are also thanked for financial support.References
- H.-C. “Joe” Zhou and S. Kitagawa, Chem. Soc. Rev., 2014, 43, 5415–5418 RSC.
- H.-C. Zhou, J. R. Long and O. M. Yaghi, Chem. Rev., 2012, 112, 673–674 CrossRef CAS PubMed.
- K. Sumida, D. L. Rogow, J. A. Mason, T. M. McDonald, E. D. Bloch, Z. R. Herm, T.-H. Bae and J. R. Long, Chem. Rev., 2012, 112, 724–781 CrossRef CAS PubMed.
- H. Li, K. Wang, Y. Sun, C. T. Lollar, J. Li and H.-C. Zhou, Mater. Today, 2018, 21, 108–121 CrossRef CAS.
- A. Bavykina, N. Kolobov, I. S. Khan, J. A. Bau, A. Ramirez and J. Gascon, Chem. Rev., 2020, 120, 8468–8535 CrossRef CAS PubMed.
- M. D. Allendorf, C. A. Bauer, R. K. Bhakta and R. J. T. Houk, Chem. Soc. Rev., 2009, 38, 1330–1352 RSC.
- L. E. Kreno, K. Leong, O. K. Farha, M. Allendorf, R. P. Van Duyne and J. T. Hupp, Chem. Rev., 2012, 112, 1105–1125 CrossRef CAS PubMed.
- H.-S. Wang, Coord. Chem. Rev., 2017, 349, 139–155 CrossRef CAS.
- P. Horcajada, C. Serre, M. Vallet-Regí, M. Sebban, F. Taulelle and G. Férey, Angew. Chem., Int. Ed., 2006, 45, 5974–5978 CrossRef CAS PubMed.
- S. Dutta, Y. D. More, S. Fajal, W. Mandal, G. K. Dam and S. K. Ghosh, Chem. Commun., 2022, 58, 13676–13698 RSC.
- A. Karmakar, A. V. Desai and S. K. Ghosh, Coord. Chem. Rev., 2016, 307, 313–341 CrossRef CAS.
- J. Esteban, M. Ladero and F. García-Ochoa, Chem. Eng. J., 2015, 269, 194–202 CrossRef CAS.
- M. S. Gross, B. S. Sánchez and C. A. Querini, Appl. Catal., A, 2015, 501, 1–9 CrossRef CAS.
- S.-N. Zhao, Y. Zhang, S.-Y. Song and H.-J. Zhang, Coord. Chem. Rev., 2019, 398, 113007 CrossRef CAS.
- Y. Noori and K. Akhbari, RSC Adv., 2017, 7, 1782–1808 RSC.
- J. Y. Lee, J. M. Roberts, O. K. Farha, A. A. Sarjeant, K. A. Scheidt and J. T. Hupp, Inorg. Chem., 2009, 48, 9971–9973 CrossRef CAS PubMed.
- H. Zhang, Y. Lu, Z. Zhang, H. Fu, Y. Li, D. Volkmer, D. Denysenko and E. Wang, Chem. Commun., 2012, 48, 7295 RSC.
- K. S. Park, Z. Ni, A. P. Côté, J. Y. Choi, R. Huang, F. J. Uribe-Romo, H. K. Chae, M. O'Keeffe and O. M. Yaghi, Proc. Natl. Acad. Sci. U. S. A., 2006, 103, 10186–10191 CrossRef CAS PubMed.
- R. Banerjee, A. Phan, B. Wang, C. Knobler, H. Furukawa, M. O'Keeffe and O. M. Yaghi, Science, 2008, 319, 939–943 CrossRef CAS PubMed.
- S. S.-Y. Chui, S. M.-F. Lo, J. P. H. Charmant, A. G. Orpen and I. D. Williams, Science, 1999, 283, 1148–1150 CrossRef CAS PubMed.
- R. R. Kuruppathparambil, T. M. Robert, R. S. Pillai, S. K. B. Pillai, S. K. Kalamblayil Shankaranarayanan, D. Kim and D. Mathew, J. CO2 Util., 2022, 59, 101951 CrossRef CAS.
- J. D. J. Velazquez-Garcia and S. Techert, Acta Crystallogr., Sect. E:Crystallogr. Commun., 2022, 78, 814–817 CrossRef CAS PubMed.
- S. Baletska, S. Techert and J. D. J. Velazquez-Garcia, Acta Crystallogr., Sect. E:Crystallogr. Commun., 2023, 79, 1088–1092 Search PubMed.
- D. Cheng, M. A. Khan and R. P. Houser, J. Chem. Soc., Dalton Trans., 2002, 4555 RSC.
- C.-J. Wang, K.-F. Yue, W.-H. Zhang, J.-C. Jin, X.-Y. Huang and Y.-Y. Wang, Inorg. Chem. Commun., 2010, 13, 1332–1336 CrossRef CAS.
- K. Chen, Y.-S. Kang, L. Luo, Y. Zhao, P. Wang, Q. Liu, Y. Lu and W.-Y. Sun, Polyhedron, 2014, 79, 239–249 CrossRef CAS.
- H.-X. Yang, Y.-Q. Yang, D. Cheng, Y.-X. Li and X.-R. Meng, Acta Crystallogr., Sect. C:Struct. Chem., 2017, 73, 828–832 CrossRef CAS PubMed.
- Q.-Y. Huang, Y. Zhao and X.-R. Meng, Acta Crystallogr., Sect. C:Struct. Chem., 2017, 73, 645–651 CrossRef CAS PubMed.
- G. Yuan, K.-Z. Shao, D.-Y. Du, X.-L. Wang, Z.-M. Su and J.-F. Ma, CrystEngComm, 2012, 14, 1865 RSC.
- Z.-Q. Liu, K. Chen, Y. Zhao, Y.-S. Kang, X.-H. Liu, Q.-Y. Lu, M. Azam, S. I. Al-Resayes and W.-Y. Sun, Cryst. Growth Des., 2018, 18, 1136–1146 CrossRef CAS.
- L. Cheng, S. Gou and J. Wang, J. Mol. Struct., 2011, 991, 149–157 CrossRef CAS.
- B. Li, J. P. Vizuet, G. T. McCandless and K. J. Balkus Jr, Polyhedron, 2023, 230, 116211 CrossRef CAS.
- Y.-C. Cui, J.-J. Wang, B. Liu, G.-G. Gao and Q.-W. Wang, Acta Crystallogr., Sect. E:Struct. Rep. Online, E, 2007, 63, m1204–m1205 CrossRef CAS.
- X.-Q. Guo, M. Wang, Y.-F. Tang, F. Meng, G.-Q. Jiang and J.-L. Zhu, CrystEngComm, 2016, 18, 1768–1774 RSC.
- J. Gu, S. Wan, X. Cheng, M. V. Kirillova and A. M. Kirillov, Cryst. Growth Des., 2021, 21, 2876–2888 CrossRef CAS.
- J. P. Vizuet, T. S. Howlett, A. L. Lewis, Z. D. Chroust, G. T. McCandless and K. J. Balkus, Inorg. Chem., 2019, 58, 5031–5041 CrossRef CAS PubMed.
- W. Kabsch, J. Appl. Crystallogr., 1993, 26, 795–800 CrossRef CAS.
- SAINT, Bruker AXS Inc., Madison, Wisconsin, USA, 2016 Search PubMed.
- G. M. Sheldrick, Acta Crystallogr., Sect. A:Found. Adv., 2015, 71, 3–8 CrossRef PubMed.
- O. V. Dolomanov, L. J. Bourhis, R. J. Gildea, J. A. K. Howard and H. Puschmann, J. Appl. Crystallogr., 2009, 42, 339–341 CrossRef CAS.
- G. M. Sheldrick, Acta Crystallogr., Sect. C:Struct. Chem., 2015, 71, 3–8 Search PubMed.
- A.-C. Dippel, H.-P. Liermann, J. T. Delitz, P. Walter, H. Schulte-Schrepping, O. H. Seeck and H. Franz, J. Synchrotron Radiat., 2015, 22, 675–687 CrossRef CAS PubMed.
- G. Ashiotis, A. Deschildre, Z. Nawaz, J. P. Wright, D. Karkoulis, F. E. Picca and J. Kieffer, J. Appl. Crystallogr., 2015, 48, 510–519 CrossRef CAS PubMed.
- J. Rodriguez-Cavajal, Comm. Powder Diffr. Newsl., 2001, 26, 12 Search PubMed.
- V. A. Blatov, A. P. Shevchenko and D. M. Proserpio, Cryst. Growth Des., 2014, 14, 3576–3586 CrossRef CAS.
- H. Zabrodsky, S. Peleg and D. Avnir, J. Am. Chem. Soc., 1992, 114, 7843–7851 CrossRef CAS.
- M. Pinsky, K. B. Lipkowitz and D. Avnir, J. Math. Chem, 2001, 30, 109–120 CrossRef CAS.
- M. Llunell, D. Casanova, J. Cirera, P. Alemany and S. Alvarez, SHAPE program, version 2.1, Barcelona, 2003 Search PubMed.
- L. Yang, D. R. Powell and R. P. Houser, Dalton Trans., 2007, 955–964 RSC.
- C. F. Macrae, I. Sovago, S. J. Cottrell, P. T. A. Galek, P. McCabe, E. Pidcock, M. Platings, G. P. Shields, J. S. Stevens, M. Towler and P. A. Wood, J. Appl. Crystallogr., 2020, 53, 226–235 CrossRef CAS PubMed.
- C. F. Macrae, I. J. Bruno, J. A. Chisholm, P. R. Edgington, P. McCabe, E. Pidcock, L. Rodriguez-Monge, R. Taylor, J. van de Streek and P. A. Wood, J. Appl. Crystallogr., 2008, 41, 466–470 CrossRef CAS.
- C. L. Hobday, C. H. Woodall, M. J. Lennox, M. Frost, K. Kamenev, T. Düren, C. A. Morrison and S. A. Moggach, Nat. Commun., 2018, 9, 1429 CrossRef PubMed.
- J. Harada, K. Ogawa and S. Tomoda, Acta Crystallogr., Sect. B:Struct. Sci., 1997, 53, 662–672 CrossRef.
- C. J. Brown, Acta Crystallogr., 1966, 21, 146–152 CrossRef CAS.
- J. A. Bouwstra, A. Schouten and J. Kroon, Acta Crystallogr., Sect. B:Struct. Sci., 1983, 39, 1121–1123 Search PubMed.
- A. B. Grommet, L. M. Lee and R. Klajn, Acc. Chem. Res., 2020, 53, 2600–2610 CrossRef CAS PubMed.
- T. Kusukawa and M. Fujita, J. Am. Chem. Soc., 1999, 121, 1397–1398 CrossRef CAS.
- R. Wang, T. Iyoda, L. Jiang, D. A. Tryk, K. Hashimoto and A. Fujishima, J. Electroanal. Chem., 1997, 438, 213–219 CrossRef.
- J. Yang and Y. Yang, Small, 2020, 16, 1906846 CrossRef CAS PubMed.
- M. Wu and Y. Yang, Adv. Mater., 2017, 29, 1606134 CrossRef PubMed.
- K. Lu, T. Aung, N. Guo, R. Weichselbaum and W. Lin, Adv. Mater., 2018, 30, 1707634 CrossRef PubMed.
- Q. Hu, J. Yu, M. Liu, A. Liu, Z. Dou and Y. Yang, J. Med. Chem., 2014, 57, 5679–5685 CrossRef CAS PubMed.
- K. Jiang, W. Ni, X. Cao, L. Zhang and S. Lin, Mater. Today Bio, 2022, 13, 100180 CrossRef CAS PubMed.
- Y. Zhang and J. Wang, Inorg. Chim. Acta, 2018, 477, 8–14 CrossRef CAS.
Footnote |
| † Electronic supplementary information (ESI) available. CCDC 2289350, 2289467, 2377931, 2377933 and 2377934. For ESI and crystallographic data in CIF or other electronic format see DOI: https://doi.org/10.1039/d4dt02679a |
| This journal is © The Royal Society of Chemistry 2025 |