
 Open Access Article
 This Open Access Article is licensed under a Creative Commons Attribution-Non Commercial 3.0 Unported Licence
Enhancing multifunctional drug screening via artificial intelligence†
Junlin
Dong
*abd,
Chenyang
Wu
*abc,
Tianle
Lu
*ab,
Shiyu
Wang
*c,
Wenjin
Zhan
ac,
Marc
Xu
 abc,
Bing
Wang
d,
Zhenquan
Hu
c,
Horst
Vogel
aef and
Shuguang
Yuan
acg
abc,
Bing
Wang
d,
Zhenquan
Hu
c,
Horst
Vogel
aef and
Shuguang
Yuan
acg
aThe Research Center for Computer-Aided Drug Discovery, Shenzhen Institute of Advanced Technology, Chinese Academy of Sciences, Shenzhen, 518055, Guangdong, China. E-mail: shuguang.yuan@cadd2drug.org
bUniversity of Chinese Academy of Sciences, Beijing, 100049, China
cAlphaMol Science Ltd, Allschwil, 4123, Switzerland
dShenzhen Key Laboratory of Drug Quality Standard Research, Shenzhen Institute of Drug Control, Shenzhen, 518057, Guangdong, China
eInstitute of Chemical Sciences and Engineering, École Polytechnique Fédérale de Lausanne, Lausanne, Switzerland. E-mail: horst.vogel@epfl.ch
fFaculty of Pharmaceutical Sciences, Shenzhen University of Advanced Technology, Shenzhen, 518055, Guangdong, China
gChina Pharmaceutical University, Nanjing, 210009, Jiangsu, China
First published on 20th June 2025
Abstract
Computational drug screening is of fundamental importance in early-stage drug discovery. The current computational methods predict compound affinities to their targets based on docking or pharmacophore (PH4) hypotheses. Here, we develop Alpha-Pharm3D, a versatile deep learning method that predicts ligand–protein interactions using 3D PH4 fingerprints by explicitly incorporating geometric constraints. This comprehensive new algorithm enhances substantially not only the prediction interpretability and accuracy of binding affinities of ligands against the target protein, but also the PH4 potential for screening large compound libraries efficiently. Alpha-Pharm3D outperforms state-of-the-art scoring methods in bioactivity prediction and achieves considerable improvements in both accuracy and success rate, irrespective of data scarcity. We demonstrate the superior applicability of Alpha-Pharm3D for compound screening against the NK1R, a cancer growth and metastasis related G-protein coupled receptor, yielding nanomolar active compounds. This opens up attractive possibilities for applying PH4 fingerprints to efficiently promote scaffold hopping and ultimately accelerate ligand-based drug discovery.
Introduction
Identifying potential candidates with novel scaffolds and desirable properties has always been a challenging and time-intensive process in modern drug discovery.1 Exploring the vast chemical space is essential for hunting small-molecule drug candidates with therapeutic effects.2–5 Virtual screening and molecular generation methods enhance the efficiency of modern, high-throughput drug development by evaluating binding efficacy through ligand–protein interaction predictions and compound substructure similarity matching.6,7 Such methods are widely applied to drug repurposing,8 scaffold hopping9 and lead optimization.10 They consider explicitly the interaction profile with drug targets, druggability and synthetic accessibility of the proposed molecules.11Macromolecules exert physiological functions through the interaction with small molecular counterparts. In exploring the chemical environment of the target protein, ligands could engage in non-covalent interactions such as π–π stacking, hydrophobic contacts and electrostatic interactions. The interaction patterns of a collection or ensemble of ligands or targets can be effectively integrated into a 3D pharmacophore (PH4), summarizing the key chemical and structural features involved in the interactions.12 Searching for PH4s, which encode binding properties between ligands and proteins, has been a critical step for accelerating virtual screening. With the substantial growth of molecular virtual databases, the PH4 concept has regained increasing interest in drug discovery.13–15 The use of PH4 fingerprints in virtual drug screening has been promising in selecting compounds fitting optimally into protein–ligand binding pockets and thereby alleviating the expensive burden of wet-lab functional screening experiments.16 This cheminformatics approach facilitates the development of two-dimensional (2D) or three-dimensional (3D) Quantitative Structure–Activity Relationship (QSAR) models, thus expediting interpretable hit identification and lead optimization.17,18
Common PH4 modeling methods can be categorized into three types based on the type of input data.19 (1) Ligand-based PH4 modeling identifies the chemical properties and spatial positions of functional groups within molecules by superimposing the structure of single or multiple small molecules via molecular field and substructure pattern recognition.20,21 (2) The receptor-based PH4 perception method examines the chemical properties and surface charges of residues within the pocket by analyzing the input apo protein 3D structure and specific binding cavity coordinates.22 (3) The complex-based approach depends on the high-quality structures of protein–ligand complexes and constructs a PH4 model by analyzing the chemical and structural properties of the interacting groups.23 Although PH4 models constructed from complex structures offer better interpretability and accuracy, obtaining the structure of ligand–protein complexes with appropriate affinity can be challenging. Moreover, the limited availability of complex structures of various protein active states creates a hurdle to accurate PH4 modeling. Hence, integrating the geometric representation of the binding pocket into the ligand-based approach enables the modeling of multiple compounds with different scaffolds simultaneously, exploiting the advantages of multi-modal data sources and providing a suitable interface for the integration of deep learning techniques.
At present, ligand-based PH4 modeling effectively aggregates and generalizes the chemical properties of various small molecules. Such conventional methodologies are limited by the quantity and diversity of ligands. Only structurally similar compounds can be used to build feasible PH4 models, which results in generating molecules with less diversity.24 This could inadvertently introduce biases towards specific functional groups, potentially hindering the scalability of the approach for high throughput drug development programs.25,26 A multitude of machine learning algorithms have been developed and refined for molecular scoring and molecular generation, leveraging PH4 fingerprints.27,28 Here, we argue that current machine learning methods for constructing PH4 predictions may encounter three significant challenges that could result in systematic biases, constraining their inherent extension into downstream applications. (1) Machine learning methods that lack a stringent data cleaning strategy tend to simply memorize the entire molecular samples from the training set. Thus, this leads to a diminished generalizability towards new data sets. (2) Machine learning models without integrating receptor information exhibit limited interpretability. Convolutional neural networks (CNNs)29 and message-passing neural networks (MPNNs)30 excel at predicting protein–ligand binding activity and PH4 attributes, by learning and updating the relationship between nodes and edges. This might merely reflect the ability to memorize training samples rather than capturing the specific chemical environment of ligand–receptor complexes. (3) In addition to the accuracy of the PH4 prediction, another critical issue is that many current machine learning models cannot incorporate screening into a comprehensive framework themselves. They rely on external software (e.g. Phase25 or MOE26) to interpret the constructed PH4 model. These machine learning algorithms can either infer PH4 models solely from training set molecules31 or rely on other computer programs, combined with expert experience, to manually generate PH4 models for virtual screening and molecular generation.32
To overcome the current limitations of predicting PH4 properties, we here develop Alpha-Pharm3D (labeled as Ph3DG), a versatile ligand-based 3D PH4 modeling and screening workflow which captures the causality between ligand bioactivity and PH4 fingerprints. To overcome the barrier of data cleaning, we present rigorous strategies specifically trained on functional EC50/IC50 and Ki values of ligand–receptor interactions from the ChEMBL database. To facilitate maximum flexibility and interpretability, the workflow explicitly incorporates conformational ensembles of ligands and the geometric constraint of receptors to construct 1D trainable PH4 fingerprints. The devised architecture accurately predicts compound activities, demonstrating a competitive result of Area Under the Receiver Operator Characteristic curve (AUROC) of about 90% in a diverse range of data sets. Besides the rationally constructed PH4 models, true positive (TP) molecules are effectively retrieved from screening data sets, with a mean recall rate exceeding 25% regardless of scarcity of available data. From the comprehensive perspective of bioactivity characterization and screening power, Alpha-Pharm3D performs equal to or better than prevailing traditional and AI-based screening and scoring methods.
To assess the prediction power of Alpha-Pharm3D on different types of targets with potentially limited training data, the developed tool is applied to several important drug targets, including kinases and proteases, where it shows generally applicable performance on a series of G-protein-coupled receptors (GPCRs). In a proof-of-concept study, the Alpha-Pharm3D model prioritized three experimentally active compounds with significantly distinct scaffolds targeting the neurokinin-1 receptor, NK1R, a prototypical G-protein-coupled receptor (GPCR). Among these, two lead compounds were optimized by chemical modification to exhibit EC50 values of approximately 20 nM. The outstanding performance of Alpha-Pharm3D in hit identification and lead optimization provides a novel perspective for rational drug design.33
Methods
Training data collection
The procedure of building training data sets involves the following steps: (1) downloading all target-specific compound activity data from the ChEMBL database (version CHEMBL34);13 (2) acquiring representative high-resolution receptor–ligand complexes from the DUD-E database14 (complex pdbs that do not exist in the DUD-E database are derived from RCSB PDBank15); (3) filtering out ions, cofactors and other solvent molecules and keeping only the orthogonal-binding ligands and receptors. General pipelines for all target data cleaning are illustrated in ESI Fig. S1.†ChEMBL data cleaning
Eight target structures with training compound activities are collected for benchmarking all scoring methods, including tyrosine-protein kinase ABL (ABL1), beta-2 adrenergic receptor (ADRB2), beta-secretase 1 (BACE1), C–C chemokine receptor type 5 (CCR5), cyclin-dependent kinase 2 (CDK2), C-X-C chemokine receptor type 4 (CXCR4), insulin-like growth factor I receptor (IGF1R) and neurokinin 1 receptor (NK1R) from the ChEMBL database (ChEMBL IDs: 1862, 210, 4822, 274, 301, 2107, 1957, and 249, respectively). The corresponding PDB IDs of complex structures are 2HZI, 3NY8, 3L5D, 6AKX, 1H00, 3ODU, 2OJ9, and 6HLP, respectively.PH4 preprocessing
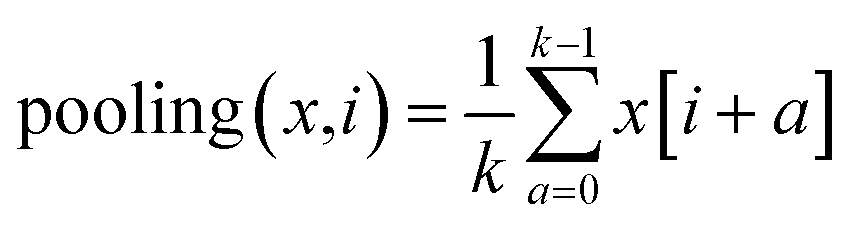
![[thin space (1/6-em)]](https://www.rsc.org/images/entities/char_2009.gif) 280 grid points. Thus, atomic coordinates are transformed into 3D grid points.
280 grid points. Thus, atomic coordinates are transformed into 3D grid points.
 are transformed into grid vertices
  to calculate a convex hull.39 Due to the inherent polyhedron shape of the binding pocket, the Möller–Trumbore algorithm is applied to scan the intersection of all triangles formed by pocket vertices with a ray.40,41 The PH4 feature point is located inside the polyhedron if the total number of rays intersecting all triangles is odd. In contrast, feature points that are outside the pocket surface indicate high probability of clashing with protein atoms. By detecting the number of intersections, PH4 features that are within the pocket polyhedron will be further incorporated into the model input array.
Given pocket grid point coordinates  , the polyhedron object
  is initialized using the ConvexHull function of the Scipy spatial package.42 Then, vertex triangles t are constructed for all simplices from the specific polyhedron object. For the ray used to intersect with, the ray origin points o are defined by (1,0,0). To assess whether the ray intersects with or is parallel to the simplex triangles, determinant d is calculated to represent the 3D spatial relation between the ray and the triangular plane:
| d = e1·(o × e2) | (1) |
 | (2) |
 | (3) |
 | (4) |
 and 3D coordinates
  are subsequently calculated using the RDKit ChemicalFeatures library and placed into the corresponding grid box. Six types of PH4 features, including hydrogen-bond donor (0), hydrogen-bond acceptor (1), ionizable (2), aromatic (3), hydrophobic (4), and lumped hydrophobic (5), are detected and assigned distinct integer feature numbers for each aligned conformer using the BuildFeatureFactory method. Other trivial PH4 features assigned feature number −1 are not involved in the input feature. The feature type is then converted to a one-hot vector of length 6. PH4 one-hot encoding for all grid points is used to construct a 2D feature matrix
  with columns representing feature vectors and rows indicating grid numbers. The 2D feature array is then vertically stacked for all conformers, thus generating a 3D feature matrix
  (Fig. 1a) (for detailed molecular voxelization and the featurization algorithm see ESI Algorithm S2†).
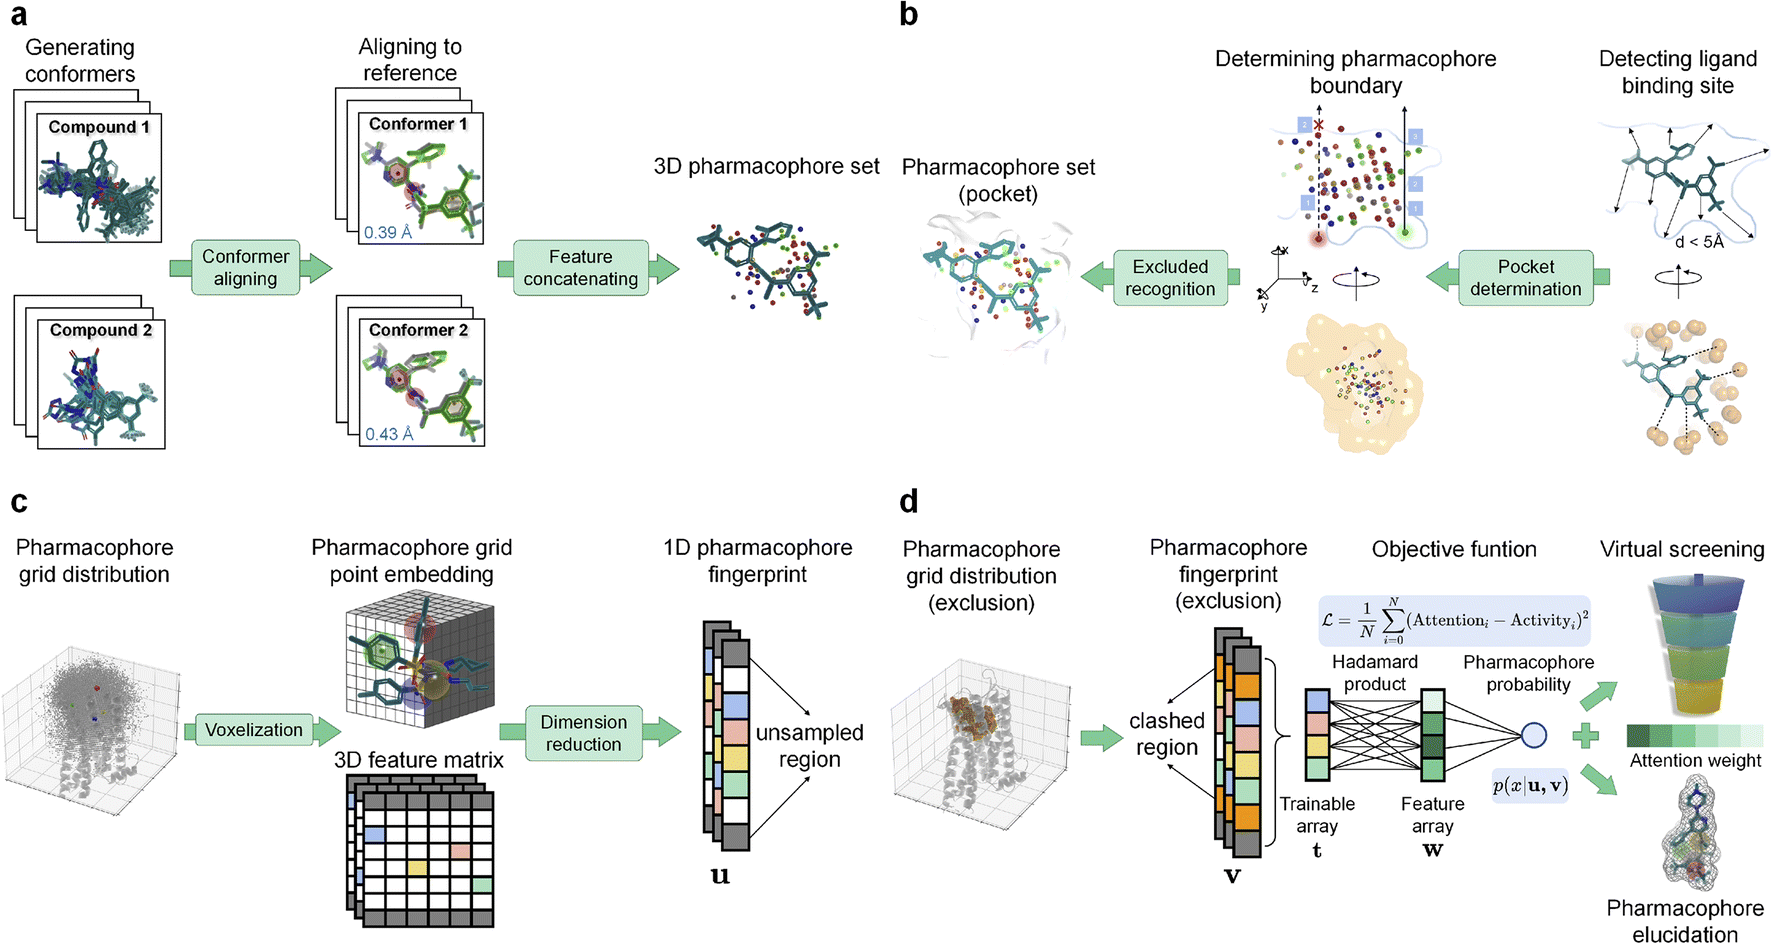 | ||
| Fig. 1 Architecture and training process of Alpha-Pharm3D. (a) Schematic diagram of the molecular embedding process. Multiple conformations are aligned to the reference molecule to obtain a set of PH4s in 3D Euclidean space. (b) Schematic graph of pocket detection and PH4 constraints. The receptor pocket is detected in a 5 Å atomic environment surrounding the reference ligand, represented by orange surface and spheres. PH4 features within the pocket polyhedron surface are calculated by the Möller–Trumbore algorithm. (c) Voxelization and construction of PH4 fingerprints. PH4s of all training compounds are concatenated and embedded into 3D grid space. The unsampled region (grids in gray) is defined by grids that are not sampled by any PH4 of training compounds, while the white grids indicate no features for the specific conformer. (d) Training process incorporated with exclusion volume. The trainable array is truncated and masked by considering exclusion volume which improves model's interpretability. Given the condition of exclusion volume v and unsampled region u, the output PH4 probability p(x|u,v) of a specific compound can be regarded as ligand binding probability, while the attention weight is outputted to rank all potential PH4s for virtual screening. | ||
 . Overlapping grids are detected by judging whether the specific grid coordinates are inside pocket exclusion volume or not as described in the “Exclusion volume preparation” section. The first type of grid is consistently removed to simplify input and improve training efficiency, while the second category could be applied optionally depending on whether a high resolution receptor structure is available. In this study, pocket geometric constraints are incorporated for all benchmarking systems during the training process, while this information is masked to improve model transparency in the screening stage. As a result, the number of grid points is converted from 203280 to 26894 grids for the “Alpha-Pharm3D-MLP” variant (excluded volume detection) in the case of training NK1R (Fig. 1b).
 by superimposing all the conformation ensembles and then obtain a 2D fingerprint tensor
  as training input. The attention matrix
  contains two columns with one representing grid index with any features and another involving feature type integers. In the case of the NK1R data set, the shape of the attention matrix is (5920, 2). After building the index library, the conformer-specific tensor is obtained via a one-hot encoding scheme representing the existence of a specific PH4 in the specific conformer. Thus, the lengths of tensors are fixed to be the PH4 feature dimensions and the number of tensors corresponds to the number of conformers. In the study of the NK1R data set, the shape of the trainable tensor is (13775, 5920). These constant length tensors containing both positional and PH4 information are compatible and amenable to acting as the input of MLP and diffusion models. For detailed input data preparation and preprocessing procedures see ESI Fig. S1.† For a detailed matrix simplification algorithm see ESI Algorithm 3.†
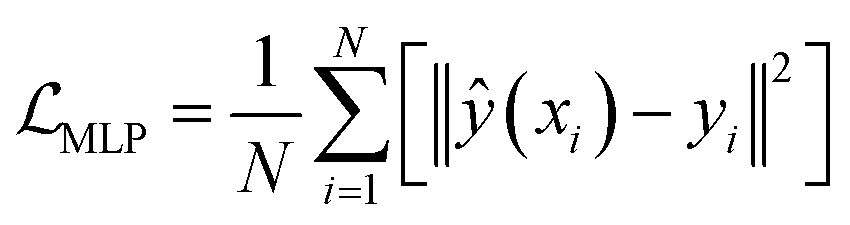
For each target-specific molecular set, compounds with positive or negative binding affinity labels are considered training samples that undergo conformational enumeration, alignment and voxelization into 3D grid space, confined within the binding pocket. Prior to embedding the training compounds into 3D grid points, a conformational augmentation layer is incorporated to produce multiple conformers for each compound, thereby integrating ligand flexibility information. During the alignment phase, the generated conformers are aligned to a reference molecule considering both atomic coordinates and PH4 properties (see the “Ligand structure preprocessing” section and Fig. 1a). Next, the PH4 coordinates of the generated compounds are voxelized into a 3D grid box yielding a PH4 feature matrix for each conformer (see the “Coordinate voxelization” section). After voxelizing the conformers, an exclusion volume module can be selected to confine ligand PH4 sampling space within the ligand-binding pocket, leveraging a ray-intersection geometric algorithm. The specific shape of the ligand-binding pocket is incorporated to restrain PH4s from sampling the exterior polyhedron space by filtering out atomic-clash grids (see the “Exclusion volume preparation” section and Fig. 1b). To streamline the data structure, the 3D PH4 feature matrix is converted into a 1D trainable fixed-length array, known as the PH4 fingerprint, which encapsulates both spatial and PH4 information into a latent representation (see the “Training data preprocessing” section and Fig. 1c). During the Alpha-Pharm3D training process, two deep learning models, namely multi-layer perceptron (MLP) and stable diffusion, are introduced to capture the attentive PH4 distributions of the compounds. If the validation loss attains a global minimum, the model will stop the training phase and a feature importance matrix alongside the predicted PH4 score for each compound is established (Fig. 1d).
 . The output contains model checkpoints for screening and grid attention weights W for ranking features (for detailed training and weighting procedures of Ph3DG see ESI Algorithm 4†). The 1D feature tensor dataset is split into training, validation and testing subsets with ratios of 80%, 10% and 10%, respectively. The StratifiedKFold strategy is used to ensure the proportion of different activity labels of samples in the testing set to be identical to that in the original dataset. Randomly initialized weight tensors are applied to calculate Hadamard products with trainable feature tensors, i.e., multiplication of corresponding element positions.
| (A ⊙ B)ij = aij × bij | (5) |
 | (6) |
 | (7) |
000 with an early stopping patience of 500 applied on the validation loss. 5-Fold cross validation is performed by shuffling training and validation sets. The output weight tensors are then validated by testing the data set and transformed into 3D grid space representing the spatial coordinates with top-ranked frequencies of feature occurrences. Training processes are all conducted on a single RTX3090 GPU. Detailed hyperparameters are summarized in ESI Table S2.† After training, the frequency of feature occurrences is saved and top 20 features with the highest training weights are used to construct the initial PH4 model (Fig. 2).
 | ||
| Fig. 2 Visualized scheme of the Alpha-Pharm3D-MLP model. The multi-modal inputs comprise bioactivity label l and trainable array t which can be prepared from molecular SMILES strings or 3D conformers. The model captures weight matrix w by iteratively multiplying it with t under the constraints of exclusion volume vector v and ligand vector normalization u. The updated w can be regarded as PH4 attentions with the specific ligand x binding probability p(x|u, v) outputted. | ||
 | (8) |
| pθ(xt−1|xt) = N(xt−1; μθ(xt,t),σt2I) | (9) |
 | (10) |
Model evaluation metrics
 | (11) |
 | (12) |
720 FDA-approved and clinical-candidate rule-of-five (Ro5) molecules with chiral and ionizable compounds enumerated. The similarity between PH4 grid coordinates and properties of the trained model and pre-screened library is evaluated to rank all unlabeled molecules based on PH4 potential. Consequently, the enriched compounds exhibit PH4 characteristics that share a distinct similarity of PH4 feature types and coordinates with the detected PH4. For each ligand PH4 grid, 4 dimensions, including feature types, x-grid, y-grid, and z-grid, are considered to match the top 20 weighted features. Conformers containing more than four mapping features are considered fully PH4-potential hit compounds. Conformers that match 1–3 features are also evaluated by calculating the recall rate and enrichment factor.
 | (13) |
 ,
,  , and
, and  indicate weight scores, strain energies, and clash scores, respectively. All scoring components have values bounded between 0 and 1. Three coefficients are manually incorporated to reweight each scoring component which emphasizes the importance of matching features, where it can also be user-defined. The equations for calculating the scoring components are as follows:
 | (14) |
 | (15) |
 | (16) |
 measures the strain energy of the matched conformer and energetically minimize conformer given an identical 2D chemical structure. A larger value indicates a more stable 3D conformation of the matched compound.
  compares the number of clashed atoms and total atoms of the matched compounds. A larger score denotes that the matched compounds have more atomic clashes with the receptor, which is unfavorable for further optimization. In this study, feature weights are of PH4 importance predicted by the Alpha-Pharm3D model while molecular strain energies and clash scores are calculated with the RDKit toolkit. Clashed atoms are defined by ligand heavy atoms that appear within 2.5 Å of the protein pocket.
(1) Recall rate: the proportion of successfully identified positive conformers to the total number of positive conformations. The ratio represents the sensitivity of the established model in identifying positive samples.
(2) Enrichment factor (EF): a commonly used metric to evaluate the enrichment extent of a specific subset that appears in the total population.
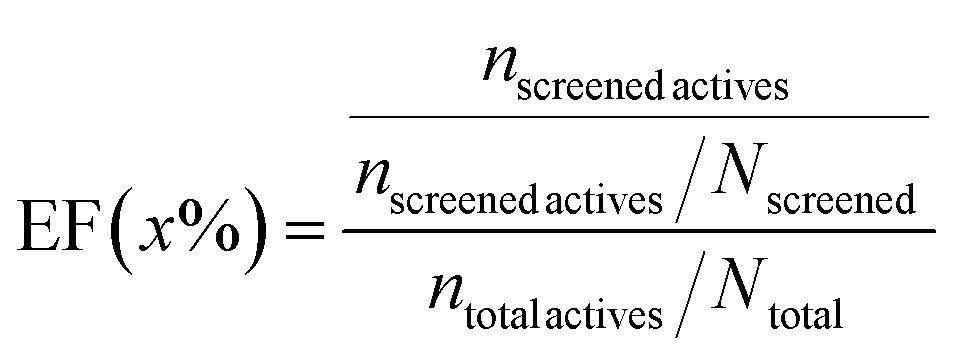 | (17) |
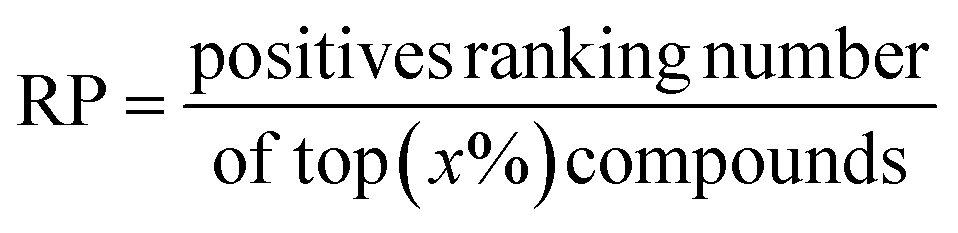
Another metric ranking power (RP) is obtained by calculating the statistics of the ranking proportion of positive compounds.
 | (18) |
To guarantee the fairness of comparison, top (x%) is selected according to the Alpha-Pharm3D screening results, i.e. top 2465 (for ABL1), 884 (ADRB2), 1039 (BACE1), 1173 (CCR5), 551 (CDK2), 959 (CXCR4), 1430 (IGF1R), and 406 (NK1R) are determined for different targets. For all baseline models, 2.5% and 16.7% of the total screening data sets are used to calculate the enrichment factor.
(1) Schrodinger virtual screening module (PHASE):25 a commercialized toolkit allowing the preparation of virtual compound libraries, creation of PH4 models, and screening of databases against defined PH4 hypotheses. In this study, proof-of-concept screening data sets are prepared as a phdb database with 5 conformers generated for each molecule. Crystallized ligands with receptor structures are utilized to create a PH4 model with exclusion volume considered. For each target, 4–6 PH4 features are automatically set as criteria to screen the proof-of-concept compound library. Other parameters are kept as default based on the official tutorial.
(2) Schrodinger molecular docking module (Glide SP):23 a commercialized toolkit incorporating receptor grid generation and ligand docking. In this study, crystallized ligands are used as orthogonal binding ligands to define the binding site of the specific target. Other settings are kept as default.
(3) Autodock-Vin:49 a freely accessible docking and scoring method that prepares receptor grid and ligand conformations. In this study, 32 conformations are generated per docking compound.
(4) PLANET:50 an open-source graph neural network to score compounds of interest. The model depends on the input of the optimized protein structure, the reference ligand, and pre-screened ligands. Note that the toolkit can only output compound scores without binding poses as the output compounds are in 2D. In this study, we use only the prediction mode of this method to score data sets of interest.
(5) EquiScore:51 a state-of-the-art pre-trained model to score and screen compound data sets. In this study, we use only the screening mode to score protein–ligand interactions without retraining the model. Screening with EquiScore is implemented on a single RTX3090 GPU. Models to construct PH4s include CavPharmer52 and Phase, where the input considers both ligand and protein structures. Other parameters are set as default.
Results
Generalizability of Alpha-Pharm3D-MLP in accurately predicting compound bioactivity
As the Alpha-Pharm3D framework allows establishing PH4 models, categorizing compound bioactivities, and subsequently screening for unseen compounds, its efficiency in predicting protein–ligand affinity according to the PH4 perceptron is assessed. To ensure generalizability, 8 targets with different ratios of active compounds are selected to train the Alpha-Pharm3D-MLP (denoted as Ph3DG) model and other baseline methods (Fig. 3a). In general, Ph3DG demonstrates balanced AUROC and AUPRC performance in categorizing the activity of compounds across diverse targets (Fig. 3b and e). Significant correlation between sample size and accuracy suggests that the Ph3DG model may achieve better predictivity with sufficient (>1000) training data (see ESI Fig. S4†). To be specific, CXCR4 and ADRB2 with minimal numbers of total and active training samples, respectively, are well characterized by Ph3DG, achieving an AUPRC of 0.918 and 0.998, respectively (see ESI Fig. S5†). This performance validates the robustness of Alpha-Pharm3D in a data imbalance and scarcity scenario. As depicted in Fig. 3c and d, Alpha-Pharm3D-MLP significantly outperformed Alpha-Pharm3D-Diff (also denoted as Ph3DG-Diff) in achieving superior classification accuracy for all eight targets. In addition, four out of the top 20 important PH4 features, that were identified by the MLP framework, precisely focus on the chemical attributes of the reference molecule. They accurately pinpoint a positively ionizable center (PI), a trifluoromethyl hydrophobic group (HY) and a lumped hydrophobic backbone. In contrast, the hydrogen-bond donor (HBD) and aromatic group (AR) features modeled through diffusion architecture are notably more sparsely dispersed from the reference molecule, with PI being erroneously identified (Fig. 3c). These results demonstrate that the MLP framework surpasses the diffusion variant in terms of accurately classifying the activity of labeled compounds and enhancing the reliable construction of the PH4 model. | ||
| Fig. 3 Performance of Alpha-Pharm3D and its variant in categorizing the bioactivities of training compounds. (a) Barplots representing training data sets (compounds with activity labeled) across various targets. Data cleaning strategies of the ChEMBL database are illustrated in Methods. (b) AUROC curves of the Alpha-Pharm3D-MLP model. The black dashed line represents random classification results. (c) 3D PH4 features trained on various models aligned with the reference NK1R ligand, Neutpitant (PDB: 6HLP). Essential feature attentions are indicated in brackets. PH4 features are indicated by mesh balls with different colors, i.e. blue: HBD, green: HBA, yellow: PI, pale green: AR, red: HY, and gray: lumped HY. (d) Barplots showing AUROC scores predicted by Alpha-Pharm3D variants, indicating its generalizability across various classes of receptors. Ph3DG-MLP represents Alpha-Pharm3D trained with a multi-layer perceptron (MLP), while Ph3DG-Diff indicates Alpha-Pharm3D trained with a diffusion model. (e) AUPRC curves of the Alpha-Pharm3D-MLP model. (f–h) Boxplots of AUROC, AUPRC and recall rates across benchmarking methods, respectively, showing the stability of the Alpha-Pharm3D-MLP model in predicting and enriching active compounds from eight different targets. Numbers in brackets represent the total number of targets scored by a specific method. Stars represent the outliers for each baseline. AUROC and AUPRC scores evaluate the classification of bioactivity performance during the training phase, while recall rates indicate the performance of screening power of different baselines. | ||
Robustness and interpretability of Alpha-Pharm3D in comparison with baseline methods
By comparison, three traditional scoring methods (Phase, Glide and Vina) and two state-of-the-art machine learning-driven algorithms (PLANET and EquiScore) are introduced as baseline methods (see the “Baselines” section in Methods). Alpha-Pharm3D exhibits outstanding AUROC and AUPRC performances and ranks within the top 3 among various scoring methods (Fig. 3f and g). It is noteworthy that conventional docking and PH4 screening methodologies, namely Glide and Phase, are inherently limited in their ability to identify biologically active molecules among specific target subsets. A challenge arises where bioactive molecules fail to meet the defining criteria of PH4s or the necessary interactions, rendering them undetectable by these methods (see ESI Fig. S6†). Alpha-Pharm3D performs excellently in enriching TP samples among molecules that possess the highest PH4 prediction scores, especially those among the top 1% molecules (see ESI Fig. S7†). The comparable performance demonstrated by Alpha-Pharm3D-MLP underscores the ability of the Alpha-Pharm3D model to distinguish significant PH4 patterns, in contrast to merely memorizing the entire training samples.To verify the interpretation of the predicted distributions of PH4s, the Alpha-Pharm3D constructed PH4 model is visualized and evaluated based on two criteria: (1) the precision of PH4 chemical features compared to a reference ligand; (2) the distribution of PH4 coordinates within refined exclusion volume constraints of ligand binding sites. Alpha-Pharm3D not only models the exclusion volume within ligand binding sites, but also furnishes interaction guidance surrounding the reference molecule (ESI Fig. S8†). The top 10 weighted features identified by Alpha-Pharm3D encompass representative protein–ligand interaction modes that exhibit structural and chemical similarities to the reference ligand. Meanwhile, the top 50 features generated by Alpha-Pharm3D exhibit a more compact and dense distribution over CavPharmer (ESI Fig. S9†) and represent a five-fold increase in feature quantity over those developed by Phase (ESI Fig. S10†). Thus, the overall results showcase the interpretability of PH4 construction regardless of the specific location of functional groups of the reference ligand.
Effectiveness of Alpha-Pharm3D in screening true positives from the compound library
An important aspect in evaluating docking and screening methodologies lies in the proficiency in prioritizing true positives (TPs) early from a ranked list of active compounds.46 Here, we present three metrics to assess thoroughly the overall screening capability of Alpha-Pharm3D against the prevailing state-of-the-art methods. The capability to retrieve TPs is quantified through the recall rate and enrichment factor (EF), whereas the ranking power is assessed by evaluating the positioning of TPs within the ranked list of actives (for detailed mathematical formulation, see Methods). As depicted in Fig. 3h, the Alpha-Pharm3D model exhibits a moderate capability to recall and rank positive samples within the top 2 positions (mean recall rate over 25%), performing equal to or better than other methods in this consideration. Although the performance of the Alpha-Pharm3D model is moderate on this metric, Alpha-Pharm3D excels in its ability to consistently recall a uniform quantity of positive compounds across all benchmarked targets without notable bias (ESI Fig. S11a†). This stands in contrast to ML-based affinity prediction method PLANET, which exhibits a high average recall but a substantially larger variance (0.348 ± 0.368), indicating high variability and inconsistency across different targets. Although it successfully recalled TPs for two benchmarked targets (CCR5 and ABL1), it fails to recall any TPs from the remaining four targets (ESI Fig. S11b†). Furthermore, the protein–ligand scoring-based PLANET lacks the ability to capture PH4 patterns and to generate binding poses for potential ligands. By integrating Alpha-Pharm3D to construct 3D spatial PH4 models, the proposed approach demonstrates advantages in scoring performance over traditional methods, such as Glide, Phase, and Vina, while offering superior interpretability compared to state-of-the-art ML models, i.e. EquiScore and PLANET.Here, it is worth mentioning that Alpha-Pharm3D exhibits an improved performance in training and screening tasks especially from the here-investigated GPCR-related targets CCR5, CXCR4, NK1R and ADRB2. Our developed model consistently ranks top 2 among all baselines in five of the six evaluation metrics (ESI Fig. S12†), This exceptional performance, which is resilient to data scarcity, suggests the promising applicability of this model in identifying deeply buried positive compounds, even from challenging targets with limited prior knowledge or few known active compounds (ESI Fig. S11c†).
Validation of the Alpha-Pharm3D outcome by functional assays
To validate the accuracy of Alpha-Pharm3D, we exploit the developed model on the NK1R target protein by screening FDA-approved libraries. The neurokinin receptor (NK1R) is a prototypical member of the G-protein coupled receptor family (GPCRs) and encompasses a broad spectrum of therapeutic applications, ranging from anti-inflammatory and analgesic effects to alleviating nausea post-chemotherapy.66–69 The activation of the G protein and signal propagation of GPCRs play a vital role in transmitting physiological response across cellular membrane systems. Triggered by ligand binding, GPCRs are decoupled from intracellular G proteins, leading to the dissociation of Gα and Gβγ subunits. Based on their signaling effects, the Gα protein can be categorized into Gαs (stimulatory G protein) activating adenylyl cyclase to increase cyclic adenosine monophosphate (cAMP) levels, Gαi (inhibitory G protein) reducing cAMP levels, Gαq activating phospholipase C and producing inositoltrisphophate (IP3) and diacylglycerol (DAG), and G12/13 regulating cytoskeletal changes and cell movement. Despite recent research focusing on resolving the biased activation of Gq over Gs with NK1R and its corresponding interaction mode, the intricate complex formed between this receptor and β-arrestin has yet to be unveiled.70,71 Hence, screening for and optimizing selective compounds featuring unique molecular backbone structures, distinct from marketed antagonists, holds significant clinical application value and innovative potential.In this work, Alpha-Pharm3D-MLP is applied to build a PH4 model, which is used later to screen for NK1R (PDB: 6HLP) antagonists. Here, we use netupitant (ChEMBL: 206253) as a reference molecule. After screening and sorting PH4 potentiated hits, 12 compounds are tested by cell-based functional assays (screening process shown in ESI Fig. S14;† bioactivity data not shown). To narrow down the number of compounds for further study, we only choose three compounds with (1) a molecular mass between 400 and 700 g mol−1; (2) minimal atomic clashes; (3) unique backbones that are not on the market for the NK1R (Table 1). For a comprehensive comparison of PH4 patterns of these hit compounds, we select Alpha-NK1-005 for further manual optimization according to its binding mode (PH4 patterns for the three clinical candidates, see ESI Fig. S15†). As depicted in Fig. 4a and b, the PH4 model established from flexible conformations of Alpha-NK1-005 stays close to the original proposed binding mode, especially in the middle piperazine ring and two heading aromatic rings, which indicates the generalizability of developed PH4s and the stability of the 3D structure. Next, we synthesize Alpha-NK1-005 analogs with a similar backbone comprising 2–3 aromatic rings, a central piperazine ring and a terminal carboxyl group. Due to moderate activity of Alpha-NK1-005.1 and Alpha-NK1-005.2 (experimental EC50 values of 42.12 and 83.82 μM, respectively), the two compounds have been chemically modified to optimize their antagonistic properties while preserving the overall Alpha-NK1-005 ring system and the hydrophobic features. From the seven successfully synthesized compounds, two lead compounds (Alpha-NK1-005-f1 and Alpha-NK1-005-f5) interact with the target through hydrogen bonding (e.g. N89, N109 and Y283) and hydrophobic environment (e.g. H108, H197, F260 and F264) exhibiting similar intermolecular patterns to the reference netupitant (Fig. 4c).
| Compound | M W (g mol−1) | Strain score | Feature score | Clash score | ΔG (kCal mol−1) | Classification accuracy |
|---|---|---|---|---|---|---|
| a *The calculation of scoring functions represented by the strain score, feature score, and clash score are illustrated in Methods. n.d. indicates not detected. **All molecular properties are calculated by RDKit implementation. ΔG is calculated using MM/PBSA with three parallel runs for each compound. Classification accuracy is calculated by the construction of dynamic PH4s given by the 100 ns molecular dynamics trajectories. ***Inactive samples are defined as conformations with an RMSD of more than 0.3 Å aligned to the initial conformation. The best results are denoted in bold. | ||||||
| Netupitant | 578.60 | 0.73 | 1.45 | n.d. | −25.12 ± 1.28 | n.d. |
| Alpha-NK1-002 | 693.73 | 0.29 | 1.41 | 0.18 | −22.85 ± 0.88 | 0.76 |
| Alpha-NK1-003 | 533.64 | 0.49 | 1.44 | 0.13 | −22.12 ± 0.72 | 0.77 |
| Alpha-NK1-005 | 501.67 | 0.39 | 1.54 | n.d. | −26.83 ± 2.48 | 0.81 |
 | ||
| Fig. 4 Alpha-Pharm3D screened hit compounds and experimental activity assays of NK1R leads. (a) Dynamic PH4 distributions of the potential hit compound Alpha-NK1-005 by running 100 ns molecular dynamics simulation. Conformations in frames with equal time intervals are extracted to train the Alpha-Pharm3D-MLP model and the top 50 features are visualized to summarize PH4 features. PH4 colors correspond to those in Fig. 3c. Probabilities indicate the time proportion along a 100 ns trajectory where PH4 features exist around a specific functional group. (b) Time course of RMSD fluctuations of potential hits and lead compounds optimized based on Alpha-NK1-005. 100 ns production is strided and smoothed by 1000 per data point. (c) Detailed interaction modes of optimized Alpha-NK1-005-f1 and Alpha-NK1-005-f5 lead compounds. Colors of carbon the element of ligands correspond to those shown in panel (b). Purple dashed lines represent π–π stacking while green dashed lines indicate H-bonds. Interactive residues within 5 Å distance are shown. (d) Concentration-dependent inhibitory potential of hit and lead compounds. Data were obtained from BRET assays carried out by heterologous expression of human NK1R in HEK cells. Data were normalized to the maximal inhibitory effect delivered by fosaprepitant (n = 4 biological replicates, presented as mean ± s.e.m.). The left panel shows % inhibition of mini Gq protein activation; the right table shows EC50 statistics and errors. Experimental details of BRET measurement are described in Methods. (e and f) Synthesis routes of Alpha-NK1-005-f5 and Alpha-NK1-005-f1 demonstrate the synthetic accessibility of the optimized lead compounds. For other synthesis routes see ESI Fig. S16.† | ||
In addition, the lead compounds demonstrate inhibitory effects with half maximal effective concentration (EC50) values of 25 and 19 nM, respectively, comparable to those of the positive references, fosaprepitant (EC50 = 35 nM) and netupitant (EC50 = 3.73 μM) (Fig. 4d. Routes for synthesis of optimized compounds are described in ESI Fig. S16†). The underperformed EC50 of netupitant may be because of the precipitation at a 100 μM concentration. Although the EC50 values of optimized leads surpass those of the positive control, the maximum inhibitory potency of these two compounds is only half of that of the reference molecule. This might be due to their relatively small molecular size which in turn introduces limited capabilities to induce conformational changes in the NK1R. Nonetheless, our results suggest that the PH4-based in silico screening identified compounds efficiently inhibiting the activation of the NK1R. This opens up the possibility to optimize these lead compounds towards clinically useful NK1R antagonists.
Conclusions
Introducing explainable deep learning methods in the early stage of hit screening and lead identification is an important step in modern drug discovery. The development of simultaneous recall of baseline data sets and accurate screening of virtual screening methods with biological activity are of great importance in this process.In this study, we develop a versatile deep learning model, Alpha-Pharm3D that enables the incorporation of PH4 elucidation, bioactivity classification and PH4 screening using only a few hyperparameter adjustments. The platform integrates multi-modal input from molecular strings towards protein geometric constraints using the exclusion volume principle to improve the model's interpretability and alleviate atomic clashes for the first time. Compared to current virtual screening methods, the Alpha-Pharm3D-MLP model demonstrates overwhelming bioactivity prediction capability with AUROC and AUPRC achieving 91.4% and 98.3%, respectively, averaging different types of targets. In the virtual screening task, our developed model is highly enriched with TP compounds and showcases balanced performance across various benchmarking targets with an enrichment factor outperforming most of the current baselines. Despite accurate evaluation metrics, PH4 models built using Alpha-Pharm3D fit into the reference molecule and corresponding binding pocket chemically and structurally, avoiding atomic clashes. The interpretability of the Alpha-Pharm3D model is demonstrated in cell-based functional assays of a prototypical drug screening case for the NK1R. This study demonstrates that although the developed Alpha-Pharm3D does not achieve the top performance in terms of recall, enrichment factor, and ranking compared to PLANET, its integrated capability in interpretable PH4 identification and bioactivity scoring suggests that Alpha-Pharm3D may hold great potential for broad application in challenging areas of drug discovery and repurposing, such as targeting GPCRs.
In summary, we developed a novel machine learning based drug screening method, namely Alpha-Pharm3D, which overcomes several inherent weaknesses of current PH4 screening algorithms. Alpha-Pharm3D has the potential to be harnessed for pinpointing potential binding modes and hotspots within protein–ligand interactions, thereby significantly expanding its realm of application in small molecule drug discovery. In the future, beyond rule of 5 (bRo5) molecules can be used to train and screen the model enhancing the capability to discover the PH4 properties of protein–protein binding sites and to facilitate macromolecule lead optimization. Furthermore, exploring the potential of incorporating equivariant and relative distance representations of PH4 grid points is a promising avenue for future endeavors. The robust predictions of the established PH4, coupled with protein–ligand interactions, offer unprecedented avenues for hit identification, lead optimization, and scaffold hopping, significantly contributing to the entire process of rational drug design. Our work here provides an insightful view into the next generation of modern drug discovery.
Data availability
All data related to this work, including the datasets and programs for training, testing, and validation, are available at https://doi.org/10.5281/zenodo.15536135.Author contributions
Conceptualization: Y. S.; data curation: D. J. and L. T.; formal analysis: Y. S., D. J. and W. C.; funding acquisition: Y. S. and V. H.; investigation: D. J., L. T., W. C., W. S., and Z. W.; methodology: Y. S. and D. J.; project administration: Y. S.; resources: Y. S. and V. H.; software: D. J., X. M., W. S. and H. Z.; supervision: Y. S. and V. H.; validation: L. T.; visualization: Y. S., D. J.; writing – original draft: D. J.; writing – review & editing: Y. S., V. H. and W. B.Conflicts of interest
Y. S., W. S. and H. Z. are employees of AlphaMol Science Ltd. All the other authors declare no competing interests.Acknowledgements
This work was supported by the AlphaMol-SIAT joint laboratory. We would like to thank Hailu Yan, Dr Xie-an Yu, and Dr Zhen Zhang for their assistance in training the model.Notes and references
- W. Cui and S. Yuan, Expet Opin. Drug Discov., 2024, 19(3), 259–262 CrossRef PubMed.
- K.-K. Mak, Y.-H. Wong and M. R. Pichika, Drug discovery and evaluation: safety and pharmacokinetic assays, 2024, pp. 1461–1498 Search PubMed.
- J. Lyu, S. Wang, T. E. Balius, I. Singh, A. Levit, Y. S. Moroz, M. J. O'Meara, T. Che, E. Algaa and K. Tolmachova, et al , Nature, 2019, 566(7743), 224–229 Search PubMed.
- C. Gorgulla, A. Boeszoermenyi, Z.-F. Wang, P. D. Fischer, P. W. Coote, K. M. Pad-Manabha Das, Y. S. Malets, D. S. Radchenko, Y. S. Moroz and D. A. Scott, et al. , Nature, 2020, 580(7805), 663–668 Search PubMed.
- P. S. Gromski, A. B. Henson, J. M. Granda and L. Cronin, Nat. Rev. Chem., 2019, 3(2), 119–128 CrossRef.
- A. V. Sadybekov and V. Katritch, Nature, 2023, 616(7958), 673–685 CrossRef CAS PubMed.
- Y. Cheng, Y. Gong, Y. Liu, B. Song and Q. Zou, Briefings Bioinf., 2021, 22(6), 344 CrossRef PubMed.
- S. Pushpakom, F. Iorio, P. A. Eyers, K. J. Escott, S. Hopper, A. Wells, A. Doig, T. Guilliams, J. Latimer and C. McNamee, et al. , Nat. Rev. Drug Discov., 2019, 18(1), 41–58 CrossRef CAS PubMed.
- Y. Hu, D. Stumpfe and J. Bajorath, J. Med. Chem., 2017, 60(4), 1238–1246 CrossRef CAS PubMed.
- G. A. Showell and J. S. Mills, Drug discovery today, 2003, 8(12), 551–556 CrossRef CAS PubMed.
- H. Li, X. Sun, W. Cui, M. Xu, J. Dong, B. E. Ekundayo, D. Ni, Z. Rao, L. Guo and H. Stahlberg, et al. , Nat. Biotechnol., 2024, 42(2), 229–242 Search PubMed.
- J. H. Van Drie, Wiley Interdiscip. Rev.: Comput. Mol. Sci., 2013, 3(5), 449–464 Search PubMed.
- B. Zdrazil, E. Felix, F. Hunter, E. J. Manners, J. Blackshaw, S. Corbett, M. Veij, H. Ioannidis, D. M. Lopez and J. F. Mosquera, et al. , Nucleic Acids Res., 2024, 52(D1), 1180–1192 Search PubMed.
- M. M. Mysinger, M. Carchia, J. J. Irwin and B. K. Shoichet, J. Med. Chem., 2012, 55(14), 6582–6594 CrossRef CAS PubMed.
- S. Bittrich, J. Segura, J. M. Duarte, S. K. Burley and Y. Rose, Bioinformatics, 2024, 370 CrossRef PubMed.
- B. R. Beno and J. S. Mason, Drug Discovery Today, 2001, 6(5), 251–258 Search PubMed.
- A. Tropsha, O. Isayev, A. Varnek, G. Schneider and A. Cherkasov, Nat. Rev. Drug Discovery, 2024, 23(2), 141–155 CrossRef PubMed.
- Y.-L. Wang, F. Wang, X.-X. Shi, C.-Y. Jia, F.-X. Wu, G.-F. Hao and G.-F. Yang, Briefings Bioinf., 2001, 22(4), 276 Search PubMed.
- D. Schaller, D. Šribar, T. Noonan, L. Deng, T. N. Nguyen, S. Pach, D. Machalz, M. Bermudez and G. Wolber, Wiley Interdiscip. Rev.: Comput. Mol. Sci., 2020, 10(4), 1468 Search PubMed.
- T. J Cheeseright, M. D Mackey and R. A Scoffin, Curr. Comput. Aided Drug Des., 2011, 7(3), 190–205 CrossRef PubMed.
- J. Taminau, G. Thijs and H. De Winter, J. Mol. Graph. Model., 2008, 27(2), 161–169 CrossRef CAS PubMed.
- B. Hu and M. A. Lill, J. Chem. Inf. Model., 2012, 52(4), 1046–1060 CrossRef CAS PubMed.
- R. A. Friesner, R. B. Murphy, M. P. Repasky, L. L. Frye, J. R. Greenwood, T. A. Halgren, P. C. Sanschagrin and D. T. Mainz, J. Med. Chem., 2006, 49(21), 6177–6196 CrossRef CAS PubMed.
- D. A. Schuetz, T. Seidel, A. Garon, R. Martini, M. Körbel, G. F. Ecker and T. Langer, J. Chem. Theory Comput., 2018, 14(9), 4958–4970 CrossRef CAS PubMed.
- S. L. Dixon, A. M. Smondyrev, E. H. Knoll, S. N. Rao, D. E. Shaw and R. A. Friesner, J. Comput. Aided Mol. Des., 2006, 20, 647–671 CrossRef CAS PubMed.
- S. Vilar, G. Cozza and S. Moro, Curr. Top. Med. Chem., 2008, 8(18), 1555–1572 CrossRef CAS PubMed.
- W. Xie, J. Zhang, Q. Xie, C. Gong, Y. Xu, L. Lai and J. Pei, arXiv, 2024, preprint, arXiv:2401.01059, DOI:10.48550/arXiv.2401.01059.
- M. Skalic, A. Varela-Rial, J. Jiménez, G. Martínez-Rosell and G. De Fabritiis, Bioinformatics, 2019, 35(2), 243–250 Search PubMed.
- J. Jiménez, S. Doerr, G. Martínez-Rosell, A. S. Rose and G. De Fabritiis, Bioinformatics, 2017, 33(19), 3036–3042 CrossRef PubMed.
- Y. Kong, X. Zhao, R. Liu, Z. Yang, H. Yin, B. Zhao, J. Wang, B. Qin and A. Yan, J. Cheminf., 2022, 14(1), 52 Search PubMed.
- M. Kim, K. Park, W. Kim, S. Jung and A. E. Cho, J. Chem. Inf. Model., 2020, 61(1), 36–45 CrossRef PubMed.
- H. Zhu, R. Zhou, D. Cao, J. Tang and M. Li, Nat. Commun., 2023, 14(1), 6234 Search PubMed.
- J. Dong, S. Wang, W. Cui, X. Sun, H. Guo, H. Yan, H. Vogel, Z. Wang and S. Yuan, J. Chem. Theory Comput., 2024, 20(11), 4499–4513 CrossRef CAS PubMed.
- G. Landrum, et al., Greg Landrum, 2013, vol. 8, 31.10, p. 5281 Search PubMed.
- P. Tosco, T. Balle and F. Shiri, J. Comput. Aided Mol. Des., 2011, 25, 777–783 CrossRef CAS PubMed.
- S. Raghunathan and U. D. Priyakumar, Int. J. Quantum Chem., 2022, 122(7), 26870 CrossRef.
- R. Zhao, Z. Cang, Y. Tong and G. Wei, Bioinformatics, 2018, 34(17), i830–i837 CrossRef CAS PubMed.
- K. Sajeevan and D. Roy, Pept. Sci., 2017, 108(3), e23009 CrossRef PubMed.
- H. Sun, Curr. Med. Chem., 2008, 15(10), 1018–1024 CrossRef CAS PubMed.
- P. Slusallek and I. Wald, Star Eurographics, 2001, pp. 21–42 Search PubMed.
- A. T. R Laurie and R. M. Jackson, Curr. Protein Pept. Sci., 2006, 7(5), 395–406 CrossRef PubMed.
- P. Virtanen, R. Gommers, T. E. Oliphant, M. Haberland, T. Reddy, D. Cour- napeau, E. Burovski, P. Peterson, W. Weckesser and J. Bright, et al. , Nat. Methods, 2020, 17(3), 261–272 CrossRef CAS PubMed.
- S. Yuan, H. S. Chan and Z. Hu, Wiley Interdiscip. Rev.: Comput. Mol. Sci., 2017, 7(2), 1298 Search PubMed.
- C. R. Harris, K. J. Millman, S. J. Van Der Walt, R. Gommers, P. Virtanen, D. Cournapeau, E. Wieser, J. Taylor, S. Berg and N. J. Smith, et al. , Nature, 2020, 585(7825), 357–362 CrossRef CAS PubMed.
- A. Paszke, S. Gross, F. Massa, A. Lerer, J. Bradbury, G. Chanan, T. Killeen, Z. Lin, N. Gimelshein and L. Antiga, et al. , Adv. Neural Inf. Process. Syst., 2019, 32, 8026–8037 Search PubMed.
- F. Pedregosa, J. Mach. Learn. Res., 2011, 12, 2825 Search PubMed.
- R. Fluss, D. Faraggi and B. Reiser, Biom. J., 2005, 47(4), 458–472 CrossRef PubMed.
- J.-F. Truchon and C. I. Bayly, J. Chem. Inf. Model., 2007, 47(2), 488–508 CrossRef CAS PubMed.
- O. Trott and A. J. Olson, J. Comput. Chem., 2010, 31(2), 455–461 CrossRef CAS PubMed.
- X. Zhang, H. Gao, H. Wang, Z. Chen, Z. Zhang, X. Chen, Y. Li, Y. Qi and R. Wang, J. Chem. Inf. Model., 2023, 64(7), 2205–2220 CrossRef PubMed.
- D. Cao, G. Chen, J. Jiang, J. Yu, R. Zhang, M. Chen, W. Zhang, L. Chen, F. Zhong and Y. Zhang, et al. , Nat. Mach. Intell., 2024, 6(6), 688–700 CrossRef.
- S. Wang, J. Xie, J. Pei and L. Lai, J. Mol. Biol., 2023, 435(14), 168141 CrossRef CAS PubMed.
- N. Eswar, D. Eramian, B. Webb, M.-Y. Shen and A. Sali, Structural proteomics: high-throughput methods, 2008, pp. 145–159 Search PubMed.
- C. Lu, C. Wu and D. Ghoreishi, et al. , J. Chem. Theor. Comput., 2021, 17(7), 4291–4300 CrossRef CAS PubMed.
- R. Johnston, K. Yao and Z. Kaplan, et al. , J. Chem. Theor. Comput., 2023, 19(8), 2380–2388 CrossRef CAS PubMed.
- Maestro, Schrödinger, LLC, New York, NY, 2020, vol. 682 Search PubMed.
- D. Van Der Spoel, E. Lindahl, B. Hess, G. Groenhof, A. E. Mark and H. J. Berendsen, J. Comput. Chem., 2005, 26(16), 1701–1718 CrossRef CAS PubMed.
- J. Huang, S. Rauscher, G. Nawrocki, T. Ran, M. Feig, B. L. De Groot, H. Grubmüller and A. D. MacKerell Jr, Nat. Methods, 2017, 14(1), 71–73 CrossRef CAS PubMed.
- S. Jo, T. Kim, V. G. Iyer and W. Im, J. Comput. Chem., 2008, 29(11), 1859–1865 CrossRef CAS PubMed.
- T. Darden, D. York and L. Pedersen, J. Chem. Phys., 1993, 98(12), 10089–10092 CrossRef CAS.
- H. Grubmüller, H. Heller, A. Windemuth and K. Schulten, Mol. Simul., 1991, 6(1–3), 121–142 CrossRef.
- B. Hess, H. Bekker, H. J. Berendsen and J. G. Fraaije, J. Comput. Chem., 1997, 18(12), 1463–1472 CrossRef CAS.
- H. J. Berendsen, J. V. Postma, W. F. Van Gunsteren, A. DiNola and J. R. Haak, J. Chem. Phys., 1984, 81(8), 3684–3690 CrossRef CAS.
- Q. Wan, N. Okashah, A. Inoue, R. Nehmé, B. Carpenter, C. G. Tate and N. A. Lambert, J. Biol. Chem., 2018, 293(19), 7466–7473 CrossRef CAS PubMed.
- X. Ma, R. Leurs and H. F. Vischer, G Protein-Coupled Receptor Screening Assays: Methods and Protocols, 2021, pp. 233–248 Search PubMed.
- R. Latorre, P. D. Ramírez-Garcia, A. Hegron, J. L. Grace, J. S. Retamal, P. Shenoy, M. Tran, L. Aurelio, B. Flynn and D. P. Poole, et al. , Biomaterials, 2022, 285, 121536 CrossRef CAS PubMed.
- S. D. Douglas and S. E. Leeman, Ann. N. Y. Acad. Sci., 2011, 1217(1), 83–95 CrossRef CAS PubMed.
- D. D. Jensen, T. Lieu, M. L. Halls, N. A. Veldhuis, W. L. Imlach, Q. N. Mai, D. P. Poole, T. Quach, L. Aurelio and J. Conner, et al. , Sci. Transl. Med., 2017, 9(392), 3447 CrossRef PubMed.
- A. Majkowska-Pilip, P. K. Halik and E. Gniazdowska, Pharmaceutics, 2019, 11(9), 443 CrossRef CAS PubMed.
- J. A. Harris, B. Faust, A. B. Gondin, M. A. Dämgen, C.-M. Suomivuori, N. A. Veld- huis, Y. Cheng, R. O. Dror, D. M. Thal and A. Manglik, Nat. Chem. Biol., 2022, 18(1), 109–115 CrossRef CAS PubMed.
- C. Thom, J. Ehrenmann, S. Vacca, Y. Waltenspühl, J. Schöppe, O. Medalia and A. Plückthun, Sci. Adv., 2021, 7(50), 2872 CrossRef PubMed.
Footnote |
| † Electronic supplementary information (ESI) available. See DOI: https://doi.org/10.1039/d5dd00082c |
| This journal is © The Royal Society of Chemistry 2025 |