
 Open Access Article
 This Open Access Article is licensed under a
 Creative Commons Attribution 3.0 Unported Licence
Exploring noncollinear magnetic energy landscapes with Bayesian optimization
Jakob
Baumsteiger
 *ab,
Lorenzo
Celiberti
b,
Patrick
Rinke
cdef,
Milica
Todorović
g and
Cesare
Franchini
ab
*ab,
Lorenzo
Celiberti
b,
Patrick
Rinke
cdef,
Milica
Todorović
g and
Cesare
Franchini
ab
aDepartment of Physics and Astronomy “Augusto Righi”, Alma Mater Studiorum – Univeristà di Bologna, 40127 Bologna, Italy. E-mail: jakob.baumsteiger2@unibo.it
bFaculty of Physics and Center for Computational Materials Science, University of Vienna, 1090 Vienna, Austria
cPhysics Department, TUM School of Natural Sciences, Technical University of Munich, Garching, Germany
dDepartment of Applied Physics, Aalto University, FI-00076 Aalto, Finland
eAtomistic Modelling Center, Munich Data Science Institute, Technical University of Munich, Garching, Germany
fMunich Center for Machine Learning (MCML), Germany
gDepartment of Mechanical and Materials Engineering, University of Turku, FI-20014 Turku, Finland
First published on 24th May 2025
Abstract
The investigation of magnetic energy landscapes and the search for ground states of magnetic materials using ab initio methods like density functional theory (DFT) is a challenging task. Complex interactions, such as superexchange and spin–orbit coupling, make these calculations computationally expensive and often lead to non-trivial energy landscapes. Consequently, a comprehensive and systematic investigation of large magnetic configuration spaces is often impractical. We approach this problem by utilizing Bayesian optimization, an active machine learning scheme that has proven to be efficient in modeling unknown functions and finding global minima. Using this approach we can obtain the magnetic contribution to the energy as a function of one or more spin canting angles with relatively small numbers of DFT calculations. To assess the capabilities and the efficiency of the approach we investigate the noncollinear magnetic energy landscapes of selected materials containing 3d, 5d and 5f magnetic ions: Ba3MnNb2O9, LaMn2Si2, β-MnO2, Sr2IrO4, UO2, Ba2NaOsO6 and kagome RhMn3. By comparing our results to previous ab initio studies that followed more conventional approaches, we observe significant improvements in efficiency.
1 Introduction
Magnetic materials are classified based on key properties like their magnetic ground state, exchange constants, magnetic anisotropy energy, and metastable or excited states.1 These properties are essential for understanding the origin of magnetic phases and for designing and optimizing materials for various technological applications.2–4 For simple materials, it is generally feasible to determine these properties through a combination of symmetry analysis and computational simulations. Approaches that aim to identify magnetic ground states typically begin by proposing several possible magnetic configurations. Ab initio methods, such as density functional theory (DFT), are then used to determine which configurations have the lowest energy.5,6 Alternative approaches can be employed, which rely on partially exploring the magnetic energy surface with respect to a single parameter, typically a canting angle. In such cases, the ground state can be estimated by performing a series of ab initio calculations for plausible values of the undetermined parameter.7,8 The results can be fitted to a model Hamiltonian to derive magnetic exchange parameters.9–11 However, these simple approaches have very limited scope, and often break down when it comes to more complex magnetic materials, such as frustrated magnets or materials that show strong spin–orbit coupling. In such complex cases, it is very difficult to determine good guesses of the noncollinear ground states. Moreover, when more than one parameter needs to be determined, traditional approaches to sample the relevant configuration space require a significantly higher number of ab initio calculations, thereby increasing computational time. It is also important to note that complex magnetic materials require equally complex model Hamiltonians for an accurate description, making it generally unfeasible to perform a sufficient number of ab initio calculations for a successful fit.In recent years, solutions to these problems have been attempted. Payne et al. used the meta heuristic firefly algorithm12 and Zheng and Zhang genetic evolution13 to identify noncollinear ground states. Although successful, both attempts still require hundreds of DFT calculations per material to converge to the final result. An approach by Huebsch et al. aims to find magnetic ground states with the help of a basis set of magnetic structures determined by a cluster-multipole expansion, a theoretical approach based on magnetic point group analysis.14 However, magnetic ground states are often unknown linear combinations of these basis configurations.
Although the aforementioned methods concentrate on identifying magnetic ground states, they overlook additional details about the magnetic energy landscape. Consequently, there is a need for an efficient approach to explore noncollinear magnetic energy landscapes to determine the ground state and other magnetic properties of complex magnetic materials. This work proposes a solution using a data-driven Bayesian optimization (BO) technique.
BO is a versatile machine learning tool that has found widespread applications across diverse domains.15–24 It excels in scenarios where evaluating the objective function is resource-demanding and proves particularly valuable for modeling complex, potentially multi-dimensional black box functions. Here we use DFT-informed BO to explore noncollinear magnetic energy landscapes. Thereby we gain important insight into magnetic properties while uncovering metastable states and magnetic ground states at the same time.
We test our approach using the benchmark materials Ba3MnNb2O9, LaMn2Si2, β-MnO2, Sr2IrO4, UO2, Ba2NaOsO6 and RhMn3. These materials represent a minimal dataset of materials characterized by different structural motifs, different magnetic orbitals, and different magnetic structures, as summarized in Table 1.
| Material | Structure | Magnetic orbital | Magnetic ordering | k-mesh | Energy cutoff [eV] | Hubbard correction [eV] |
|---|---|---|---|---|---|---|
| Ba3MnNb2O9 | Triple perovskite | 3d | 120° Néel state | 5 × 5 × 6 | 500 | U eff = 3 (ref. 7) |
| LaMn2Si2 | Tetragonal | 3d | Canted FM | 8 × 8 × 8 | 500 | — |
| β-MnO2 | Rutile | 3d | Helical | 8 × 8 × 5 | 600 | U = 6.7, J = 1.2 (ref. 25) |
| Sr2IrO4 | Layered perovskite | 5d | Canted AFM | 7 × 7 × 3 | 800 | U eff = 1.6 (ref. 26) |
| UO2 | Cubic | 5f | Canted AFM | 6 × 6 × 6 | 700 | U eff = 3.46 (ref. 10) |
| Ba2NaOsO6 | Double perovskite | 5d | Canted AFM | 6 × 6 × 6 | 600 | U eff = 3.4 (ref. 11) |
| RhMn3 | fcc 3D kagome | 3d | 120° Néel state | 10 × 10 × 10 | 450 | — |
2 Methods
2.1 Bayesian optimization
BO is an active machine learning method that iteratively evolves a regression surrogate model. Through an acquisition function BO determines the next data point at every iteration that is then added to the dataset. In this work, the dataset consists of magnetic configurations, defined by one canting angle Φ or several canting angles , and their corresponding DFT energies. The main aspects of the BO workflow used here are shown in Fig. 1.
 | ||
Fig. 1 Workflow of the proposed approach. (a) At each iteration, a new DFT calculation is performed and the resulting energy value added to a data set. The canting angles Φ that correspond to the DFT calculations is indicated by red arrows. (b) Subsequently, a surrogate model Et(Φ) (red) and the GPR native uncertainty σt(Φ) (red shade) are determined via GPR. (c) Using this information, the corresponding acquisition function  (blue) is calculated. The argmin (green star) of the acquisition function provides the parameters that specify the magnetic configuration for the next DFT calculation. After a predefined number of iterations Niter, the optimization of the surrogate models ends. (blue) is calculated. The argmin (green star) of the acquisition function provides the parameters that specify the magnetic configuration for the next DFT calculation. After a predefined number of iterations Niter, the optimization of the surrogate models ends. | ||
At each iteration step t, the BO algorithm constructs a surrogate model of the magnetic energy landscape Et(Φ) and determines the corresponding statistical Bayesian uncertainty σt(Φ), utilizing the available data. The uncertainty σt(Φ) indicates the lack of confidence in the current model of the magnetic energy landscape that arises from the limited amount of available data and the noise of the DFT energies. Typically, Gaussian process regression (GPR) is used for the generation of the surrogate model.21,27 The initial data set must include at least two data points to start the optimization procedure. We used two initial data points for the models involving one degree of freedom and four initial data points for all other models.
The configuration, which will be investigated in the next DFT calculation is strategically determined by utilizing an acquisition function  , which usually depends on the current surrogate model and the Bayesian uncertainty. More precisely, the next DFT energy is determined for the magnetic configuration that minimizes the acquisition function. Different acquisition functions have been proposed in the literature and acquisition function design is an active field of research. In this work we use the pure exploration (EXP) acquisition function, which, in our case, is expressed as
 | (1) |
 attains its minimum where the uncertainty σt(Φ) is highest, thereby promoting exploration. This is advantageous for efficiently exploring large phase spaces, which is the goal of our work.
Once the BO algorithm terminates after completing Niter iteration steps, it is possible to evaluate whether the model has converged and, if so, determine the number of iterations required for convergence Nconviter and the number of DFT calculations required for convergence NconvDFT. If convergence is not achieved after Niter iterations, the optimization can be resumed starting from the last iteration. Naturally, the total number of performed iterations must be larger than the number of iterations required for convergence (Nconviter).
To ensure a high accuracy of the final models, we monitor the convergence of each surrogate model  using a validation set S, which consist of random magnetic configurations, parametrized by vectors containing all relevant canting angles
  and the corresponding DFT energies Ei. We use the largest difference between any total energy within the validation set and the energy prediction of the surrogate model (ΔE)max as a convergence measure:
 | (2) |
The concept and the mathematical foundation of BO are extensively described in the literature.21,27,28 In this work we used the Bayesian Optimization Structure Search (BOSS)17 python package (version 1.10.1).
For the creation of the two- and three-dimensional models of the Ba3MnNb2O9 magnetic energy landscape and the two-dimensional model of RhMn3 magnetic energy landscape, we exploit a symmetry in the crystal structures to reduce the number of required calculations using a feature which is incorporated in BOSS. This feature allows us to avoid redundant computations by adding not only the directly calculated DFT data point but also a second, symmetry-equivalent point to the data set. We used the radial basis function kernel for the generation of almost all of our models. The only exception is our model of the magnetic energy landscape of UO2 that takes into account four individual degrees of freedom. In this case we used the Matérn kernel with ν = 3/2, since it outperformed the radial basis function kernel for this specific model in a kernel test not shown here.
A key objective of this work is to assess the accuracy of the BO approach by comparing the resulting magnetic energy landscapes and ground state configurations with those reported in related previous studies. To enable a meaningful comparison, we recreated the respective DFT setups used in the earlier studies. Consequently, the calculated DFT energies can be considered accurate within the context of the specific setups up to the numerical precision of our DFT calculations, which is 10−6 eV. Since our aim is to recreate the features of the magnetic energy landscape within the framework determined by the previous studies, we set the GPR calculations in such a way that it can fit energy values with a noise characterized by a standard deviation of 10−6 eV.
2.2 First principles calculations
All DFT calculations were performed using the Vienna Ab initio Simulation Package (VASP),29–31 with spin–orbit coupling (SOC) incorporated. For all calculations we used the Perdew–Burke–Ernzerhof (PBE) exchange correlation functional32 and employed the projector augmented wave method.33 To better describe the localized orbitals in strongly correlated materials, we primarily used the effective-U method as outlined by Dudarev et al.34 An exception was made for β-MnO2, for which we applied the method introduced by Liechtenstein et al.,35 following the reasoning of Tompsett et al.25 The computational settings (k-points mesh, plane-wave cutoff, Ueff, or U and J) are presented in Table 1 for all materials. To perform DFT calculations for specific non-collinear magnetic configurations, we used a constrained local magnetic moment approach.9,36 The core concept of this method is to express the total energy E as the sum of the DFT energy E0 and a penalty term: | (3) |
![[M with combining circumflex]](https://www.rsc.org/images/entities/b_char_004d_0302.gif) 0I is a normalized vector indicating the direction of the desired local magnetic moment at atom I and MI is the magnetic moment integrated over a sphere centered on atom I. The parameter λ determines the strength of the constraint. It can be shown that the penalty term scales inversely with λ.36 Consequently, increasing λ to a sufficiently high value ensures that the contribution of the penalty term to the total energy becomes negligible. For most benchmark materials we set λ = 10. For LaMn2Si2 and Ba2NaOsO6 we chose λ = 30 and λ = 60, respectively, in order to achieve sufficiently low penalty energies.
0I is a normalized vector indicating the direction of the desired local magnetic moment at atom I and MI is the magnetic moment integrated over a sphere centered on atom I. The parameter λ determines the strength of the constraint. It can be shown that the penalty term scales inversely with λ.36 Consequently, increasing λ to a sufficiently high value ensures that the contribution of the penalty term to the total energy becomes negligible. For most benchmark materials we set λ = 10. For LaMn2Si2 and Ba2NaOsO6 we chose λ = 30 and λ = 60, respectively, in order to achieve sufficiently low penalty energies.
In the following, we showcase the capabilities of our approach using LaMn2Si2, β-MnO2, Ba2NaOsO6, Sr2IrO4, UO2, Ba3MnNb2O9 and RhMn3 as benchmark materials and monitor the computational efficiency. We apply BO to generate up to four-dimensional models of the magnetic energy landscape. Since the computational resources required to run the BO algorithm are negligible compared to the computational costs of DFT calculations, one can assume that the overall computational costs scale with the number of DFT calculations required for the convergence of the model. The computation time for a single DFT calculation is heavily influenced by the computational system in use and the specific material being analyzed. Usually, materials of greater interest require more computation time since they are often more complex. In our case, the DFT calculations required between 30 minutes and four hours.
3 Results
3.1 Ba3MnNb2O9
Geometrically frustrated materials received much attention recently because of the intriguing physics they exhibit and the complex theoretical challenges they present.37–39 A common feature of frustrated magnetic materials is their unconventional and degenerate magnetic orders. An interesting subgroup of frustrated materials are triangular lattice antiferromagnets, with Ba3MnNb2O9 as a representative example. At 0 K and in the absence of an external magnetic field, the magnetic ground state is a 120° state, where all magnetic moments lie in the plane of the triangular lattice and the magnetic moments of each pair of neighboring lattice sites are oriented at 120° angles relative to each other.40 When an external magnetic field is applied parallel to the [001] direction, a collinear “up-up-down” (uud) phase is stabilized within a finite range of magnetic field strengths.7,40 We generate an one-, a two- and a three-dimensional model of the magnetic energy surface using BO, to directly compare the energy of the 120° state with the uud state and to search for possible metastable states.To determine an one-dimensional energy profile that connects the 120° state and the uud state, we defined an out-of-plane canting angle Φ and quantify the energy gain as a function of Φ in the range between 0° and 90° using BO. Within this range, the one-dimensional magnetic energy surface lacks any symmetry that could be inferred from the crystal symmetry. Therefore we could not reduce the number of required DFT calculations by exploiting a given symmetry as described in Section 2.1. The convergence criterion introduced in Section 2.1 is reached after performing four DFT calculations. The model and the four data points that were used for the generation of the model are displayed in Fig. 2a. A similar energy profile, based on ten DFT calculations and qualitatively matching our results was previously determined by Lee et al.7 To further investigate the phase space for potential stable or metastable states, including those with lower symmetry, we created higher-dimensional models of the magnetic energy landscape by introducing two and three independent canting angles, respectively. For two independent angles, we coupled Φ2 and Φ3 as defined in the inset of Fig. 2a and added Φ1 as a second independent canting angle. For three independent angles, we used all three canting angles as independent degrees of freedom. To account for both ferromagnetic and ferrimagnetic states, we expanded the search bounds of all angles to cover the range between −90° and 90°. As a consequence, the resulting models show a point symmetry that can be defined as  , where
  is a vector that contains the two or three canting angles, respectively. This symmetry follows from a mirror symmetry in the crystal structure. The comparison of all three models is presented in Fig. 2a. As shown in the figure, all three models are in good agreement. Fig. 2b depicts a two-dimensional slice of the full three-dimensional model, which is defined by the constraint Φ2 = Φ3. The three-dimensional model indicates that the 120° state is the only stable or metastable configuration in the explored phase space.
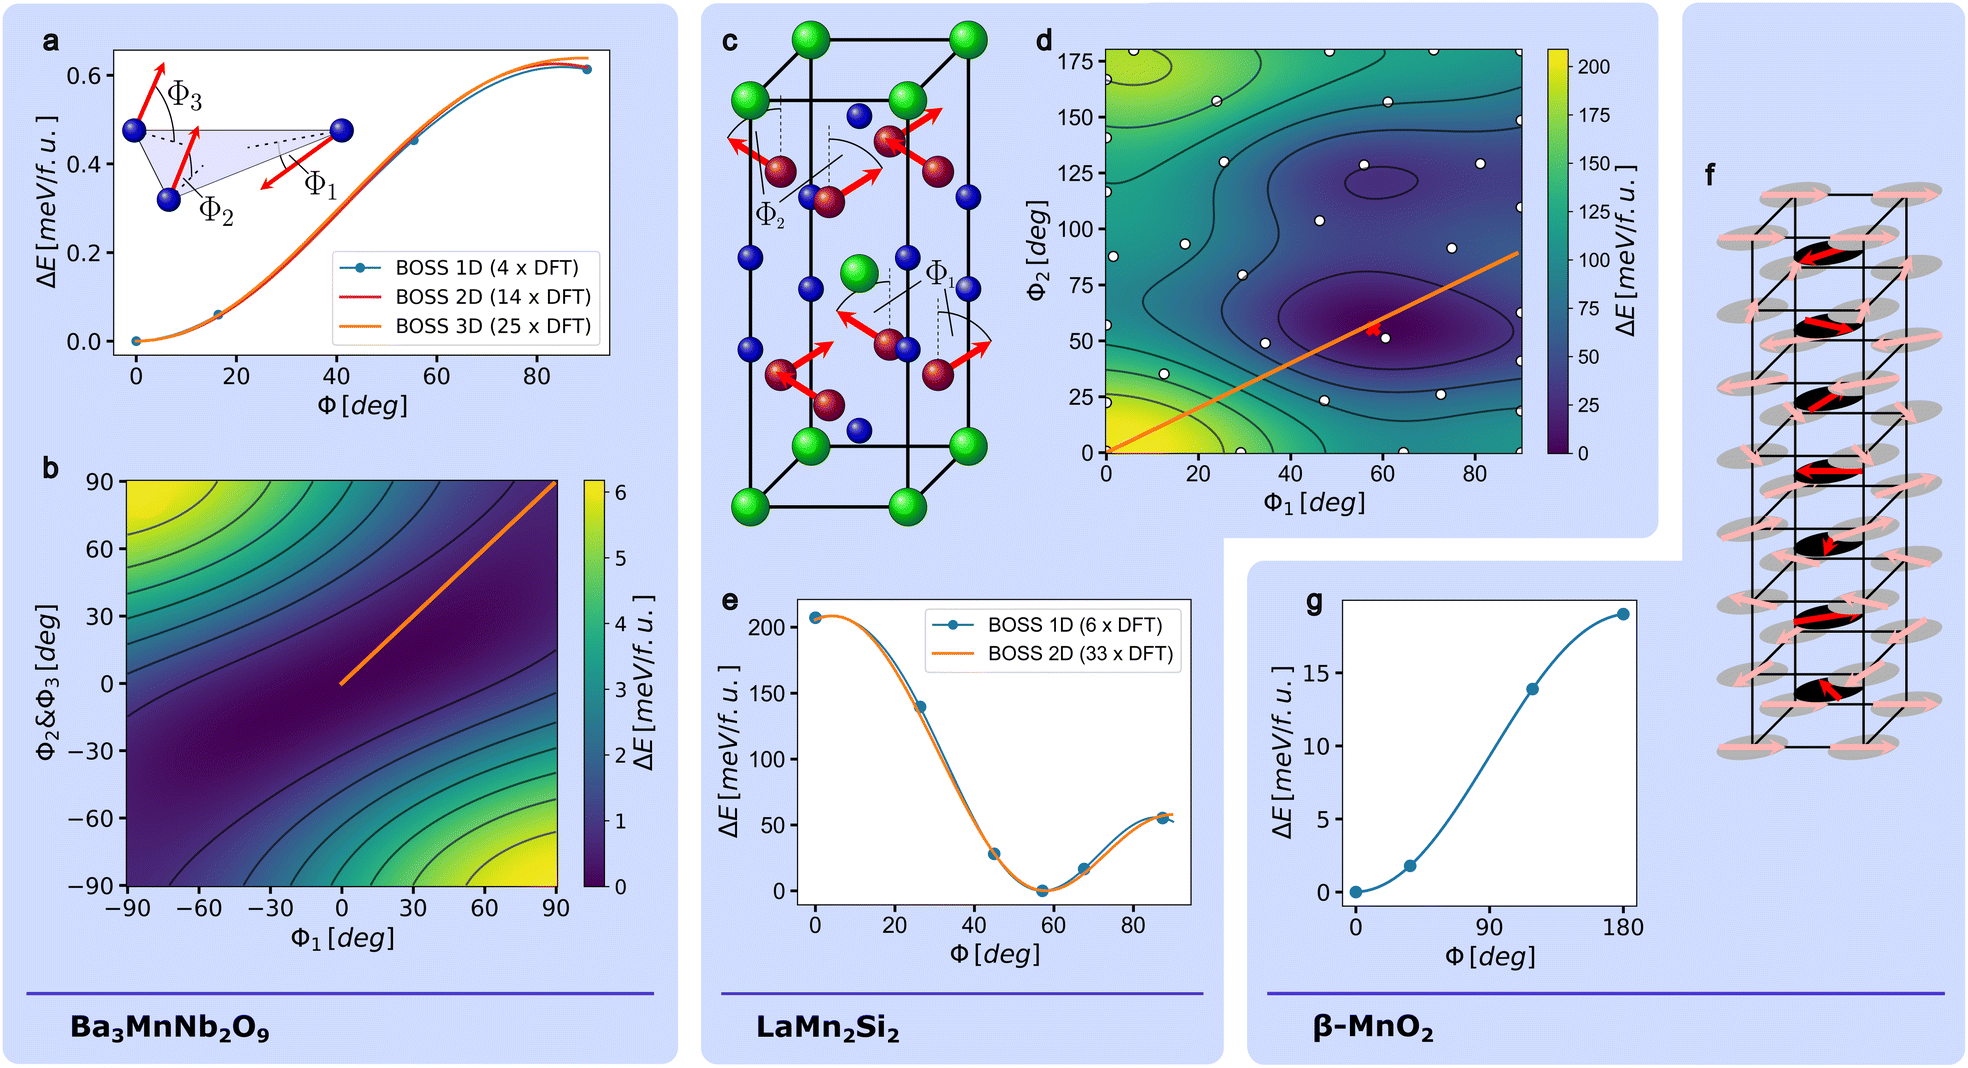 | ||
| Fig. 2 The definition of the canting angles used for the triangular lattice Ba3MnNb2O9 is shown in the inset of (a). In (b), a slice of the magnetic energy landscape of Ba3MnNb2O9 that was generated by defining one independent canting angle per magnetic site, is shown. The slice is defined by the constraint Φ2 = Φ3. The comparison between a one-dimensional, a two-dimensional and a three-dimensional model of the magnetic energy landscape is shown in (a). The crystal structure of LaMn2Si2 and the used definition of the canting angles Φ1 and Φ2 are shown in (c). The magnetic energy landscapes that is spanned by the two canting angles, is depicted in (d). In (e), the energy profile corresponding to a canting angle Φ which is defined by the constraint Φ = Φ1 = Φ2, is shown. The results of the DFT calculations used for the creation of the model are depicted as blue points. The model is compared to the model from (d). The line that correspond to the definition of Φ is marked in (d) as an orange line. The reduced crystal structure of β-MnO2 is depicted in (f). Shown are also the magnetic moments of Manganese as proposed by Yoshimori.41 The body-centered Manganese atoms are displayed in solid colors. The effect on the total energy of rotating the canting angles of the body-centered Manganese atoms in plane by up to 180°, determined by BO is shown in (g). | ||
3.2 LaMn2Si2
RMn2X2 compounds, where R is a rare earth metal and X is Si or Ge, are interesting due to their rich magnetic phase diagram.42–44 LaMn2Si2 is a RMn2X2 compound, that exhibits a canted ferromagnetic ground state below the Curie temperature.45,46 In this state, the magnetic moments of the manganese atoms are aligned ferromagnetically along the [001], and antiferromagnetically along the [100] direction. The magnetic moments are canted with respect to the [001] direction by the canting angles Φ1 and Φ2 (see Fig. 2c). We generated a one- and a two-dimensional model of LaMn2Si2's magnetic energy surface to determine the canting angles in the magnetic ground state and to search for possible metastable states.Using BO we obtained the energy difference as a function of the canting angle Φ defined by the constraint Φ = Φ1 = Φ2 in the range between 0° and 90°. This range encompasses all possible magnetic configurations achievable by varying Φ due to the crystal's symmetry. The surrogate model is fully converged after the execution of seven DFT calculations within the BO framework and exhibits a global minimum that corresponds to a canting angle of 55.8° (see Fig. 2e). This finding agrees well with previous DFT studies, which estimated the canting angle to be between 53° and 57.7°.42,47
All Mn atoms lie within two distinct lattice planes of the magnetic unit cell. To take into account additional magnetic configurations, particularly those that are antiferromagnetic along the [001] direction, we expand the magnetic energy landscape using BO by decoupling the canting angles of both planes and varying Φ2 between 0° and 180°. The resulting model is shown in Fig. 2d. It is converged after 32 DFT calculations. In addition to the global minimum, which coincides with the known magnetic ground state of LaMn2Si2 (see Fig. 2d and e), a local minimum emerges at Φ1 = 59° and Φ2 = 121°, which indicates a metastable magnetic state. To the best of our knowledge, this state has not been reported yet as a stable state of LaMn2Si2. The energy difference between both minima is 27.1 meV/f.u. and the difference between the global minimum and the saddle point between both minima amounts to 40.7 meV/f.u.
3.3 β-MnO2
Materials with helical spin structures are of great interest due to their compelling physics and possible spintronics applications.48–51 The first discovery of a helical magnetic phase was made in 1959 by Akio Yoshimori, who identified a helical structure in β-MnO2 through his analysis of neutron diffraction data.41 Since then, β-MnO2 remained a prototypical example of helical magnets. We employ BO to explore a one-dimensional configuration space that encompasses two helical states that were historically considered candidates for the magnetic ground state of β-MnO2. To introduce the two states, we first provide a brief historical overview. Subsequently, we perform BO and generate a one-dimensional energy profile to determine whether one of the two states or an intermediate state is the energetic ground state.As Yoshimori found out, the corner manganese atoms and the body-center cations form two distinct sublattices in the helical phase. The magnetic moments of both sublattices screw along the c-direction with a wavelength of 7c/2, so that the pattern repeats after seven unit cells (see Fig. 2f). All magnetic moments lie within the (001) plane. Later a magnetic X-ray diffraction experiment52 and neutron diffraction experiments53,54 found that the wavelength of the helical structure is about 4% smaller than 7c/2, which makes it incommensurate. According to Yoshimori's model, the helical phase in β-MnO2 is stable only if the interaction between each corner atom and its neighboring body-centered atom is antiferromagnetic, eventually resulting in a 128.6° tilt between each manganese atom and the two closest atoms of the other sublattice.
In 1966, W. Osmond argued that the interaction between corner atoms and body-centered atoms should be ferromagnetic according to the Goodenough-Kanamori rules for superexchange.55 Based on this assumption he proposed an alternative pattern for the spin helix. This pattern differs from Yoshimori's model by inversion of the three-dimensional magnetic moment vectors of all body-centered atoms. This inversion can alternatively be described as a revolution of the three dimensional magnetic moment vectors of all body-centered atoms by 180° around the c-axis.
To directly compare the energies of the spin configuration proposed by Osmond with the one predicted by Yoshimori, we used BO to determine the total energy of β-MnO2 as a function of the revolution angle Φ in the range between 0° and 180°. Thereby Φ = 0° corresponds to the model of Yoshimori and Φ = 180° corresponds to the model of Osmond. The surrogate model function converges after four DFT calculations (see Fig. 2g). It clearly shows that the spin structure predicted by Yoshimori is lower in energy than the one predicted by Osmond. This result is in line with magnetic X-ray diffraction data acquired later.52
3.4 Sr2IrO4
Strontium iridate (Sr2IrO4) is a well-studied material that belongs to the Ruddelsden–Popper series. It was classified as a Dirac-Mott insulator.56–58 Experimental results59 indicate that the IrO6 octahedra are tilted around the c-axis with an angle of α = 11.5°. A DFT study by Liu et al.9 found a similar rotation angle α of 13.2°. Additionally, Liu et al. determined a minimum energy canting angle of Φ = 12.3° by calculating the energy of SIO for nine different canting angles Φ in the range between 0° and 45°. We reproduce this result by generating a one-dimensional and a two-dimensional model of the magnetic energy surface using BO.The canting angle Φ is defined by the condition Φ = Φ1 = Φ2, where Φ1 and Φ2 are illustrated in Fig. 3a. Therefore, Φ describes the common tilting of all magnetic moments from the crystallographic axis. This result is in good agreement with experimental measurements (Φ = 12.2° (ref. 60)). Using BO, we recreated the one-dimensional magnetic energy landscape within the interval from Φ = 0° to Φ = 50° (see Fig. 3b). The surrogate model converged after five DFT calculations. The energy minimum of our model is reached at Φ = 11.2° which agrees well with the previous findings of Liu et al. Furthermore, we expanded the model of the magnetic energy landscape by decoupling the canting angles Φ1 and Φ2, considering magnetic configurations with different magnetic moment canting angles in neighboring planes. The resulting model, which converged after 17 DFT calculations, is shown in Fig. 3b. This two-dimensional model is in good agreement with the data from Liu et al. (see Fig. 3c). The model has two minima, located at (Φ1 = 0.009°, Φ2 = 32.448°) and (Φ1 = 36.067°, Φ2 = 0.004°), respectively. Of those two minima, the first is lower in energy. Its location in the two-dimensional model is marked by a red cross in Fig. 3b. The two minima do not coincide with the magnetic ground state previously reported by Liu et al. To test the validity of our prediction, we performed two additional DFT calculations for the magnetic configuration that corresponds to the lowest minimum of the model and the magnetic ground state determined by Liu et al., respectively. These calculations indicate that the minimum of the model lies 0.009 meV/f.u. lower in energy than the state reported by Liu et al., a difference that approaches the limit of computational accuracy and highlights the complex multi-minima landscape characteristic of spin–orbit entangled oxide systems.
 | ||
| Fig. 3 In (a), the crystal structures of subsequent lattice planes of Sr2IrO4 and the used definition of the canting angles Φ1 and Φ2 are given. The magnetic energy landscape spanned by the canting angles Φ1 and Φ2 is shown in (b). In (c), the two-dimensional model is compared to a one-dimensional model and to data from Liu et al.9 The crystal structure of UO2 as well as the used definition of the canting angles Φ1 to Φ4 are given in (d). (e) Shows a slice of the four-dimensional model of the magnetic energy landscape obtained by using BO and all four canting angles independently. The slice is defined by the conditions Φ1 = Φ3 and Φ2 = Φ4. In (f) the four-dimensional model and a model obtained by a varying the four canting angles simultaneously are compared to data from Dudarev et al.10 The reduced crystal structure of Ba2NaOsO6 is shown in (g). The definition of the canting angle Φ is given in the inset of the figure. The converged model of the BO energy profile is compared to data from Fiore Mosca et al.11 in (h). | ||
3.5 UO2
Most studies suggest that the magnetic ground state of uranium dioxide at 0 K is the so-called 3k magnetic ordering, which is stabilized by strong SOC of the heavy element uranium.61–66 In the 3k state the magnetic moments of all four existing magnetic sites are tilted from the [001] direction by 54.7°. More details on the crystal structure of UO2 and the orientation of the magnetic moments in the 3k crystal structure can be taken from Fig. 3d. One of the computational studies that support the 3k structure as the magnetic ground state of UO2 was conducted by Dudarev et al.10 Dudarev et al. performed 46 constrained DFT + U calculations with different values for a common canting angle Φ defined by Φ = Φ1 = Φ2 = Φ3 = Φ4 in the range between 0° and 90° to obtain a one-dimensional model of the magnetic energy landscape (see Fig. 3d for the definition of Φ1 to Φ4). The global minimum of their model coincides with the 3k structure.We could reproduce Dudarev's model with BO (see Fig. 3f) by generating an one-dimensional model with BO. The surrogate model converged after five DFT calculations. By using all four canting angles as independent input parameters for BO that range between 0° and 90°, we received a full four-dimensional model of the magnetic energy landscape of uranium dioxide, which converged after 360 DFT calculations. A two-dimensional slice defined by Φ1 = Φ3 and Φ2 = Φ4 is shown in Fig. 3e. Fig. 3f demonstrates that our model is in good agreement with the data of Dudarev et al. However, our model indicates that the 3k state is not a global energetic ground state, but rather a saddle point in the magnetic energy landscape. The global minimum of our model is located at Φ1 = Φ3 = 14° and Φ2 = Φ4 = 90°. The energy difference between the global energy minimum and the 3k state amounts to 0.38 meV/f.u. This result calls for further theoretical and experimental analysis for elucidating the magnetic ground state of UO2.
3.6 Ba2NaOsO6
The results of an NMR study conducted by Lu et al.67 revealed two inequivalent magnetic sites in the 5d double perovskite Ba2NaOsO6. At temperatures below 7 K, the magnetic moments tilt away from the [110] axis by 67° in opposite directions while remaining within the xy plane. This results in a canted antiferromagnetic configuration, as illustrated in Fig. 3g, which shows the crystal structure and the definition of the canting angles. Fiore Mosca et al.11 demonstrated that the canted ground state arises from Jahn–Teller distortions of the OsO6 octahedra. They used 36 single constrained DFT + U calculations to model the dependence of the total energy on the canting angle Φ. Between Φ = 0° and Φ = 90° they identified two energy minima, with the global minimum at Φ = 67° closely matching the experimental results. Employing BO within the same range of Φ values, we successfully reproduced the result. The position of the two minima as well as the full energy profile are correctly captured by the BO model (see Fig. 3h). The model converged after nine DFT calculations were performed.3.7 RhMn3
RhMn3 has a 3D fcc Kagome crystal structure, meaning that the Mn ions order in a Kagome lattice within in (111) planes. A sketch of the crystal structure is shown in Fig. 4a. Neutron diffraction experiments68,69 suggested a triangular 120° spin structure, where the magnetic moments lie within the (111) plane, as shown in Fig. 4a. This specific magnetic configuration is called T1. Later, Kübler et al. tested possible magnetic configurations in an early noncollinear DFT study, and confirmed that T1 is the most stable structure among the tested.70 The stability of the T1 spin structure could be confirmed later.71 Another spin structure tested by Kübler et al. is the T2 spin structure, which corresponds to Φ = 0°, when Φ is defined as in Fig. 4a. To confirm the result and to verify that T1 is in fact the most stable 120° spin structure with magnetic moments within the (111) plane, we generated a one-dimensional energy profile using the BO approach in the range 0° ≤ 90°. Following this definition of the canting angle, Φ = 0° corresponds to T2 and Φ = 90° corresponds to T1. | ||
| Fig. 4 The simplified crystal structure of RhMn3 is depicted in (a) with Mn ions in blue and Rh ions in gray. To enhance clarity, three out of six face-centered Mn ions are omitted. The canting angle Φ is defined in such a way that the magnetic moments lie within the (111) plane (highlighted in magenta) for any value of Φ. Panel (b) shows the one-dimensional energy profile obtained via BO (blue curve), alongside the corresponding DFT energies (blue markers). This profile is compared to a slice from a two-dimensional model that incorporates a collective out-of-plane canting angle Θ (orange curve). The complete two-dimensional energy landscape is displayed in (c). The path along Θ = 0, from which the slice is extracted, is highlighted by an orange trace. | ||
The model converged after five DFT calculations, yielding the energy profile shown in Fig. 4b. It confirms the expectation that T1 is the 120° in-plane ground state of RhMn3. In order to expand the model to also account for small collective out-of-plane cantings, we introduced a second canting angle Θ, which we defined as the angle between each magnetic moment and the (111) plane. With this, we used our BO approach to construct a two-dimensional model of the magnetic energy surface of RhMn3 in the magnetic configuration space defined by 0° ≤ Φ ≤ 90° and −2° ≤ Θ ≤ 2°. To enhance efficiency of the model generation, we exploited the symmetry E(Φ, Θ) = E(Φ, – Θ) as described in Section 2.2. The model converged after 20 DFT calculations. As depicted in Fig. 4b, it agrees closely with the one-dimensional model. The full two-dimensional model is presented in Fig. 4c. The global minimum of the model is located at (Φ = 90.0°, Θ = 0.2°), closely matching the T1 spin structure. Notably, the two-dimensional model shows that even minor out-of-plane canting results in significant magnetic energy contributions.
4 Discussion
Using BO, we generated models of the magnetic energy landscapes for seven benchmark materials, each representing different material classes and magnetic orders. In all cases, the models converged after a relatively small number of DFT calculations. Where data from previous DFT studies was available, our results matched those findings. This success is not surprising, as BO models have no intrinsic bias and will invariably converge to the correct magnetic energy landscape within the framework of DFT after a sufficient number of calculations. Table 2 provides a summary of the BO performance across all benchmark materials, along with notable new findings that are presented in this work.| Material | Dim. | Search bounds | N convDFT this work | (NconvDFT)1/d | N DFT related work | New findings |
|---|---|---|---|---|---|---|
| Ba3MnNb2O9 | 1D | [−90°, 90°] | 4 | 4 | 10 (ref. 7) | — |
| 2D | [−90°, 90°] × [−90°, 90°] | 14 | 3.74 | — | — | |
| 3D | [−90°, 90°] × [−90°, 90°] × [−90°, 90°] | 25 | 2.92 | — | — | |
| LaMn2Si2 | 1D | [0°, 90°] | 6 | 6 | — | — |
| 2D | [0°, 90°] × [0°, 180°] | 33 | 5.74 | — | Potential metastable state | |
| β-MnO2 | 1D | [0°, 180°] | 4 | 4 | — | — |
| Sr2IrO4 | 1D | [0°, 50°] | 5 | 5 | 9 (ref. 9) | — |
| 2D | [0°, 50°] × [0°, 50°] | 17 | 4.12 | — | — | |
| UO2 | 1D | [0°, 90°] | 5 | 5 | 46 (ref. 10) | — |
| 4D | [0°, 90°] × [0°, 90°] × [0°, 90°] × [0°, 90°] | 360 | 4.35 | — | Potential ground state | |
| Ba2NaOsO6 | 1D | [0°, 90°] | 10 | 10 | 36 (ref. 11) | — |
| RhMn3 | 1D | [0°, 90°] | 5 | 5 | — | — |
| 2D | [−2°, 2°] × [0°, 90°] | 20 | 4.47 | — | — |
Naturally, the number of DFT calculations needed for convergence NconvDFT is most significantly influenced by the dimensionality of the model. The value of NconvDFT of the one-dimensional models ranges between four (Ba3MnNb2O9, β-MnO2) and ten (Ba2NaOsO6). Compared to the number of DFT calculations used for in the respective related study, the BO approach required between 44% (Sr2IrO4) and 89% (UO2) fewer DFT calculations. The two-dimensional models converged earliest after 14 DFT calculations (Ba3MnNb2O9) and latest after 33 DFT calculations (LaMn2Si2). The only three-dimensional model presented in this work (Ba3MnNb2O9) converged after 25 DFT calculations and the only four-dimensional model (UO2) converged after 360 calculations.
Performance differences between models of the same dimensionality appear to be caused primarily by variations in their complexity. For instance, the only one-dimensional model with two local minima (Ba2NaOsO6) required ten DFT calculations to converge, compared to the four to six calculations needed in the other cases. A similar pattern can be found for the two-dimensional models. The model for LaMn2Si2, which features two local minima, required 33 calculations to converge. In contrast, Ba3MnNb2O9, Sr2IrO4 and RhMn3, each with a single local minimum within the search bounds, required 14,17 and 20 calculations, respectively. In both instances, NconvDFT roughly doubles when the model contains two minima.
When NconvDFT DFT calculations are required to converge a one-dimensional model, one could expect that (NconvDFT)d calculations are required to converge a d-dimensional model of the same material. However, in all cases discussed in this work, the performance of the multi-dimensional BO models is better than this approximation, as one can see from the (NconvDFT)1/d values in Table 2.
As stated in Section 2.1, we have used validation sets to track convergence of the surrogate models. This enabled us to ensure the convergence of the models and to meaningfully assess the performance of BO. However, this approach might not be reasonable for the use of BO in most practical applications, since it requires additional DFT calculations. Therefore we recommend using the maximal change of the surrogate model per iteration step as a convergence measure. This measure led to similar results for the benchmark cases presented in this work.
The two-dimensional model of the magnetic energy landscape of LaMn2Si2 revealed a local metastable state defined by Φ1 = 59° and Φ2 = 121° following the definition of Φ1 and Φ2 given in Fig. 2c. Due to the high energy difference between the local minimum and the energy barrier, the existence of the local minimum can not be explained as an artifact of an imperfect choice of k-mesh or energy cutoff of the plane-wave expansion. To the best of our knowledge, this metastable state has not been reported yet.
For Sr2IrO4, the 1D model accurately reproduces previous DFT results and agrees well with experimental observations. For the 2D model, BO identifies a broad region of the magnetic configuration space where the total energy does not exceed the global minimum by more than 0.05 meV/f.u., highlighting the challenges of exploring the energy landscape of complex spin–orbit entangled systems. Within this 2D model, BO also found an additional minimum lying 0.009 meV/f.u. below the experimentally reported structure.60,72 However, due to the inherent approximations of the employed DFT + U approach, this small energy difference lies beyond our computational precision. As such, our results remain consistent with the experimental observations.
Also in the case of UO2 there is a discrepancy between the postulated magnetic ground state and the minimum of the BO magnetic energy landscape. Although our models match the literature DFT data perfectly, they show that the energy is further reduced for several magnetic configurations with reduced symmetry by up to 0.38 meV/f.u. The lower energy values of these configurations are not artifacts of the BO approach, since they are established by explicit DFT calculations, that are computed with an accuracy threshold of 10−6 eV for a supercell containing four formula units UO2. However, as mentioned in Section 2.1, we adapted the DFT setup of Dudarev et al.10 in order to make the results comparable. This setup, in particular the choice of k-mesh and energy cutoff, might affect the observed magnetic ground state, especially considering the relatively small energy differences at play. Additionally, the choice of exchange-correlation functional might lead to unphysical results. It has been reported that the choice of exchange-correlation functional affects the total energy of UO2 obtained by DFT calculations in such a manner that it can result in different predicted ground states.66 However, although most studies indicate that the 3k state is the physical ground state of UO2, it remains a complicated matter and still poses a subject of debate.66,73 If the minima of our models are a result of the used exchange-correlation functional, the choice of the Ueff parameter or if they have a real physical root will have to be clarified in further studies.
Despite the mentioned open questions concerning interpretation, the benchmark cases LaMn2Si2 and UO2 highlight a strength of BO. They show how the capability of generating large magnetic energy landscapes with several degrees of freedom can help to spot interesting physics and potential problems of theory that would otherwise be overlooked.
BO-guided explorations are easy to implement and can easily be adapted to new problems. Although not explicitly discussed in this work, BO can also be applied to 2D magnets and materials with defects, where approaches based on symmetry analysis fail due to the breaking of symmetry by the defect. In principle, BO can be applied to explore any magnetic configuration that is compatible with the chosen computational unit cell.
Just like the methods used in previous approaches by Payne et al.12 and Zheng and Zhang,13 BO is an active machine learning scheme. An important advantage of using active machine learning schemes is that they do not require large training datasets that would be computationally expensive to produce.
Apart from the three methods mentioned in Section 1,12–14 magnetic ground states and model magnetic energy surfaces can also be found with other methods. A more conventional approach, for example, is to derive spin models from ab initio methods.74–76 The main idea of this approach is to map DFT or other first principles calculations onto a lattice spin Hamiltonian. The resulting spin model can then describe the interaction of the spins according to the chosen Hamiltonian and its properties can be determined using analytical, numerical or spin dynamics methods. This approach is highly efficient since often only a small number of DFT calculations is needed to determine the free parameters of a given spin Hamiltonian. The choice of a Hamiltonian corresponds to the chosen material and the interactions deemed essential for understanding specific properties. However, determining in advance which Hamiltonian best meets the specific requirements often is a delicate task and sometimes impossible. In contrast, BO does not require the prior specification of a Hamiltonian. This lack of a required predefined Hamiltonian is a key strength of BO, enabling it to serve as a tool for verifying or challenging prior assumptions about spin interactions in a given material. While doubtful or even wrong assumptions about spin interactions could be reflected in an improper choice of Hamiltonian and eventually lead to misleading results, BO always converges towards the true magnetic energy landscape within a given DFT + U framework after a sufficient number of DFT calculations.
Magnetic ground states can also be obtained from ab initio spin dynamics calculations as proposed by Antropov et al.77 in 1995. Starting from an arbitrary spin configuration, one follows equations of motion for the spin degrees of freedom to end up in the magnetic ground state. Although the approach produces accurate results, it is computationally relatively expensive, as the procedure should be repeated multiple times with different random initial configurations to reduce the risk of getting trapped in a local minimum. This approach has been adopted for investigating relatively simple systems, such as Fe and Co chains,78 while its application to multi-element compounds is considerably more challenging. In contrast to ab initio spin dynamics, BO provides a more comprehensive information output and can be easily adapted to more complex systems, as demonstrated in this work.
A recent approach by Ponet et al. focuses on generating an extensive list of stable magnetic states.79 By employing a constraining technique, they can reliably initialize the system's electronic state. The core idea of their approach is to generate a diverse set of initial electronic states and relax each one toward its nearest energy minimum. While the strength of this approach lies in its ability to reliably identify stable magnetic states in magnetic materials, our BO-based method offers additional insights into the magnetic energy landscape, including magnetocrystalline anisotropies and energy barriers between stable states. As such, the two are complementary.
Recently, Rinaldi et al. presented a noncollinear magnetic atomic cluster expansion (ACE) parametrization for Fe.80 They showed that the parametrization is capable of correctly reproducing a wide range of properties, including the magnetic ground state, magnetic phases and magnetic energy profiles. This achievement, however, required a substantial training dataset of 70![[thin space (1/6-em)]](https://www.rsc.org/images/entities/char_2009.gif) 000 structures with different atomic and magnetic structures. Magnetic ACE is therefore at the opposite end of the data volume range from BO. While BO offers efficient information gain about the magnetic energy landscape within a predefined configuration space at relatively low computational cost, ACE potentially offers more refined insight, albeit at the expense of a significantly larger training dataset.
000 structures with different atomic and magnetic structures. Magnetic ACE is therefore at the opposite end of the data volume range from BO. While BO offers efficient information gain about the magnetic energy landscape within a predefined configuration space at relatively low computational cost, ACE potentially offers more refined insight, albeit at the expense of a significantly larger training dataset.
A key strength of the ACE approach by Rinaldi et al. lies in its ability to capture the interplay between spin structure and crystal structure. For materials where a strong coupling exists between these two degrees of freedom, exploring the magnetic energy landscape of a rigid crystal structure – as done in this work – may not suffice to identify the true magnetic ground state. However, this limitation of our BO-based approach could potentially be addressed by performing a structural relaxation inside the BO loop prior to each DFT total energy calculation. Such an approach has already been successfully applied to investigate octahedral tilting using BO.24 While this would incur higher computational costs, it may yield a more physically accurate description of the ground state in such strongly coupled systems.
In general our results show that BO can be used as a tool to efficiently explore noncollinear magnetic energy landscapes and find magnetic ground states within large spin configuration spaces. Thereby it can help to obtain exhaustive insights into the intricate interactions of complex magnetic materials.
5 Conclusion
In this work we introduced a new approach to explore magnetic energy surfaces and find magnetic ground states efficiently by combining BO with constrained DFT + U calculations. Our approach exploits the strength of BO to accurately model unknown functions with a minimal number of data acquisitions. We validated our method using Ba3MnNb2O9, LaMn2Si2, β-MnO2, Sr2IrO4, UO2, Ba2NaOsO6 and RhMn3 as benchmark materials – seven complex magnetic materials that represent various types of magnetic structures. As a first test for every material we defined a collective canting angle for all magnetic moments and determined the material's energy as a function of the canting angle using our BO approach. The resulting one-dimensional surrogate models converge earliest after four and latest after ten DFT calculations. The ground states of all models are perfectly in line with previous studies. Comparisons with studies on Sr2IrO4, UO2 and Ba2NaOsO6 that investigated the dependence of the materials energies on the same collective canting angles using more classical approaches underline the high efficiency of our approach. In order to achieve the same results we needed between 44% and 89% fewer DFT calculations than in the respective study. The gain in efficiency allowed us to expand the models to up to four degrees of freedom by defining more than one independent canting angle, while maintaining reasonable computational costs. Thereby we were provided with further insights into the magnetic energy landscapes of the six materials. Notably, the models revealed previously unreported stable and metastable magnetic states in LaMn2Si2 and UO2.Data availability
The python package BOSS used for the BO calculations can be found at https://cest-group.gitlab.io/boss/index.html. Data for this article, including the central VASP input files (INCAR), the structural data files (POSCAR), the BOSS input files and all calculated DFT energy values are available at Zenodo at https://doi.org/10.5281/zenodo.15155946.Author contributions
C. F.: conceptualization, supervision, writing – review & editing. J. B.: conceptualization, methodology, software, writing – original draft. L. C.: methodology, writing – review & editing. M. T.: conceptualization, review & editing. P. R.: conceptualization, review & editing.Conflicts of interest
There are no conflicts to declare.Acknowledgements
This work was supported by Piano Nazionale Resistenza e Resilienza (PNRR) – Next Generation Europe. The calculations have been performed using the Vienna Scientific Cluster (VSC).References
- A. Szilva, Y. Kvashnin, E. A. Stepanov, L. Nordström, O. Eriksson, A. I. Lichtenstein and M. I. Katsnelson, Rev. Mod. Phys., 2023, 95, 035004 Search PubMed.
- G. Mörée, J. Sjölund and M. Leijon, IEEE Trans. Magn., 2022, 58, 1–19 Search PubMed.
- V. G. Harris and A. S. Sokolov, J. Supercond. Novel Magn., 2019, 32, 97–108 CrossRef CAS.
- Y. Tokura and N. Kanazawa, Chem. Rev., 2020, 121, 2857–2897 CrossRef PubMed.
- A. Paul, P. Sharma and U. V. Waghmare, Phys. Rev. B: Condens. Matter Mater. Phys., 2015, 92, 054106 CrossRef.
- D. Spišák and J. Hafner, Phys. Rev. B: Condens. Matter Mater. Phys., 2000, 61, 11569 CrossRef.
- M. Lee, E. Choi, X. Huang, J. Ma, C. D. Cruz, M. Matsuda, W. Tian, Z. Dun, S. Dong and H. Zhou, Phys. Rev. B: Condens. Matter Mater. Phys., 2014, 90, 224402 CrossRef.
- I. Živković, R. Yadav, J.-R. Soh, C. Yi, Y. Shi, O. V. Yazyev and H. M. Rønnow, Phys. Rev. B: Condens. Matter Mater. Phys., 2022, 106, L180403 CrossRef.
- P. Liu, S. Khmelevskyi, B. Kim, M. Marsman, D. Li, X.-Q. Chen, D. Sarma, G. Kresse and C. Franchini, Phys. Rev. B: Condens. Matter Mater. Phys., 2015, 92, 054428 CrossRef.
- S. Dudarev, P. Liu, D. Andersson, C. Stanek, T. Ozaki and C. Franchini, Phys. Rev. Mater., 2019, 3, 083802 CrossRef CAS.
- D. Fiore Mosca, L. V. Pourovskii, B. H. Kim, P. Liu, S. Sanna, F. Boscherini, S. Khmelevskyi and C. Franchini, Phys. Rev. B: Condens. Matter Mater. Phys., 2021, 103, 104401 CrossRef CAS.
- A. Payne, G. Avendano-Franco, E. Bousquet and A. H. Romero, J. Chem. Theory Comput., 2018, 14, 4455–4466 Search PubMed.
- F. Zheng and P. Zhang, Comput. Phys. Commun., 2021, 259, 107659 Search PubMed.
- M.-T. Huebsch, T. Nomoto, M.-T. Suzuki and R. Arita, Phys. Rev. X, 2021, 11, 011031 CAS.
- Y. Koyama, I. Sato, D. Sakamoto and T. Igarashi, ACM Trans. Graph., 2017, 36, 1–11 CrossRef.
- M. Yu, S. Yang, C. Wu and N. Marom, npj Comput. Mater., 2020, 6, 180 CrossRef CAS.
- M. Todorović, M. U. Gutmann, J. Corander and P. Rinke, npj Comput. Mater., 2019, 5, 35 CrossRef.
- R. Calandra, A. Seyfarth, J. Peters and M. P. Deisenroth, Ann. Math. Artif. Intell., 2016, 76, 5–23 CrossRef.
- P. Ilten, M. Williams and Y. Yang, J. Instrum., 2017, 12, P04028 CrossRef.
- R.-R. Griffiths and J. M. Hernández-Lobato, Chem. Sci., 2020, 11, 577–586 RSC.
- C. E. Rasmussen and C. K. I. Williams, Gaussian processes for machine learning, MIT Press, 2006, p. 248 Search PubMed.
- J. Löfgren, D. Tarasov, T. Koitto, P. Rinke, M. Balakshin and M. Todorović, ACS Sustain. Chem. Eng., 2022, 10, 9469 CrossRef.
- Y. Wu, A. Walsh and A. M. Ganose, Digit. Discov., 2024, 3, 1086–1100 RSC.
- J. Li, F. Pan, G.-X. Zhang, Z. Liu, H. Dong, D. Wang, Z. Jiang, W. Ren, Z.-G. Ye, M. Todorović and P. Rinke, Small Struct., 2024, 5, 2400268 CrossRef CAS.
- D. A. Tompsett, D. S. Middlemiss and M. S. Islam, Phys. Rev. B: Condens. Matter Mater. Phys., 2012, 86, 205126 CrossRef.
- P. Liu, M. Reticcioli, B. Kim, A. Continenza, G. Kresse, D. Sarma, X.-Q. Chen and C. Franchini, Phys. Rev. B, 2016, 94, 195145 Search PubMed.
- E. Brochu, V. M. Cora and N. De Freitas, arXiv, 2010, preprint, arXiv:1012.2599, DOI:10.48550/arXiv.1012.2599.
- R. Garnett, Bayesian Optimization, Cambridge University Press, 2023 Search PubMed.
- G. Kresse and J. Furthmüller, Phys. Rev. B: Condens. Matter Mater. Phys., 1996, 54, 11169 CrossRef CAS PubMed.
- G. Kresse and J. Furthmüller, Comput. Mater. Sci., 1996, 6, 15–50 CrossRef CAS.
- D. Hobbs, G. Kresse and J. Hafner, Phys. Rev. B: Condens. Matter Mater. Phys., 2000, 62, 11556 CrossRef CAS.
- J. P. Perdew, K. Burke and M. Ernzerhof, Phys. Rev. Lett., 1996, 77, 3865 Search PubMed.
- G. Kresse and D. Joubert, Phys. Rev. B: Condens. Matter Mater. Phys., 1999, 59, 1758 CrossRef CAS.
- S. L. Dudarev, G. A. Botton, S. Y. Savrasov, C. Humphreys and A. P. Sutton, Phys. Rev. B: Condens. Matter Mater. Phys., 1998, 57, 1505 CrossRef CAS.
- A. Liechtenstein, V. I. Anisimov and J. Zaanen, Phys. Rev. B: Condens. Matter Mater. Phys., 1995, 52, R5467 CrossRef CAS PubMed.
- P.-W. Ma and S. Dudarev, Phys. Rev. B: Condens. Matter Mater. Phys., 2015, 91, 054420 CrossRef.
- M. Xu, L. H. Kendrick, A. Kale, Y. Gang, G. Ji, R. T. Scalettar, M. Lebrat and M. Greiner, Nature, 2023, 620, 971–976 CrossRef CAS PubMed.
- D. Amoroso, P. Barone and S. Picozzi, Nanomaterials, 2021, 11, 1873 CrossRef CAS PubMed.
- V. Meschke, P. Gorai, V. Stevanovic and E. S. Toberer, Chem. Mater., 2021, 33, 4373–4381 CrossRef CAS.
- Z. Tian, Q. Guo, Z. Ouyang, G. Du, W. Tong, J. Wang and S. Yuan, Solid State Commun., 2014, 191, 66–69 Search PubMed.
- A. Yoshimori, J. Phys. Soc. Jpn., 1959, 14, 807–821 CrossRef.
- D. M. Korotin, E. Rosenfeld, N. Mushnikov, E. Gerasimov, I. Zhidkov, A. Kukharenko, L. Finkelstein, S. Cholakh and E. Kurmaev, J. Alloys Compd., 2017, 695, 1663–1671 Search PubMed.
- I. Nowik, Y. Levi, I. Felner and E. Bauminger, J. Magn. Magn. Mater., 1995, 147, 373–384 Search PubMed.
- E. Gerasimov, T. Kanomata and V. Gaviko, Phys. B, 2007, 390, 118–123 Search PubMed.
- G. Venturini, R. Welter, E. Ressouche and B. Malaman, J. Alloys Compd., 1994, 210, 213–220 CrossRef CAS.
- M. Hofmann, S. Campbell, S. Kennedy and X. Zhao, J. Magn. Magn. Mater., 1997, 176, 279–287 CrossRef CAS.
- S. Di Napoli, A. Llois, G. Bihlmayer, S. Blügel, M. Alouani and H. Dreyssé, Phys. Rev. B: Condens. Matter Mater. Phys., 2004, 70, 174418 Search PubMed.
- T. Yokouchi, F. Kagawa, M. Hirschberger, Y. Otani, N. Nagaosa and Y. Tokura, Nature, 2020, 586, 232–236 Search PubMed.
- T. Kurumaji, Phys. Sci. Rev., 2020, 5, 20190016 Search PubMed.
- S. Mühlbauer, B. Binz, F. Jonietz, C. Pfleiderer, A. Rosch, A. Neubauer, R. Georgii and P. Böni, Science, 2009, 323, 915–919 Search PubMed.
- J. D. Koralek, C. P. Weber, J. Orenstein, B. A. Bernevig, S.-C. Zhang, S. Mack and D. Awschalom, Nature, 2009, 458, 610–613 Search PubMed.
- H. Sato, K. Wakiya, T. Enoki, T. Kiyama, Y. Wakabayashi, H. Nakao and Y. Murakami, J. Phys. Soc. Jpn., 2001, 70, 37–40 CrossRef CAS.
- M. Regulski, R. Przeniosło, I. Sosnowska and J.-U. Hoffmann, Phys. Rev. B: Condens. Matter Mater. Phys., 2003, 68, 172401 CrossRef.
- M. Regulski, R. Przeniosło, I. Sosnowska and J.-U. Hoffmann, J. Phys. Soc. Jpn., 2004, 73, 3444–3447 CrossRef CAS.
- W. Osmond, Proc. Phys. Soc., 1966, 87, 335 CrossRef CAS.
- B. Kim, H. Jin, S. Moon, J.-Y. Kim, B.-G. Park, C. Leem, J. Yu, T. Noh, C. Kim and S.-J. Oh, et al. , Phys. Rev. Lett., 2008, 101, 076402 Search PubMed.
- S. Moon, H. Jin, K. W. Kim, W. Choi, Y. Lee, J. Yu, G. Cao, A. Sumi, H. Funakubo and C. Bernhard, et al. , Phys. Rev. Lett., 2008, 101, 226402 Search PubMed.
- P. Liu and C. Franchini, Appl. Sci., 2021, 11, 2527 Search PubMed.
- M. Crawford, M. Subramanian, R. Harlow, J. Fernandez-Baca, Z. Wang and D. Johnston, Phys. Rev. B: Condens. Matter Mater. Phys., 1994, 49, 9198 CrossRef PubMed.
- S. Boseggia, H. Walker, J. Vale, R. Springell, Z. Feng, R. Perry, M. M. Sala, H. M. Rønnow, S. Collins and D. F. McMorrow, J. Phys.:Condens. Matter, 2013, 25, 422202 Search PubMed.
- P. Burlet, J. Rossat-Mignod, O. Vogt, J. Spirlet and J. Rebivant, et al. , J. Less-Common Met., 1986, 121, 121–139 CrossRef CAS.
- G. Amoretti, A. Blaise, R. Caciuffo, J. Fournier, M. Hutchings, R. Osborn and A. Taylor, Phys. Rev. B: Condens. Matter Mater. Phys., 1989, 40, 1856 Search PubMed.
- E. Blackburn, R. Caciuffo, N. Magnani, P. Santini, P. Brown, M. Enderle and G. Lander, Phys. Rev. B: Condens. Matter Mater. Phys., 2005, 72, 184411 CrossRef.
- K. Ikushima, S. Tsutsui, Y. Haga, H. Yasuoka, R. Walstedt, N. Masaki, A. Nakamura, S. Nasu and Y. Onuki, Phys. Rev. B: Condens. Matter Mater. Phys., 2001, 63, 104404 CrossRef.
- S. Wilkins, R. Caciuffo, C. Detlefs, J. Rebizant, E. Colineau, F. Wastin and G. Lander, Phys. Rev. B: Condens. Matter Mater. Phys., 2006, 73, 060406 CrossRef.
- S. Zhou, H. Ma, E. Xiao, K. Gofryk, C. Jiang, M. E. Manley, D. H. Hurley and C. A. Marianetti, Phys. Rev. B, 2022, 106, 125134 Search PubMed.
- L. Lu, M. Song, W. Liu, A. Reyes, P. Kuhns, H. Lee, I. Fisher and V. Mitrović, Nat. Commun., 2017, 8, 14407 CrossRef CAS PubMed.
- E. Krén, G. Kádár, L. Pál, J. Sólyom and P. Szabó, Phys. Lett., 1966, 20, 331–332 Search PubMed.
- E. Krén, G. Kádár, L. Pál and P. Szabó, J. Appl. Phys., 1967, 38, 1265–1266 Search PubMed.
- J. Kübler, K.-H. Hock, J. Sticht and A. Williams, Journal of Physics F: Metal Physics, 1988, 18, 469 CrossRef.
- A. Sakuma, R. Umetsu and K. Fukamichi, Phys. Rev. B: Condens. Matter Mater. Phys., 2002, 66, 014432 CrossRef.
- F. Ye, S. Chi, B. C. Chakoumakos, J. A. Fernandez-Baca, T. Qi and G. Cao, Phys. Rev. B:Condens. Matter Mater. Phys., 2013, 87, 140406 Search PubMed.
- R. Laskowski, G. K. Madsen, P. Blaha and K. Schwarz, Phys. Rev. B: Condens. Matter Mater. Phys., 2004, 69, 140408 Search PubMed.
- M. Hoffmann and S. Blügel, Phys. Rev. B, 2020, 101, 024418 CrossRef CAS.
- B. Dupé, M. Hoffmann, C. Paillard and S. Heinze, Nat. Commun., 2014, 5, 4030 Search PubMed.
- A. Deák, L. Szunyogh and B. Ujfalussy, Phys. Rev. B:Condens. Matter Mater. Phys., 2011, 84, 224413 CrossRef.
- V. P. Antropov, M. Katsnelson, M. Van Schilfgaarde and B. Harmon, Phys. Rev. Lett., 1995, 75, 729 CrossRef CAS PubMed.
- B. Újfalussy, B. Lazarovits, L. Szunyogh, G. Stocks and P. Weinberger, Phys. Rev. B:Condens. Matter Mater. Phys., 2004, 70, 100404 CrossRef.
- L. Ponet, E. Di Lucente and N. Marzari, npj Comput. Mater., 2024, 10, 151 Search PubMed.
- M. Rinaldi, M. Mrovec, A. Bochkarev, Y. Lysogorskiy and R. Drautz, npj Comput. Mater., 2024, 10, 12 CrossRef CAS.
| This journal is © The Royal Society of Chemistry 2025 |