
 Open Access Article
 This Open Access Article is licensed under a
 Creative Commons Attribution 3.0 Unported Licence
Unravelling cyclic peptide membrane permeability prediction: a study on data augmentation, architecture choices, and representation schemes
Alfonso
Cabezón†
 a,
Erik
Otović†
bc,
Daniela
Kalafatovic
cd,
Ángel
Piñeiro
e,
Rebeca
García-Fandiño
*a and
Goran
Mauša
*bcd
a,
Erik
Otović†
bc,
Daniela
Kalafatovic
cd,
Ángel
Piñeiro
e,
Rebeca
García-Fandiño
*a and
Goran
Mauša
*bcd
aUniversity of Santiago de Compostela, Department of Organic Chemistry, Centro Singular de Investigación en Química Biolóxica e Materiais Moleculares (CiQUS), Santiago de Compostela, Spain. E-mail: rebeca.garcia.fandino@usc.es
bUniversity of Rijeka, Faculty of Engineering, Rijeka, Croatia. E-mail: goran.mausa@uniri.hr
cUniversity of Rijeka, Center for Artificial Intelligence and Cybersecurity, Rijeka, Croatia
dUniversity of Rijeka, Center for Advanced Computing and Modelling, Rijeka, Croatia
eUniversity of Santiago de Compostela, Department of Applied Physics, Faculty of Physics, Santiago de Compostela, Spain
First published on 3rd April 2025
Abstract
Cyclic peptides have emerged as promising candidates for drug development due to their unique structural properties and potential therapeutic benefits. However, clinical applications are limited by their low membrane permeability, which is difficult to predict. This study explores the impact of data augmentation and the inclusion of cyclic structure information in ML modeling to enhance the prediction of membrane permeability of cyclic peptides from their amino acid sequence. Various peptide representation strategies in combination with data augmentation techniques based on amino acid mutations and cyclic permutations were investigated to address the limited availability of experimental data. Moreover, cyclic convolutional layers were explored to explicitly model the cyclic nature of the peptides. The results indicated that combining sequential and peptide properties demonstrated superior performance across multiple metrics. The model performance is highly sensitive to the number and degree of similarity of amino acids involved in mutations. Cyclic permutations improved model performance, particularly in a larger and more diverse dataset and standard architectures captured most of the relevant cyclic information. Highlighting the complexity of peptide-membrane interactions, these results lay a foundation for future improvements in computational methods for the design of cyclic peptide drugs and offer practical guidelines for researchers in this field. The best-performing model was integrated into a user-friendly web-based tool, CYCLOPS: CYCLOpeptide Permeability Simulator (available at http://cyclopep.com/cyclops), to facilitate wider accessibility and application in drug discovery community. This tool allows for rapid predictions of the membrane permeability for cyclic peptides with a classification accuracy score of 0.824 and a regression mean absolute error of 0.477.
1 Introduction
Therapeutic peptides are now recognized as a vital class of pharmaceutical agents, offering unique advantages in addressing complex and diverse disease targets.1,2 Composed of well-ordered amino acid sequences with molecular weights typically between 500 and 5000 Da, peptides possess high specificity and affinity for their biological targets, mimicking natural hormones, enzymes, and growth factors.3 The clinical application of peptide drugs has revolutionized several therapeutic areas, with over 80 peptide drugs approved worldwide to date.4 These include life-saving molecules such as insulin, oxytocin, and glucagon-like peptide analogs, which have set the foundation for peptide-based therapies in endocrinology, oncology, metabolic disorders, and more.However, the clinical development of therapeutic peptides faces significant challenges. One major issue is their metabolic instability, as they are rapidly degraded by proteolytic enzymes.5 Additionally, therapeutic peptides often exhibit toxicity to host cells, which can limit their therapeutic use.6 Another challenge is their poor bioavailability, as therapeutic peptides tend to have short half-lives and are quickly cleared from the bloodstream. To address these issues, various strategies have been explored, including the use of non-natural amino acids and peptide cyclization to improve stability and reduce degradation.7
Cyclic peptides (CPs), have shown promise in overcoming some of these limitations due to good antimicrobial activity, enhanced metabolic stability, improved target affinity, and the potential to disrupt protein–protein interactions.6,8 Their cyclic structure provides resistance to enzymatic degradation, which provides an advantage over linear peptides. This stability is attributed to the conformational constraint imposed by the cyclic backbone, which limits the peptide's flexibility and makes it less recognizable by proteolytic enzymes.9,10 Moreover, CPs often exhibit higher binding affinities and specificities for their targets because of their rigid structures. This rigidity allows for more precise interactions with target molecules, which is particularly beneficial in disrupting protein–protein interactions that are typically difficult to target with small molecules.9 These characteristics make CPs particularly attractive for targeting intracellular processes involved in various diseases, including cancer and neurodegenerative disorders.11 Currently, more than 40 CPs are used as therapeutic agents, demonstrating their potential in drug development.12 Despite their potential, the clinical application of CPs is limited mainly by their low membrane permeability. The complex relationship between the structure of a CP and its ability to penetrate cellular membranes poses a challenge in drug design and optimization.13 This challenge arises because properties that enhance stability and binding affinity, such as increased size and polarity, generally hinder the ability of peptides to cross cellular membranes. Consequently, while CPs hold great promise, their development into effective drugs for intracellular targets requires innovative strategies to enhance their membrane permeability without compromising their therapeutic efficacy.
Understanding the factors that govern the membrane permeability of CPs is critical for advancing their therapeutic applications. Early attempts to address this challenge include Lipinski's rule of 5,14 which was intended to predict oral availability, a property closely related to cell penetration. Various computational approaches, such as linear free energy relationships (LFER), quantitative structure–property relationships (QSPR), and quantitative structure–activity relationships (QSAR), have been used to model molecular membrane permeability.15–20 A significant advancement in the study of CP permeability was the creation of CycPeptMPDB,21 a database containing information on more than 7000 membrane-permeable CPs. This resource provides a robust foundation for elucidating the molecular features that govern CP permeability and has been instrumental in driving the development of various machine learning (ML) models for permeability prediction.22–27
Initial attempts to model CP permeability relied on traditional ML approaches, particularly support vector regression (SVR), which used molecular descriptors (MOE2D) to capture key structural properties. While SVR demonstrated state-of-the-art performance in regression tasks (interestingly, outperforming more complex deep learning models in these tasks), achieving a MAE of 0.270 and a MSE of 0.146 on RRCK assays, with a coefficient of determination (R2) of 0.708),25 deep learning models—particularly those integrating graph neural network (GNNs), transformers, or multimodal architectures—have shown superior performance in classification and in representing more complex molecular structures. The PharmPapp25 model, which combines a GNN with a multilayer perceptron (MLP) to process both molecular graphs and peptide-specific features, achieved a MAE of 0.317 and an R2 of 0.672. Meanwhile, Multi_CycGT,22 a multimodal deep learning framework that integrates transformers, graph convolutional networks (GCNs), and MLPs, demonstrated an accuracy of 0.820 and a ROC-AUC of 0.865 in PAMPA assays (using a logP threshold of −6). By incorporating molecular graphs, SMILES representations, and physicochemical properties, this model significantly enhanced CP permeability classification. Similarly, PeptideCLM23 leverages a pretrained transformer (BERT-style with RoPE) to process SMILES directly, enabling it to generalize to both natural and unnatural amino acids. This model achieved a MSE of 0.551 in regression and a ROC-AUC of 0.781 in classification (using a logP threshold of −5.5), surpassing existing chemical language models. CycPeptMP,24 a hybrid model combining transformer, convolutional neural network (CNN), and MLP architectures, further refined permeability prediction by integrating atomic-, monomer-, and peptide-level features, achieving a MAE of 0.355, a MSE of 0.271, and an R2 of 0.780 in PAMPA assays. Expanding on these approaches, CyclePermea26 introduced a Multi-Loss Fusion Network that utilizes a BERT-based peptide encoder trained with auxiliary loss functions (Constraint Contrastive Learning Loss and Cyclization Site Prediction Loss). Unlike previous methods, CyclePermea26 relies solely on 1D sequence information (SMILES and molecular fingerprints), eliminating the need for complex 3D descriptors. It achieved a MAE of 0.334 and a MSE of 0.217 in PAMPA, Caco-2, MDCK, and RRCK permeability assays, demonstrating the efficacy of leveraging chemical language models without relying on predefined molecular descriptors. Finally, MuCoCP27 represents another breakthrough in CP permeability prediction. This hybrid transformer-GNN model, trained with semi-supervised learning objectives, achieved an R2 of 0.503 in regression tasks and an accuracy of 0.870 in classification (using a logP threshold of −6), marking a significant advancement in high-dimensional peptide analysis. The overview of these models is given in Table 1.
| Model | Architecture/algorithm | Peptide encoding scheme (input features) | Assays | Regression | Classification | ||||
|---|---|---|---|---|---|---|---|---|---|
| MAE | MSE | R 2 | LogP threshold | ACC | ROC-AUC | ||||
| Multi_CycGT22 | Hybrid (transformer + GCN + MLP) | Molecular graph, SMILES, and physicochemical properties | PAMPA | 0.394 | 0.269 | 0.338 | −6 | 0.820 | 0.865 |
| PeptideCLM23 | Transformer (BERT-style with RoPE) | SMILES processed directly | PAMPA | NR | 0.551 | NR | −5.5 | NR | 0.781 |
| CycPeptMP24 | Hybrid (transformer + CNN + MLP) | Peptide properties, monomer-level properties, atom-level properties | PAMPA | 0.355 | 0.271 | 0.780 | NR | NR | NR |
| PharmPapp25 | Hybrid (GNN + MLP) | Molecular graph, peptide properties | PAMPA | 0.317 | 0.185 | 0.672 | NR | NR | NR |
| CyclePermea26 | Multi-loss fusion network (BERT-based peptide encoder with auxiliary losses) | SMILES and fingerprint profiles | PAMPA, Caco-2, MDCK, RRCK | 0.334 | 0.217 | NR | NR | NR | NR |
| MuCoCP27 | Hybrid (transformer + GNN) | Molecular graph, peptide properties | PAMPA, Caco-2, MDCK, RRCK | NR | 0.710 | 0.503 | −6 | 0.870 | NR |
| — | SVR25 | MOE2D descriptors | RRCK | 0.270 | 0.146 | 0.708 | NR | NR | NR |
While CycPeptMPDB21 provides a rich dataset for CP permeability studies, the scarcity of experimental data remains a critical bottleneck in this field. Experimental data generation is often resource-intensive and time-consuming, limiting the size and diversity of datasets available for training ML models. To address this challenge, data augmentation strategies can synthetically expand training datasets, offering a practical approach to overcoming data limitations. These strategies not only increase the size of the training set but also potentially enhance the model's ability to generalize to new, unseen peptide sequences.28,29 However, the impact of augmented data on model performance when trained predominantly on synthetic samples and evaluated on original experimental data remains unclear. This work aims to fill this gap by systematically exploring the effects of data augmentation in the context of CP permeability classification. In this study, CPs were classified as high or low permeability based on a permeability threshold of −6.21 To fully explore the predictive potential of CP permeability, two complementary ML tasks were implemented. The classification task aimed to categorize peptides into high- and low-permeability groups, while the regression task focused on predicting continuous permeability values (logP). While data augmentation was employed to assess its impact on classification performance, regression models were evaluated separately to provide a complementary perspective on model behavior.
Various peptide representation strategies were evaluated, including sequential properties derived from amino acid order and physicochemical features, structural information encoded from the SMILES format, and combinations of these approaches to capture both sequence-based and structural characteristics of CPs. SMILES, in particular, offers a chemically expressive representation that has shown promise in previous studies for tasks such as peptide function prediction when combined with appropriate feature selection techniques.30 Additionally, neural network architectures of varying complexity were employed, differing in their ability to capture cyclic structures. The integration of physicochemical properties, such as molecular descriptors (e.g., molecular weight, max partial charge, topological polar surface area), with structural encodings from SMILES provided a richer feature set for model training. When combined with sequential properties, which capture peptide-specific amino acid order by encoding each residue with its molecular descriptors (e.g., number of aromatic rings, number of hydrogen bond donors, Morgan density fingerprints), the model effectively represented CPs for permeability prediction. To improve structural modeling, neural network architectures employing cyclic convolutional layers were explored, explicitly modeling the cyclic nature of peptides to capture structural characteristics that may be overlooked by standard linear sequence models.
To facilitate broader accessibility and application of these findings, a web-based tool implementing the best-performing predictive model has been developed. Named CYCLOPS: CYCLOpeptide Permeability Simulator (accessible at http://cyclopep.com/cyclops), this resource enables researchers and drug developers to predict the membrane permeability of CPs with high accuracy and without requiring advanced computational expertise. By streamlining the prediction process, this tool aims to support the design and optimization of CP-based therapeutics, accelerating progress toward more effective treatments for challenging intracellular targets.
2 Results and discussion
Two datasets from the CycPeptMPDB database21 were used in this study: AllPep and L6/7. The AllPep dataset, comprising 7236 sequences ranging from 2 to 15 amino acids, provided a broad spectrum of diverse peptides in terms of length and amino acid composition for model evaluation. In contrast, the L6/7 dataset focused on 4114 sequences of hexapeptides or heptapeptides cyclized in a head-to-tail configuration provides a smaller and simpler, but imbalanced dataset, which will also provide insight into the model's behavior when class imbalance is present. Detailed information on the datasets and preprocessing steps is available in the Methods section.• Cyclic permutations, where amino acids are reordered by shifting the sequence while preserving the original structural connections, and five types of mutation, ranging from conservative to disruptive, were designed to investigate the impact of data augmentation for prediction of CP membrane permeability:
• Ultra-conservative mutations (UCM): comprise amino acid analogs with identical logarithmic partition coefficient (logP) values, allowing only single-position mutations per sequence.
• Conservative mutations (CM): substitution of an amino acid with another that has matching physicochemical properties.
• Non-conservative or disruptive mutations (DM): substituting one amino acid with another that has a considerably different logP to introduce variability and disturb the model. This type of mutation will serve to highlight the importance of meticulously selecting mutations.
• Multiple conservative mutations (MultCM) and Multiple Disruptive Mutations (MultDM): the same type of mutation as CM and DM, respectively, but introducing at least three mutated amino acids per sequence. In the case of the L6/L7 dataset, this represents a 50% change for the sequence composed of 6 amino acids and a 43% change for the 7 amino acid sequences.
Three peptide representation schemes were used to encode CPs, and their combinations were also evaluated to investigate whether they complement each other and enhance predictive performance:
• Peptide properties (PP): computed for the complete sequence, giving an overall perspective of the peptide, but not distinguishing between permutations of identical amino acids, given that theoretical physicochemical properties typically disregard amino acid sequence order.31
• Sequential properties (SP): encoding each amino acid in the peptide using its unique physicochemical characteristics, capturing both sequence order and individual residue properties simultaneously.
• Simplified molecular input line entry system (SMILES): this approach employs the SMILES notation to represent peptides by encoding their chemical structure into a compact text-based format. This representation can be directly employed by natural language processing (NLP) models.
To assess the predictive performance of different data augmentation strategies and peptide representation methods, the study focused primarily on classification, in which peptides were categorized into high- and low-permeability groups using a logP threshold of −6. This approach offers an interpretable and practical framework for identifying membrane-permeable CPs, making it well-suited for early-stage drug discovery applications. Although classification was the primary focus of this study, a regression model was also trained to estimate continuous logP values, providing a complementary perspective for cases where a finer-grained permeability estimation might be useful. The performance of both classification and regression models is analyzed in detail in the following sections.
To expand the scope of accessibility and use of these findings, an online tool was developed to provide access to the best-performing predictive model. This tool, available at http://cyclopep.com/cyclops, allows users without ML expertise to perform rapid permeability predictions. The web server includes an intuitive interface for peptide sequence input, an efficient cloud-based infrastructure, and data privacy safeguards. Predictions are displayed in a clear, interpretable format, including permeability scores, confidence estimates, and relevant metrics. The tool primarily implements the classification model, aligning with its utility in practical decision-making, but also provides logP estimates from the regression model when continuous permeability values are needed. By streamlining the prediction process, CYCLOPS supports the design and optimization of CP-based therapeutics, particularly in early-phase screening, where computational methods can help identify promising candidates for intracellular targets.
The following subsections provide a detailed analysis of the impact of data augmentation strategies, peptide representations, and model architectures in CP permeability prediction.
2.1 Experiment workflow
The models were evaluated using a stratified 3-times repeated 10-fold cross-validation strategy, ensuring a balanced distribution of high- and low-permeability peptides across folds. This approach provides a robust and reproducible evaluation framework, effectively mitigating data imbalance while allowing the model to generalize across diverse peptide structures. Although cluster-based splitting strategies—which group structurally similar peptides within the same fold—have been suggested to enhance model generalizability,26 the stratified cross-validation scheme was chosen to maintain consistency across experiments and ensure comparability among different peptide representations and data augmentation strategies. In the cross-validation strategy, at each iteration, nine folds were used for hyperparameter optimization and training, while one fold was reserved as a test set for final evaluation. Feature selection was conducted using a subset of inputs from L6/7 for training (200 randomly selected sequences) and the remaining dataset for testing. Four scenarios were evaluated using the sequential properties (SP) model:(a) Principal component analysis (PCA): PCA was applied to all features and the optimal number of components was determined by evaluating model accuracy across a range of 1 to 60 components.
(b) Knowledge-driven selection: a subset of eight features deemed crucial for permeability was selected: molecular weight, maximum partial charge, minimum partial charge, topological polar surface area, number of H-donors, number of H-acceptors, ring count, and logarithm of the partition coefficient.
(c) Fixed features combined with PCA components: the same eight features as in scenario (b) were used. PCA was then applied to the remaining features, and the resulting components were combined with the eight fixed features.
(d) Use of all features: all available features were used without any selection or dimension reduction.
For scenarios (a) and (c), which involved PCA, we evaluated SP model performance across different numbers of components. Based on the accuracy achieved in the test set (Fig. 1), the selection of 4 PCA components was considered as optimal. This resulted in 12 total features for scenario (c): the 8 fixed features plus 4 PCA components derived from the remaining features.
 | ||
| Fig. 1 Average accuracy of the SP classification model across training, validation, and test sets as a function of the number of features (x-axis), calculated over 100 runs. For scenario (a) (left plot), the features correspond to PCA components derived from the entire feature set. For scenario (c) (right plot), the features consist of 8 fixed features combined with PCA components derived from the remaining features. | ||
The model was trained 100 times for each of the four scenarios, using consistent data splits to ensure fair comparison. Mean accuracy on the test set was calculated and compared across scenarios (Fig. 2). Results indicated that models using 4 PCA components (scenario (a)) and 8 fixed features plus 4 PCA components (scenario (c)) were the top performers. Despite these results, scenario (d) (using all features) was ultimately selected for further study. This decision was made because scenario (d) demonstrated performance and computational running time comparable to the top-performing scenario (a), while ensuring that all available information was retained for the model. This approach guarantees that no potentially valuable information is lost in the feature selection process, while still maintaining competitive model performance and efficiency.
 | ||
| Fig. 2 Comparison of classification model accuracy across different feature selection approaches. Mean accuracy (ACC) and standard deviation were calculated from 100 model runs per scenario. The scenarios are labeled as follows: (a) 4PCA, where features consist of 4 principal components derived from the entire feature set; (b) 8Fix, which uses 8 fixed features selected a priori; (c) 8Fix+4PCA, combining 8 fixed features with 4 principal components derived from the remaining features; and (d) all Features, which includes the complete set of features without dimensionality reduction. | ||
The final model was trained using the selected feature set-up, following the workflow illustrated in Fig. 3:
 | ||
| Fig. 3 Schematic representation of the data handling, model training, and evaluation procedure. The workflow illustrates the stratified cross-validation approach, data augmentation techniques, hyperparameter tuning, and the final evaluation process leading to the average test score. | ||
(1) Data partitioning: a 3-times repeated stratified 10-fold cross-validation split the dataset into training and test sets. The training set was further divided into an actual training set (80%) and a validation set (20%).
(2) Data augmentation: the training sequences underwent transformations such as cyclic permutations or amino acid mutations.
(3) Hyperparameter optimization: for each fold, the hyperband method was employed to determine the optimal hyperparameters using the training and validation data.
(4) Model training and evaluation: the model was built and trained using the best hyperparameters for each cross-validation iteration. Evaluation was performed on the left-out fold containing only original sequences, ensuring fair comparison between models.
(5) Performance assessment: this process yielded 30 test scores, corresponding to a 3-times repeated 10-fold cross-validation. In this setup, the dataset was split into 10 folds, and the model was trained and evaluated on each fold in turn. This process was repeated three times with different initial weights, and the final performance metrics represent the average of these 30 test scores. Seven evaluation metrics, chosen to address data imbalance, were used to measure predictive efficacy: accuracy, recall, precision, F1 score, Matthews correlation coefficient (MCC), ROC-AUC,32 and Geometric mean score (GM).
2.2 Comparison of model performances
For a fair comparison of the three representation formats, all three models employed the same feed-forward neural network architecture for final permeability classification, with the key difference lying in how they initially represent and process the peptide data. The binary classification models were trained to distinguish high permeability (logP ≥ −6) from low permeability (logP < −6), using different input representations and architectural variations, as detailed below. These models were also integrated into a multi-input architecture, where different peptide representations were processed separately before being combined to generate the final prediction, as illustrated in Fig. 4. Based on the best-performing classification models, a regression model was subsequently trained to predict continuous logP values, leveraging the optimal input representation and network configuration identified in the classification task.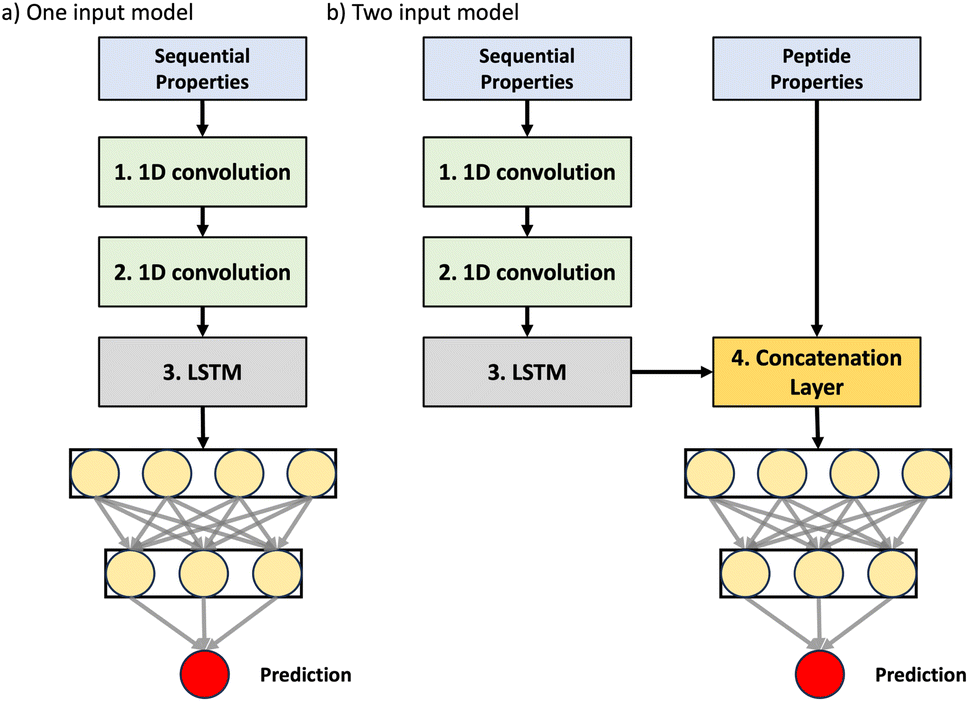 | ||
| Fig. 4 Neural network model architectures employed in the study: (a) single-input model using the Keras sequential API, processing amino acid properties. (b) Dual-input model using the Keras functional API, incorporating both amino acid properties and sequence-related inputs. This model features a concatenation layer to combine the processed inputs. | ||
A 3-times repeated 10-fold cross-validation for each model and their combinations was employed to gain insight into the affect of representation schemes on model performance (Table 2). A set of metrics has been used which includes accuracy (ACC), recall (REC), precision (PRE), F1 score, Matthew's correlation coefficient (MCC), area under the receiver operating characteristic curve (ROC-AUC), and geometric mean score (GM). A combined SP + PP format achieved the highest level of performance in six of seven metrics, very closely followed by the one that also adds the SMILES format to that combination but often has the same level of performance as the PP format. Although SP and PP individually performed equally in terms of accuracy (0.814), their combinations with SMILES revealed the robustness of SP because SP + SMILES maintained a high accuracy of 0.812 and PP + SMILES saw a drop in performance to 0.766. This demonstrates the complementary nature of the SP and PP approaches, while highlighting the limitation of SMILES-based encoding for CPs in this particular scenario. The decreased performance observed with the SP + PP + SMILES combination further suggests that the way SMILES was processed in our model may have limited its ability to contribute meaningful information. However, it is worth exploring whether models like Multi_CycGT,22 which achieve high accuracy with SMILES, could perform equally well without this representation. Multi_CycGT22 use of graph-based and transformer architectures likely compensates for the limitations of SMILES when used alone. Future studies could systematically evaluate the individual contributions of SMILES and alternative representations to determine their specific roles in enhancing predictive performance.
| Model | ACC | REC | PRE | F1 | MCC | ROC-AUC | GM |
|---|---|---|---|---|---|---|---|
| SP | 0.814 | 0.890 | 0.852 | 0.870 | 0.570 | 0.776 | 0.767 |
| PP | 0.814 | 0.887 | 0.853 | 0.870 | 0.569 | 0.777 | 0.769 |
| SMILES | 0.767 | 0.888 | 0.800 | 0.841 | 0.438 | 0.701 | 0.675 |
| SP + PP | 0.821 | 0.887 | 0.857 | 0.871 | 0.576 | 0.781 | 0.773 |
| SP + SMILES | 0.812 | 0.893 | 0.849 | 0.870 | 0.565 | 0.773 | 0.762 |
| PP + SMILES | 0.766 | 0.889 | 0.811 | 0.814 | 0.430 | 0.704 | 0.669 |
| SP + PP + SMILES | 0.816 | 0.890 | 0.852 | 0.871 | 0.570 | 0.776 | 0.767 |
The SP + PP model demonstrated the highest predictive performance, indicating that integrating both sequential and peptide properties provides the most informative input for classification. This combination achieved the highest accuracy (0.821) and remained robust despite the class imbalance (2![[thin space (1/6-em)]](https://www.rsc.org/images/entities/char_2009.gif) :1) present in the dataset. Moreover, its superior precision score (0.857) highlights its effectiveness in distinguishing high-permeability instances.
:1) present in the dataset. Moreover, its superior precision score (0.857) highlights its effectiveness in distinguishing high-permeability instances.
2.3 Impact of data augmentation on model performance
Peptides can be conceptualized as sequences of building blocks, which suggests a straightforward approach to data augmentation: the substitution of one amino acid for another within these sequences. However, this approach presents a double-edged sword: while it can exponentially increase the size of dataset, even minor mutations can significantly alter a peptide's behavior,33 potentially complicating classification tasks. For CPs, a unique and more conservative augmentation method is cyclic permutations. This technique rearranges the sequence without altering the molecule's structure, allowing for data expansion without introducing discrepancies from the original dataset. In our study, we evaluated data augmentation for sequential properties because a sequential representation requires the model to learn the interplay between amino acids, and the circular nature of CPs to make predictions. Hence, by augmenting sequences, we provide the classification model with more data that helps it better capture these patterns. To the best of our knowledge, data augmentation had not been previously explored for this type of representation. Furthermore, models based on PP would not benefit from cyclic permutations as the CP's properties remain the same regardless of the position from which a sequence is considered to start.Table 3 presents the results of augmentation strategies. Notably, the model trained on the original L6/7 set matched cyclic permutation augmented and outperformed mutation-augmented versions in all metrics, achieving an accuracy of 0.803. Cyclic permutations, despite increasing the dataset size sixfold, did not substantially change the performance (0.800 accuracy). The introduction of the mutations led to an increase of three orders of magnitude in the size of the training set, which was limited to 3 million sequences to keep it manageable in terms of memory usage and computational resources. Conservative mutations substantially decreased performance (0.773 accuracy), with an even more pronounced effect on distinguishing high-permeability instances, as evidenced by lower MCC (0.463) and ROC-AUC (0.723) scores compared to the original dataset (MCC = 0.571 and ROC-AUC = 0.779).
| Dataset | Training size | ACC | REC | PRE | F1 | MCC | ROC-AUC | GM |
|---|---|---|---|---|---|---|---|---|
| L6/7 | 3 × 10³ | 0.803 | 0.879 | 0.850 | 0.864 | 0.571 | 0.779 | 0.772 |
| L6/7+CycP | 1.9 × 10⁴ ± 0.1% | 0.800 | 0.879 | 0.852 | 0.865 | 0.575 | 0.781 | 0.774 |
| L6/7+CM | 3 × 10⁶ | 0.773 | 0.859 | 0.811 | 0.834 | 0.463 | 0.723 | 0.708 |
| L6/7+DM | 3 × 10⁶ | 0.760 | 0.865 | 0.793 | 0.827 | 0.423 | 0.699 | 0.675 |
| L6/7+MultCM | 1.4 × 10⁶ ± 8.3% | 0.719 | 0.674 | 0.712 | 0.542 | 0.326 | 0.634 | 0.598 |
| L6/7+MultDM | 1.9 × 10⁶ ± 8.3% | 0.671 | 0.691 | 0.699 | 0.524 | 0.267 | 0.633 | 0.628 |
Although designed to challenge the model, disruptive mutations introduced only a modest decrease in accuracy (0.760), but further degraded performance in all other metrics, illustrating their negative impact. To highlight the effect of mutations, a second experiment was conducted using MultCM and MultDM mutations which mutated at least three positions. This approach aimed to challenge the model by affecting a larger number of convolution patterns. The results obtained in this way reveal a substantial performance drop, particularly severe for disruptive mutations (MCC = 0.267 using a left-out fold composed of original sequences for validation as show in Table 3). This result indicates significantly reduced classification performance under this augmentation strategy, highlighting the challenge of generalizing to mutations that substantially alter the peptide's physicochemical properties.
These findings underscore the importance of carefully selected mutations and limited mutation positions to avoid negative impacts on model performance. They suggest that for CP permeability prediction, the quality and relevance of training data may be more crucial than the sheer quantity. Thus, UCMs were applied to the AllPep set for evaluation in two experiments to assess the effect of the quantity of mutated sequences in the dataset:
• Sequence replacement: each sequence in the training set was replaced by one of its mutants. Sequences without mutable amino acids were removed, and selected mutations from other sequences were randomly added to the training set until the original size of the training set was reached. This approach maintained the dataset size while introducing mutations.
• Dataset expansion: 150000 mutant sequences, from the ones available in the training set, were selected and added, increasing the size of the original dataset approximately 30-fold. This method allowed us to test the impact of a significantly larger, mutation-augmented dataset.
Since AllPep also includes head-to-side chain cyclization peptides, cyclic permutation cannot be performed directly over the peptide sequence. For these cases, the branching of the peptides was treated as individual amino acids. Their physicochemical properties were calculated using RDKit version 2020.09.1 and scaled with all other amino acids in the database (Fig. 5). Finally, the obtained sequences can be treated as if they were cyclized in Head-to-Tail fashion for cyclic permutation data augmentation purposes.
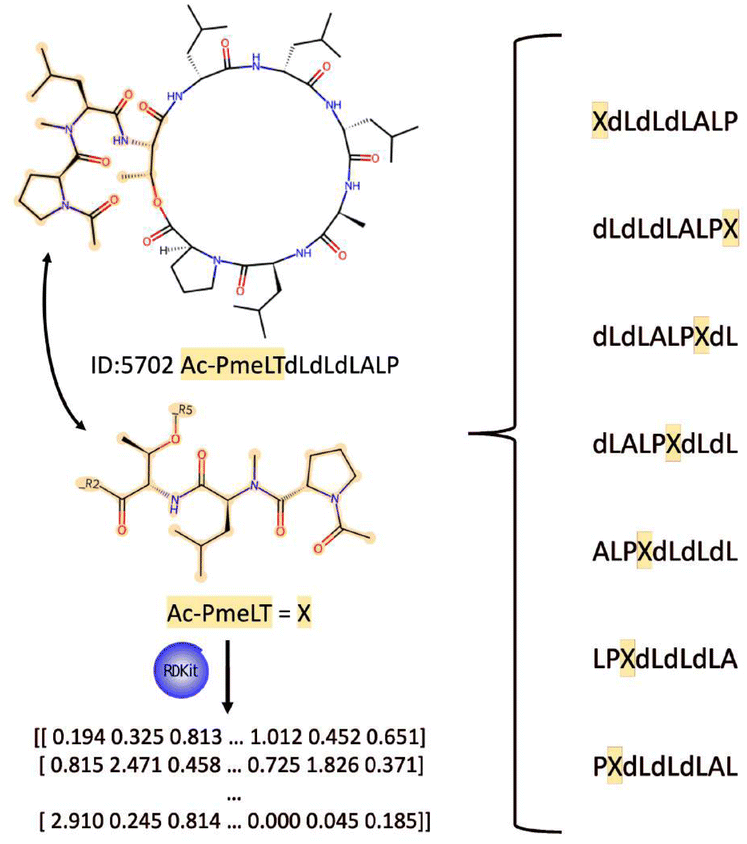 | ||
| Fig. 5 Schematic representation of how head-to-side chain cyclization is treated for cyclic permutation of the sequence. The CP example Ac-PmeLTdLdLdLALP (ID: 5702) is shown in its original structure (top). The Ac-PmeLT group (middle) is treated as a single amino acid ‘X’ for permutation purposes. The right side shows all possible cyclic permutations of the sequence, with ‘X’ representing the Head-to-Side chain cyclization point. The RDKit tool (version 2020.09.1) is used to calculate physicochemical properties for ‘X’, enabling its integration into the sequence for model input. | ||
Table 4 presents the classification model's performance on augmented AllPep datasets. In contrast to the L6/7 set experiments, cyclic permutation augmentation yielded a slight performance improvement, with accuracy increasing from 0.814 to 0.817. This modest enhancement was consistent across all metrics, indicating a slight impact of cyclic permutations on the AllPep dataset. Although mutation-based augmentation still underperformed in comparison with the original dataset, they did show improvement compared to previous experiments. The model trained on a mutation-augmented dataset that matched the original size achieved an accuracy of 0.806, while the expanded dataset (30 times larger) yielded an accuracy of 0.801. Although these scores are lower than the original dataset's performance, the gap is considerably narrower than in earlier mutation experiments. Other performance metrics followed a similar trend, suggesting that the UCM approach was more effective in preserving relevant peptide characteristics. This finding aligns with the known complexity of peptide-membrane interactions and highlights the challenges in creating synthetic data for this domain.
| Dataset | Training size | ACC | REC | PRE | F1 | MCC | ROC-AUC | GM |
|---|---|---|---|---|---|---|---|---|
| AllPep | 5.2 × 10³ | 0.814 | 0.890 | 0.852 | 0.870 | 0.570 | 0.776 | 0.767 |
| AllPep + CycP | 3.8 × 10⁴ ± 0.1% | 0.817 | 0.892 | 0.854 | 0.872 | 0.576 | 0.779 | 0.771 |
| AllPep(UCM) | 5.2 × 10³ | 0.806 | 0.881 | 0.848 | 0.864 | 0.570 | 0.777 | 0.769 |
| AllPep + UCM | 1.6 × 10⁶ | 0.801 | 0.870 | 0.829 | 0.848 | 0.494 | 0.738 | 0.725 |
2.4 Exploiting circularity in sequential properties
To better capture the cyclic structure of peptides, two variants of the model employing SP were explored. Conceptualizing peptide sequences as linear concatenations of amino acids fails to capture the inherent circularity of CPs, which lack a definitive start or end point. Consequently, each CP of length n can be represented by n distinct cyclic permutations. However, a potential issue emerges if different cyclic permutations of the same peptide are inconsistently classified into low and high permeability classes. This inconsistency would suggest that the neural network model fails to account for the circular nature of CPs. To address this, we implemented a mathematical approach to determine a unique and consistent peptide permutation to represent each CP sequence (see Methods). This unique permutation method assigns a value to each amino acid in the database, and the cyclic permutation yielding the smallest resultant metric is selected as the unique representation for the sequence. However, this approach may limit the neural network's ability to directly learn about the peptide's circularity, since it only encounters one representation of each sequence. In contrast, training the neural network with all-permutations method could potentially allow it to learn and recognize the cyclic structures more effectively, leading to a more robust model. To accommodate these two methods, different elements needed to be introduced to the neural network architecture:• CyclicConv: the first convolutional layer in SP was modified by implementing a CyclicConv layer.34 This approach adds the first amino acid to the end of the sequence and the last to the beginning, allowing the model to analyze patterns that represent the ring closure. Fig. 6a illustrates the difference between a standard convolution and the CyclicConv layer. The standard convolution misses the ring closure connection, whereas CyclicConv adds terminal amino acids to both ends, enabling analysis of the complete cyclic structure.
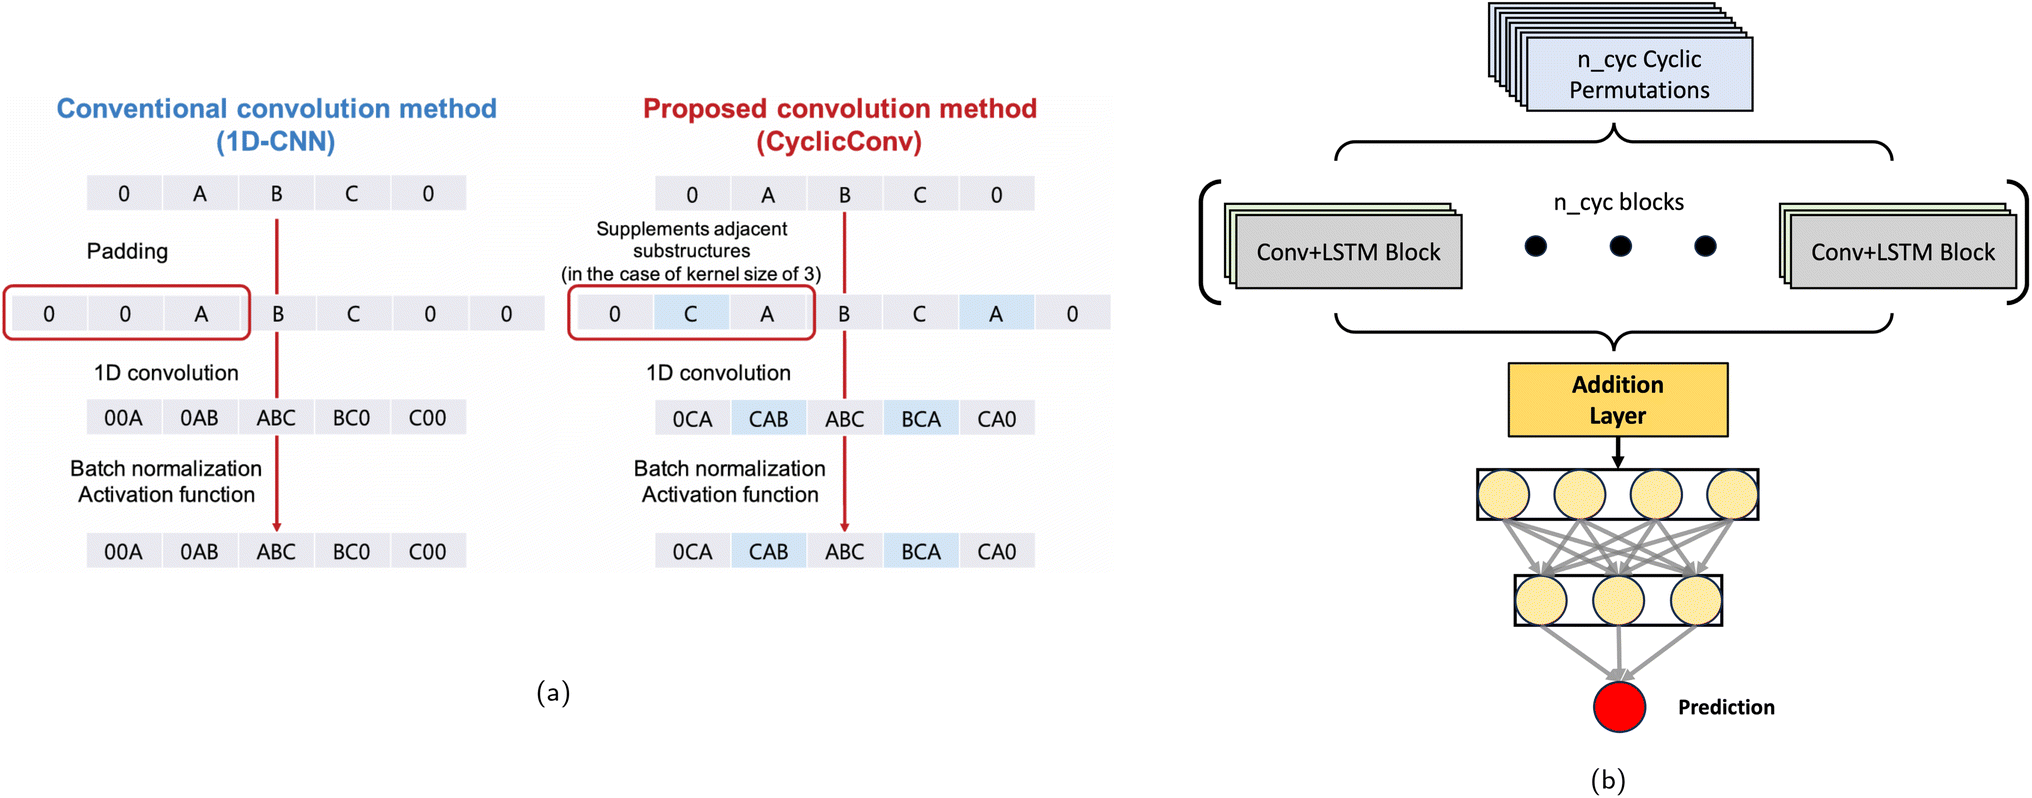 | ||
| Fig. 6 Comparative illustration of CyclicConv layer and Cyc_SP model architecture for CP analysis. (a) Comparison between the standard convolution method (1D-CNN) and the CyclicConv method for analyzing CPs. The standard convolution method (left) fails to capture the ring closure in CPs, as it treats sequences as linear. The CyclicConv method (right) addresses this limitation by appending terminal amino acids to both ends, allowing convolutional kernels to recognize the complete cyclic structure. This enhancement enables better feature extraction for cyclic sequences. Adapted from ref. 34. (b) Architecture of the Cyc_SP model, which explicitly accounts for cyclic permutations of peptide sequences. The model processes all possible cyclic permutations using parallel Convolution + LSTM blocks, capturing the cyclic nature of peptides. The outputs from these blocks are aggregated through an addition layer and passed to a feed-forward neural network for final classification. This approach ensures simultaneous consideration of all possible sequence arrangements, improving the representation of CPs in permeability prediction. | ||
• Cyc-SP: an augmented model that processes all possible cyclic permutations of each sequence has been developed as follows: (a) for each input sequence, all its cyclic permutations are generated (head-to-side chain sequences are treated as described in the previous section, fusing the linked amino acids). (b) For sequences of varying lengths, shorter peptides are padded to match the number of permutations of the longest peptide (n_cyc). (c) The model uses n_cyc parallel Convolution + LSTM blocks, one for each permutation, each block processes its respective permutation independently. (d) The outputs from all n_cyc blocks are combined using an addition layer. (e) This combined output is then passed to a feed-forward neural network for final classification. Fig. 6b shows the architecture of the Cyc_SP model, enabling simultaneous consideration of all possible arrangements in the CP sequence.
Comparative experiments were conducted to evaluate the impact of these two approaches, analyzing their performance in terms of accuracy, computational efficiency, and ability to generalize to new CP sequences (Table 5). Surprisingly, the CyclicConv implementation did not improve upon the original SP model, achieving identical accuracy (0.814) and nearly indistinguishable metrics. This suggests that CyclicConv strategy does not add new knowledge to the Neural Network. In contrast, the Cyc_SP model showed a slight performance increase, with accuracy rising to 0.821 and improvements across all other metrics. To further explore potential enhancements, peptide properties were concatenated to the Cyc_SP model (Cyc_SP + PP) in a third strategy. However, this combination yielded only marginal improvements over Cyc_SP alone, indicating that the model does not benefit from the addition of information from the whole sequence. These results suggest that while explicit modeling of cyclic permutations can provide some benefit, the impact is relatively modest. The original SP model appears to capture most of the relevant circular information without specialized architectural modifications.
| Dataset | Model | ACC | REC | PRE | F1 | MCC | ROC-AUC | GM |
|---|---|---|---|---|---|---|---|---|
| AllPep | SP | 0.814 | 0.890 | 0.852 | 0.870 | 0.570 | 0.776 | 0.767 |
| AllPep | SP(CycConv) | 0.814 | 0.879 | 0.852 | 0.865 | 0.556 | 0.772 | 0.763 |
| AllPep | Cyc_SP | 0.821 | 0.877 | 0.855 | 0.865 | 0.561 | 0.775 | 0.768 |
| AllPep | Cyc_SP + PP | 0.822 | 0.878 | 0.858 | 0.867 | 0.568 | 0.779 | 0.773 |
2.5 Extending permeability prediction: regression model, web deployment, and benchmarking
Building on the classification model developed for CP permeability prediction, an extension to regression was implemented to predict continuous logP values. This approach enables a more fine-grained assessment of permeability, complementing the binary classification framework. Using the same optimal input representation and network configuration, the regression model was trained on 5636 sequences, with 800 sequences each for validation and testing. The mean absolute error (MAE) was selected as the primary metric, as it directly quantifies the average prediction error in experimental logP values. The model achieved a MAE of 0.477, with MSE and R2 of 0.69 and 0.44, respectively, demonstrating robust predictive accuracy.This combined classification-regression framework was named CYCLOPS (CYCLOpeptide Permeability Simulator), representing a unified model capable of both binary permeability classification and continuous permeability prediction. By integrating these two predictive tasks, CYCLOPS offers a more comprehensive solution for CP permeability modeling, allowing both decision-making and ranking-based assessments.
To evaluate the predictive performance of CYCLOPS in the context of state-of-the-art CP permeability modeling, it was necessary to compare it against existing approaches in the literature. Among the models reviewed (Table 1), MuCoCP27 stands out as the only model that incorporated all four permeability assays from CycPeptMPDB (PAMPA, Caco-2, MDCK, and RRCK), using a logP threshold of −6—the same threshold adopted in this study. Given this alignment in dataset scope and classification criteria, MuCoCP provides the most relevant benchmark for assessing the strengths and limitations of CYCLOPS in both classification and regression tasks. Both models demonstrated strong predictive performance, with MuCoCP achieving a MSE of 0.71 and an R2 of 0.50, whereas CYCLOPS achieved a MSE of 0.69 and an R2 of 0.44. A detailed comparison is presented in Table 6.
| Model | Architecture | Peptide representation scheme (input features) | Evaluation | Regression | Classification | |||
|---|---|---|---|---|---|---|---|---|
| MSE | R 2 | ACC | F1 | MCC | ||||
| MuCoCP27 | Hybrid (transformer + GNN) | Molecular graph PP | Split type unknown 3 runs | 0.71 | 0.50 | 0.870 | 0.91 | 0.68 |
| CYCLOPS (proposed model) | Hybrid (LSTM + MLP) | SP + PP peptide properties | Stratified split 3 times repeat 10-fold cross-validation | 0.69 | 0.44 | 0.824 | 0.87 | 0.59 |
Despite this methodological alignment, key differences exist between the datasets used in both studies. In CYCLOPS, peptides with multiple permeability measurements across different assays were excluded to eliminate inconsistencies in class assignment, whereas MuCoCP retained these entries. While this affected only 3% of AllPep and 2% of L6/7, it introduces subtle but important variations in dataset composition that may impact performance comparisons. Additionally, CYCLOPS and MuCoCP differ in their evaluation methodologies. This study employed a stratified 3-times repeated 10-fold cross-validation (30 runs in total) to ensure robust and unbiased model assessment, whereas MuCoCP reported performance averaged over only 3 runs, with an unspecified data split strategy. The lack of details on the dataset partitioning in MuCoCP introduces potential variability in class distributions, which may further influence the reported metrics. Although MuCoCP achieved a slightly higher R2, the CYCLOPS model demonstrated a lower MSE, indicating improved precision in permeability predictions. Another major distinction between both models is computational efficiency. MuCoCP integrates transformers and GNNs, requiring pre-training and fine-tuning with a custom loss function, whereas CYCLOPS is based on a simpler LSTM-MLP architecture, trained in a single stage without the need for additional pre-training or complex fine-tuning strategies. This difference translates into faster training and inference times, making CYCLOPS a more accessible and resource-efficient alternative for CP permeability prediction.
To enhance the accessibility and practical utility of the developed predictive model for CP membrane permeability, a web-based tool named CYCLOPS: CYCLOpeptide Permeability Simulator (available at http://cyclopep.com/cyclops), was developed. For this purpose, the optimized SP + PP architecture, which outperformed other configurations, was trained on 5636 sequences, while 800 sequences each were reserved for validation and testing. Both the classification and regression models were integrated into the web tool to provide complementary predictive capabilities. Users can expect an accuracy of 0.824 for classification and a mean absolute error (MAE) of 0.477 for regression. MAE was selected as the primary metric for regression, as it directly quantifies the average prediction error in experimental logP values, providing a practical and interpretable assessment of model performance. Additionally, MSE (0.69) and R2 (0.44) are also reported for regression, while classification performance is assessed using F1-score (0.87), ROC-AUC (0.79), and MCC (0.59).
The classification output provides not only a binary prediction but also the probability of a sequence belonging to the predicted class, offering additional confidence in the results. For regression, MAE is also presented as an estimate of prediction uncertainty, helping users assess the reliability of logP predictions.
To ensure broad usability, the web interface was designed for intuitive sequence input and result interpretation. Users can either manually input CP sequences or upload batch files for simultaneous predictions. The output includes the predicted membrane permeability, confidence scores, and relevant evaluation metrics in a user-friendly format.
3 Conclusions
This study examined approaches for predicting CP membrane permeability, a key factor in drug development. The primary focus was on classification models, which aimed to distinguish between high- and low-permeability peptides based on a logP threshold of −6. To optimize predictive accuracy, we investigated various representation schemes, data augmentation strategies, and neural network architectures, leveraging the cyclic nature of CPs. The initial comparison of models revealed that both SP and PP outperformed the SMILES-based approach. This finding may suggest that physicochemical properties, either at the individual amino acid level (SP) or at the level of a whole sequence (PP), are more informative for the permeability prediction in comparison to the chemical structure provided by SMILES. Moreover, the synergy of SP + PP model yielded the best performance across all metrics comparable to the state-of-the-art models, indicating that both SP (amino acid level) and PP (whole sequence) contribute to membrane permeability prediction. The superior performance of SP + PP underscores its robustness in distinguishing high- and low-permeability peptides. The consistent underperformance of SMILES-based models, even when combined with other approaches, suggests that this representation may introduce noise rather than valuable information in this specific prediction task. These results highlight the importance of choosing appropriate molecular representations for different prediction tasks in computational drug design.Cyclic permutations in the AllPep dataset showed a slight improvement in model performance, suggesting that data augmentation can be effective when applied to larger and more diverse datasets. Despite a modest improvement, this may indicate that the model better understands the cyclic structure of peptides, offering potential benefits for modeling peptide-membrane interactions. Similarly, the UCM approach showed a marked improvement over previous mutation strategies, as evidenced in Table 4, where it achieved a higher MCC compared to disruptive mutation strategies (e.g., MCC = 0.570 for UCM vs. MCC = 0.267 for multiple disruptive mutations). This indicates that carefully chosen mutations that preserve essential physicochemical properties can mitigate some adverse effects associated with synthetic data generation. In contrast, in the smaller L6/7 dataset, neither cyclic permutations nor amino acid mutations enhanced the model performance. Mutations, especially disruptive ones, decreased performance, underscoring the delicate balance of physicochemical properties required for accurate peptide permeability modeling. Even conservative mutations led to reduced performance, highlighting the challenges of using synthetic data to accurately simulate peptide behaviour in this domain. This aligns with the known complexity of peptide-membrane interactions and emphasizes the limitations of certain augmentation methods for smaller datasets.
Architectural modifications aimed at explicitly modeling CPs yielded mixed results. The Cyc_SP model, which processes all possible cyclic permutations of the peptide sequence, achieved a modest performance increase, suggesting some benefit in considering all circular arrangements. This improvement indicates that explicit treatment of cyclic patterns can aid in capturing relevant features of CPs. However, the CyclicConv layer, designed specifically to capture ring closure patterns, did not surpass the original SP model. This result suggests that standard convolutional layers may already capture the essential cyclic information. The relatively small gain in Cyc_SP performance further implies that the original SP model is effective at extracting the critical features of CPs without additional architectural adjustments. Moreover, the comparable performance of the LSTM-based SP model and more complex architectures such as Multi_CycGT22 suggests that the primary limitation in predictive accuracy lies in the quality and diversity of the dataset. Although data augmentation strategies significantly expanded the size of the training set, the augmented examples may not have introduced sufficient novel biophysical or structural information to further enhance performance. This finding underscores the importance of addressing data quality issues, such as increasing the diversity of peptide structures and reducing experimental noise, to achieve meaningful improvements. While Multi_CycGT22 represents a highly sophisticated approach, it also involves increased computational demands and a higher risk of overfitting. In contrast, the LSTM-based model achieves similar accuracy with greater simplicity, providing a robust and accessible option for researchers working with limited computational resources.
Beyond classification, this study also explored regression modeling for CP permeability prediction. Using the same SP + PP input representation, a regression model was trained to predict continuous logP values, providing a complementary perspective to the binary classification approach. The regression model achieved a MAE of 0.477, with MSE and R2 values of 0.69 and 0.44, demonstrating robust predictive performance. This unified classification-regression framework, named CYCLOPS (CYCLOpeptide permeability simulator), not only provides both categorical and continuous permeability predictions but also enhances result interpretability, allowing researchers to classify permeability while ranking peptides based on their predicted logP values. Beyond these theoretical and methodological advancements, CYCLOPS has been developed into a user-friendly web-based tool (available at http://cyclopep.com/cyclops), integrating the best-performing predictive model (SP + PP).
Overall, this study presents several key findings that contribute to future research on CP permeability prediction. By systematically evaluating molecular representations, data augmentation techniques, and neural network architectures, we provide practical insights for model development and highlight the importance of dataset quality in determining predictive performance. The development of CYCLOPS as an integrated classification-regression model and web-based tool offers a valuable resource for researchers in computational peptide design, potentially accelerating the discovery of new and effective CP drugs.
4 Methods
4.1 Datasets
For this study, the CycPeptMPDB database (CycPeptMPDB)21 was used. The CycPeptMPDB main page allows for peptide search within the database based on different categories like “Publication Year of Source”, “Permeability”, “Assay type” and so on. It should be noted that membrane permeability in CycPeptMPDB is expressed as a log-scaled value, logPexp. Among the different options, the “combination” category allows to join multiple search options for more specific peptide scouting. By using the category “Monomer Length” with the query “%3e0”, the data corresponding to all the available peptides under these restrains were downloaded. This dataset, from now on AllPep, contains 7451 sequences with lengths from 2 to 15 amino acids and it was used to evaluate the performance of the different models employed along this work. A second dataset, named L6/7, was directly gathered from the DB by using the “combination” category with the following query: “shape:Circle, length: %3e5, length: %3c8”. This query extracts peptides of 6 or 7 amino acids cyclized in a head-to-tail configuration. The L6/7 dataset was selected due to the prevalence of peptides of this length in the database. While most cyclopeptide-based applications involve longer sequences, this subset allows for a focused evaluation of model performance while maintaining a balance between structural complexity and practical applicability. The resulting subset of AllPep contains 4205 sequences, which constitutes 56% of the available data. Dataset L6/7 was used to fine-tune the model prior to the final evaluation. In CycPeptMPDB, sequences can be classified by the permeability assay reported in the literature, including experimental permeability measurements from four different assays: PAMPA, Caco-2, MDCK, and RRCK. In cases where multiple measurements were reported for the same sequence, duplicate entries were removed to ensure consistency. No specific assay was prioritized when constructing the datasets. In the AllPep dataset, 215 sequences exhibit repeated entries while L6/7 presents 91 cases, accounting for 3% and 2% of the total instances, respectively. Therefore, the final AllPep dataset contains 7236 sequences, while L6/7 has 4114 entries, evenly distributed among both peptide length groups. Sequences were categorized as high-permeability or low-permeability instances according to the criteria established by the database developers.21 Peptides with a membrane permeability below −6 were classified as having low-permeability, while those with a membrane permeability greater than −6 were designated as high-permeability. After preprocessing, the AllPep dataset contained 4984 high-permeability and 2283 low-permeability entries, whereas the L6/7 dataset comprised 2766 high-permeability and 1348 low-permeability CPs. Complementing the peptide data, amino acid information was obtained from the CycPeptMPDB database using the Monomer option in the drop-down menu. This supplementary dataset includes 312 different amino acid residues: 225 analogs of the 20 natural amino acids and 67 of purely synthetic origin. For each amino acid, 208 physicochemical properties were computed using the RDKit package (version 2020.09.1). The aforementioned data was obtained on June 20, 2023, from version 1.1 of CycPeptMPDB.4.2 Cyclic permutations and unique permutation
CPs, due to their lack of a definitive start or end point, require special considerations in computational modeling. Each CP of length n can be represented by n distinct cyclic permutations.In this study, all possible cyclic permutations of the sequences were computed to ensure that the neural network could consider every potential arrangement of the peptide sequence. This method was designed to preserve the cyclic characteristics of the peptides during model training and evaluation. To balance computational complexity and model performance, a mathematical approach was implemented to determine a unique representation for each sequence. This approach involved assigning each amino acid in the database a specific value and calculating the unique permutation by multiplying the value associated with each amino acid by the exponential of its positional index within the sequence. The cyclic permutation yielding the smallest resultant metric was selected as the unique representation for the sequence. While this approach reduces the computational load by minimizing the number of inputs, it may limit the ability of the neural network to fully capture the circularity of the peptide because it only “sees” one representation of each sequence. Therefore, the unique permutation approach was evaluated alongside the all-permutations method.
Models trained using both the unique permutation method and the all-permutations method were analyzed in terms of accuracy, computational efficiency, and their ability to generalize to new CP sequences. These experiments aimed to assess whether the use of all possible permutations could enhance the model's ability to understand and predict CP membrane permeability compared to using a single unique permutation. In practice, for each peptide sequence, all possible cyclic permutations were generated, treating the CP as a linear sequence where the first and last amino acids are connected. In this way, shifting the letters cyclically, where the last amino acid moves to the beginning of the sequence, generates equivalent representations of the same circular sequence. This approach enabled the network to learn patterns that represent the ring closure. To reduce computational complexity, a unique representation was determined by calculating the smallest resultant metric from all possible cyclic permutations, as described above. This method was compared to the all-permutations approach, where the network was trained with every possible permutation of each sequence. Both approaches were evaluated based on accuracy, computational efficiency, and generalization to new CP sequences. These metrics were used to compare the effectiveness of the unique permutation method against the all-permutations method. For peptides with head-to-side chain cyclization, the branching structure introduced by the cyclization point was treated as part of the main sequence. Its physicochemical properties were aggregated and incorporated into the sequence representation. This adjustment allowed the cyclic permutation process to be applied uniformly, ensuring that the structural diversity of all peptides was represented accurately.
4.3 Aminoacid mutations
Conservative mutations, in which an amino acid is replaced by another with similar biochemical properties, offer an interesting data augmentation opportunity for protein-based datasets. However, defining these mutations for the CycPeptMPDB database represents a challenge due to the significant number of registered amino acids with intricate synthetic structures that differ from natural amino acids. To address this, the proposed conservative mutations were based on a property crucial for peptide permeability: logP of individual amino acids. With logP values ranging from −1.4709 to 4.2798, we defined a conservative mutation as one with a logP variation between the original and the new amino acid of less than 0.2, representing less than 5% of the total range. Candidates meeting this criterion were further analyzed manually for structural similarity to the original amino acid. To manage the scope of mutations, we focused on the three most frequent natural amino acids in the L6/7 dataset: L-leucine, L-phenylalanine, and L-proline. Table 7 presents the amino acids selected for mutation within the established criteria.| Amino acid | Mutation |
|---|---|
| L | Mono96, I, Mono95, dL, Mono99, dI, Nle, Mono93, Mono94, Mono98, Tle, Mono92, Mono97 |
| F | Ser(Bn), dPhe(4-F), Tyr(Me), meY, Phg, Mono39, dF, Me_dY, Bn(4-OH)_Gly, meM, Mono75, Phe(4-NO2) |
| P | dP |
To further investigate the impact of mutations on CP classification, a set of “non-conservative mutations” was generated. Unlike conservative mutations, these were designed to challenge the model and potentially reduce classification performance, thus demonstrating the importance of careful mutation selection in data augmentation. Similar criteria based on logP values were used to define these mutations. Amino acids with logP values differing from the original by 1.1 to 1.2 units were initially selected. The candidate list was then refined to match the number of conservative mutations, prioritizing natural amino acid analogs over synthetic ones. Table 8 presents the final set of these mutations.
| Amino acid | Mutation |
|---|---|
| L | meW, Me_dW, Me_Ala(indol-2-yl), Lys(Cbz), Bn(4-Cl)_Gly, Mono12, Mono106, Mono9, Me_Phe(3-Cl), Mono10, Me_Phe(4-Cl), Mono31 |
| F | Mono48, Phe(4-CF3), Hph(2-Cl), Hph(4-Cl), Hph(3-Cl), Me_Cha, Mono43, Mono78 |
| P | Hph |
For the AllPep dataset, an expanded ultraconservative mutation group, extending beyond the previously used L, F and P residues, was generated. This expansion reflects the larger size of the dataset and its greater amino acid variety. Candidates appearing in at least 500 sequences were included as potential targets. Only analogs with logP values identical to the original residue were considered as possible mutations. To ensure that each amino acid had a unique set of possible mutations, elements from the mutable list with its potential mutations overlapped with those of another already in the list were excluded. This step prevented the presence of duplicate sequences in the augmented dataset. The final set of amino acids for UCMs comprised L-leucine, L-phenylalanine, L-proline, β-Homophenylalanine (bHph), L-alanine, N-methyl-L-alanine (meA), and N-propyl-L-glycine (Pr Gly). Table 9 illustrates the possible mutations for these amino acids. The labels for augmented peptides were directly inherited from their parent sequences. For binary classification tasks, the high or low permeability label was retained based on the original experimental logP threshold of −6. For regression tasks, the continuous logP value assigned to the parent peptide was uniformly applied to all augmented variants. This approach ensured consistency between the original and augmented datasets, maintaining the integrity of the data during model training and evaluation.
| Amino acid | Mutation |
|---|---|
| L | I, dL, Di, Tle |
| F | Bn(4-OH)_Gly, Tyr(Me), dF |
| P | dP |
| bHph | Hph |
| A | dA, dAsp(pyrrol-1-yl), Bal |
| meA | Me_dA, Me_Bal, Et_Gly |
| Pr_Gly | M, Me_dAbu, Me_Abu |
4.4 Machine learning model architecture
Two neural network models were developed based on the sequential properties representation scheme.31,35 The first model utilized a single input for sequential data, while the second incorporated two inputs: one for sequential data and another for whole peptide properties. Both models shared a common architecture consisting of two stacked 1D convolutional layers, followed by a Long Short-Term Memory (LSTM) layer,36 and three consecutive fully connected layers. The final layer configuration varied based on the task at hand. For the CP classification task, a single neuron with sigmoid activation was employed, whereas no activation function was used for the CP permeability regression task. Fig. 4, in Results section, provides a visual representation of the model architecture. To determine the optimal hyperparameter configuration, a Hyperband search37 using the Keras Tuner module was implemented. This approach enables efficient exploration of the hyperparameter space by adaptively allocating computational resources to promising configurations. The tuner systematically explored a range of values for various hyperparameters, including the sizes of the convolutional layers, LSTM layer, fully connected layers, as well as the learning rate.Specifically, the first convolutional layer size ranged from 32 to 256 in increments of 32, resulting in 8 possible values (32, 64, 96, 128, 160, 192, 224, 256). The second convolutional layer size varied from 16 to 144 with a step of 16, providing 9 options (16, 32, 48, 64, 80, 96, 112, 128, 144). For the LSTM layer, 4 sizes were considered: 64, 128, 192, and 256. The size of the first fully connected layer ranged from 16 to 208 in increments of 16, offering 13 possibilities (16, 32, 48, …, 176, 192, 208). The second fully connected layer had a range from 4 to 132 with a step of 16, resulting in 9 options (4, 20, 36, …, 100, 116, 132). The learning rates explored were six logarithmically distributed values: 1.0, 0.1, 0.01, 10−3, 10−4 and 10−5. This comprehensive search strategy allowed for a thorough evaluation of the model's performance across a wide range of architectural configurations.
The tuning process involved training the models using the training set and evaluating their performance based on the accuracy achieved on an independent validation set, which was 20% the size of the training set. The tuning was conducted in multiple rounds, with increasing maximum epochs: 3 epochs in the first round, 9 in the second, 27 in the third, and 80 in the final round. A batch size of 32 was used consistently. To prevent overfitting, an early stopping mechanism was implemented, pausing the training if the validation loss did not decrease for five consecutive epochs.
Following hyperparameter optimization, the top-performing model underwent final training. This phase allowed for a maximum of 2000 epochs, maintaining the batch size of 32. An early stopping mechanism was again employed, with the patience parameter determining the number of epochs without improvement before halting the training process. This comprehensive approach to model development and hyperparameter tuning aimed to create robust and efficient neural networks for the analysis of CPs. The regression task employed the same neural network architecture as described for classification, with a linear output neuron for predicting continuous permeability values (logP). The model's performance was evaluated using multiple metrics, including mean absolute error (MAE), root mean square error (RMSE), and R2 (coefficient of determination), ensuring a robust assessment of predictive accuracy. Stratified 3-times repeated 10-fold cross-validation was used to validate the regression task, ensuring consistency and fairness in data splitting.
4.5 Evaluation metrics
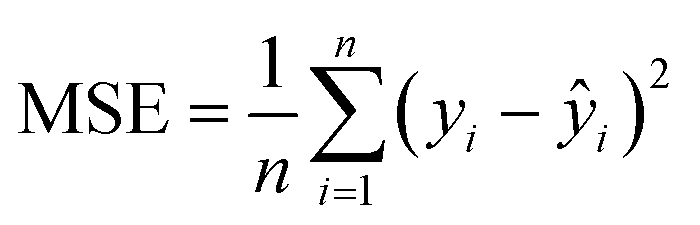
In the case of regression, the model's predictive performance was evaluated using mean absolute error, mean squared error, root mean squared error and the coefficient of determination. Mean absolute error (MAE) measures the average absolute difference between the actual value yi and the predicted value ŷi making it easy to interpret (closer to 0 is better):
Mean squared error (MSE) computes the average squared difference between the predicted and actual values. By squaring the differences, it penalizes larger errors more heavily highlighting the significant deviations in predictions. Unlike MAE, the error score computed by this metric are not on the original scale as it uses the squared error which makes it harder to interpret (closer to 0 is better):
Root mean squared error (RMSE) is computed by computing a square root of MSE making it easier to interpret while still penalizing larger errors more (closer to 0 is better):

Coefficient of determination (R2) quantifies the proportion of variance in the actual values that is explained by the model. The value of 1 indicates a perfect prediction and the metric is not bounded on the lower end, but usually is expected to be higher than 0. Values less than 0 indicate that model performs worse than a trivial model which would always output the mean of the actual values ȳ:

In the case of binary classification, the final output neuron of the model uses the sigmoid function to predict a probability that a given peptide has high permeability. If the predicted value is above the decision threshold of 0.5, it is considered that the peptide has high permeability (positive class); otherwise, it is considered that the peptide has low permeability (negative class). The performance of the model was evaluated using precision, recall, accuracy, F1 score, geometric mean score, Matthews correlation coefficient, and ROC-AUC. Precision (PRE) computes the proportion of correctly predicted positive instances out of all instances that were predicted to be positive:

where TN is the number of true negatives. Recall also ranges from 0 to 1 and higher values are better. Accuracy (ACC) represents the proportion of correctly classified instances relative to the total number of instances:

where TN is the number of true negatives. Accuracy ranges from 0 to 1, where 1 indicates that all instances were correctly classified. However, accuracy is not a reliable metric for datasets with imbalanced classes, as a model predicting the majority class correctly most of the time can have high accuracy but still perform poorly on the minority class. F1 score (F1) is a harmonic mean of precision and recall. It is better suited for imbalanced datasets compared to accuracy, as it considers both precision and recall, but it also assumes that it is more important to correctly identify positive instances as it does not include true negatives in the calculation:

F1 scores range from 0 to 1, where 1 indicates perfect precision and recall. Unlike F1 score, geometric mean score (GM) assumes that the ability to correctly classify positive and negative instances is equally important. It is computed as the geometric mean of recall (REC; previously explained) and specificity (SPE), which measures a model's ability to correctly identify negative instances:


The geometric mean score ranges from 0 to 1, where higher value indicates a better ability to identify the members of a positive and negative classes. Matthews correlation coefficient (MCC) considers all four cases that can happen in a binary classification setting (TP, TN, FP, and FN), making it the most informative for imbalanced datasets out of all previously described metrics. Furthermore, it ranges from −1 to 1, where 1 indicates perfect classification, 0 indicates random guessing, and −1 indicates that all instances were wrongly classified:

Previously described metrics for binary classification were dependent on the chosen decision threshold. Even though the value of 0.5 is usually used as a decision threshold, it may not necessarily be the optimal one. Hence, ROC-AUC (Receiver operating characteristic – area under curve) is used as it measures the ability of the model to distinguish between two classes across various threshold values. The ROC curve is obtained by increasing the decision threshold from 0 to 1 and plotting the recall against the 1-specificity at each threshold. A higher AUC (closer to 1) indicates a better ability to distinguish between positive and negative classes, while a value of 0.5 suggests that the model is no better than random guessing.
4.6 Web-based tool integration
To enhance the accessibility and practical utility of the developed predictive model for CP membrane permeability, a web-based tool named CYCLOPS: CYCLOpeptide permeability simulator (available at http://cyclopep.com/cyclops).For this purpose, the model configuration that yielded the best performance—using SP and PP as input features—was trained on 5636 sequences, with validation and test sets consisting of 800 sequences each. In addition to classification, the model was also extended to a regression task. Users can expect an accuracy of 0.824 for classification and a mean absolute error of 0.477 for the membrane permeability prediction. MAE was selected as the primary metric for regression as it directly quantifies the average prediction error in experimental logP values, providing a practical and interpretable assessment of model performance. To further evaluate model performance, MSE (0.69) and R2 (0.44) are also reported for regression, while classification is assessed using F1-score (0.87), ROC-AUC (0.79), and MCC (0.59). The classification output includes the probability of a sequence belonging to the predicted class, offering additional confidence in the prediction. For regression, MAE is also presented as an estimate of the standard deviation of logP predictions, providing an indication of prediction uncertainty. While classification simplifies the task into a binary outcome for practical decision-making, regression offers a continuous spectrum of logP values. Any apparent discrepancies between the two approaches typically occur for peptides with predicted logP values close to the classification threshold (−6), where small variations can lead to differences in class assignment.
Key features of the web server include an intuitive user interface in which users can input peptide sequences, an efficient back-end infrastructure that uses cloud computing resources, and stringent data privacy measures to protect sensitive information. The output is displayed in a clear and interpretable format, providing not only the predicted permeability but also a confidence score and relevant metrics. This resource is intended to expedite the design and optimization of CP-based drugs, particularly in the early phases of drug design, where rapid screening of extensive peptide libraries can identify potential candidates for the development of effective therapies for challenging intracellular targets.
Data availability
The datasets used in this study are publicly available and were obtained from the CycPeptMP database at http://cycpeptmpdb.com/. The web server in its version 1.1 was accessed on June 20, 2023. Specifically: (i) the AllPep dataset, consisting of 7236 sequences ranging from 2 to 15 amino acids, was used to evaluate model performance across a broad spectrum of cyclic peptides; (ii) the L6/7 dataset, comprising 4114 head-to-tail cyclized peptides of 6 or 7 amino acids, was used to refine the model and analyze the impact of class imbalance. The processed data, including augmented datasets, model predictions, and the trained machine learning models, have been deposited in a publicly accessible GitHub repository and can be found at the following URL: https://github.com/alfonsocv24/CycPeptMPDB_ML.git. The corresponding DOI is the following: 10.5281/zenodo.15020315. This repository includes: (i) augmented datasets used in the study; (ii) scripts for data preprocessing and model training; (iii) trained machine learning models. Additionally, the CYCLOPS (CYCLOpeptide permeability simulator) application, which integrates the best-performing predictive model developed in this study, is freely accessible at http://cyclopep.com/cyclops. This tool allows researchers to perform rapid predictions of cyclic peptide membrane permeability and includes an intuitive interface for analyzing custom peptide sequences. For further inquiries or clarifications, please contact the corresponding author.Author contributions
Conceptualization: AC, AP, DK, EO, GM, RGF. Data Curation: AC. Funding acquisition: AP, DK, GM, RGF. Investigation: AC, EO. Methodology: AC, EO. Software: AC, EO. Supervision: AP, DK, GM, RGF. Validation: AC, EO. Visualization: AC. Writing – original draft: AC, AP, RGF. Writing – review & editing: AC, AP, DK, EO, GM, RGF.Conflicts of interest
There are no conflicts to declare.Acknowledgements
This work was supported by the Croatian Science Foundation [grant numbers UIP-2019-04-7999 (D. K.) and DOK-2020-01-4659 (G. M.)]; the University of Rijeka [grant numbers UNIRI-23-78 (G. M.), UNIRI-INOVA-3-23-1 (G. M.), UNIRI-23-16 (D. K.), UNIRI-INOVA-3-23-2 (D. K.)]; by the Spanish Agencia Estatal de Investigación (AEI) and the ERDF [PDC2022-133402-I00 (R. GF.), PID2022-141534OB-I00 (R. GF.) and CNS2023-144353 (R. GF.)]; by Xunta de Galicia [proceedings ED431C 2021/21 (R.GF.), ED481A 2023/1 (A. C.) and Centro de investigación do Sistema universitario de Galicia accreditation 2023–2027, ED431G 2023/03 (CiQUS)]; and the European Union [European Regional Development Fund – ERDF]. This publication is based upon work from COST Action CA23111 – SNOOPY, supported by COST (European Cooperation in Science and Technology). All calculations were carried out at the Centro de Supercomputación de Galicia (CESGA).References
- A. J. Pereira, L. J. de Campos, H. Xing and M. Conda-Sheridan, Med. Chem. Res., 2024, 33, 1275–1280 CrossRef CAS.
- J. Fetse, S. Kandel, U.-F. Mamani and K. Cheng, Trends Pharmacol. Sci., 2023, 44, 425–441 CrossRef CAS PubMed.
- L. Wang, N. Wang, W. Zhang, X. Cheng, Z. Yan, G. Shao, X. Wang, R. Wang and C. Fu, Signal Transduction Targeted Ther., 2022, 7, 48 CrossRef CAS PubMed.
- G. Rossino, E. Marchese, G. Galli, F. Verde, M. Finizio, M. Serra, P. Linciano and S. Collina, Molecules, 2023, 28, 7165 CrossRef CAS PubMed.
- G. S. Dijksteel, M. M. Ulrich, E. Middelkoop and B. K. Boekema, Front. Microbiol., 2021, 12, 616979 CrossRef PubMed.
- Z. Lyu, P. Yang, J. Lei and J. Zhao, Antibiotics, 2023, 12, 1037 CrossRef CAS PubMed.
- T. Abraham, E. J. Prenner, R. N. A. H. Lewis, C. T. Mant, S. Keller, R. S. Hodges and R. N. McElhaney, Biochim. Biophys. Acta, Biomembr., 2014, 1838, 1420–1429 CrossRef CAS PubMed.
- S. Lai, Q. Zhang and L. Jin, Antibiotics, 2022, 12, 42 CrossRef PubMed.
- A. A. Vinogradov, Y. Yin and H. Suga, J. Am. Chem. Soc., 2019, 141, 4167–4181 CrossRef CAS PubMed.
- Y. Han, M. Zhang, R. Lai and Z. Zhang, Peptides, 2021, 146, 170666 CrossRef CAS PubMed.
- S. E. Park, M. I. Sajid, K. Parang and R. K. Tiwari, Mol. Pharm., 2019, 16, 3727–3743 CrossRef CAS PubMed.
- X. Ji, A. L. Nielsen and C. Heinis, Angew. Chem., Int. Ed., 2024, 63, e202308251 CrossRef CAS PubMed.
- C. D. Fjell, J. A. Hiss, R. E. Hancock and G. Schneider, Nat. Rev. Drug Discovery, 2012, 11, 37–51 CrossRef CAS PubMed.
- C. A. Lipinski, F. Lombardo, B. W. Dominy and P. J. Feeney, Adv. Drug Delivery Rev., 2001, 46, 3–26 CrossRef CAS PubMed.
- E. Milanetti, D. Raimondo and A. Tramontano, Bioinformatics, 2016, 32, 1163–1169 CrossRef CAS PubMed.
- B. J. Bennion, N. A. Be, M. W. McNerney, V. Lao, E. M. Carlson, C. A. Valdez, M. A. Malfatti, H. A. Enright, T. H. Nguyen, F. C. Lightstone and T. S. Carpenter, J. Phys. Chem. B, 2017, 121, 5228–5237 CrossRef CAS PubMed.
- E. C. L. de Oliveira, K. Santana, L. Josino, A. H. L. e Lima and C. de Souza de Sales Júnior, Sci. Rep., 2021, 11, 7628 CrossRef CAS PubMed.
- X. Liu, K. Zhang and M. H. Abraham, Eur. J. Pharm. Sci., 2018, 123, 524–530 CrossRef CAS PubMed.
- Y. Wang and X. Chen, RSC Adv., 2020, 10, 42938–42952 RSC.
- R. Gozalbes, M. Jacewicz, R. Annand, K. Tsaioun and A. Pineda-Lucena, Bioorg. Med. Chem., 2011, 19, 2615–2624 CrossRef CAS PubMed.
- J. Li, K. Yanagisawa, M. Sugita, T. Fujie, M. Ohue and Y. Akiyama, J. Chem. Inf. Model., 2023, 63, 2240–2250 CrossRef CAS PubMed.
- L. Cao, Z. Xu, T. Shang, C. Zhang, X. Wu, Y. Wu, S. Zhai, Z. Zhan and H. Duan, J. Med. Chem., 2024, 67, 1888–1899 CrossRef CAS PubMed.
- A. L. Feller and C. O. Wilke, J. Chem. Inf. Model., 2025, 65, 571–579 CrossRef CAS PubMed.
- J. Li, K. Yanagisawa and Y. Akiyama, Briefings Bioinf., 2024, 25, 417 CrossRef PubMed.
- X. Tan, Q. Liu, Y. Fang, Y. Zhu, F. Chen, W. Zeng, D. Ouyang and J. Dong, Mol. Pharm., 2024, 21, 4116–4127 CrossRef CAS PubMed.
- Z. Wang, Y. Chen, X. Ye and T. Sakurai, 2024 International Joint Conference on Neural Networks (IJCNN), 2024, pp. 1–8 Search PubMed.
- Y. Yu, M. Gu, H. Guo, Y. Deng, D. Chen, J. Wang, C. Wang, X. Liu, W. Yan and J. Huang, Bioinformatics, 2024, 40, btae473 CrossRef CAS PubMed.
- X.-G. Chen, W. Zhang, X. Yang, C. Li and H. Chen, Front. Genet., 2021, 12, 698477 CrossRef CAS PubMed.
- B. Lee, M. K. Shin, I.-W. Hwang, J. Jung, Y. J. Shim, G. W. Kim, S. T. Kim, W. Jang and J.-S. Sung, Int. J. Mol. Sci., 2021, 22, 12291 CrossRef CAS PubMed.
- M. Negovetić, E. Otović, D. Kalafatovic and G. Mauša, Digital Discovery, 2024, 3, 1182–1193 RSC.
- E. Otović, M. Njirjak, D. Kalafatovic and G. Mauša, J. Chem. Inf. Model., 2022, 62, 2961–2972 CrossRef PubMed.
- T. Fawcett, Pattern Recognit. Lett., 2006, 27, 861–874 CrossRef.
- C. Pohl, M. Zalar, I. E. Bialy, S. Indrakumar, G. H. J. Peters, W. Friess, A. P. Golovanov, W. W. Streicher, A. Noergaard and P. Harris, Mol. Pharm., 2020, 17, 3298–3313 CrossRef CAS PubMed.
- J. Li, K. Yanagisawa, Y. Yoshikawa, M. Ohue and Y. Akiyama, Bioinformatics, 2022, 38, 1110–1117 CrossRef CAS PubMed.
- M. Njirjak, L. Žužić, M. Babić, P. Janković, E. Otović, D. Kalafatovic and G. Mauša, Nature Machine Intelligence, 2024, 6, 1487–1500 Search PubMed.
- A. Sherstinsky, Phys. D, 2020, 404, 132306 Search PubMed.
- L. Li, K. Jamieson, G. DeSalvo, A. Rostamizadeh and A. Talwalkar, J. Mach. Learn. Res., 2018, 18, 1–52 Search PubMed.
Footnote |
| † These authors contributed equally to this work. |
| This journal is © The Royal Society of Chemistry 2025 |