Selective C![[double bond, length as m-dash]](https://www.rsc.org/images/entities/h2_char_e001.gif) O hydrogenation of cinnamaldehyde over Ir-based catalysts and its comparison with C–O hydrogenolysis of polyols†
O hydrogenation of cinnamaldehyde over Ir-based catalysts and its comparison with C–O hydrogenolysis of polyols†
Received
23rd January 2025
, Accepted 20th February 2025
First published on 21st February 2025
Abstract
Ir-based bimetallic catalysts supported on rutile TiO2 with low surface area were applied to the selective hydrogenation of cinnamaldehyde to cinnamyl alcohol. Ir–FeOx/rutile (Ir: 3 wt%, Fe/Ir = 0.1 (molar basis)) was particularly effective. The Ir–FeOx/rutile catalyst could be applied to the selective hydrogenation of various unsaturated aldehydes (crotonaldehyde, furfural, 2-hexenal and citral) to unsaturated alcohols (≥95% selectivity, ≥81% yield). Since Ir-FeOx/rutile catalysts have also been reported to be effective in C–O hydrogenolysis of 1,2-diols to 2-monoalcohols, the structure-performance relationship was closely compared between hydrogenation and C–O hydrogenolysis. The optimum catalyst for hydrogenation had a lower Ir loading and a lower Fe/Ir ratio than that for C–O hydrogenolysis. In addition, high-temperature reduction of the catalyst decreased the activity in cinnamaldehyde hydrogenation, while the effect of reduction temperature was reported to be small in C–O hydrogenolysis. Characterization using transmission electron microscopy (TEM), CO adsorption, XPS and FT-IR suggested a similar structure for the optimized catalysts in the two reactions: Ir–Fe alloy and Fem+ species modifying the alloy surface. However, a higher Fem+/Fe0 ratio was observed for the optimized catalyst in cinnamaldehyde hydrogenation. From the kinetic studies (first-order with respect to H2 pressure and zero-order with respect to cinnamaldehyde concentration, similar to C–O hydrogenolysis), the nucleophilic attack of the hydride species on the adsorbed cinnamaldehyde was considered the rate-determining step. The Ir–Fe alloy imparted the hydride nature to the adsorbed hydrogen species, and the Fem+ modifier served as the adsorption site. In cinnamaldehyde hydrogenation, supplying adsorption sites for cinnamaldehyde was more effective.
1. Introduction
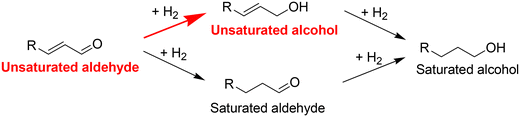
Selective hydrogenation of unsaturated aldehydes to unsaturated alcohols is an important reaction, as shown in Scheme 1, in organic synthesis and remains challenging since C![[double bond, length as m-dash]](https://www.rsc.org/images/entities/char_e001.gif) C bonds are more preferentially hydrogenated than CO bonds over conventional hydrogenation catalysts, such as Pd1,2 and Ni.3,4 Typically, unsaturated alcohols are synthesized with stoichiometric reagents, including NaBH4 and LiAlH4.5–7 These stoichiometric reagents have some disadvantages, such as high cost, difficult handling and low atom efficiency, though high product yields can be achieved. Various homogeneous and heterogeneous catalysts have been developed for selective hydrogenation with H2,8–12 and heterogeneous catalysts are superior from a practical view. As heterogeneous catalysts for the selective hydrogenation of unsaturated aldehydes, supported bimetallic catalysts composed of a noble metal (M) and a metal ion/oxide (M′Ox) have been an important class.10 The combination of Pt and Fem+ has been a typical one,13 and the main role of M′Ox has been regarded as the activation of the CO bond by adsorption of the oxygen atom of CO on the M′m+ site (Scheme 2).10,14 Therefore, the interface between M and M′Ox is the active site.15 Recently, Ir-based catalysts have been reported to be effective catalysts.16,17 Ir catalysts show relatively good selectivity even as monometallic ones,18–21 and the activity and selectivity can be significantly increased by the addition of M′Ox, such as ReOx,16 MoOx,22,23 and FeOx.18,24–36Table 1 summarizes the Ir-based bimetallic catalysts for the hydrogenation of unsaturated keto compounds. Ir-based bimetallic catalysts have also been reported for hydrogenation reactions of polar double bonds, such as nitro compounds,37 amides38 and carboxylic acids,39,40 One explanation for the increasing activity in Ir-based bimetallic catalysts is the formation of hydride-like activated hydrogen species at the interface of Ir and M′Ox.18,24 The hydride-like species readily attack the Cδ+Oδ− bond like stoichiometric hydride reagents such as NaBH4. The involvement of hydride-like species derived from the heterolytic dissociation of H2 in the hydrogenation of polar double bonds has also been proposed for Ag,41 Au42 and Ru43 catalysts.
C bonds are more preferentially hydrogenated than CO bonds over conventional hydrogenation catalysts, such as Pd1,2 and Ni.3,4 Typically, unsaturated alcohols are synthesized with stoichiometric reagents, including NaBH4 and LiAlH4.5–7 These stoichiometric reagents have some disadvantages, such as high cost, difficult handling and low atom efficiency, though high product yields can be achieved. Various homogeneous and heterogeneous catalysts have been developed for selective hydrogenation with H2,8–12 and heterogeneous catalysts are superior from a practical view. As heterogeneous catalysts for the selective hydrogenation of unsaturated aldehydes, supported bimetallic catalysts composed of a noble metal (M) and a metal ion/oxide (M′Ox) have been an important class.10 The combination of Pt and Fem+ has been a typical one,13 and the main role of M′Ox has been regarded as the activation of the CO bond by adsorption of the oxygen atom of CO on the M′m+ site (Scheme 2).10,14 Therefore, the interface between M and M′Ox is the active site.15 Recently, Ir-based catalysts have been reported to be effective catalysts.16,17 Ir catalysts show relatively good selectivity even as monometallic ones,18–21 and the activity and selectivity can be significantly increased by the addition of M′Ox, such as ReOx,16 MoOx,22,23 and FeOx.18,24–36Table 1 summarizes the Ir-based bimetallic catalysts for the hydrogenation of unsaturated keto compounds. Ir-based bimetallic catalysts have also been reported for hydrogenation reactions of polar double bonds, such as nitro compounds,37 amides38 and carboxylic acids,39,40 One explanation for the increasing activity in Ir-based bimetallic catalysts is the formation of hydride-like activated hydrogen species at the interface of Ir and M′Ox.18,24 The hydride-like species readily attack the Cδ+Oδ− bond like stoichiometric hydride reagents such as NaBH4. The involvement of hydride-like species derived from the heterolytic dissociation of H2 in the hydrogenation of polar double bonds has also been proposed for Ag,41 Au42 and Ru43 catalysts.
 |
| | Scheme 1 Reaction pathways for the hydrogenation of unsaturated aldehydes. | |
 |
| | Scheme 2 Proposed reaction mechanism for unsaturated aldehyde hydrogenation and polyol hydrogenolysis over bimetallic M-M′Ox catalysts. | |
Table 1 Summary of Ir-based bimetallic catalysts for hydrogenolysis and hydrogenation reactions
| Substrate |
Catalyst |
Ir loading amount (wt%)/surface area of support (m2 g−1) |
M/Ir ratio |
Temperature (K) |
H2 pressure (MPa) |
Conv. (%) |
Select. (%) |
Average formation rate (mmol gcat−1 h−1) [initial TOFm (h−1)]a |
Ref. |
| For hydrogenation of unsaturated keto compounds to unsaturated alcohols |
| Crotonaldehyde |
Ir–ReOx/SiO2 |
4/485 |
1 |
303 |
0.8 |
43 |
92 |
25 [120] |
16
|
| Crotonaldehyde |
Ir–FeOx/SiO2 |
3/320 |
0.1 |
353 |
H2 flow (0.1) |
65.6 |
91 |
86 [550] |
25
|
| Benzalacetone |
Ir/MgO + Fe(NO3)3 |
4/34 |
0.05 |
303 |
8 |
58 |
85 |
154 [720] |
24
|
| Crotonaldehyde |
Ir–MoOx/BN |
3/26.6 |
0.3 |
353 |
0.6 |
80.4 |
76.6 |
14 [88] |
22
|
| Crotonaldehyde |
Ir–CrOx–FeOx/SiO2 |
3/320 |
0.05 |
353 |
H2 flow (0.1) |
74.9 |
85.9 |
98 [628] |
28
|
| Crotonaldehyde |
AgIrNPs |
2/55.8 |
0.05 |
473 |
H2 flow (0.1) |
>99 |
63 |
−[143] |
29
|
| Cinnamaldehyde |
IrNi/TiO2 |
2/150 |
0.2 |
353 |
2 |
97.8 |
95.4 |
57 [−] |
34
|
| Furfural |
Ir–CoOx/Al2O3 |
1.72/280 |
1 |
318 |
0.8 |
98 |
99 |
9.6 [109] |
31
|
| Cinnamaldehyde |
IrAu/TiO2 |
0.25/50 |
0.125 |
373 |
2 |
12 |
83.3 |
27 [145] |
30
|
| Citral |
Ir/TiO2/SiO2 |
1/290 |
— |
363 |
0.62 |
47 |
63 |
0.02 [0.38] |
32
|
| Crotonaldehyde |
RuIr/ZnO |
3/11 |
0.5 |
353 |
H2 flow (0.1) |
93.5 |
86.6 |
−[1] |
33
|
| Crotonaldehyde |
Ir–FeOx/BN |
3/18.5 |
0.05 |
353 |
H2 flow (0.1) |
55.6 |
84.4 |
1.8 [12] |
26
|
| Crotonaldehyde |
Ir–MoOx/TUD-1 |
4/226 |
0.1 |
353 |
0.6 |
79.6 |
89.3 |
142.1 [−] |
23
|
| Crotonaldehyde |
Ir–FeOx/BN |
3/18.5 |
0.1 |
353 |
H2 flow (0.1) |
12 |
83.4 |
116 [720] |
27
|
| Cinnamaldehyde |
Ir–ReOx/SiO2 |
4/485 |
1 |
303 |
0.8 |
99 |
96 |
9.5 [−] |
16
|
| Cinnamaldehyde |
IrCd/CB |
— |
5 |
RT |
1 |
96.7 |
94.3 |
7.6 [−] |
36
|
| Cinnamaldehyde |
Ir/H–MoOx |
3.4/5 |
— |
373 |
2 |
>99 |
93 |
36.8 [−] |
35
|
| Cinnamaldehyde |
Ir/MgO + Fe(NO3)3 |
4/34 |
0.05 |
303 |
8 |
>99 |
>99 |
140 [−] |
24
|
| Cinnamaldehyde |
Ir–FeOx/rutile |
3/6.8 |
0.1 |
303 |
0.8 |
41 |
95 |
21.4 [153] |
This work |
| For C–O hydrogenolysis |
|
TOF is calculated from the results at <40% conversion level.
|
| Glycerol |
Ir-ReOx/SiO2 |
20/485 |
1 |
393 |
8 |
69 |
47 (1,3-propanediol) |
69 |
44
|
| Glycerol |
Ir–ReOx/TiO2 |
4/6 |
0.25 |
393 |
8 |
35 |
67 (1,3-propanediol) |
17 |
45
|
| 1,2-Butanediol |
Ir–FeOx/TiO2 |
5/6 |
0.5 |
453 |
8 |
17 |
64 (2-butanol) |
0.2 |
46
|
| 1,2-Butanediol |
Ir–FeOx/BN |
5/5.8 |
0.25 |
453 |
8 |
14 |
69 (2-butanol) |
0.2 |
47
|
| 1,2-Butanediol |
IrMoFeOx/BN |
20/5.8 |
0.13 |
453 |
8 |
47 |
66 (2-butanol) |
9 |
48
|
| Tetrahydrofurfuryl alcohol |
Ir–VOx/SiO2 |
4/509 |
0.1 |
353 |
H2 flow (6) |
50 |
90 (1,5-pentanediol) |
— |
49
|
| Tetrahydrofurfuryl alcohol |
Ir–MoOx/SiO2 |
4/509 |
0.13 |
393 |
H2 flow (6) |
75 |
65 (1,5-pentanediol) |
0.7 |
50
|
| 1,2-Butanediol |
Ir–Fe/carbon |
5/851 |
0.25 |
453 |
8 |
90 |
81 (1-butanol) |
2 |
47
|
| Glycerol |
Ir–Fe/γ-Al2O3 |
2/110 |
2 |
573 |
2.48 |
10 |
92 (1,2-propanediol) |
0.09 |
51
|
| Glycerol |
Ir–Re/H-ZSM-5 |
4/333 |
4 |
1 |
4 |
5.5 |
56 (1-propanol) |
3 |
52
|
| Glycerol |
Ir–Re/KIT-6 |
4/580 |
1 |
393 |
8 |
40 |
37 (1,3-propanediol) |
17 |
53
|
| Glycerol |
Ir–Ni/γ-Al2O3 |
2/108 |
2 |
|
2.4 |
22 |
80 (1,2-propanediol) |
0.1 |
54
|
| Glycerol |
Ir–ReOx/silanized SiO2 |
2/− |
— |
403 |
8 |
49 |
37 (1,3-propanediol) |
0.5 |
55
|
Recently, the Ir-based catalysts have also been used in C–O hydrogenolysis reactions, which are important in the utilization of oxygen-rich biomass-derived compounds. Ir-based bimetallic C–O hydrogenolysis catalysts show unique regioselectivity depending on the support and second element, while monometallic Ir catalysts are almost inactive. Table 1 also shows a summary of Ir-based catalysts for C–O hydrogenolysis reactions.44–55 Obviously, some of the Ir–M′Ox/support catalysts such as Ir–ReOx/SiO2,44 Ir–FeOx/SiO2,46 Ir–MoOx/SiO2 (ref. 50) and Ir–FeOx/BN47 are effective in both hydrogenation and C–O hydrogenolysis. For these catalysts, the mechanism of C–O hydrogenolysis has been proposed that hydrogen was dissociated on the metal species to form proton (H+) and hydride (H−) species.56 The active sites are also considered as the interface between the Ir metal species and the metal oxide species. The substrate was adsorbed on the metal oxide species and then reacted with the hydride species. There is a clear resemblance in the catalysts and proposed mechanism between the hydrogenation of unsaturated aldehydes and C–O hydrogenolysis, but the correlation between these two catalytic reactions over Ir–M′Ox has not been well investigated. Some other noble metal catalysts modified with M′Ox such as Rh–ReOx;56,57 and Ru–ReOx;58,59 have also been proposed to catalyze C–O hydrogenolysis reactions via hydride species; however, these catalysts are not effective in the selective hydrogenation of unsaturated aldehydes because of the high activity of Rh and Ru in CC hydrogenation.
Recently, our research group discovered that the utilization of rutile-form TiO2 with low surface area as a support offers a high surface concentration of dispersed Ir species due to the similar rutile structures of TiO2 and IrO2.45 The interface between the Ir metal species and metal oxide species can be effectively constructed by further loading of metal oxide species. The Ir–ReOx/rutile TiO2 catalyst46 showed a higher catalytic performance in the C–O hydrogenolysis of 1,2-diols to 1-monoalcohols than that of the Ir–ReOx/SiO2 catalyst.44 Additionally, the combination of Ir and Fe on the rutile-form TiO2 was developed for the C–O hydrogenolysis with different selectivities (1,2-diols to 2-monoalochols).46 While the Ir–FeOx/support and Ir–ReOx/support catalysts have been already reported for the hydrogenation of unsaturated aldehydes, the use of low surface area rutile TiO2 as a support has not been investigated. In this study, the performance of Ir–MOx/TiO2 (rutile, low surface area) catalysts was thoroughly investigated. For the most promising catalyst, Ir–FeOx/TiO2, the structure-performance relationship was closely compared between the hydrogenation of cinnamaldehyde and C–O hydrogenolysis.
2. Experimental section
2.1. Catalyst preparation
Ir–FeOx/support (typically rutile TiO2 with a BET surface area of 6.8 m2 g−1, which is hereafter denoted as “rutile”) catalysts were prepared by a sequential impregnation method, similarly to our previous work.60 An Ir precursor solution (4.65 wt% Ir in aqueous H2IrCl6 solution) was first loaded on the support. After drying at 383 K for 12 h, the Ir/support was impregnated with a Fe precursor solution (2 wt% Fe in an aqueous Fe(NO3)3 solution). The prepared samples were dried at 383 K for 12 h in a furnace and then calcined at 773 K for 3 h in an air atmosphere. The details of the supports and precursors are provided in the Supporting Information (Table S1†).
2.2. Activity tests
The activity tests were performed in a 190 mL stainless steel autoclave with an inserted glass vessel. For the typical activity test, the Ir–FeOx/rutile (Ir: 3 wt%, Fe/Ir molar ratio = 0.1) catalyst (50 mg) and the solvent (water, 5.0 g) were added into a glass vessel together with a magnetic stirrer. The glass vessel was put into an autoclave, and then the autoclave was purged by 1 MPa H2 for 3 times to drain the air inside. Subsequently, 6 MPa H2 was introduced and kept during the heating process. Once the temperature reached 473 K, the H2 pressure became 8 MPa and kept for 1 h for the reduction pretreatment of the catalysts (liquid phase reduction). Afterwards, the autoclave was cooled down to room temperature rapidly, and the substrate (cinnamaldehyde, 6 mmol) was added into the autoclave. The autoclave was quickly purged with 1 MPa H2, and then 0.8 MPa H2 was introduced into the autoclave at room temperature. The time when the temperature became 303 K was defined as the beginning of the reaction. The stabilization time after the introduction of H2 was about 10 min. The specific reaction conditions are shown for each result. The stirring rate was fixed at 500 rpm to eliminate the mass transfer effects which are the same as those reported in our previous work.44–47 After the reaction (typically 2.5 h), the autoclave was depressurized to stop the reaction. The liquid phase in the autoclave was diluted with 10 g ethanol and transferred to a vial. For the reusability tests, the catalyst was separated by centrifugation and washed with H2O and ethanol for 4 times each. Then the catalyst was dried at 383 K for 12 h, reduced in liquid phase again (8 MPa H2, 1 h in the autoclave), and used for the next run.
For the hydrogenolysis of 1,2-butanediol, the procedure of the reaction tests was the same as that reported in our previous study.46
2.3. Product analysis
The internal standard method was used for product analysis and identification. First, 0.15 g 1,4-dioxane was used as an internal standard and added during the liquid phase collection. The quantitation of products was carried out using a gas chromatograph (Shimadzu GC-2025) equipped with a TC-WAX capillary column (diameter 0.25 mm, 30 m) and FID. The conversion, yield, carbon balance (C.B.), turnover frequency of total metal (TOFm) and turnover frequency of surface metal (TOFs) were calculated using the following equations:| |  | (1) |
| |  | (2) |
| |  | (3) |
| |  | (4) |
| |  | (5) |
where Dco means the metal dispersion determined by CO chemisorption (Dco = CO adsorption amount (mol)/Ir amount (mol) × 100%).
2.4. Catalyst characterization
The X-ray diffraction (XRD) patterns of catalysts were acquired using a Rigaku MiniFlex600 diffractometer (Cu Kα radiation). The morphologies of the samples were observed using a transmission electron microscope (TEM; Hitachi HD-2700) equipped with an energy-dispersive X-ray (EDX) analyser (Hitachi H-7650). For the TEM measurement, the catalysts after reduction were collected and dispersed in ethanol under ultrasonication for 5 min. Then 5 μL suspension was dropped onto a Cu grid and dried under air for the test. The average particle size of the catalysts was calculated as Σnidi3/Σnidi2, where di is the particle size and ni is the number of particles of size di.
The temperature-programmed reduction with H2 (H2-TPR) measurement and the CO chemisorption measurement were conducted using a catalyst analyzer BELCAT II connected to a quadrupole-mass spectrometer (BELMASS). For CO chemisorption, the number of surface Ir atoms was assumed by the acquired CO adsorption amount. The dispersion of Ir was calculated by the ratio of CO adsorption amount to the total Ir amount. The catalysts were pretreated at 573 K under H2 flow for 1 h in the gas phase, and CO pulses were introduced at 303 K.
The Fourier transform infrared (FT-IR) spectra of adsorbed CO on the catalysts were obtained in the transmission mode using a JASCO FT/IR-4600 spectrometer. The spectrometer was equipped with a liquid-nitrogen-cooled MCT (HgCdTe) detector (resolution 4 cm−1) and an IR cell with CaF2 windows, which was connected to a conventional gas flow system. The samples with a weight of 50 mg were mixed with 200 mg SiO2 (G-6), and then 100 mg of the mixed sample was pressed as a disk of 10 mm ø, which was placed into the IR cell. Then the catalyst was heated to 573 K (10 K min−1) and purged with N2 for 1 h. Then, the catalyst was reduced at 573 K under H2 flow (pure H2, 90 mL min−1) for 1 h. After the sample was cooled down to 303 K under N2 flow, the background spectrum was recorded. The CO was introduced at 303 K for 30 min and then purged with N2 for 30 min. After that, the spectrum was recorded.
X-ray photoelectron spectra (XPS) were recorded using a Shimadzu AXIS-ULTRA DLD spectrometer under high vacuum at ambient temperature. The binding energy was calibrated with a C 1s peak of sample-loaded adhesive tape at 284.6 eV. The sample was prepared in a glove box to avoid exposure to air after prereduction under 8 MPa H2 at 473 K in the autoclave. The analysis of XPS data was performed using the computer program XPSPEAK41.
The inductively coupled plasma-optical emission spectrometry (ICP-OES, Thermo Fisher iCAP6500) was employed to measure the leached Ir and Fe amounts into the liquid phase of the reactions. A series of 0–50 ppm solutions were prepared by diluting the commercial standard solutions of Ir and Fe. The liquid phase of each reuse run after filtration was applied to the ICP-OES test.
The X-ray absorption near-edge structure (XANES) measurement was carried out using a BL14B2 station of SPring-8 by 2024B1752. The Ir L3-edge spectra were recorded in the transmission mode. The Fe K-edge spectra were recorded in the fluorescence mode. The sample preparation was conducted in a N2 atmosphere: the catalysts after reduction or reaction were collected and transferred into a plastic sample bag in the glove box in a N2 atmosphere and measured without exposure to air. The detector for I0 was filled with 100% N2 for Ir L3-edge and Fe K-edge measurements. The detector for I1 was filled with 50% Ar + 50% N2 and 80% N2 + 20% Ar for Ir L3-edge and Fe K-edge measurements, respectively. The analyses of the XANES data were performed using the Athena software. The molar fraction of Fe3+/Fe2+/Fe0 was determined by a linear combination fitting (LCF) method with the curves of Fe foil, FeO, and α-Fe2O3, similarly to our previous reports.46
3. Results and discussion
3.1. Catalyst screening and optimization
First, monometallic Ir/rutile catalysts with different Ir loading amounts were applied to the selective hydrogenation of cinnamaldehyde (Table S2†). The catalyst with 3 wt% loading showed the highest activity based on the Ir amount. Next, bimetallic Ir–M′Ox/rutile catalysts with different additive metals (Ir: 3 wt%, M′/Ir = 0.1) were compared (Fig. 1(a), detailed data in Table S3†). Without the Ir–M′Ox/rutile (Ir: 3 wt%, M′/Ir = 0.1) catalyst, cinnamaldehyde hydrogenation had almost no activity. The Ir–FeOx/rutile (Ir: 3 wt%, Fe/Ir = 0.1) catalyst showed the highest conversion level (41%) among all the Ir–M′Ox/rutile catalysts. The selectivity to cinnamyl alcohol was over 90% for all the tested catalysts except the cases of M′ = Ni and Co. The combination of Ir and Re has been proved to be effective in the selective hydrogenation of unsaturated aldehydes in the literature,14 but the activity of Ir–ReOx/rutile (Ir: 3 wt%, Re/Ir = 0.1) was much lower than that of Ir–FeOx/rutile (Ir: 3 wt%, Fe/Ir = 0.1). Therefore, the effect of the molar ratio of M′/Ir was investigated for both M′ = Fe and Re (Fig. 1b, detailed data in Table S4†). For both M′ = Fe and Re, the activity of the reaction showed a volcano-type dependence on the M/Ir ratio. The activity of Ir–FeOx/rutile reached maximum at Fe/Ir = 0.1 and gradually decreased with higher Fe/Ir, while that of Ir-ReOx/rutile reached maximum at Re/Ir = 0.25. The activity of optimized Ir–FeOx/rutile (Fe/Ir = 0.1) was higher than that of optimized Ir–ReOx/rutile (Re/Ir = 0.25). The small optimized Fe additive amount (Fe/Ir = 0.1) was also reported on SiO2-supported Ir–FeOx catalysts for crotonaldehyde hydrogenation.18 The dependence on modifier amounts is different between cinnamaldehyde hydrogenation and C–O hydrogenolysis: the activity in 1,2-butanediol hydrogenolysis was highest at Fe/Ir = 0.25 and much decreased with larger Fe amounts.46 The results indicated that the active site for unsaturated aldehyde hydrogenation and C–O hydrogenolysis is different in the Ir–FeOx/rutile catalyst. Furthermore, Ir–ReOx/rutile was reported to have the best activity in C–O hydrogenolysis of glycerol when the Re/Ir ratio was about 0.3,45 which is similar to the optimized one for cinnamaldehyde hydrogenation, as shown in Fig. 1b.
 |
| | Fig. 1 (a) Cinnamaldehyde hydrogenation over Ir–M′Ox/rutile (Ir: 3 wt%, M′/Ir = 0.1) catalysts; (b) cinnamaldehyde hydrogenation over Ir–FeOx/rutile and Ir–ReOx/rutile (Ir: 3 wt%) catalysts with various M′/Ir ratios. Reaction conditions: catalyst = 50 mg; substrate: cinnamaldehyde = 6 mmol; solvent: H2O = 5 g; reaction temperature = 303 K; reaction time = 2.5 h; H2 pressure = 0.8 MPa. The catalysts were pretreated before the reaction with liquid-phase reduction (8 MPa H2, 473 K in the autoclave). Detailed data are shown in Tables S3 and S4.† | |
The support effect was then investigated for the catalysts. The Ir–FeOx/support catalysts (Ir: 3 wt%, Fe/Ir = 0.1, support: rutile-form TiO2 (surface area: 6.8 m2 g−1), anatase-form TiO2 (surface area: 13 m2 g−1), P25 TiO2 (mixture of rutile and anatase, surface area: 30 m2 g−1), SiO2, BN, MgO, TiN, TiC, Co3O4, MnO2, SnO2 and CeO2) were prepared by a sequential impregnation method and introduced to the cinnamaldehyde hydrogenation (Fig. 2, detailed data in Table S5†). Rutile-form TiO2 showed the highest activity (conversion: 41%) of Ir–FeOx catalysts than the other crystal-form TiO2 supports (26% conversion over Ir–FeOx/anatase and 22% conversion over Ir–FeOx/P25). The higher activity of Ir–FeOx/rutile than the other Ir–FeOx/TiO2 catalysts was also observed for 1,2-butanediol hydrogenolysis (Ir–FeOx/rutile, Ir–FeOx/anatase and Ir–FeOx/P25 catalysts showed 17.1%, 5.6% and 6.0% conversion of 1,2-butanediol, respectively),46 since a high surface concentration of Ir–FeOx species could be offered by rutile-form TiO2 and a higher Dco was observed on rutile-form TiO2 than other TiO2 phases (Table S8†); however, the activity difference was smaller in cinnamaldehyde hydrogenation. SiO2, BN and CeO2 supports showed the activity of Ir–FeOx catalysts in cinnamaldehyde hydrogenation, but their activities were lower than those of Ir–FeOx/rutile. MgO, TiN and TiC supports were not effective. The dependence on supports is different between cinnamaldehyde hydrogenation and 1,2-butanediol hydrogenolysis: Ir–FeOx/MgO was even more active than Ir–FeOx/rutile in 1,2-butanediol hydrogenolysis, although the regioselectivity was not good.46 Ir–FeOx/CeO2 was almost inactive in 1,2-butanediol hydrogenolysis.46 Rutile-supported FeOx-modified noble metal catalysts (M = Ir, Ru, Rh, Au, Pd, and Pt; M: 3 wt%; Fe/M = 0.1) were applied to the cinnamaldehyde hydrogenation (Table S6†). Ir–FeOx/rutile showed a higher selectivity than that of the other M–FeOx/rutile catalysts, and the activity (conversion) was also high, next to Pd–FeOx/rutile. The results demonstrated the effectiveness of the combination of Ir, FeOx and rutile TiO2 support in the cinnamaldehyde hydrogenation.
 |
| | Fig. 2 Effect of supports on cinnamaldehyde hydrogenation over Ir–FeOx (Ir: 3 wt%, Fe/Ir = 0.1) catalysts. Reaction conditions: catalyst = 50 mg; substrate: cinnamaldehyde = 6 mmol; solvent: H2O = 5 g; reaction temperature = 303 K; reaction time = 2.5 h; H2 pressure = 0.8 MPa. The catalysts were pretreated before the reaction with liquid-phase reduction (8 MPa H2, 473 K in the autoclave). Detailed data are shown in Table S5.† | |
The loading amount of Ir and Fe was changed for the Ir–FeOx/rutile catalyst with a fixed molar ratio of Fe/Ir of 0.1. The reaction results with a fixed catalyst amount (different Ir amount) are shown in Fig. 3 (detailed in Table S7†). All the catalysts showed a good selectivity (over 95%) to cinnamyl alcohol. The activity increased drastically with the increase in loading amount up to Ir = 3 wt%. Too low Ir loading amounts seem to inhibit the formation of active bimetallic Ir–FeOx structures. After that, the activity increased gradually with the increasing amount up to Ir = 8 wt%, which means that the Ir-based activity was decreased since the dispersion of surface Ir was decreased (Dco was decreased, Table S8†) with a higher Ir loading amount, and even slightly decreased at 10 wt% Ir. The loading of 3 wt% Ir gave the best activity based on the Ir amount. The performances of typical Ir–FeOx/rutile catalysts with different loading amounts are summarized in Table 2 for both cinnamaldehyde hydrogenation and 1,2-butanediol hydrogenolysis (detailed data of 1,2-butanediol hydrogenolysis over Ir–FeOx/rutile are shown in Table S9†). The difference in the dependence on the loading amount between cinnamaldehyde hydrogenation and C–O hydrogenolysis again suggests the difference in the active site between these reactions.
 |
| | Fig. 3 Cinnamaldehyde hydrogenation over Ir–FeOx/rutile (Fe/Ir = 0.1) catalysts. Reaction conditions: catalyst = 50 mg; substrate: cinnamaldehyde = 6 mmol; solvent: H2O = 5 g; reaction temperature = 303 K; reaction time = 2.5 h; H2 pressure = 0.8 MPa. The catalysts were pretreated before the reaction with liquid-phase reduction (8 MPa H2, 473 K in the autoclave). Detailed data are shown in Table S7.† | |
Table 2 Comparison of the performance of Ir–FeOx/TiO2 catalysts in cinnamaldehyde hydrogenation and 1,2-butanediol hydrogenolysis
| Catalyst |
Ir loading amount (wt%) |
Fe/Ir ratio |
Yield of target product (%) |
| Cinnamaldehyde hydrogenation (cinnamyl alcohol)c |
1,2-Butanediol hydrogenolysis (2-butanol)d |
|
Ref. 46.
The catalyst was prepared with the procedure involving calcination and reduction before loading Fe.
Reaction conditions: catalyst = 50 mg; substrate = 6 mmol; solvent: H2O = 5 g; reaction temperature = 303 K; reaction time = 2.5 h; H2 pressure = 0.8 MPa. The catalysts were pretreated before the reaction with liquid-phase reduction (8 MPa H2, 473 K in the autoclave).
Detailed data are shown in Table S8.† Reaction conditions: catalyst = 200 mg; substrate = 0.5 g; solvent: H2O = 4 g; reaction temperature = 453 K, reaction time = 24 h; H2 pressure = 8 MPa.
|
| Ir–FeOx/rutile |
3 |
0.1 |
40 |
3 |
| Ir–FeOx/rutile |
5 |
0.25 |
25 |
11a |
| Irc-r–FeOx/rutileb |
5 |
0.25 |
— |
6a |
| Ir–FeOx/rutile |
5 |
0.1 |
55 |
4 |
| Ir/rutile |
3 |
0 |
8 |
1 |
| Ir/rutile |
5 |
0 |
6 |
4a |
The effect of pre-reduction conditions for Ir–FeOx/rutile (3 wt% Ir, Fe/Ir = 0.1) was investigated because the reduction degree of both Ir and the modifier can affect the catalytic performance. In addition, the TiO2 support is well known to show the strong metal-support interaction (SMSI), which is induced by severe reduction treatment (such as 773 K) to cause the modification of metal surface with reduced support species. The tested pretreatment conditions were without reduction, liquid phase for 1 h with 8 MPa H2 at 473 K (denoted as “L, 473 K”) and gas phase under H2 flow (30 mL min−1) at 473, 573, 673, 773, 873 and 973 K for 1 h (denoted as “G, 473–973 K”). The results are shown in Fig. 4 (square markers) and Table S10.† The catalysts without pre-reduction were less active than the pre-reduced ones. Among the gas-phase reduced catalysts, that one reduced at 573 K showed the highest activity. Reduction at higher temperatures, which typically results in the SMSI, significantly decreased the activity. The catalyst reduced at a lower temperature (G, 473 K) showed very low activity probably because of the insufficient reduction. The reduction degree will be discussed in a later section. Furthermore, the activity of (L, 473 K) catalyst, which was the standard catalyst, was slightly higher than that of the (G, 573 K) catalyst, but the difference was negligible. The high H2 pressure (8 MPa) for liquid-phase reduction can promote the reduction in comparison with gas-phase reduction at the same temperature. The results indicated that the liquid-phase reduction with 8 MPa H2 at 473 K (L, 473 K) is the suitable reduction condition, while the gas-phase reduction under H2 flow at 573 K (G, 573 K) gives almost the same performance and we assume the same structure.
 |
| | Fig. 4 Comparison of cinnamaldehyde hydrogenation and 1,2-butanediol hydrogenolysis over Ir–FeOx/rutile catalysts with different reduction methods. Red symbols: liquid-phase reduced catalysts (L, 473 K prereduction for cinnamaldehyde hydrogenation; 453 K in situ reduction for 1,2-butanediol hydrogenolysis). Reaction conditions: For cinnamaldehyde hydrogenation, catalyst = 50 mg; substrate: cinnamaldehyde = 6 mmol; solvent: H2O = 5 g; reaction temperature = 303 K; reaction time = 2.5 h; H2 pressure = 0.8 MPa. The catalysts were pretreated before the reaction with liquid-phase reduction (8 MPa H2, 473 K in the autoclave) (Table S9†). For 1,2-butanediol hydrogenolysis: catalyst = 200 mg; substrate = 0.5 g, solvent: H2O = 4 g; reaction temperature = 453 K; reaction time = 24 h; H2 pressure = 8 MPa; data were obtained from ref. 35. Detailed data are shown in Table S11.† | |
The dependences of the performance of Ir–FeOx/rutile on reduction methods and reduction temperatures were compared between cinnamaldehyde hydrogenation and 1,2-butanediol hydrogenolysis. As shown in Fig. 4, during 1,2-butanediol hydrogenolysis, the Ir–FeOx/rutile (Ir: 5 wt%, Fe/Ir = 0.25) shows a similar activity under all the gas-phase reduction conditions (detailed data are shown in Table S11,† from previous study46). This result indicated that the difference in reduction degree has much stronger effects on the catalytic performance for cinnamaldehyde hydrogenation than that for 1,2-butanediol hydrogenolysis. The effect of the difference in the reduction degree will be discussed in the later section.
3.2. Performance and stability of Ir–FeOx/rutile (3 wt% Ir, Fe/Ir = 0.1)
The time course of cinnamaldehyde hydrogenation over Ir/rutile (Ir: 3 wt%) and Ir–FeOx/rutile (3 wt% Ir, Fe/Ir = 0.1) is shown in Fig. 5 (detailed data are provided in Table S12†). The reaction proceeded almost linearly over both two catalysts. Under the standard reaction conditions, when the reaction time was extended to 16 h, the conversion was increased to 97% with 96% selectivity to cinnamyl alcohol (93% yield) over Ir–FeOx/rutile (Ir: 3 wt%, Fe/Ir = 0.1). When the reaction time was further extended, the formation of 3-phenyl-1-propanol gradually occurred by the over-hydrogenation of cinnamyl alcohol. The reaction over monometallic Ir/rutile (Ir: 3 wt%) was much slower than that of Ir–FeOx/rutile (Ir: 3 wt%, Fe/Ir = 0.1). Although the selectivity was also high, the conversion was still around 70% at 72 h. The initial turnover frequency based on surface metal (TOFs; <30% conversion, based on dispersion determined by CO chemisorption) and the average rate of the Ir–FeOx/rutile (Ir: 3 wt%, Fe/Ir = 0.1) catalyst was 695 h−1 and 21.4 mmol gcat−1 h−1, respectively. The activity (average rate) is comparable to that of other modified Ir catalysts including those with an expensive modifier such as Re and Au (Table 1). These results suggest that Fe is an effective alternative to other expensive metals for the modification of Ir species.
 |
| | Fig. 5 Time course of cinnamaldehyde hydrogenation over (a) Ir/rutile (Ir: 3 wt%) and (b) Ir–FeOx/rutile (Ir: 3 wt%, Fe/Ir = 0.1). Reaction conditions: catalyst = 50 mg; substrate: cinnamaldehyde = 6 mmol; solvent: H2O = 5 g; reaction temperature = 303 K; H2 pressure = 0.8 MPa. The catalysts were pretreated before the reaction with liquid-phase reduction (8 MPa H2, 473 K in the autoclave). Detailed data are shown in Table S12.† | |
The substrate scope of the Ir–FeOx/rutile (Ir: 3 wt%, Fe/Ir = 0.1) catalyst was investigated. Table 3 shows the results with the highest yield of each substrate, and Table S13† lists the data of detailed time courses. Crotonaldehyde, furfural, 2-hexenal and citral were hydrogenated to the corresponding allylic alcohol in the highest yields of 95%, 99%, 92% and 79%, respectively. These yield values were similar to those obtained with more expensive Ir–ReOx/SiO2 catalysts (Re/Ir = 1) under similar reaction conditions.16
Table 3 Substrate scope of selective hydrogenation over Ir–FeOx/TiO2 (Ir: 3 wt%, Fe/Ir = 0.1) catalysts
| Entry |
Substrate |
Product |
Reaction time (h) |
Conversion (%) |
Yield (%) |
Selectivity (%) |
| Reaction conditions: catalyst = 50 mg; substrate = 6 mmol; solvent: H2O = 5 g; reaction temperature = 303 K; reaction time is different; H2 pressure = 0.8 MPa. The catalysts were pretreated before the reaction with liquid-phase reduction (8 MPa H2, 473 K in the autoclave). |
| 1 |

|

|
16 |
96 |
94 |
98 |
| 2 |

|

|
12 |
95 |
90 |
95 |
| 3 |

|

|
12 |
99 |
99 |
>99 |
| 4 |

|

|
12 |
93 |
92 |
>99 |
| 5 |

|

|
12 |
83 |
79 |
95 |
One important performance of catalysts is stability. The reusability test was thus carried out for the Ir–FeOx/rutile (Ir: 3 wt%, Fe/Ir = 0.1) catalyst. The catalyst after each run was separated from the reaction system by centrifugation, washed with H2O and ethanol, dried at 383 K overnight, and used for the next run with the liquid-phase reduction. As shown in Fig. 6 (detailed data in Table S14†), the conversion value and selectivity to cinnamyl alcohol over Ir–FeOx/rutile (Ir: 3 wt%, Fe/Ir = 0.1) were maintained in four runs. The leached species during each run were also measured by ICP-OES, and they were negligible for both Ir (<0.1% each) and Fe (<0.5% each) (Table S15). The results indicate the high stability of the Ir–FeOx/rutile (Ir: 3 wt%, Fe/Ir = 0.1) catalyst.
 |
| | Fig. 6 Reuse test of Ir–FeOx/rutile (Ir: 3 wt%, Fe/Ir = 0.1) catalysts for cinnamaldehyde hydrogenation. Reaction conditions: catalyst = 50 mg; substrate: cinnamaldehyde = 6 mmol; solvent: H2O = 5 g; reaction temperature = 303 K; reaction time = 2.5 h; H2 pressure = 0.8 MPa. The catalyst was pretreated before the reaction with liquid-phase reduction (8 MPa H2, 473 K in the autoclave). Reuse method: the catalyst after each run was separated from the reaction system by centrifugation, washed with H2O and ethanol for each run, dried at 383 K overnight, and used for the next run with liquid-phase reduction. Detailed data are provided in Table S14.† | |
3.3. Catalyst characterization
The structure of Ir–FeOx/rutile (Ir: 5 wt%) catalysts has been determined by XRD, XAFS, TEM and CO adsorption in our previous work on the C–O hydrogenolysis reaction.46 The determined state of Ir and Fe species on the Ir–FeOx/rutile (Ir: 5 wt%, Fe/Ir = 0.25) catalyst is outlined as follows: Ir is almost fully reduced, and some of Fe species generated Ir–Fe alloys due to the strong interaction between Ir and Fe. Residual Fe species are in the oxidized state (mainly Fe2+). The Ir–Fe alloy particles were partially covered with FeOx species.46 The formation of Ir-rich Ir–Fe alloys by partial reduction of Fe species has also been reported for various bimetallic Ir–Fe catalysts.27,47,61–64 In this work, the compositions of the optimum catalyst were Ir = 3 wt% and Fe/Ir = 0.1 on the same rutile TiO2 catalyst. The catalyst structure can be similar to that in our previous work; however, considering the difference in the dependence on loading amounts and reduction conditions between the two reactions, the structure difference between the optimized catalysts needs to be clarified.
The temperature-programed reduction with H2 (H2-TPR) was carried out to investigate the reducibility of the catalysts. The profiles for the Ir–FeOx/rutile (Ir: 3 wt%) catalysts with different Fe/Ir ratios and the one with Ir 5 wt% and Fe/Ir = 0.25, which is the optimized catalyst for 1,2-butanediol hydrogenolysis, are shown in Fig. 7, and the consumption amounts of H2 are summarized in Table 4. All the Ir–FeOx/rutile catalysts have reduction peaks below 573 K, which is in agreement with that in the gas-phase reduction at 573 K (G, 573 K), which is enough to complete the reduction of the main species. The total consumption amount was slightly larger than the nominal one calculated by 4-electron reduction of Ir and 3-electron reduction of Fe. The reduction of TiO2 also occurred, and therefore the valance state of Fe cannot be calculated from the H2-TPR data. The reduction signal had two peaks except the catalyst with Ir = 3 wt%, Fe/Ir = 0.5. Both peaks were shifted towards a lower temperature with the increase in Fe amount in the Ir = 3 wt% catalysts due to the synergistic interactions between Fe and Ir. Such lower-temperature shifts were also observed for Ir = 5 wt% catalysts.46–48 The higher temperature peak was more shifted, and at a large Fe/Ir ratio (0.5), the two peaks were merged. When the peak temperatures are compared between Ir: 3 wt% and Ir: 5 wt% catalysts with the same Fe/Ir ratio, the peak positions were similar. Therefore, among the Ir–FeOx/rutile catalysts, the optimized one for cinnamaldehyde hydrogenation (Ir: 3 wt%, Fe/Ir = 0.1) was relatively difficult to be reduced in comparison with the one for 1,2-butanediol hydrogenolysis (Ir: 5 wt%, Fe/Ir = 0.25).
 |
| | Fig. 7 H2-TPR profile of Ir–FeOx/rutile (Ir: 3 wt%) with various Fe/Ir ratios. a The profile of Ir–FeOx/rutile (Ir: 5 wt%, Fe/Ir = 0.25) was reported in a previous work,46 and reproduced from the work46 with permission from the American Chemical Society, copyright 2022. | |
Table 4 Summary of H2-TPR of Ir–FeOx/TiO2 catalysts (Ir: 3 wt%)
| Ir/Fe ratio |
Ir amount (mmol gcat−1) |
Fe amount (mmol gcat−1) |
H2 consumptionb (mmol/gcat−1) |
| Nominala |
First peak |
Second peak |
Total |
|
Calculated with IrO2 + 2H2 → Ir + 2H2O and Fe2O3 + 3H2 → 2Fe + 3H2O.
The range of integration temperature (K) is given in parentheses.
Reported in the previous work.46
|
| 0 |
0.16 |
0.0 |
0.32 |
0.09 (414–494) |
0.37 (494–616) |
0.43 (414–616) |
| 0.1 |
0.16 |
0.02 |
0.35 |
0.10 (417–485) |
0.28 (485–670) |
0.38 (417–670) |
| 0.25 |
0.16 |
0.04 |
0.44 |
0.46 (450–496) |
None |
0.46 (450–496) |
| 0.5 |
0.16 |
0.08 |
0.56 |
0.57 (394–576) |
None |
0.57 (394–576) |
| FeOX/rutile (Fe: 0.087 wt%) |
0.00 |
0.02 |
0.06 |
— |
— |
0.05 (567–876) |
| 0.25 (Ir: 5 wt%)c |
0.26 |
0.06 |
0.62 |
0.14 |
0.56 |
0.70 |
The XRD patterns of the Ir/rutile (Ir: 3 wt%) and Ir–FeOx/rutile (Ir: 3 wt%) catalysts with different Fe/Ir ratios are shown in Fig. S1.† The signals assigned to rutile TiO2 were observed clearly, but no obvious signals related to Ir metals and FeOx species were found even in the enlarged patterns (Fig. S1b†). This result can be due to the low loading amount (3 wt%) of Ir and high dispersion of Ir species. The TEM images of the Ir–FeOx/rutile catalyst (Ir: 3 wt%, Fe/Ir = 0.1) after liquid-phase reduction in this work are shown in Fig. 8. The Ir particles were densely present on the surface of rutile-form TiO2 with a mean diameter of 2.1 nm. Such structure has also been reported in other Ir–M′Ox/rutile catalysts.45,46 The particle size was similar to Ir–FeOx/rutile for 1,2-butanediol hydrogenolysis (2.1 nm; Ir: 5 wt%, Fe/Ir = 0.25), while a more stable but slightly less active 1,2-butanediol hydrogenolysis catalyst (“Irc-r–FeOx/rutile”, Ir: 5 wt%, Fe/Ir = 0.25) had larger particles (3.4 nm). The EDS mapping image of the Ir–FeOx/rutile (Ir: 3 wt%, Fe/Ir = 0.1) catalyst showed that both Ir and Fe species were well dispersed on the support. Such distribution of Ir and Fe species is similar to that of previously reported Fe-based catalysts.27,46,65 The particle sizes of Ir in Ir–FeOx/rutile (Ir: 3 wt%, Fe/Ir = 0.1) with varying gas-phase reduction (G, × K) were also measured by TEM (Fig. S2†). The average particle sizes of Ir particles were almost unchanged by the reduction temperature between 473 and 673 K (1.9–2.1 nm) and were similar to that in the liquid-phase reduced catalyst (L, 473 K). These results showed that the difference in the performance of Ir–FeOx/rutile (Ir: 3 wt%, Fe/Ir = 0.1) among the different reduction methods and temperatures was not derived from the Ir particle size but from the difference in the electronic states or the interaction between Ir and Fe.
 |
| | Fig. 8 TEM-EDX analysis of Ir–FeOx/rutile (Ir: 3 wt%, Fe/Ir = 0.1): (a) TEM image; (b) particle size distribution; and (c) and (d) EDS mapping data. Pretreatment method: the catalyst was reduced in an autoclave with 8 MPa H2 at 473 K for 1 h. | |
The XPS data of Ir–FeOx/rutile (Ir: 3 wt%, Fe/Ir = 0.1) after liquid-phase reduction (L, 473 K) are shown in Fig. S3. In the Ir 4f spectrum, the catalyst had mainly Ir metal species (60.5 eV for 4f7/2) together with Ir4+ species (61.1 eV) and the species had a very low binding energy of 59.4 eV in a ratio of 5/1/1. This result indicated that most of the surface Ir was fully reduced under liquid-phase reduction conditions. The presence of Ir4+ was also reported in previous studies for Ir–M′Ox/rutile catalysts,44,45,48 Since the electronegativity of Ir (2.2) is higher than that of Fe (1.83),66 the species with a low binding energy might be derived from metallic Ir with electron transfer from Fe, and then Fem+ species and Ir− species could form. Such electron transfer effect has also been reported to affect Ir-based alloy performance of catalysts.67–70 In the Fe 2p spectrum, both Fe0 and oxidized Fe species were found; however, the composition was difficult to be determined because of the large noise and satellite signals. These results suggest that Ir0 and Fe0 species and Fem+ oxidized species existed in the present catalyst.
The electronic state of Fe was further investigated with the Fe K-edge XANES of Ir–FeOx/rutile (Ir: 3 wt%, Fe/Ir = 0.1) under different reduction conditions, and our previously reported Irc-r–FeOx/rutile (Ir: 5 wt%, Fe/Ir = 0.25; after reaction for 1,2-butanediol hydrogenolysis) catalysts are shown in Fig. 9(I). Here we used Irc-r–FeOx/rutile for comparison because the “c-r” catalyst is more stable under hydrogenolysis conditions, and the characterization results after hydrogenolysis reactions surely reflect the true active sites. The Ir–FeOx/rutile catalysts with a high reduction temperature (G, 573–673 K; L, 473 K) had a weak pre-edge shoulder signal like that of the Fe foil, and the edge position is similar to that of FeO, which suggests that both the catalysts contain Fe0 and Fe2+. The distributions of Fe3+, Fe2+ and Fe0 in these catalysts were further determined by the linear combination fitting (LCF) method71 with the curves of Fe foil, FeO and α-Fe2O3 in the range of 7100–7180 eV (Fig. S4†). For the optimum Ir–FeOx/rutile (Ir: 3 wt%, Fe/Ir = 0.1; after reaction) catalyst in this study, the molar ratio of Fe3+, Fe2+ and Fe0 was 5%/60%/35%, while in Irc-r–FeOx/rutile (Ir: 5 wt%, Fe/Ir = 0.25), the molar ratio of Fe3+, Fe2+ and Fe0 was 9%/26%/65%.46 For the gas-phase reduced catalysts, with the increase in reduction temperature under H2 flow, the reduction of Fe proceeded; the Fe3+ amount decreased and those of Fe2+ and Fe0 increased. At 673 K, Fe3+ totally disappeared. Considering the XPS results and the characterization results in the previous works,46–48 the Fe0 species formed Ir–Fe alloys.
 |
| | Fig. 9 (I) Results of the Fe K-edge XANES analysis of Ir–FeOx/rutile (Ir: 3 wt%, Fe/Ir = 0.1): (a) Fe foil; (b) Fe2O3; (c) FeO; (d) L, 473 K; (e) L, 473 K (after reaction); (f) G, 473 K; (g) G, 573 K; and (h) G, 673 K. (II) Results of the Ir L3-edge XANES analysis of Ir–FeOx/rutile (Ir: 3 wt%, Fe/Ir = 0.1): (a) Ir powder; (b) IrO2; (c) Ir/rutile (Ir: 3 wt%, after reaction); (d) L, 473 K; (e) L, 473 K (after reaction); (f) G, 473 K; (g) G, 573 K; and (h) G, 673 K. Pretreatment method: the catalysts were pretreated before the measurement with different reduction conditions: L: liquid-phase reduction under 8 MPa for 1 h; G: gas-phase reduction under flowing H2 (30 mL min−1, 0.1 MPa) for 1 h. Reaction conditions: catalyst = 50 mg; substrate: cinnamaldehyde = 6 mmol; solvent: H2O = 5 g; reaction temperature = 303 K; reaction time = 2.5 h; H2 pressure = 0.8 MPa. | |
The electronic state of Ir was also investigated with the Ir L3-edge XANES. The spectra of Ir–FeOx/rutile with different reduction methods are shown in Fig. 9(II). The Ir species in all the reduced catalysts were partially reduced, and the Ir/rutile and (G, 473 K) catalysts were less reduced. The valence of Ir species was calculated based on the white-line intensity method. With the increase in reduction temperature, the valence of Ir was decreased (1.8–1.1). The similar valence of Ir was discovered in both L, 473 K and G, 573 K.72 The results suggested that the addition of Fe increases the reducibility of the catalysts and the structural similarity between L, 473 K and G, 573 K. This result matched the H2-TPR results.
The electronic state of Ir or Ir–Fe alloy in the catalysts was further characterized by FT-IR spectroscopy of adsorbed CO on the catalysts (Fig. 10). The monometallic Ir/rutile (Ir: 3 wt%) showed a signal at 2082 cm−1, which can be assigned to linear adsorbed CO on Ir0 sites.45,73 The peak position was shifted to a lower wavenumber upon Fe modification. The redshift was also observed for 5 wt% Ir catalyst.46 The shift in the catalyst with 3 wt% Ir and Fe/Ir = 0.1 for the cinnamaldehyde hydrogenation from Ir/rutile was smaller than that of the catalyst with 5 wt% Ir and Fe/Ir = 0.25 for the 1,2-butanediol hydrogenolysis (−5 to −12 cm−1). The smaller shift can be due to the lower Fe0/Ir0 molar ratio in the catalyst with 3 wt% Ir and Fe/Ir = 0.1 because of the lower reduction degree, as shown by XANES and low bulk ratio of Fe/Ir. For the adsorption amount of CO (DCO), both Ir: 3 wt%, Fe/Ir = 0.1 and Ir: 5 wt%, Fe/Ir = 0.25 catalysts had lower DCO values than that expected from the particle size (2.1 nm: ∼50% dispersion), which suggested the modification of Fem+ species on the surface of Ir–Fe alloy particles.
 |
| | Fig. 10 CO FT-IR spectra of the Ir–FeOx/rutile (Ir: 3 wt%, different Fe/Ir ratio) catalyst. Pretreatment method: the catalysts were reduced at 573 K for 1 h under H2 flow. The y-axis was normalized based on the CO adsorption amount by the CO pulse method. | |
3.4. Kinetics and mechanism
The mass transfer effect was studied at first to avoid its effect towards kinetics. With different stirring rates (100–900 rpm), a short time reaction (0.5 h) of cinnamaldehyde hydrogenation over Ir–FeOx/rutile (Ir: 3 wt%, Fe/Ir = 0.1) was studied at 303 K (Table S16†). The selectivity to cinnamyl alcohol was among all reactions. The conversion was almost the same at different stirring rates. To eliminate the mass transfer effect, the stirring rate was fixed at 500 rpm as a typical condition in our previous work. The dependence of the cinnamaldehyde hydrogenation over Ir–FeOx/rutile (Ir: 3 wt%, Fe/Ir = 0.1) on the substrate concentration was investigated at 303 K (Fig. 11(a), detailed data are presented in Table S17†). The selectivity to cinnamyl alcohol was always ≥93%, except the case of high concentration over Ir/rutile. The reaction orders with respect to the cinnamaldehyde concentration over the Ir–FeOx/rutile (Ir: 3 wt%, Fe/Ir = 0.1) and Ir/rutile (Ir: 3 wt%) catalysts were both 0, which indicates that the adsorption of cinnamaldehyde was saturated on the catalyst surfaces. The addition of FeOx species did not affect the reaction order with respect to the cinnamaldehyde concentration and only increased the activity. In the report for Ir/SiO2 and Ir–ReOx/SiO2 catalysts, the reaction orders with respect to the crotonaldehyde concentration were 0.59 and 0.03, respectively,16 which mean that the adsorption of crotonaldehyde on Ir/SiO2 was weak. The characterization of the SiO2-supported catalysts showed that Ir species can be totally reduced to Ir0. The remaining Ir4+ and/or the TiO2 support at the interface with Ir may strongly bind cinnamaldehyde.74,75 The effect of H2 is shown in Fig. 11(b) (detailed data are presented in Table S18†). The selectivity to cinnamyl alcohol was always ≥93%. The reaction orders toward H2 pressure over Ir/rutile (Ir: 3 wt%) and Ir–FeOx/rutile (Ir: 3 wt%, Fe/Ir = 0.1) were calculated to be 0.74 and 0.97, respectively. The near-first reaction order over Ir–FeOx/rutile suggested that the rate-determining step of the cinnamaldehyde hydrogenation over this catalyst is the nucleophilic addition of the active H−, which has been proposed by our previous work.8,18,45 A similar near-first reaction order toward H2 pressure was commonly observed in M–M′Ox-type hydrogenolysis catalysts of polyols, which are also proposed to be driven by H− species.18,45,46,48 The dependence of H2 pressure on Ir–FeOx/rutile (Ir: 5 wt%, Fe/Ir = 0.25) for 1,2-butanediol hydrogenolysis was also studied in our previous work.46 The reaction order towards H2 pressure was calculated to be 1.1, which was similar to the reaction order in cinnamaldehyde hydrogenation. This result suggests the involvement of similar hydrogen species, namely hydride, in both cinnamaldehyde hydrogenation and 1,2-butanediol hydrogenolysis. The different reaction order for Ir/rutile suggests a different activation scheme of H2. The plain noble metal surface is known to dissociate a H2 molecule to two adsorbed hydrogen atoms, and the hydrogenation of cinnamaldehyde may proceed by such hydrogen atoms.
 |
| | Fig. 11 Kinetics of cinnamaldehyde hydrogenation over Ir/rutile (Ir: 3 wt%) and Ir–FeOx/rutile (Ir: 3 wt%, Fe/Ir = 0.1) catalysts: (a) dependence on cinnamaldehyde concentration and (b) dependence on H2 pressure. Reaction conditions: catalyst = 50 mg; solvent: H2O: (a) 5–20 g; (b) 5 g; reaction temperature = 303 K, reaction time = 2.5 h; H2 pressure: (a) 0.8 MPa, (b) 0.8–2 MPa for Ir/rutile, 0.2–2 MPa for Ir–FeOx/rutile. The catalysts were pretreated before the reaction with liquid-phase reduction (8 MPa H2, 473 K in the autoclave). For the concentration dependence, the solvent amount was changed, while the substrate amount was set at 6 mmol. For the pressure dependence, the H2 pressure was changed. Detailed data are provided in Tables S17 and S18.† | |
To discuss the origin of high selectivity, the reactions of cinnamaldehyde, cinnamyl alcohol and their mixture were compared over Ir–FeOx/rutile and Ir/rutile (Scheme 3). For Ir–FeOx/rutile, under the conditions where cinnamaldehyde can be hydrogenated with 41% conversion, the reaction of cinnamyl alcohol gave 8% conversion to 3-phenyl-1-propanol. The results indicate that the Ir–FeOx/rutile still has some activity in CC hydrogenation, although the activity in CO hydrogenation is much higher. When cinnamaldehyde and cinnamyl alcohol coexisted in the reaction, the reaction of cinnamyl alcohol was much decreased, and the ratio of cinnamaldehyde conversion (26% based on the decrease of cinnamaldehyde; 23% based on the increase of cinnamyl alcohol) to yield a cinnamyl alcohol hydrogenation product (0.7%) was larger than 30. The suppression of cinnamyl alcohol hydrogenation can be explained by stronger adsorption of cinnamaldehyde than that of cinnamyl alcohol. For Ir/rutile, the reactivity of cinnamaldehyde and cinnamyl alcohol was much different even when the reaction was carried out individually. This result suggests that the hydrogen species on the Ir metal surface has enough selectivity in CO hydrogenation.
 |
| | Scheme 3 Reactivity comparison of cinnamaldehyde alone, product alone, and the mixture of cinnamaldehyde and product over Ir/rutile (Ir: 3 wt%) and Ir–FeOx/rutile (Ir: 3 wt%, Fe/Ir = 0.1). Reaction conditions: catalyst = 50 mg; substrate = 6 mmol; solvent: H2O = 5 g; reaction temperature = 303 K; reaction time = 2.5 h; H2 pressure = 0.8 MPa. The catalysts were pretreated before the reaction with liquid-phase reduction (8 MPa H2, 473 K in the autoclave). | |
Here, the structures of the optimized catalyst and the reaction mechanism are compared between cinnamaldehyde hydrogenation and 1,2-butanediol hydrogenolysis. The summary of the characterization of these catalysts is shown in Table 5. Both the optimized catalysts contain Ir0–Fe0 alloy and Fem+ species, modifying the surface of alloy particles, and the ratio of Fe0/Fem+ is low in the catalyst for cinnamaldehyde hydrogenation (Ir: 3 wt%, Fe/Ir = 0.1). According to previous studies, a Fem+ modifier can be the adsorption site for both 1,2-butanediol46 and unsaturated aldehyde.25 The Ir–Fe alloy is essential for the formation of H− species for 1,2-butanediol hydrogenolysis.46,47 In the 1,2-butanediol hydrogenolysis, the sufficient ratio of Fe0/Ir0 is necessary. The catalyst with low reducibility and large Fem+/Fe0 ratio is more effective in the cinnamaldehyde hydrogenation, while in the 1,2-butanediol hydrogenolysis, Fe0 has been reported to be essential.46–48 This behavior can be explained by the requirement of hydride-like species (H−) in hydrogenolysis, while hydride-like nature is beneficial for activity but not necessary in CO hydrogenation, and supplying Fem+ as the adsorption site of substrate is more effective (Scheme 4). The H2-TPR behavior agrees with that less reducible catalysts give higher activity in cinnamaldehyde hydrogenation.
Table 5 Summary of the characterization of Ir–FeOx/TiO2 catalysts (after reaction unless noted)
| Catalyst |
Ir loading amount (wt%) |
Fe/Ir ratio |
Ir valencea (XANES) |
Fe3+/Fe2+/Fe0 (XANES) |
Particle size (TEM, nm) |
D
co
(%) |
|
The average valence of Ir was determined by the white line intensity calibrated by standard references.
D
CO was calculated by the CO adsorption. The fresh catalysts were pre-reduced at 573 K for 1 h in the gas phase.
Irc-r–FeOx/rutile was the catalyst reported in our previous work.46
|
| Ir/rutile |
3 |
— |
2.3 |
— |
3.2 |
20 |
| Ir–FeOx/rutile |
3 |
0.1 |
1.3 |
5/60/35 |
2.1 |
22 |
| G, 573 K |
3 |
0.1 |
1.3 |
14/62/24 |
2.0 |
— |
| G, 673 K |
3 |
0.1 |
1.1 |
0/73/27 |
1.9 |
— |
| Ir/rutileb |
5 |
— |
1.0 |
— |
3.0 |
14 |
| Irc-r–FeOx/rutilec |
5 |
0.25 |
1.9 |
9/26/65 |
3.4 |
13 |
 |
| | Scheme 4 Mechanisms of unsaturated aldehyde hydrogenation and polyol hydrogenolysis over Ir–FeOx/rutile. | |
The structures are also compared among the catalysts with different reduction temperatures (G, 573 K and G, 673 K; G, 473 K was excluded because the reduction degree of Ir was much different from that of the other catalysts). With the increase in reduction temperature, the Ir and Fe valences decreased, while the particle sizes were unchanged. Comparing the structure change and performance change in Fig. 4 also demonstrates that the increase of Fe0 has a rather negative effect on hydrogenation activity. The presence of Fem+ is more important.
4. Conclusion
Among Ir–M′Ox/support catalysts, Ir–FeOx/rutile (Ir: 3 wt%, Fe/Ir = 0.1) is particularly effective in the hydrogenation of cinnamaldehyde to cinnamyl alcohol. Compared with Ir–ReOx catalysts, whose combination has been reported to be effective, the optimum molar ratio of modifier to Ir in the Ir–FeOx/rutile catalyst was smaller (0.25 in Ir–ReOx/rutile), and the activity of optimized Ir–FeOx/rutile was higher than that of Ir–ReOx/rutile. The Ir–FeOx/rutile catalyst can be applied to the selective hydrogenation of various unsaturated aldehydes to unsaturated alcohols. The Ir–FeOx/rutile catalyst can maintain its reactivity and selectivity during 4 times reuse. While Ir–FeOx/rutile catalysts have been reported to be active in C–O hydrogenolysis of 1,2-butanediol to 2-butanol, the dependence of performance on the composition is different between cinnamaldehyde hydrogenation and 1,2-butanediol hydrogenolysis. While the catalysts for both reactions contain Ir–Fe alloys and Fem+ species modifying the alloy surface, the modifying Fem+ is more important in the cinnamaldehyde hydrogenation than 1,2-butanediol hydrogenolysis.
Data availability
The authors confirm that the data supporting the findings of this study are available within the article and/or its ESI.†
Author contributions
Z. D.: design, methodology, data analysis, writing. Y. N.: supervision, review, funding acquisition. B. L.: data analysis. S. M.: data analysis. M. Y.: data analysis, review. K. T.: supervision, review, funding acquisition.
Conflicts of interest
There are no conflicts to declare.
Acknowledgements
This work is supported by JSPS KAKENHI 23K20034, 23H0404 and 23K26451. We are also thankful to the JST SPRING “JPMJSP2114” from Tohoku University Advanced Graduate School and the JSPS “K24KJ04090”. TEM measurements were assisted by the technical division of the School of Engineering, Tohoku University and Prof. Kiyoshi Kanie's group at the Institute of Multidisciplinary Research for Advanced Materials, Tohoku University. XPS measurements were assisted by Ms. Aya Arakawa (technical division of the School of Engineering, Tohoku University).
References
- X. Zhao, Y. Chang, W. J. Chen, Q. Wu, X. Pan, K. Chen and B. Weng, ACS Omega, 2022, 7, 17–31 CrossRef CAS PubMed.
- X. Lai, X. Liang, S. Wang and Y. Xu, ChemCatChem, 2024, 16, e202400716 CrossRef CAS.
- M. G. Prakash, R. Mahalakshmy, K. R. Krishnamurthy and B. Viswanathan, Catal. Today, 2016, 263, 105–111 CrossRef CAS.
- N. Yamanaka and S. Shimazu, Eng, 2022, 3, 60–77 CrossRef.
- V. Bernardin, R. Philippe, L. Vanoye, C. de Bellefon and A. Favre-Réguillon, Ind. Eng. Chem. Res., 2024, 63, 6829–6836 CAS.
- R. E. Davis and J. Carter, Tetrahedron, 1966, 22, 495–504 CrossRef CAS.
- H. C. Brown and P. V. Ramachandran, Reduction in Organic Synthesis, ACS Symp. Ser., 1996, 641, 1–30 CrossRef CAS.
- M. Tamura, Y. Nakagawa and K. Tomishige, J. Jpn. Pet. Inst., 2019, 62, 106–119 CrossRef CAS.
- X. Lan and T. Wang, ACS Catal., 2020, 10, 2764–2790 CrossRef CAS.
- M. Luneau, J. S. Lim, D. A. Patel, E. C. H. Sykes, C. M. Friend and P. Sautet, Chem. Rev., 2020, 120, 12834–12872 CrossRef CAS PubMed.
- Y. Yuan, S. Yao, M. Wang, S. Lou and N. Yan, Curr. Org. Chem., 2013, 17, 400–413 CrossRef CAS.
- P. Adamski, H. Zhang, S. Kaur, X. Chen, C. Liang and M. Armbrüster, Chem. Mater., 2024, 36, 10383–10407 CrossRef CAS.
- V. Ponec, Appl. Catal., A, 1997, 149, 27–48 CrossRef CAS.
- X. F. Wang, X. H. Liang, P. Geng and Q. B. Li, ACS Catal., 2020, 10, 2395–2412 CrossRef CAS.
- H. Shi, T. Su, Z. Qin and H. Ji, Front. Chem. Sci. Eng., 2024, 18, 64–93 CrossRef CAS.
- M. Tamura, K. Tokonami, Y. Nakagawa and K. Tomishige, Chem. Commun., 2013, 49, 7034–7036 RSC.
- Q. Liu, Q. Liu, Y. Chen, Y. Li, H. Su, Q. Liu and G. Li, Chin. Chem. Lett., 2022, 33, 374–377 CrossRef CAS.
- M. Tamura, K. Tokonami, Y. Nakagawa and K. Tomishige, ACS Catal., 2016, 6, 3600–3609 CrossRef CAS.
- P. Reyes, M. C. Aguirre, G. Pecchi and J. L. G. Fierro, J. Mol. Catal. A:Chem., 2000, 164, 245–251 CrossRef CAS.
- A. Jia, W. Zhang, H. Peng, Y. Zhang, T. Song, L. Li, Y. Ye, Y. Wang, M. Luo, D.-L. Chen, W. Huang and J.-Q. Lu, J. Catal., 2023, 425, 57–69 CrossRef CAS.
- A. I. Osman, A. Ayati, P. Krivoshapkin, B. Tanhaei, M. Farghali, P.-S. Yap and A. Abdelhaleem, Coord. Chem. Rev., 2024, 514, 215900 CrossRef CAS.
- C. Tang, F. Zhou, Y. Wen, Y. Xu, A. Jia, M. Luo and J. Lu, Appl. Catal., A, 2021, 623, 118269–118278 CrossRef CAS.
- Y.-M. Xu, W.-B. Zheng, Y.-M. Hu, C. Tang, A.-P. Jia and J.-Q. Lu, J. Catal., 2020, 381, 222–233 CrossRef CAS.
- M. Tamura, D. Yonezawa, T. Oshino, Y. Nakagawa and K. Tomishige, ACS Catal., 2017, 7, 5103–5111 CrossRef CAS.
- Q. Yu, K. K. Bando, J.-F. Yuan, C.-Q. Luo, A.-P. Jia, G.-S. Hu, J.-Q. Lu and M.-F. Luo, J. Phys. Chem. C, 2016, 120, 8663–8673 CrossRef CAS.
- X. Ning, Y.-M. Xu, A.-Q. Wu, C. Tang, A.-P. Jia, M.-F. Luo and J.-Q. Lu, Appl. Surf. Sci., 2019, 463, 463–473 CrossRef CAS.
- Y.-M. Hu, L. Guan, A.-P. Jia, Y. Wang, B.-T. Teng and J.-Q. Lu, J. Catal., 2024, 430, 115314 CrossRef CAS.
- J.-F. Yuan, C.-Q. Luo, Q. Yu, A.-P. Jia, G.-S. Hu, J.-Q. Lu and M.-F. Luo, Catal. Sci. Technol., 2016, 6, 4294–4305 RSC.
- H. Guo, H. Li, K. Jarvis, H. Wan, P. Kunal, S. G. Dunning, Y. Liu, G. Henkelman and S. M. Humphrey, ACS Catal., 2018, 8, 11386–11397 CrossRef CAS.
- J. Zhao, J. Ni, J. Xu, J. Xu, J. Cen and X. Li, Catal. Commun., 2014, 54, 72–76 CrossRef CAS.
- H. Yu, J. Zhao, C. Wu, B. Yan, S. Zhao, H. Yin and S. Zhou, Langmuir, 2021, 37, 1894–1901 CrossRef CAS PubMed.
- H. Rojas, G. Borda, P. Reyes, J. J. Martínez, J. Valencia and J. L. G. Fierro, Catal. Today, 2008, 133–135, 699–705 CrossRef CAS.
- Q. Yu, X. Zhang, B. Li, J. Lu, G. Hu, A. Jia, C. Luo, Q. Hong, Y. Song and M. Luo, J. Mol. Catal. A:Chem., 2014, 392, 89–96 CrossRef CAS.
- W. Lin, H. Cheng, L. He, Y. Yu and F. Zhao, J. Catal., 2013, 303, 110–116 CrossRef CAS.
- S. He, L. F. Xie, M. W. Che, H. C. Chan, L. C. Yang, Z. P. Shi, Y. Tang and Q. S. Gao, J. Mol. Catal. A:Chem., 2016, 425, 248–254 CrossRef CAS.
- Q. Liu, J. Wu, J. Kang, Q. Liu, P. Liao and G. Li, Nanoscale, 2022, 14, 15462–15467 RSC.
- S. Hayashi and T. Shishido, ACS Org. Inorg. Au, 2023, 3, 283–290 CrossRef CAS PubMed.
- T. Chen, Z. Shi, G. Zhang, H. C. Chan, Y. Shu, Q. Gao and Y. Tang, ACS Appl. Mater. Interfaces, 2018, 10, 42475–42483 CrossRef CAS PubMed.
- X. Li, J. Luo and C. Liang, Mol. Catal., 2020, 490, 110976 CrossRef CAS.
- J. M. Keels, X. Chen, S. Karakalos, C. Liang, J. R. Monnier and J. R. Regalbuto, ACS Catal., 2018, 8, 6486–6494 CrossRef CAS.
- T. Mitsudome, Y. Mikami, M. Matoba, T. Mizugaki, K. Jitsukawa and K. Kaneda, Angew. Chem., Int. Ed., 2012, 51, 136–139 CrossRef CAS PubMed.
- J. Luiz Fiorio, R. R. G. Guerra, B. Martín-Matute and L. M. Rossi, ChemCatChem, 2024, 16, e202400207 CrossRef CAS.
- H. Cai, R. Schimmenti, H. Nie, M. Mavrikakis and Y.-H. C. Chin, ACS Catal., 2019, 9, 9418–9437 CrossRef CAS.
- L. Liu, S. Kawakami, Y. Nakagawa, M. Tamura and K. Tomishige, Appl. Catal., B, 2019, 256, 117775 CrossRef.
- L. Liu, T. Asano, Y. Nakagawa, M. Tamura, K. Okumura and K. Tomishige, ACS Catal., 2019, 9, 10913–10930 CrossRef CAS.
- B. Liu, Y. Nakagawa, C. Li, M. Yabushita and K. Tomishige, ACS Catal., 2022, 12, 15431–15450 CrossRef CAS.
- B. Liu, Y. Nakagawa, M. Yabushita and K. Tomishige, ACS Catal., 2023, 13, 8485–8502 CrossRef CAS.
- B. Liu, Y. Nakagawa, M. Yabushita and K. Tomishige, J. Am. Chem. Soc., 2024, 146, 9984–10000 CrossRef CAS PubMed.
- B. Pholjaroen, N. Li, Y. Huang, L. Li, A. Wang and T. Zhang, Catal. Today, 2015, 245, 93–99 CrossRef CAS.
- Z. Wang, B. Pholjaroen, M. Li, W. Dong, N. Li, A. Wang, X. Wang, Y. Cong and T. Zhang, J. Energy Chem., 2014, 23, 427–434 CrossRef.
- A. J. Pamphile-Adrian, P. P. Florez-Rodriguez, Y. Xing and F. B. Passos, Catal. Today, 2025, 443, 114952 CrossRef CAS.
- S. Chanklang, W. Mondach, P. Somchuea, T. Witoon, M. Chareonpanich, K. Faungnawakij and A. Seubsai, Catal. Today, 2022, 397–399, 356–364 CrossRef CAS.
- C. Deng, X. Duan, J. Zhou, X. Zhou, W. Yuan and S. L. Scott, Catal. Sci. Technol., 2015, 5, 1540–1547 RSC.
- A. J. Pamphile-Adrián, P. P. Florez-Rodriguez, M. H. M. Pires, G. Perez and F. B. Passos, Catal. Today, 2017, 289, 302–308 CrossRef.
- W. Luo, Y. Lyu, L. Gong, H. Du, T. Wang and Y. Ding, RSC Adv., 2016, 6, 13600–13608 RSC.
- K. Tomishige, Y. Nakagawa and M. Tamura, Green Chem., 2017, 19, 2876–2924 RSC.
- C.-B. Hong, G. Li and H. Liu, Green Chem., 2023, 25, 3515–3523 RSC.
- B. Liu, N. Sekine, Y. Nakagawa, M. Tamura, M. Yabushita and K. Tomishige, ACS Sustainable Chem. Eng., 2022, 10, 1220–1231 CrossRef CAS.
- J. Wei, M. Zhu, B. Liu, N. Wang, J. Liu, K. Tomishige, S. Liu and G. Liu, Angew. Chem., Int. Ed., 2023, 62, e202310505 CrossRef CAS PubMed.
- Y. Amada, Y. Shinmi, S. Koso, T. Kubota, Y. Nakagawa and K. Tomishige, Appl. Catal., B, 2011, 105, 117–127 CrossRef CAS.
- J. Liao, W. Ding, S. Tao, Y. Nie, W. Li, G. Wu, S. Chen, L. Li and Z. Wei, Chin. J. Catal., 2016, 37, 1142–1148 CrossRef CAS.
- L. M. P. van Gruijthuijsen, G. J. Howsmon, W. N. Delgass, D. C. Koningsberger, R. A. van Santen and J. W. Niemantsverdriet, J. Catal., 1997, 170, 331–345 CrossRef CAS.
- T. Lu, J. Lin, X. Liu, X. Wang and T. Zhang, Langmuir, 2016, 32, 2771–2779 CrossRef CAS PubMed.
- H. Yu, W. Tang, K. Li, S. Zhao, H. Yin and S. Zhou, ACS Appl. Mater. Interfaces, 2019, 11, 6958–6969 CrossRef CAS PubMed.
- F. Shen, Y. Wang, G. Qian, W. Chen, W. Jiang, L. Luo and S. Yin, Appl. Catal., B, 2020, 278, 119327 CrossRef CAS.
- M. Luneau, J. S. Lim, D. A. Patel, E. C. H. Sykes, C. M. Friend and P. Sautet, Chem. Rev., 2020, 120, 12834–12872 CrossRef CAS PubMed.
- Y. Wang, S. Han, Y. Liu, Y. Li, Z. Sun and J. Luo, Chem. – Asian J., 2020, 15, 3350–3355 Search PubMed.
- D. N. G. Krishna and J. Philip, Appl. Surf. Sci. Adv., 2022, 12, 100332 CrossRef.
- C. Wang, F. Yang and L. Feng, Nanoscale Horiz., 2023, 8, 1174–1193 RSC.
- C. K. Choong, Y. H. Du, C. K. Poh, S. W. D. Ong, L. W. Chen and A. Borgna, Appl. Catal., B, 2024, 345, 123630 Search PubMed.
- M. Newville, J. Synchrotron Radiat., 2001, 8, 96–100 CrossRef CAS PubMed.
- F. W. Kutzler, K. O. Hodgson, D. K. Misemer and S. Doniach, Chem. Phys. Lett., 1982, 92, 626–630 CrossRef CAS.
- A. Erdőhelyi, K. Fodor and G. Suru, Appl. Catal., A, 1996, 139, 131–147 Search PubMed.
- A. Jia, Y. Zhang, T. Song, Z. Zhang, C. Tang, Y. Hu, W. Zheng, M. Luo, J. Lu and W. Huang, J. Catal., 2021, 395, 10–22 CrossRef CAS.
- A. Jia, Y. Zhang, T. Song, Y. Hu, W. Zheng, M. Luo, J. Lu and W. Huang, Chin. J. Catal., 2021, 42, 1742–1754 CrossRef CAS.
Footnote |
| † Electronic supplementary information (ESI) available: Supporting tables for reagents, detailed reaction data for Figures, reaction data for the effect of the loading amount of Ir/rutile and the effect of main active metal; detailed ICP results; and supporting Figures for XRD, TEM, XPS and XANES fitting. See DOI: https://doi.org/10.1039/d5cy00087d |
|
| This journal is © The Royal Society of Chemistry 2025 |
Click here to see how this site uses Cookies. View our privacy policy here. 
 Open Access Article
 This Open Access Article is licensed under a
  *ab,
Ben
Liu
a,
Shogen
Mihara
a,
Mizuho
Yabushita
*ab,
Ben
Liu
a,
Shogen
Mihara
a,
Mizuho
Yabushita


