
 Open Access Article
 This Open Access Article is licensed under a Creative Commons Attribution-Non Commercial 3.0 Unported Licence
Perovskite-derived MnOx/LaMnO3 nanocomposites to boost CO oxidation activity†
Andrea
Felli‡
 a,
Alessandra
Toso‡
a,
Andrea
Braga
a,
Sara
Colussi
a,
Marta
Boaro
a,
Jordi
Llorca
b,
Byron
Truscott
c,
Christine
Artner-Wallner
c and
Alessandro
Trovarelli
*a
a,
Alessandra
Toso‡
a,
Andrea
Braga
a,
Sara
Colussi
a,
Marta
Boaro
a,
Jordi
Llorca
b,
Byron
Truscott
c,
Christine
Artner-Wallner
c and
Alessandro
Trovarelli
*a
aPolytechnic Department, University of Udine, Via del Cotonificio 108, 33100, Udine, Italy. E-mail: alessandro.trovarelli@uniud.it
bInstitute of Energy Technologies, Department of Chemical Engineering, and Center for Research in Multiscale Science and Engineering, Universitat Politècnica de Catalunya, EEBE, Eduard Maristany 10-14, 08019, Barcelona, Spain
cTreibacher Industrie AG, Auer-von-Welsbach-Straße 1, 9330, Althofen, Austria
First published on 30th January 2025
Abstract
In this study, the impact of nitric acid treatment parameters, specifically acid concentration and exposure time, on the morphological, redox, and catalytic properties of LaMnO3 for CO oxidation was thoroughly investigated. The samples were characterised by ICP analysis, N2 adsorption/desorption measurements, XRD, H2-TPR, XPS, HRTEM and HAADF-STEM. Acidic treatment of LaMnO3 significantly increases the surface area, creating a new porous structure. Under mild treatment conditions, the composition, crystal structure and morphology are also modified, resulting in MnOx/LaMnO3 catalysts with various Mn oxide species forming needle-like structures segregated on a highly defective La1−xMnO3−δ perovskite. These MnOx/LaMnO3 nanocomposites exhibited superior CO oxidation activity, achieving 10% CO conversion (T10) in the range of 375–396 K, compared to 459 K for the pristine perovskite. This enhanced performance is attributed not only to the increased surface area, but also to the exposure of reactive MnOx species on the surface of the perovskite and, crucially, to the interfacial synergism between MnOx and LaMnO3. This synergy enhances oxygen exchange, and it improves the reducibility of the nanocomposite at low temperatures, providing a better thermal stability of active phases at elevated temperatures. However, the benefits of the acid treatment are lost under more severe conditions that transform LaMnO3 into bulk Mn oxide phases (Mn2O3, Mn3O4), or pure MnO2, highlighting the critical role of MnOx/LaMnO3 interface properties for CO oxidation.
Introduction
Perovskite oxides (ABO3) represent promising candidates for various catalytic applications and a valuable alternative to precious metal-based catalysts due to their lower costs, flexible composition, and high thermal stability.1–4 Among these materials, LaMnO3 (LM) based perovskites have attracted considerable attention for hydrocarbons,5,6 NO,7,8 CO9,10 and volatile organic compounds (VOC) oxidation.11–14 The catalytic performance of LaMnO3 is strictly related to its textural properties, the nature and concentration of oxygen species, and the number of Mn redox couples (Mn4+ ⇌ Mn3+) on the surface and in the structure. The formation of surface oxygen vacancies and the promotion of Mn4+/Mn3+ redox equilibrium positively affect the catalytic activity.4,6Sol–gel synthesis,15,16 combustion method,9 spray pyrolysis17,18 and co-precipitation17–19 are the most common techniques to synthesize LaMnO3. Regardless of the preparation method, the formation of a homogeneous perovskite phase requires high-temperature treatments – usually above 1073 K – that undermine its porous morphology and specific surface area, and therefore the number of available active sites.1 Consequently, conventional LaMnO3 can hardly compete with precious metal-based catalysts deposited on high surface area supports at low temperature. For this reason, different approaches, such as changing the composition or modifying the synthesis method, have been adopted to improve the textural properties and to increase the number of active sites.
One of the most studied strategies is metal doping, i.e., the partial substitution of La or Mn with other metals such as Ag, Sr, Co, and Ni.15,20–23 The introduction of cations with different sizes and/or different oxidation states allows the formation of structural/surface defects and increases the surface or bulk fraction of Mn4+. Together with metal doping, several efforts have also been carried out to engineer textural properties of LaMnO3-based perovskites by modifying the traditional synthesis methods, such as the use of templates24–26 or solvent-free synthesis27 or other physical and chemical post-treatments.28–36 However, these latter strategies could be rather complex and expensive to employ at an industrial scale.
The post-treatment of LaMnO3 in acid solutions has proven to be a straightforward and effective laboratory-scale method to modulate the textural and morphological properties of this perovskite. The approach has been successfully used to enhance its catalytic activity in various oxidation reactions including VOC,28–32 NOx33 as well as for the oxidation of CO.34–36 Although the specific impact of the acid treatment varies depending on the investigated reaction, the research has consistently shown some common outcomes. Acidic treatment selectively removes La3+ cations from the perovskite lattice, structurally transforming LaMnO3 into a supported MnOx/LaMnO3-type catalyst or a pure crystalline/amorphous MnOx. The leaching process results in a larger surface area and the formation of a meso/macro-porous network, leading to the exposure of more Mn4+ species as well as the creation of oxygen vacancies and structural defects on the surface of LaMnO3-key factors that significantly increase the oxidation activity of the final catalyst.28–36
Among the different parameters of acid treatment, the duration of the acidic exposure has been recognized as a critical factor in the dissolution process and it is frequently explored in the literature. For instance, Zhao et al. studied the effect of varying nitric acid treatment durations on LaMnO3 for NO oxidation, ranging from 1 to 5 hours.33 Similarly, Xu et al. examined acid exposure times from a few minutes (10′) to several hours (22 h) for formaldehyde oxidation,28 while Chen et al. explored different treatment durations for the catalytic oxidation of CH4.32 Despite these studies, the impact of other parameters, such as acid concentration, has been much less studied leaving a gap in understanding how to optimize the treatment parameters for a potential industrial-scale up of this method.
The current study aims at filling this gap by conducting a comprehensive investigation into the combined effects of treatment time and acid concentration on the textural, morphological, redox, and catalytic properties of LaMnO3, focusing on CO oxidation.
Materials and methods
Catalysts preparation
Acid-modified LaMnO3 was prepared starting from commercial LaMnO3 (Treibacher Industrie AG) calcined at 973 K for 4 h. Typically, 1 g of LaMnO3 (LM) was treated in 240 ml of HNO3 solution (65–69% VWR Chemicals) under stirring at room temperature. The solid was then washed with distilled water, centrifuged three times and dried overnight at 373 K. Nitric acid concentration and time of treatment were opportunely changed to evaluate their effect on the final material: LaMnO3 was treated in 0.025 M, 0.1 M, 0.8 M, 3 M, 9 M and 15 M HNO3 solution for 1 hour, then the HNO3 concentration was fixed at 3 M and the treatment time was extended to 6 and 18 hours. In the following section, the samples will be identified according to the sample code “LM c-t”, where “c” indicates HNO3 molar concentration and “t” denotes the treatment time (h). Small amounts of sample were calcined for 1 h at 823 K in static air for further characterizations, and to study their thermal stability.Catalysts characterization
Inductively coupled plasma-mass spectrometry (ICP-MS) was commissioned to Mikroanalytischen Labor Pascher of Remagen (DE) to quantify La and Mn content. BET surface area and porosity measurements were carried out by nitrogen adsorption/desorption at 77 K in a Micrometrics Tri-Star 3000 apparatus. Each sample (about 250 mg) was evacuated at 423 K for 2 h to remove adsorbed species. The powder was then cooled under vacuum to 77 K before N2 was introduced incrementally. The evaluation of the adsorption/desorption branches of the isotherm and the hysteresis between them provides information about the size and volume of pores; BET and BJH methods were employed for the calculation of surface area and pore size distribution, respectively. X-ray patterns were recorded on a Philips X'Pert diffractometer equipped with an X'Celerator detector, using Ni-filtered Cu Kα radiation (λ = 1.542 Å) and operating at 40 kV and 40 mA, with a step size of 0.02° and 40 counts per step. Microstructural characterization by high-resolution transmission electron microscopy (HRTEM) and high-angle annular dark-field scanning transmission electron microscopy (HAADF-STEM) was performed on a JEOL 2010F instrument equipped with a field emission gun and at an accelerator voltage of 200 kV. X-ray photoelectron spectroscopy (XPS) was performed with a SPECS system using an Al X-ray source (150 W) and a 9-channel Phoibos detector at a pressure below 10−7 Pa. Quantification was carried out using Shirley baselines, Gaussian–Lorentzian line shapes and spin–orbit constrains on relative peak areas and positions. Temperature programmed reduction (H2-TPR) experiments were carried out in a Micromeritics Autochem II apparatus by loading 50 mg of sample in a U-shaped quartz reactor supported on a quartz wool bed. Before the reduction, the catalyst was pre-treated in air at 823 K for 1 h. Then, the sample was cooled down to 323 K by purging with pure N2, and the gas was switched to a mixture of 5% H2/N2 (35 ml min−1) and the temperature was increased up to 1173 K at a ramp rate of 10 K min−1, while monitoring hydrogen consumption with a calibrated TCD detector. During selected TPR experiments, samples were collected for XRD analysis by stopping the heating ramp at a fixed temperature, then cooling the sample in pure nitrogen to preserve the oxidized-reduced state of the catalysts.XRD, BJH, and BET analysis were carried out on both fresh (after overnight drying at 373 K) and calcined materials (at 823 K in air for 1 h) to evaluate the morphological evolution right after the acid treatment and in operative conditions. HRTEM and HAADF-STEM characterization was carried out only on fresh materials, while XPS and TPR analysis were performed on the calcined ones.
Catalytic test
CO oxidation tests were carried out by loading 200 mg of fresh catalyst in pellets (pellet size 200–400 μm) into a quartz microreactor (i.d. 6 mm) on a quartz wool bed. The reactor was placed in a tubular furnace, and the catalyst was exposed to a mixture of 1% vol CO, 10% vol O2 in N2 with a total flow rate of 300 ml min−1 (GHSV of ∼135![[thin space (1/6-em)]](https://www.rsc.org/images/entities/char_2009.gif) 000 h−1). The sample was heated up to 823 K at 10 K min−1. Inlet and outlet gas composition was analysed with an online MKS 2030 MultiGas FT-IR Analyzer. CO conversion was calculated as follows:
000 h−1). The sample was heated up to 823 K at 10 K min−1. Inlet and outlet gas composition was analysed with an online MKS 2030 MultiGas FT-IR Analyzer. CO conversion was calculated as follows:where [CO]in and [CO]out are the inlet and outlet CO concentration, respectively. Specific rate of CO oxidation (μmol s−1 m−2) were calculated at 390 K.
The same procedure was repeated twice on the same catalyst. The second cycle was used as representative of the catalytic activity.
Results and discussion
Composition, structural, and textural properties of acid-treated samples
Table 1 summarizes the treatment conditions of LaMnO3, i.e., HNO3 concentration and treatment duration, along with the corresponding elemental composition, and the textural properties of the resulting materials, before and after their calcination. The molar ratio between La and Mn changes significantly, and La/Mn decreases as the concentration or the time of the treatment increases in all the treated samples: La/Mn of pristine LM is 0.96 – quite close to the nominal value of 1 – and it ranges from 0.59 (with very diluted solutions) to almost 0 (when the treatment time is very long, or the acid solution is very concentrated). According to the La/Mn molar ratio obtained, the strength of the treatment is classified as weak (1.0 < La/Mn < 0.4), medium (0.4 < La/Mn < 0.1), or strong (0.1 < La/Mn < 0.0).| Sample name | [HNO3] (mol L−1) | Time (h) | Treatment type | Molar La/Mna | BET SA (m2 g−1) | Average pore volumeb (cm3 g−1) | Average pore sizeb (Å) | |||
|---|---|---|---|---|---|---|---|---|---|---|
| Fresh | Calcined | Fresh | Calcined | Fresh | Calcined | |||||
| a La/Mn molar ratio of the material after treatment measured by ICP analysis on the solid powder. b Obtained from the desorption branch of N2 adsorption /desorption isotherm. | ||||||||||
| LM | — | — | — | 0.96 | 20 | — | 0.13 | — | 134 | — |
| LM 0.025-1 | 0.025 | 1 | Weak | 0.59 | 102 | 28 | 0.29 | 0.22 | 89 | 224 |
| LM 0.1-1 | 0.1 | 1 | Weak | 0.46 | 99 | 35 | 0.24 | 0.14 | 77 | 123 |
| LM 0.8-1 | 0.8 | 1 | Weak | 0.41 | 97 | 31 | 0.28 | 0.12 | 98 | 147 |
| LM 3-1 | 3 | 1 | Weak | 0.45 | 80 | 40 | 0.20 | 0.23 | 79 | 194 |
| LM 3-6 | 3 | 6 | Medium | 0.18 | 158 | 80 | 0.60 | 0.18 | 132 | 71 |
| LM 3-18 | 3 | 18 | Strong | 0.01 | 166 | 13 | 0.55 | 0.07 | 112 | 182 |
| LM 9-1 | 9 | 1 | Strong | 0.03 | 138 | 10 | 0.45 | 0.16 | 111 | 335 |
| LM 15-1 | 15 | 1 | Strong | 0.09 | 165 | 7 | 0.62 | 0.03 | 132 | 121 |
Table 1, Fig. S1† and 1 report the results of N2 adsorption/desorption characterization, providing information on the morphological properties and porosity of the samples. All the samples show a type IV adsorption/desorption isotherm (Fig. S1†), and the hysteresis loop is of H3-type, associated with the presence of a mesoporous structure.37 Commercial LM exhibits low BET surface area and pore volume, 20 m2 g−1 and 0.13 cm3 g−1, respectively. The acid treatment causes an increase in the specific surface area of LM, ranging from 80 to 166 m2 g−1, as the concentration or the duration of acidic treatment increases. The analysis of the BJH pore size distribution reported in Fig. 1 shows that the enhancement in SA after the acid treatment is correlated with the formation of meso-porous structures, which could depend on the structural rearrangement in the perovskite due to the different acid treatments as already reported in literature34,38 and discussed further on. Interesting, the samples treated at weak/medium HNO3 concentrations (0.025–3 M solutions) show a bimodal pore distribution with small pores of diameter of 30–40 Å and larger pores of 100 Å on average, while a broader pore size distribution ranging from 30 to 700 Å, (typical of meso- and macro-porous materials) characterizes the samples treated at higher concentrations (9–15 M) (Fig. 1a). The same trend can be observed by variating the treatment time from 1 h to 18 h, since LM 3-1 and LM 3-6 samples show the co-presence of micro-, meso- and macro-pores, while only meso- and macro-porosity is present on LM 3-18 (Fig. 1c). A partial or total collapse of the porous structure occurred following calcination; the micro-porosity component is partially maintained, and the meso-pores are more stable in the samples treated with acid concentration from 0.025 M to 3 M; instead, the porous network formed after the acid treatment is completely lost in the samples treated at higher concentration (Fig. 1b). The same behaviour is observable by varying the duration of acid etching: catalysts LM 3-1 and LM 3-6 treated for 1 hour and 6 hours, respectively, exhibit a significantly more stable porous structure than that of catalyst LM 3-18 treated for 18 hours, (Fig. 1d).
 | ||
| Fig. 1 Pore distribution of acid treated LaMnO3 samples: in a) fresh LM samples (i.e., after the acid treatment) treated with different acid concentrations; in b) the corresponding calcined samples (i.e., after a calcination of 1 hour at 823 K in static air); in c) fresh LM samples treated by variation the duration of the treatment; in d) the corresponding calcined samples. | ||
The partial or total collapse of the micro and mesoporous structures during the thermal treatment occurs with a concomitant decrease in surface area and average pore volume. The extent of the effect depends on the treatment conditions.
The surface area after the calcination is 27–35% of that of fresh catalysts for the samples treated with diluted solution (LM 0.025-1, LM 0.1-1, and LM 0.8-1), while it is ∼50% adopting mild conditions (LM 3-1 and LM 3-6). For stronger treatment conditions (LM 3-18, LM 9-1, LM 15-1) the surface area collapsed after calcination, ranging between 5–7% compared to the starting values.
In conclusion, both the surface area and porosity of LaMnO3 can be tuned by changing the acid concentration and the duration of the treatment, and the thermal stability of the resulting materials seems to be higher when moderate treatment conditions are applied.
X-Ray diffraction results (Fig. 2) showed that the modifications in composition and surface area/porosity correlate with structural changes in the starting perovskite. The pristine LM exhibits the diffraction pattern of a perovskite phase with a rhombohedral symmetry (PDF 86-1231), along with peaks related to minor segregation of Mn2O3 (PDF 80-0382) at 2θ = 38.4°. In the samples treated under diluted concentration (0.025–3 M) for 1 h (Fig. 2a), the perovskite structure is still the main phase, but several new diffraction peaks, attributed to tetragonal Mn3O4 (PDF 80-0382), and to Mn2O3 (PDF 80-0382), appear, revealing the formation of a MnOx/LaMnO3 composite material. The increase in HNO3 concentration (above 3 M) results in a significant degradation of the original structure (LM 9-1 and LM 15-1), since the diffraction peaks of LaMnO3 completely disappear, indicating the collapse of the perovskite structure due to a complete leaching of La, as confirmed by ICP analysis (Table 1). Particularly, LM 9-1 consists of a mixture of Mn2O3 and Mn3O4, while only MnO2 is visible in LM 15-1. After the calcination at 823 K (Fig. 2b), the samples treated in the range 0.025–3 M for 1 hour show X-ray patterns like those observed before calcination, and the MnOx phases seem to be thermally stable. Strong-treated samples, composed of a mixture of different MnOx, show instead significant changes: on LM 9-1 and LM 15-1, Mn2O3 and MnO2 degraded mostly to Mn3O4. This is in line with the literature which reports that Mn(IV) oxide phases can be unstable at high temperature.39,40 The effect of the duration of acid exposure was also studied using HNO3 concentration of 3 M. The sample treated for 6 hours (LM 3-6) results into a mixture of perovskite phase, Mn2O3, Mn3O4 and MnO2 (Fig. 2c). Conversely, by extending the treatment for 18 hours, only the diffraction peaks of MnO2 can be detected, as in LM 15-1. After calcination, LM 3-6 diffractogram shows an amorphization containing the same phases of the starting sample, while that of LM 3-18 shows only the presence of Mn2O3, thus confirming that MnOx/LaMnO3 composites have a good thermal stability. The results of XRD are consistent with previous studies reporting that the progressive leaching of La from the pristine perovskite, shown by ICP-MS analysis in Table 1, leads to the formation of different Mn oxides.30,34 In summary, the concentration of HNO3 and treatment exposure time are interchangeable parameters for dissolving the perovskites and can be appropriately combined to optimize the process in terms of safety and duration to tailor the properties of the perovskite-derived oxides.
 | ||
| Fig. 2 X-ray diffractograms between 20–50 degrees of acid treated LaMnO3 samples: in a) fresh LM samples treated with different acid concentrations; in b) the corresponding calcined samples; in c) fresh LM samples treated by variation the duration of the treatment; in d) the corresponding calcined samples. ●: LaMnO3; ♦: MnO2; ■: Mn2O3; □: Mn3O4. | ||
Based on the analysis of the results we can conclude that:
i) Weak treatments, obtained by diluted solutions (0.025–0.8 M) and a short exposure time (1 h), result in minor changes: the perovskite is the main phase, and only Mn2O3 and Mn3O4 are visible after the treatment; these samples have good thermal stability in terms of surface area, porosity, and MnOx phases formed by La leaching.
ii) Medium treatments, with more than 1 hour of treatment time and 3 M acid solution, cause an important deterioration of the perovskite structure and the formation of MnO2; both the phases are visible from the diffraction patterns, and they are structurally and morphologically stable upon thermal treatment.
iii) Strong treatments (high concentration (9 M, 15 M for 1 h) or prolonged exposure time (3 M for 18 h), result in the complete dissolution of La and the destruction of the perovskite structure, which is no longer detectable by XRD, leaving a mixture of MnOx as the resulting phases. The latter oxides are not thermally stable and undergo further structural and morphological changes after calcination with a collapse of porosity and surface area.
HAADF-STEM-EDX and HRTEM investigations were carried out on some selected samples to characterize the effects of treatments on the perovskite at nanoscale level. As-received LM (Fig. 3a) is composed of nanoparticles of about 20 nm, forming a porous network with large and small pores of about 50–100 nm and 2–10 nm respectively. Fig. 3b shows the STEM image of fresh LM 3-1 as representative of a weak/moderate acid-treated sample. The initial morphology of LM disappeared, and the sample is mostly composed of aggregates of small particles of about 5–30 nm in size. Notably, new needle-like nanostructures appeared, and the porosity seems to be increased. These structures are more abundant in LM 3-6 (Fig. 3c and d) when the acid treatment was longer. The needle structures are roughly 30–40 nm in length and 5–6 nm in thickness as shown at higher magnification in Fig. 3d. STEM image of LM 15-1 (Fig. 3e and f) illustrates the morphology of a strongly acid-treated sample. In this case, the sample is mostly constituted of nano-platelets slightly smaller in comparison to those observed on LM 3-6, around 20–30 nm in length and 4–5 nm in thickness. Similar “desert-rose” and needle morphologies have been observed in other studies and they are linked to the formation of ε-MnO2.28,32 It can be assumed that these needle-like structures are mostly made of MnOx species, since La is barely present in LM 15-1.
 | ||
| Fig. 3 HAADF-STEM and HRTEM images of: a) LM; b) LM 3-1; c and d) LM 3-6; e and f) LM 15-1. | ||
Redox and chemical properties of acid-treated samples
The redox properties were investigated by means of TPR (temperature-programmed reduction) experiments. The reduction profiles of LM samples treated with different acid concentrations and for different time are illustrated in Fig. 4a and b, respectively, while the Tmax of the reduction peaks and the calculated H2 consumption are reported in Table 2. The reduction of pristine LM consists in three main peaks. In the low-medium temperature range (350–900 K) two broad peaks are visible, the first one (peak α, at 598 K) is attributed to the surface reduction of Mn4+ to Mn3+, while the second one (peak β, 676 K) is due to the reduction of surface Mn3+ to Mn2+. The third peak (peak γ, at 1084 K) is associated with the reduction of bulk Mn3+ to Mn2+, which usually happens in the high-temperature range (900–1200 K).41–46 The shape of the redox profile, the temperatures of the reduction steps, and the calculated H2 consumption may change quite significantly after the acid treatment. In samples obtained in weak/moderate acid treatment conditions, peak α and peak β increase in intensity and area (i.e., higher H2 consumption with respect to the non-treated LM) and shift to lower temperature (up to 40 K compared to LM); peak γ is still visible and slightly shifted to lower temperatures. All these changes become more and more evident as the strength of acid treatment increases, with the maximum for the sample LM 3-6. The TPR profiles of the samples treated with a strong treatment are quite different showing an overlapping of the three components in a range of temperatures from 450 K to 850 K. It is worth to note that the profiles for these samples (LM 15-1, LM 9-1, LM 3-18) are similar to that reported for β-MnO2 and Mn2O3, originating from the thermal decomposition of γ/ε-MnO2 in air.40 The observed changes are related to the morphological and structural changes occurred on the perovskite during the acid treatment. According to the literature, the increase in H2 consumption observed at low temperature for the samples treated under weak/mild conditions is mainly attributable to the reduction of MnO2 and Mn2O3 nucleated on the surface of the perovskite, and the reduction of the highly defective surface of the remaining perovskite.32,33,47 This is also confirmed by the experiment described in the supporting information (Fig. S2a and b†) that investigate the structural transformation undergone by LM 3-6 during the TPR (see ESI†).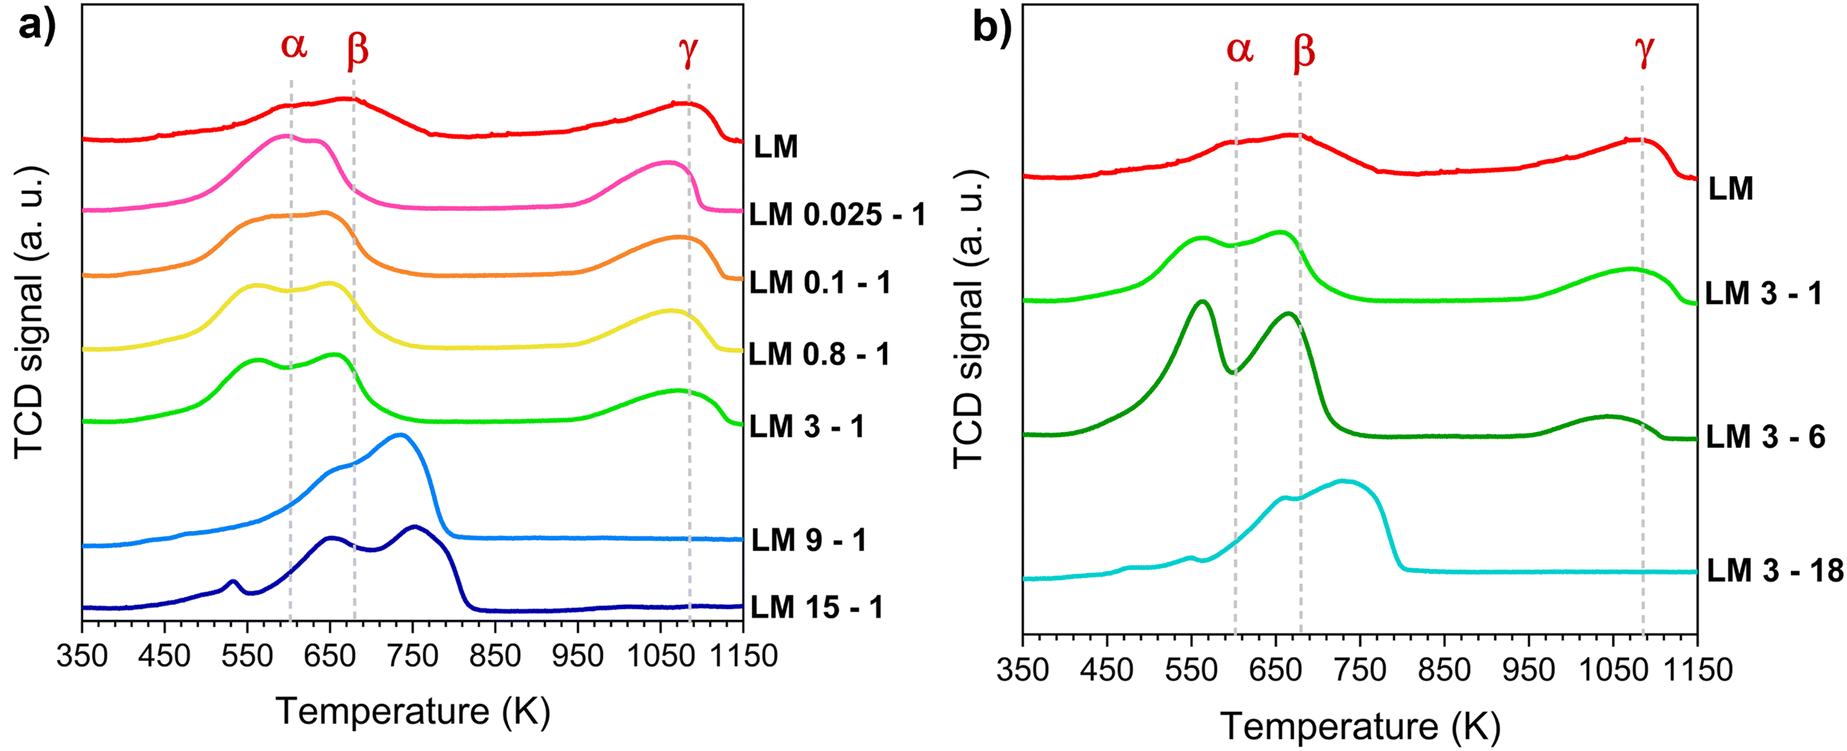 | ||
| Fig. 4 Temperature-programmed reduction profiles of acid treated LaMnO3 samples: in a) LM samples treated with different acid concentrations; in b) LM samples treated for different times. TPR experiments were run on calcined samples. | ||
| Sample | T max peak αa (K) | T max peak βa (K) | mmol H2 g−1 (350–900 K) | T max peak γa (K) | mmol H2 g−1 (900–1200 K) |
|---|---|---|---|---|---|
| a T max is the temperature of the maximum of the related reduction peak. | |||||
| LM | 598 | 676 | 1.45 | 1084 | 1.27 |
| LM 0.025-1 | 596 | 636 | 2.16 | 1064 | 0.96 |
| LM 0.1-1 | 564 | 647 | 2.29 | 1080 | 0.93 |
| LM 0.8-1 | 560 | 649 | 2.50 | 1068 | 0.86 |
| LM 3-1 | 560 | 656 | 2.37 | 1078 | 0.91 |
| LM 3-6 | 564 | 664 | 4.13 | 1045 | 0.59 |
| LM 3-18 | 659 | 734 | 3.25 | — | — |
| LM 9-1 | 660 | 734 | 3.62 | — | — |
| LM 15-1 | 653 | 753 | 3.43 | — | — |
The presence of a high amount of MnO2 phases is expected, even if not always detected from the XRD analysis. This is because of the formation mechanism of MnOx species during the acid treatment, which involves the dismutation reaction of Mn3+ to Mn2+ (which is soluble in acid solutions) and Mn4+, which is insoluble and remains on the surface.28,30,34,48 The decrease of Tmax for α and β peaks could be due to several factors such as a strong interaction between the needle-shaped MnOx species and the highly defective perovskite support, together with the consequent stabilization of highly reducible Mn(IV) phases. All these factors play together to increase the oxygen exchange capability of both LaMnO3 and MnOx and accelerate their reduction kinetics. The shift towards lower temperature of peak γ compared to the pristine LM, suggests a higher mobility of lattice oxygen. This could be explained by a weaker Mn–O bond induced by the acid treatment34 or by the high presence of lattice defect at the La-site that helps the oxygen exchange.6 In contrast to what happens at low temperature, the related amount of hydrogen consumed above 900 K decreases with the perovskite modification (Table 3). This is due to the lower amount of bulk Mn3+ in the treated perovskite, consistent with the dynamics of the dissolution process hypothesized by Xu et al.28 and the complete conversion of the perovskite into a mixture of manganese oxides. In fact, the TPR profiles of the samples subjected to strong acid treatments (Fig. 4) show a multi-step reduction trend with the absence of peak γ. In conclusion, the acid treatment contributes in general to improve the redox properties of resulting catalysts. The excellent low-temperature reducibility of MnOx/LaMnO3 nanocomposite catalysts can be attributed to the combination and coexistence of several factors resulting from the acid treatment, such as a high surface area, and a strong synergistic interaction between MnOx and LaMnO3. This is due to a high mobility of oxygen vacancies associated with the formation of a highly defective interfacial region and the coexistence of different phases. More information regarding the oxidation state of Mn species on the surface were obtained by XPS analysis.
| Sample name | Surface composition (%) | Surface atomic ratio | Mn species analysis | ||||
|---|---|---|---|---|---|---|---|
| La | Mn | O | La/Mn | Oads/Olatt | Mn 2p3/2 (Mn4+/Mn3+) | V Mn from Mn 3s split | |
| LM | 18.5 | 17.1 | 64.4 | 1.08 | 0.88 | 1.18 | 3.00 |
| LM 0.025-1 | 11.7 | 22.0 | 66.3 | 0.53 | 0.81 | 1.18 | 3.14 |
| LM 0.1-1 | 9.2 | 22.7 | 68.1 | 0.40 | 0.90 | 1.31 | 3.21 |
| LM 0.8-1 | 6.3 | 23.1 | 70.6 | 0.27 | 0.89 | 1.53 | 3.27 |
| LM 3-1 | 7.0 | 23.9 | 69.1 | 0.29 | 0.92 | 1.32 | 3.18 |
| LM 3-6 | 3.8 | 27.0 | 69.2 | 0.14 | 0.93 | 1.62 | 3.32 |
| LM 15-1 | 3.4 | 26.0 | 70.6 | 0.13 | 0.96 | 1.22 | 3.46 |
The La/Mn atomic ratio, the oxidation state of Mn and the nature of oxygen species on the MnOx/LaMnO3 surface were studied by X-ray photoelectron spectroscopy (XPS) measurements. The La 3d, O 1s, Mn 2p3/2, and Mn 3s XPS spectra are shown in Fig. S3–S6.†Table 3 reports the quantitative results of XPS analysis. LM starting sample showed a superficial La/Mn value close to the nominal one. A progressive depletion of superficial La is observed when increasing the strength of the acid treatment (Fig. S3†), with a corresponding enrichment in Mn on the perovskite surface. This is also confirmed by the value of the La/Mn atomic ratio, which decreases from 1.08 in LM to 0.14 in LM 15-1 (Table 3).
The surface oxygen species were analysed by deconvolving the O 1s XPS spectra (Fig. S4,†Table 3). The O 1s spectrum of each sample shows two distinguishable peaks. The major contribution arises from the peak at 529.2 eV, which is commonly referred to the surface lattice oxygen species (Olatt), whereas the second one is present at 530.9 eV and corresponds to the surface adsorbed oxygen such as hydroxyl species (Oads).22,23,41,49 The surface Oads/Olatt ratio increases with the strength of acid treatment, from 0.88 for LM to 0.96 for LM 15-1. A larger amount of surface Oads on LM perovskite generally agrees with the presence of a higher amount of surface oxygen vacancies.22,23 Moreover, the presence of a higher number of oxygenate species on the surface may also be related to the segregation of MnxOy after the treatment.50
The oxidation state of Mn was analysed by the Mn 2p XPS spectra (Fig. S5†). The asymmetrical shape of these spectra suggests the co-existence of Mn in different oxidation states on the catalyst surface. To have a semi-quantitative evaluation of Mn4+ and Mn3+ surface abundance, the spectra were deconvolved into two separate contributions at binding energies of 642.9 eV and 641.6 eV, attributed to surface Mn4+ and Mn3+, respectively.15,51,52 The obtained values are reported as Mn4+/Mn3+ in Table 3. It is possible to observe that the relative amount of Mn4+ increases from 1.18 (LM) to 1.62 (LM 3-6), whereas it slightly decreases to 1.22 under strong acid treatments (LM 15-1). This is consistent with what was observed in TPR experiments, where the amount of Mn4+ increased in respect of Mn3+ as the strength of the acid treatment increased. A further consideration of surface Mn oxidation states can be obtained by evaluating the Mn 3s splitting. Several authors report a clear correlation between the increase in formal valency of Mn species in perovskites and the decrease in the Mn 3s energy gap.53–55 Also, it is possible to estimate the average Mn valency from the Mn 3s splitting.52 Fig. S6† reports the shift in binding energy of Mn 3s, while the energy gap (ΔEMn3s) is represented as a function of the estimated La/Mn in Fig. 5. As it is possible to see, the difference in BE of Mn 3s doublet decreases as the La/Mn decreases, indicating a general increase in Mn average valency (VMn). An estimation of VMn can be done by using:

 | ||
| Fig. 5 Mn 3s split values (left) and the estimated average Mn valency (VMn) (right) as a function of La/Mn ratio obtained from the XPS analysis. | ||
CO oxidation test
Fig. 6 illustrates the light-off profiles of LM and acid-modified samples for CO oxidation in the range of 300–850 K. The catalytic activity of the LM materials was checked by carrying out two cycles (Fig. S7†). The first cycle is influenced by the desorption of adsorbed NOx after acid treatment (Fig. S8†), as well as by the morphological changes discussed above. These factors can have a positive or negative effect on the performance of the catalyst. As shown in Fig. S7,† the first and second cycles of the weak/medium treated samples are very similar. In contrast, the materials treated under strong conditions show much higher activity during the first cycle, with a noticeable drop in activity at 500–600 K due to the sintering of MnOx. This behavior confirms the poor thermal stability of LM 9-1, LM 15-1, and LM 3-18. The second and third oxidation cycles, on the other hand, overlap almost perfectly (Fig. S9†) and provide a more accurate representation of the activity of the catalysts after their stabilization. The second cycle was therefore chosen as representative of the activity of the samples, which were ranked according to the temperature at which 10% (T10) and 50% (T50) conversion was achieved. | ||
| Fig. 6 Catalytic activity during the second cycle of CO oxidation with acid treated LaMnO3 samples as catalysts: in a) LM samples treated with different acid concentrations; in b) LM samples treated for different times. | ||
Non-treated LM shows T10 and T50 of 459 and 522 K, respectively. For samples treated for 1 h, weak and medium acid treatment of LM boosts CO oxidation performance and the catalytic activity increases, while the strong treatments decrease it. The catalytic activity follows this general order: LM 15-1 < LM 9-1 < LM < LM 0.025-1 – LM 3-1; in fact, no sensible variation in CO oxidation performances can be observed by varying the acid concentration from 0.025 to 3 M. Fixing the concentration to 3 M and changing the treatment time, the trend is the following: LM 3-18 < LM < LM 3-1 < LM 3-6. As an example, LM 3-6 shows the best performance and displays a T10 and T50 of 377 K and 427 K, respectively, about 90 K lower in comparison to LM; conversely, low temperature (below 500 K) CO oxidation activity of LM 9-1 and LM 15-1 is close to that of LM. These trends well correspond with the previous considerations in terms of phase formation (HRTEM and XRD analysis), thermal stability (BET and BJH measurements), the high number of Mn4+/Mn3+ couples (XPS) and reducibility/interaction (H2-TPR experiments) of the MnOx/LaMnO3 nanocomposite. Clearly, the formation of MnOx nanoneedles and their stabilization on the highly defective perovskite surface have a crucial effect on the catalytic conversion of CO; this is followed by the stabilization of the micro-pores (which could be helpful for CO oxidation performances56) and an improved interaction and oxygen exchange mechanism between MnOx and LaMnO3.
Fig. 7 shows the plot of T10 values of pristine LM, and all acid treated samples versus their corresponding La/Mn ratio from ICP analysis. It highlights that the highest activity is reached when La/Mn ratio is in the range of 0.2–0.6, i.e., for the samples which undergo a weak/medium acid etching and, therefore, the formation of the MnOx/LaMnO3, with a partial modification of the perovskite lattice which increases the defectivity. The positive effect of the acid treatment is lost when the catalyst is composed mainly by MnxOy (La/Mn < 0.2).
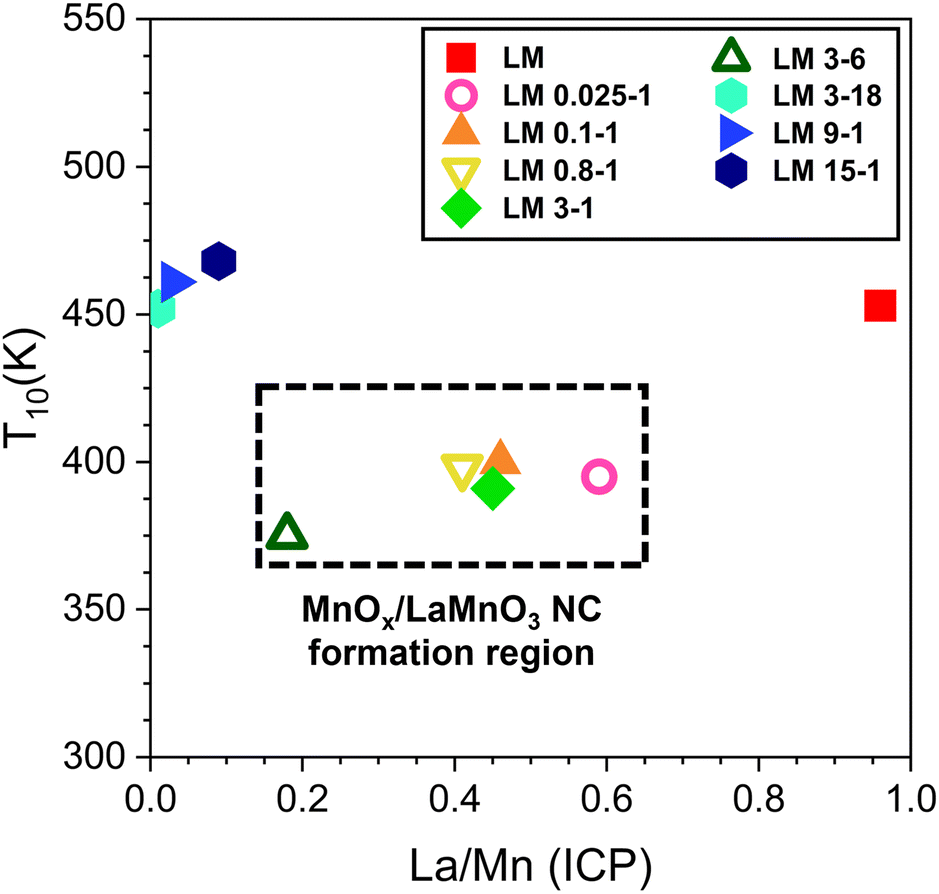 | ||
| Fig. 7 T 10 achieved during the second CO oxidation cycle against molar La/Mn ratio as determined by ICP analysis. | ||
The specific reaction rate of each sample vs. La/Mn ratio is shown in Fig. 8; the overall behavior is qualitatively similar to that shown looking at T10, with a maximum in activity at intermediate La/Mn ratio (from 0.4 to 0.6). However, specific activity of two samples differs from T10. LM 0.025-1 is the sample with the highest number of active sites per unit of surface area while the high T10 activity of LM 3-6 is probably due to the higher surface area compensating for the lower density/quality of specific active sites. This confirms that even weak acid treatments are sufficient to form a very high number of active sites, while medium treatments seem to favor a higher surface area instead.
 | ||
| Fig. 8 Specific CO oxidation rate calculated at 390 K as a function of La/Mn molar ratio. | ||
The most representative samples were collected after CO oxidation (labelled as “used samples”) and characterized by means of BET (Table S1†) and H2-TPR (Fig. S10†). The surface area of the used samples doesn't differ from the calcined materials. The redox profile of LM 3-1 and LM 3-6 is not modified significantly with respect to the previous experiments; on the other hand, the used LM 9-1 and LM 15-1 show a decrease of the first reduction peak (α) attributed to Mn4+, whereas the peak centred at 700 K (β), attributed to the reduction of Mn3O4, becomes larger and shifts to higher temperatures. This indicates that during the reaction γ/ε-MnO2 partially decomposes into Mn3O4. This is consistent with previous reports, which have demonstrated that MnO2 decomposes into Mn2O3 or Mn3O4 at high temperature.39,40
The catalytic results together with those of the characterizations discussed above highlight the key role of the perovskite in preventing the degradation of MnOx active species during CO oxidation, thus preserving high CO conversion and long-term performance. The higher surface area and the presence of different porosity, the exposure of an appropriate amount of Mn3+ and Mn4+ at the surface of LaMnO3, the presence of MnOx/LaMnO3 interface, an easier redox Mn4+ ⇌ Mn3+ cycle and the improved oxygen mobility can explain the superior CO oxidation activity of LM samples, in the nanocomposite formation range. The formation of a synergistic interface between MnOx and LaMnO3 then facilitates the charge exchange between the two species and is crucial to enhance the CO oxidation activity of the nanocomposite. On the other hand, the lower CO oxidation performance obtained for samples exposed to strong acidic conditions is due to their poor thermal stability and their transformation into an oxide mixture with Mn in a lower oxidation state and a very low surface area. In conclusion, it seems that the co-existence of MnOx needles on a defective LaMnO3 enhances the catalytic activity towards CO oxidation, thanks to the stabilization of manganese oxides active species and the formation of a strong interaction at the interface. This MnOx/LaMnO3 nanocomposite can be obtained by leaching La from perovskite until a certain limit through appropriate treatment conditions. The catalytic performance of MnOx/LaMnO3 nanocomposites has been shown to be comparable to that of other perovskites and Mn-based materials as documented in the literature (Table S2†).
Conclusions
In this work, we explored the impact of acid treatment parameters on the structural, morphological, and redox properties of LaMnO3 to enhance its activity toward CO oxidation. Our goal was to determine whether this method of perovskite modification by acid treatment could be tailored for a possible industrial scale up, considering as industrially relevant parameters the HNO3 concentration and the time of treatment. This permitted to obtain a controlled leaching of La from the perovskite structure, leading to the formation of Mn-rich catalysts. Specifically, mild treatment conditions resulted in mesoporous MnOx/LaMnO3 nanocomposite catalysts, where MnOx species form a needle-shaped structure on the perovskite surface. These catalysts showed superior morphological, structural, and redox characteristics compared to untreated LaMnO3 and to those subjected to harsher acid treatments, which produced a mixture of unstable MnOx species.We found that the key to improve the CO oxidation activity is the stabilization of the MnOx needle-like structure thanks to the dispersion on the perovskite matrix and the interaction of MnOx species with it. This is due to an interfacial synergism between the two species, particularly evidenced by the TPR study. The stabilization leads to a higher concentration of Mn3+ and Mn4+ species on the surface, and the creation of active interfaces between MnOx and perovskite, enhancing surface oxygen availability and mobility, thereby boosting CO oxidation. Our findings highlight that achieving optimal conditions, i.e., balancing acid concentration and treatment duration, is critical for producing an effective catalyst. The conditions required to obtain superior catalysts are not overly stringent, and an industrial-scale application of this approach seems feasible.
However, additional factors-such as vessel volume, rate, and type of mixing-should be considered, and further research is needed to assess the reproducibility and scalability of this method in an industrial context. Moreover, handling significant volumes of moderately concentrated HNO3 over extended periods poses potential safety and recovery challenges that must be carefully addressed.
Data availability
The data supporting this article have been included as part of the ESI.† Raw data are available on request.Author contributions
AF: investigation, formal analysis, visualisation, writing – original draft. AT: investigation, formal analysis, visualisation, writing – original draft. AB: data curation. SC: supervision, writing – review & editing. MB: supervision, writing – review & editing. JL: investigation, formal analysis. BT: supervision. resources. CAW: supervision. resources. AT: conceptualisation. supervision, funding acquisition.Conflicts of interest
There are no conflicts to declare.Acknowledgements
A. F. is grateful for funding under the REACT EU Italian PON 2014-2020 Program, Action IV.4 – Innovation and Action IV.5 – Green (DM 1062, 10/08/2021). J. L. is a Serra Húnter Fellow and is grateful to ICREA Academia program and projects MICIN/FEDER PID2021-124572OB-C31, CEX2023-001300-M (MCIN/AEI/10.13039/501100011033), and GC 2017 SGR 128. M. B. thanks MIUR for funding (PRIN project-DIRECTBIOSOFC, 2017FCFYHK, 2019–2022).Notes and references
- S. Royer, D. Duprez, F. Can, X. Courtois, C. Batiot-Dupeyrat, S. Laassiri and H. Alamdari, Chem. Rev., 2014, 114, 10292–10368 CrossRef CAS PubMed.
- G. Peron and A. Glisenti, Top. Catal., 2019, 62, 244–251 CrossRef CAS.
- S. Keav, S. K. Matam, D. Ferri and A. Weidenkaff, Catalysts, 2014, 4, 226–255 CrossRef.
- J. Zhu, H. Li, L. Zhong, P. Xiao, X. Xu, X. Yang, Z. Zhao and J. Li, ACS Catal., 2014, 4, 2917–2940 CrossRef CAS.
- Y. Liu, H. Zheng, J. Liu and T. Zhang, Chem. Eng. J., 2002, 89, 213–221 CrossRef CAS.
- Z. Gao, H. Wang, H. Ma and Z. Li, J. Alloys Compd., 2015, 646, 73–79 CrossRef CAS.
- J. Chen, M. Shen, X. Wang, G. Qi, J. Wang and W. Li, Appl. Catal., B, 2013, 134–135, 251–257 CrossRef CAS.
- J. A. Onrubia, B. Pereda-Ayo, U. De-La-Torre and J. R. González-Velasco, Appl. Catal., B, 2017, 213, 198–210 CrossRef CAS.
- P. Esmaeilnejad-Ahranjani, A. A. Khodadadi and Y. Mortazavi, Appl. Catal., A, 2020, 602, 117702 CrossRef CAS.
- X. Yan, Q. Huang, B. Li, X. Xu, Y. Chen, S. Zhu and S. Shen, J. Ind. Eng. Chem., 2013, 19, 561–565 CrossRef CAS.
- C. Zhang, C. Wang, W. Zhan, Y. Guo, Y. Guo, G. Lu, A. Baylet and A. Giroir-Fendler, Appl. Catal., B, 2013, 129, 509–516 CrossRef CAS.
- C. Zhang, C. Wang, S. Gil, A. Boreave, L. Retailleau, Y. Guo, J. L. Valverde and A. Giroir-Fendler, Appl. Catal., B, 2017, 201, 552–560 CrossRef CAS.
- R. Spinicci, M. Faticanti, P. Marini, S. De Rossi and P. Porta, J. Mol. Catal. A: Chem., 2003, 197, 147–155 CrossRef CAS.
- Y. Wang, S. Xie, J. Deng, S. Deng, H. Wang, H. Yan and H. Dai, ACS Appl. Mater. Interfaces, 2014, 6, 17394–17401 CrossRef CAS PubMed.
- J. X. Flores-Lasluisa, F. Huerta, D. Cazorla-Amorós and E. Morallón, J. Colloid Interface Sci., 2019, 556, 658–666 CrossRef CAS PubMed.
- V. Blasin-Aubé, J. Belkouch and L. Monceaux, Appl. Catal., B, 2003, 43, 175–186 CrossRef.
- E. Brusamarello, C. Blonda, C. Salazar-Castro, P. Canu and A. Glisenti, ACS Omega, 2021, 6, 24316–24324 CrossRef CAS PubMed.
- I. Rossetti, O. Buchneva, C. Biffi and R. Rizza, Appl. Catal., B, 2009, 89, 383–390 CrossRef CAS.
- C. Zhang, Y. Guo, Y. Guo, G. Lu, A. Boreave, L. Retailleau, A. Baylet and A. Giroir-Fendler, Appl. Catal., B, 2014, 148–149, 490–498 CrossRef CAS.
- B. Kucharczyk and W. Tylus, Appl. Catal., A, 2008, 335, 28–36 CrossRef CAS.
- C. Zhang, W. Hua, C. Wang, Y. Guo, Y. Guo, G. Lu, A. Baylet and A. Giroir-Fendler, Appl. Catal., B, 2013, 134–135, 310–315 CrossRef CAS.
- C. Zhang, K. Zeng, C. Wang, X. Liu, G. Wu, Z. Wang and D. Wang, Ceram. Int., 2020, 46, 6652–6662 CrossRef CAS.
- W. Zhu, X. Chen, Z. Liu and C. Liang, J. Environ. Chem. Eng., 2020, 124, 14646–14657 CAS.
- H. Arandiyan, H. Dai, J. Deng, Y. Liu, B. Bai, Y. Wang, X. Li, S. Xie and J. Li, J. Catal., 2013, 307, 327–339 CrossRef CAS.
- Y. Liu, H. Dai, Y. Du, J. Deng, L. Zhang and Z. Zhao, Appl. Catal., B, 2012, 119–120, 20–31 CrossRef CAS.
- Y. Liu, H. Dai, J. Deng, Y. Du, X. Li, Z. Zhao, Y. Wang, B. Gao, H. Yang and G. Guo, Appl. Catal., B, 2013, 140–141, 493–505 CrossRef CAS.
- R. H. Blackmore, M. E. Rivas, T. Eralp Erden, T. Dung Tran, H. R. Marchbank, D. Ozkaya, M. Briceno De Gutierrez, A. Wagland, P. Collier and P. P. Wells, Dalton Trans., 2019, 49, 232–240 RSC.
- Y. Xu, J. Dhainaut, G. Rochard, J.-P. Dacquin, A.-S. Mamede, J.-M. Giraudon, J.-F. Lamonier, H. Zhang and S. Royer, Chem. Eng. J., 2020, 388, 124146 CrossRef CAS.
- B. Li, Q. Yang, Y. Peng, J. Chen, L. Deng, D. Wang, X. Hong and J. Li, Chem. Eng. J., 2019, 366, 92–99 CrossRef CAS.
- S. Wang, Q. Liu, Z. Zhao, C. Fan, X. Chen, G. Xu, M. Wu, J. Chen and J. Li, Ind. Eng. Chem. Res., 2020, 59, 6556–6564 CrossRef CAS.
- L. Li, J.-W. Shi, M. Tian, C. Chen, B. Wang, M. Ma and C. He, Appl. Catal., B, 2021, 282, 119565 CrossRef CAS.
- H. Chen, J. Li, W. Cui, Z. Fei, Q. Tian, Q. Liu, X. Chen, M. Cui, Z. Zhang, J. Tang and X. Qiao, Appl. Surf. Sci., 2020, 505, 144112 CrossRef CAS.
- B. Zhao, R. Ran, L. Sun, X. Guo, X. Wu and D. Weng, RSC Adv., 2016, 6, 69855–69860 RSC.
- W. Si, Y. Wang, Y. Peng and J. Li, Angew. Chem., Int. Ed., 2015, 54, 7954–7957 CrossRef CAS PubMed.
- X. Wang, K. Huang, L. Yuan, S. Xi, W. Yan, Z. Geng, Y. Cong, Y. Sun, H. Tan, X. Wu, L. Li and S. Feng, J. Phys. Chem. Lett., 2018, 9, 4146–4154 CrossRef CAS PubMed.
- B. Zhao, R. Ran, L. Sun, Z. Yang, X. Wu and D. Weng, Catal. Commun., 2018, 105, 26–30 CrossRef CAS.
- S. Lowell, J. E. Shields, M. A. Thomas and M. Thommes, in Characterization of Porous Solids and Powders: Surface Area, Pore Size and Density, ed. S. Lowell, J. E. Shields, M. A. Thomas and M. Thommes, Springer Netherlands, Dordrecht, 2004, pp. 129–156 Search PubMed.
- W. Si, Y. Wang, S. Zhao, F. Hu and J. Li, Environ. Sci. Technol., 2016, 50, 4572–4578 CrossRef CAS PubMed.
- M. I. Said, J. Alloys Compd., 2020, 819, 152976 CrossRef CAS.
- W. Si, Y. Wang, Y. Peng, X. Li, K. Li and J. Li, Chem. Commun., 2015, 51, 14977–14980 RSC.
- M. Alifanti, J. Kirchnerova and B. Delmon, Appl. Catal., A, 2003, 245, 231–244 CrossRef CAS.
- L. Lisi, G. Bagnasco, P. Ciambelli, S. De Rossi, P. Porta, G. Russo and M. Turco, J. Solid State Chem., 1999, 146, 176–183 CrossRef CAS.
- N. Miniajluk, J. Trawczyński and M. Zawadzki, Appl. Catal., A, 2017, 531, 119–128 CrossRef CAS.
- F. Shi, F. Wang, H. Dai, J. Dai, J. Deng, Y. Liu, G. Bai, K. Ji and C. T. Au, Appl. Catal., A, 2012, 433–434, 206–213 CrossRef CAS.
- A. Felli, A. Trovarelli and M. Boaro, ECS Trans., 2021, 103, 1479 CrossRef CAS.
- A. Felli, S. Mauri, M. Marelli, P. Torelli, A. Trovarelli and M. Boaro, ACS Appl. Energy Mater., 2022, 5, 6687–6699 CrossRef CAS.
- Z. Zhang, Y. Tian, W. Zhao, P. Wu, J. Zhang, L. Zheng, T. Ding and X. Li, Catal. Today, 2020, 355, 214–221 CrossRef CAS.
- X. Zeng, G. Cheng, Q. Liu, W. Yu, R. Yang, H. Wu, Y. Li, M. Sun, C. Zhang and L. Yu, Ind. Eng. Chem. Res., 2019, 58, 13926–13934 CrossRef CAS.
- N. A. Merino, B. P. Barbero, P. Eloy and L. E. Cadús, Appl. Surf. Sci., 2006, 253, 1489–1493 CrossRef CAS.
- S. Dey and V. V. P. Kumar, Curr. Res. Green Sustainable Chem., 2020, 3, 100012 CrossRef.
- E. S. Ilton, J. E. Post, P. J. Heaney, F. T. Ling and S. N. Kerisit, Appl. Surf. Sci., 2016, 366, 475–485 CrossRef CAS.
- Y. Feng, K. Jin, L. Gu, X. He, C. Ge, Q. Zhang, M. He, Q. Guo, Q. Wan, M. He, H. Lu and G. Yang, Sci. Rep., 2016, 6, 22382 CrossRef CAS PubMed.
- E. Beyreuther, S. Grafström, L. M. Eng, C. Thiele and K. Dörr, Phys. Rev. B:Condens. Matter Mater. Phys., 2006, 73, 155425 CrossRef.
- V. R. Galakhov, M. Demeter, S. Bartkowski, M. Neumann, N. A. Ovechkina, E. Z. Kurmaev, N. I. Lobachevskaya, Y. M. Mukovskii, J. Mitchell and D. L. Ederer, Phys. Rev. B:Condens. Matter Mater. Phys., 2002, 65, 1–4 CrossRef.
- Y. Xue, H. Miao, S. Sun, Q. Wang, S. Li and Z. Liu, J. Power Sources, 2017, 342, 192–201 CrossRef CAS.
- S. Kubo, A. Endo and S. I. Yamazaki, J. Mater. Chem. A, 2018, 6, 20044–20055 RSC.
Footnotes |
| † Electronic supplementary information (ESI) available. See DOI: https://doi.org/10.1039/d4cy01418a |
| ‡ These authors contributed equally to this work. |
| This journal is © The Royal Society of Chemistry 2025 |