
 Open Access Article
 This Open Access Article is licensed under a
 Creative Commons Attribution 3.0 Unported Licence
Operando spectroscopy unravels the nature of deactivating species and their precursors in alkene oligomerization catalysis†
Nibras
Hijazi‡
 a,
Juan Carlos
Navarro de Miguel‡
a,
Jose Luis
Cerrillo
a,
Rushana
Khairova
a,
Xuan
Gong
a,
Edy
Abou-Hamad
b,
Javier
Ruiz-Martínez
a and
Jorge
Gascon
*a
a,
Juan Carlos
Navarro de Miguel‡
a,
Jose Luis
Cerrillo
a,
Rushana
Khairova
a,
Xuan
Gong
a,
Edy
Abou-Hamad
b,
Javier
Ruiz-Martínez
a and
Jorge
Gascon
*a
aKAUST Catalysis Center, King Abdullah University of Science and Technology, Thuwal 23955-6900, Kingdom of Saudi Arabia. E-mail: jorge.gascon@kaust.edu.sa
bImaging and Characterization Core Lab, KAUST Core Labs, King Abdullah University of Science and Technology, Thuwal 23955-6900, Kingdom of Saudi Arabia
First published on 6th December 2024
Abstract
Alkene oligomerization represents an attractive methodology to produce environmentally friendly synthetic fuels, free of aromatics. However, the materials that catalyze this reaction undergo complex deactivation, the understanding of which remains elusive. To better understand deactivation, its mechanism and pathways, operando UV-vis spectroscopy has been implemented alongside solid-state NMR spectroscopy in the oligomerization of propene (at 523 K and 50–100 kPa of propene pressure) over highly acidic ZSM-5 and zeolite beta. Measured spectra reveal that deactivation is initiated by the formation of an allylic hydrocarbon pool comprising dienes and cyclopentenyl cations. This hydrocarbon pool acts as a scaffold for the formation of alkylated benzenes (e.g., 1,3-di-tert-butylbenzene) which, due to spatial limitations, end up retained as coke species. The hydrocarbon pool also mediates further growth of alkylated benzenes into polycyclic aromatic hydrocarbons, a process that forms larger coke species. However, as in the case of ZSM-5, this process can be retarded by the shape selectivity of the zeolite. The spectra also show that the formation of long oligomers (C14–C16), irrespective of their degree of branching, renders them entrapped within zeolite pores.
1. Introduction
Zeolites are fascinating materials. Their acid sites are confined within porous structures of various architectures, making them ubiquitous in many acid-catalyzed reactions.1 One of these reactions is light alkene oligomerization to gasoline- or distillate-range hydrocarbons. Lately, this chemistry has received growing attention from the scientific community due to its industrial relevance, and also its prevalence in isobutane alkylation,2 methanol-to-hydrocarbons catalysis,3,4 and other chain growth reactions.The mechanism of alkene oligomerization on zeolites has been the subject of research for many decades. Principally, two different mechanisms have been proposed in the literature for this reaction. The first mechanism is based on carbenium ion chemistry, which has long been known to mediate acid catalysis.5 In this mechanism, an alkene reacts with either a Brønsted or Lewis acid site and forms an alkyl or alkenyl carbenium ion, respectively, which further undergoes oligomerization with another alkene species.6–8 While both alkyl and alkenyl carbenium ions can mediate oligomerization, the role of alkyl carbenium ions has been reported in several studies9–12 to be more significant. Nevertheless, the stability of carbenium ions in such zeolite-catalyzed reactions remains controversial. The controversy arises from the fact that solvation effects, which often stabilize carbenium ions in acid solutions, are absent in zeolites.13,14 It has been reported that only carbenium ions in which the positive charge is delocalized (e.g., cyclopentenyl cations) or sterically inaccessible to the zeolite framework can exist as long-lived intermediates.15,16
The second and more mature mechanism is based on surface alkoxide species. This mechanism considers that alkene oligomerization proceeds by a reaction between an alkene-derived alkoxide species and a gaseous alkene species. Alkoxide species have been either directly detected17,18 or inferred19,20 from spectroscopic studies of alkene oligomerization. In agreement with these experimental observations, several quantum chemical studies have confirmed the stability of alkoxide intermediates during alkene interactions with zeolites.21–24 These studies suggested that carbenium ions only exist as transition states and represent saddle points on the potential energy surface.
While the mechanism of alkene oligomerization on zeolites has been extensively studied, little is known about deactivation mechanisms. It has been reported that long oligomers and polycyclic aromatics can act as coke/coke precursors and cause catalyst deactivation.25,26 However, to the best of our knowledge, there remains a significant gap in understanding the mechanism behind the formation of these deactivating species, and therefore the objective of this study is to contribute to this understanding.
In this work, we employ operando UV-vis spectroscopy to study the nature and evolution of deactivating species and their precursors during alkene oligomerization. UV-vis spectroscopy has proven useful to detect allylic species owing to its ability to resolve π → π* transitions of conjugated double-bond systems. The assignments made for UV-vis spectra are supported by solid-state NMR spectroscopy performed on 13C-enriched catalysts and chemical analysis of retained hydrocarbons. Based on these assignments, key insights into the deactivation mechanism are extracted. The study was conducted on two industrially relevant zeolites, namely Zeolite Socony Mobil-5 (ZSM-5) and zeolite beta.
2. Experimental
2.1 Materials
ZSM-5 (SiO2/Al2O3 = 30) and zeolite beta (SiO2/Al2O3 = 25) were received from Alfa Aesar in their NH4+-forms. The zeolites were converted to H+-form by calcination under static air at 823 K for 5 h at a ramp rate of 1 K min−1.2.2 Structural and chemical characterization
X-ray diffraction (XRD) patterns were collected on a Bruker D8 Advance diffractometer equipped with a Cu Kα radiation source. Measurements were conducted in the 2θ range of 5–60° at a rate of 0.03° s−1 and compared against reference patterns from the International Zeolite Association.27Inductively coupled plasma-optical emission spectrometry (ICP-OES) was performed on an Agilent 5100 instrument. Prior to analysis, the samples were digested overnight at 318 K in a solution of hydrochloric, nitric, and hydrofluoric acids (HCl![[thin space (1/6-em)]](https://www.rsc.org/images/entities/char_2009.gif) :HNO3:HF 3:1:1). The resulting mixture was further diluted in a 1% nitric acid solution and then analyzed.
:HNO3:HF 3:1:1). The resulting mixture was further diluted in a 1% nitric acid solution and then analyzed.
27Al MAS NMR spectra were recorded on a Bruker Avance 400 MHz spectrometer equipped with a 4 mm probe. The spectra were recorded at a flip angle of π/2 and a scanning frequency of 14 kHz. Chemical shifts in 27Al were referenced to aluminum chloride hexahydrate.
Nitrogen physisorption measurements at 77 K were performed on a Micromeritics ASAP 2420 instrument. Prior to acquisition of isotherms, the samples were degassed under vacuum at 623 K for 16 h. Total and micropore areas were calculated using the Brunauer–Emmett–Teller (BET) and t-plot methods, respectively.
Temperature-programmed desorption (TPD) of ammonia was performed on a Micromeritics AutoChem 2950 instrument. The samples were pretreated under helium flow at 823 K for 1 h and then treated with ammonia (10% NH3 in He, AHG) at 373 K for 30 min. Physisorbed ammonia was removed by treating the samples under helium flow at 423 K for 30 min. Subsequently, the samples were heated to 1073 K at 10 K min−1 and desorbed ammonia was quantified using a thermal conductivity detector.
Fourier-transform infrared (FTIR) spectra using pyridine as a probe molecule were collected on a Thermo Scientific Nicolet 6700 spectrometer equipped with a DTGS KBr detector. Pelletized samples were pretreated under vacuum at 723 K for 3 h and then pyridine vapor was introduced to the system at room temperature until the samples became saturated. After removal of physisorbed pyridine at 423 K for 30 min, spectra were recorded in the wavenumber range of 1000–4000 cm−1 with 4 cm−1 resolution and averaging of 128 scans. Brønsted and Lewis acidity were calculated from the absorption bands at ca. 1545 and 1455 cm−1 using extinction coefficients of 1.67 and 2.22 cm μmol−1, respectively. The following equations were used to calculate acidity, assuming that one pyridine molecule is adsorbed per site:28
 | (1) |
 | (2) |
2.3 Analysis of retained hydrocarbons
Thermal gravimetric analysis (TGA) for post-reacted zeolites was conducted on a Mettler Toledo instrument. The samples were heated at 473 K for 30 min under nitrogen flow and then temperature was ramped to 1073 K at 5 K min−1 under air flow. The corresponding weight loss was measured using a microbalance with sub-microgram resolution.Nitrogen physisorption measurements were conducted on post-reacted zeolites in a similar manner to that described in the previous section. However, to prevent loss of volatile organic compounds, degassing was performed at 473 K for 8 h.
Carbonaceous deposits were extracted from post-reacted zeolites following the method developed by Guisnet and co-workers.29 The samples (50 mg) were dissolved in 5 mL of a 40% hydrofluoric acid solution and mixed for 6 h. Then, 1.5 mL of dichloromethane was added to the mixture. After the mixture has settled, the inorganic phase was removed using a pipette and this procedure was repeated twice while adding deionized water. The organic phase was then analyzed using an Agilent 7980A/5975C gas chromatograph/mass spectrometer (GC/MS) equipped with a DB-1MS column (30 m × 0.250 mm × 0.25 μm).
2.4 Operando UV-vis spectroscopy
Operando UV-vis studies were performed in a microactivity reference (PID Eng & Tech) reactor unit equipped with an AvaSpec 2048 L spectrometer. The spectra were measured in reflection mode using a high-temperature UV-vis optical fiber (Avantes, 400 μm × 1.5 m) protected by a stainless-steel sleeve. The reactions were carried out in a tubular quartz reactor (ID = 8 mm) at 523 K and total atmospheric pressure. To maintain a weight-hourly space velocity (WHSV) of 2 gC3H6 gcat−1 h−1, propylene (50% C3H6 in N2, AHG) was reacted at 5.0 cm3 min−1 over 140.9 g of catalyst. The reactor effluent was analyzed using a Bruker Varian 450 GC equipped with an HP-plot Al2O3 KCl column (50 m × 0.320 mm × 8.0 μm). Propene conversion and product yield were calculated (in fraction) as follows: | (3) |
 | (4) |
2.5 Solid-state NMR spectroscopy
Solid-state NMR spectroscopy was performed over post-reacted zeolites where propene-2–13C (99 atom% 13C, Sigma-Aldrich) was used as reactant. The reactions were carried out at similar conditions to those used in operando experiments except that the partial pressure of propene was 100 kPa. 1H and 13C spectra were recorded on a Bruker Avance 600 MHz spectrometer equipped with a 3.2 mm probe. The spectra were measured at room temperature and at a scanning frequency of 20 kHz. Chemical shifts in 1H and 13C were referenced to adamantane.3. Results and discussion
3.1 Structural and chemical characterization
The materials were characterized by several techniques after attainment of protonic forms through calcination. XRD patterns confirm that the crystal structure of the materials is persevered after calcination (see Fig. S1 of the ESI†). ICP-OES measurements show that the Si/Al ratios of the materials are in the range of 12–16, which agrees with the chemical compositions denoted by Alfa Aesar. 27Al MAS NMR spectra (Fig. S2†) reflect a significant content of non-framework aluminum species (15–23%), which is expected given the low Si/Al of the materials. Nitrogen physisorption measurements confirm the microporosity of the calcined materials (see isotherms in Fig. S3†). Pyridine-FTIR spectra (Fig. S4†) show that the materials exhibit both Brønsted and Lewis types of acidity. NH3-TPD profiles (Fig. S5†) reflect the presence of weak and intermediate-to-strong acid sites from peaks at 495 and 575–640 K, respectively. Measured acidities were consistently higher in NH3-TPD than in pyridine-FTIR, which could be explained in terms of the differences in the basicity and accessibility of probe ammonia and pyridine.30Table 1 summarizes the structural and chemical characterization results for the materials.| Material | Si/Ala | AlF,b % | S Micropore,c m2 g−1 | S Mesopore,d m2 g−1 | V Micropore,e cm3 g−1 | V Mesopore,f cm3 g−1 | Brønsted acid sites,g μmol g−1 | Lewis acid sites,g μmol g−1 | Strong acid sites,h μmol g−1 | Weak acid sites,h μmol g−1 |
|---|---|---|---|---|---|---|---|---|---|---|
| a Silicon-to-aluminum ratio determined from ICP-OES measurements. b Framework aluminum content determined from 27Al MAS NMR spectra. c Micropore area calculated from nitrogen physisorption isotherms. d Mesopore area calculated from nitrogen physisorption isotherms. e Micropore volume calculated from nitrogen physisorption isotherms. f Mesopore volume calculated from nitrogen physisorption isotherms. g Calculated from pyridine-FTIR spectra. h Calculated from NH3-TPD profiles. | ||||||||||
| ZSM-5 | 15.8 | 77.1 | 269 | 156 | 0.11 | 0.14 | 298 | 153 | 459 | 176 |
| Zeolite beta | 12.1 | 85.1 | 357 | 281 | 0.15 | 0.74 | 157 | 242 | 402 | 140 |
3.2 Catalytic performance
The propene oligomerization performance of ZSM-5 and zeolite beta has been tested at 523 K and 50 kPa of propene pressure. Fig. 1 shows propene conversion measured for the two zeolites as a function of time-on-stream (TOS). Initially (TOS = 15 min), ZSM-5 and zeolite beta showed similar conversions ranging from 66 to 74%. After that, conversion dropped dramatically in both zeolites but more dramatically in zeolite beta. For example, at 30 minutes of TOS, ZSM-5 had a conversion of 50%, while zeolite beta had a conversion of 31%. The enhanced stability of ZSM-5 can be attributed to its tortuous and narrow channels that provide shape selectivity against forming coke/coke precursors.31 After 45 minutes of TOS, deactivation slowed down in both zeolites. Conversion decreased slightly from 43 to 35% and from 23 to 12% in ZSM-5 and zeolite beta, respectively, as TOS increased from 45 to 90 minutes. This can be attributed to the fact that coke formation is an auto-inhibitory process,32 where the tendency towards coking decreases as coke accumulates over TOS.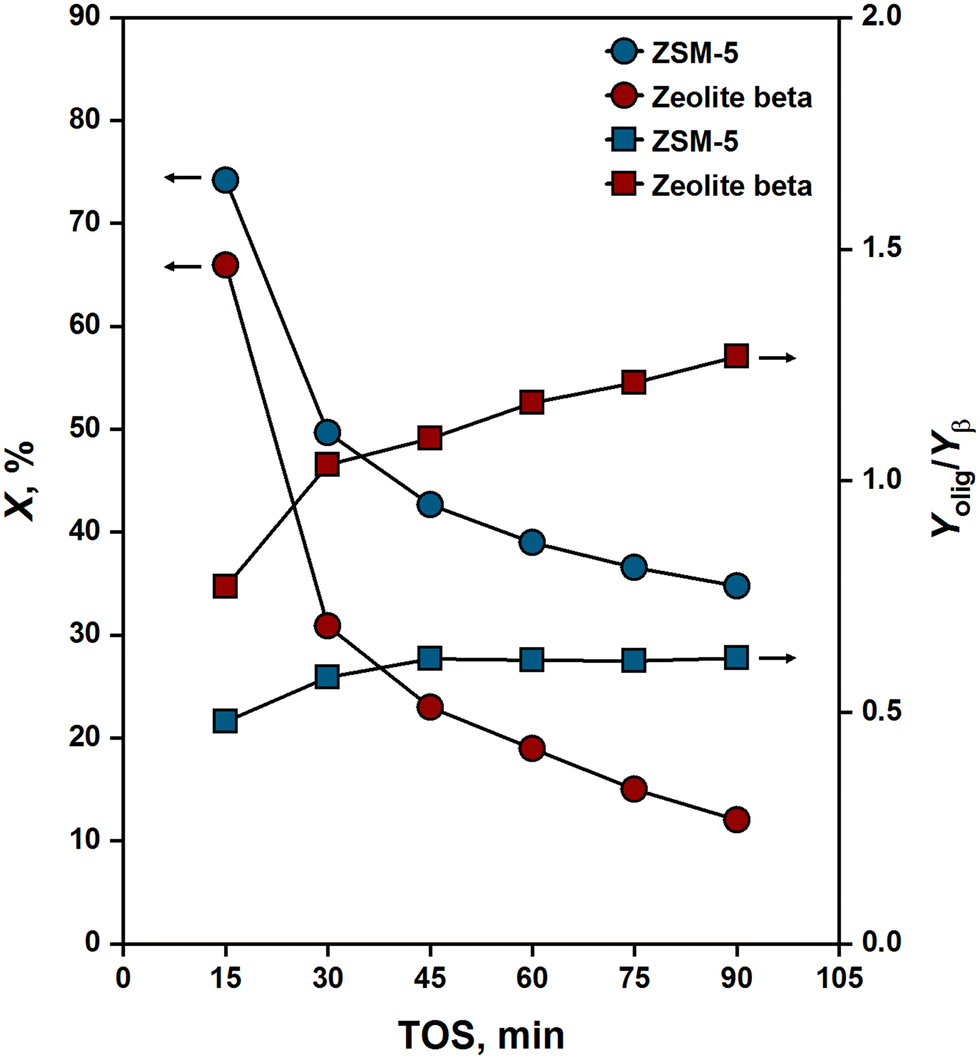 | ||
| Fig. 1 Propene conversion (X) and relative yield of oligomerization and β-scission products (Yolig/Yβ) over ZSM-5 and zeolite beta [523 K; 50 kPa propene pressure; 2 gC3H6 gcat−1 h−1 WHSV]. Solid lines are guides for the eye. | ||
The reactions yielded C4–C10 alkanes and alkenes with no observed formation of aromatics as gaseous products. The wide spectrum of products reflects a significant extent of secondary reactions (β-scission and co-oligomerization) taking place besides primary oligomerization. The ratio of the yield of oligomerization (C6, C9) to β-scission (C4, C5, C7, C8) products is depicted in Fig. 1 as a function of TOS. For both ZSM-5 and zeolite beta, this ratio was found to increase with increasing TOS, or more distinctly with increasing catalyst deactivation, consistent with observations by Ribeiro and co-workers.33 A plausible explanation for this increase is that the catalytic bed length decreases as the catalyst deactivates. Therefore, the intracrystalline residence time of oligomers decreases, and so does the probability that these oligomers undergo secondary reactions such as β-scission.34
The extent at which secondary reactions took place varied considerably between ZSM-5 and zeolite beta, as evident from the different relative yields of oligomerization and β-scission products measured for the two zeolites across a wide range of conversions (see Yolig/Yβ in Fig. 1). The contribution of secondary reactions was higher in ZSM-5 than in zeolite beta. Sarazen et al.35 measured “true oligomer” selectivities for various zeolites in propene oligomerization and showed that the contribution of secondary reactions increases with the severity of undulations in zeolites. These undulations impose diffusion limitations on primary oligomers, causing them to undergo secondary reactions such as β-scission. Undulations arise essentially from size differences between channels and the cavities at which channels intersect. In ZSM-5, these differences can reach up to 2 Å in diameter, while in zeolite beta, they are less than an angstrom.36 Therefore, ZSM-5 has more severe undulations than zeolite beta, which explains its higher selectivity for secondary reactions.
3.3 Analysis of retained hydrocarbons
The nature and amount of coke deposited in post-reacted zeolites was analyzed by means of TGA. Fig. 2 shows a plot of the derivative of weight loss with respect to temperature as post-reacted ZSM-5 and zeolite beta are heated under oxidative conditions. A clear transition is observed around 605 K, where soft coke (region I) is removed below this temperature, and hard coke (region II) is removed above that temperature. Díaz et al.26 investigated coke formation in 1-butene oligomerization over ZSM-5 and argued that soft coke is formed in the mesopores, while hard coke is generated in the micropores. For ZSM-5, we observe a soft coke content of 5.7 wt% and a hard coke content of 3.2 wt%. Meanwhile, for zeolite beta, we observe a soft coke content of 2.9 wt% and a hard coke content of 7.7 wt%. These observations suggest that most of the coke formed in ZSM-5 is located in the mesopores, while most of the coke generated in zeolite beta is located in the micropores. These differences can be ascribed to the varying degrees of shape selectivity exhibited by the zeolites in their micropores.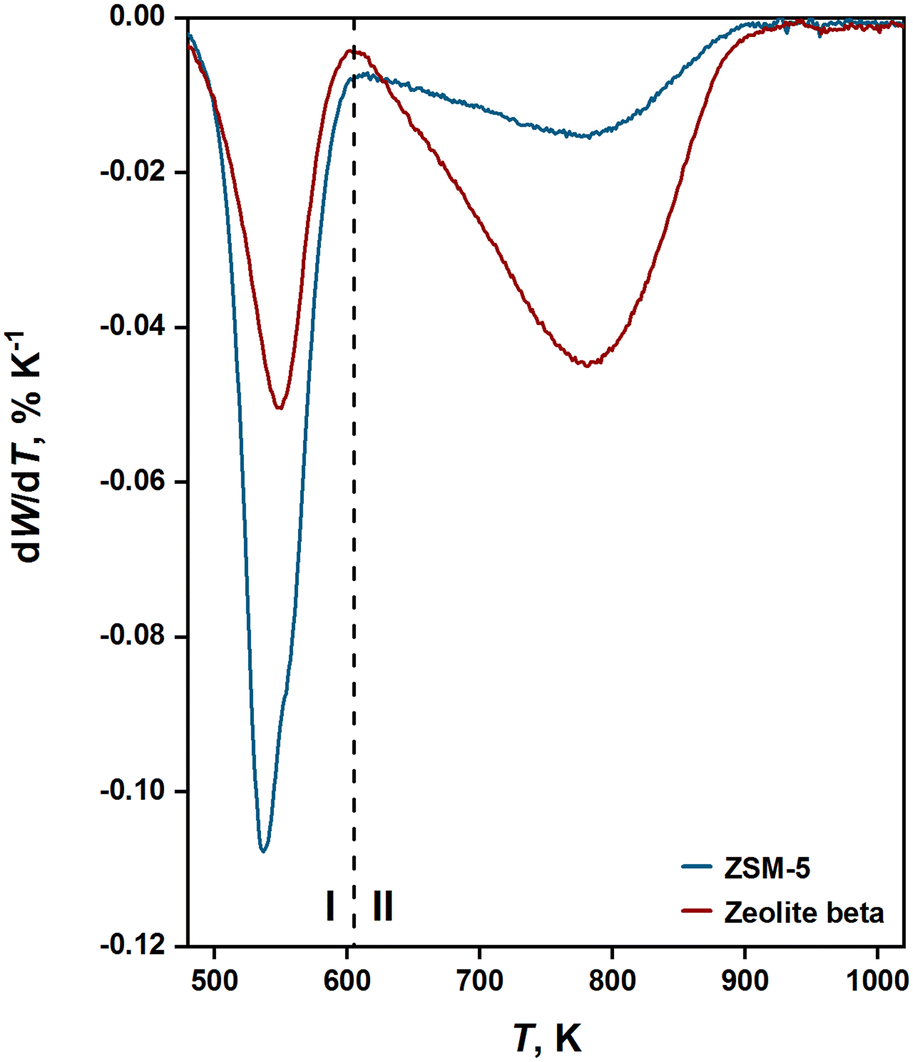 | ||
| Fig. 2 Derivative of weight loss (W) with respect to temperature measured during TGA for post-reacted ZSM-5 and zeolite beta [523 K; 50 kPa propene pressure; 2 gC3H6 gcat−1 h−1 WHSV; 90 min TOS]. | ||
The trends observed from TGA are consistent with nitrogen physisorption measurements conducted on post-reacted zeolites (see full details in Table S1 of the ESI†). We note, however, that sorption measurements performed on spent catalysts give an underestimation of microporosity since coke deposition can block access to micropores.25 For ZSM-5, we found that 24% of the micropore area and volume accessible to nitrogen were occupied by coke. Meanwhile, for zeolite beta, we found that 86–89% of the micropore area and volume accessible to nitrogen were occupied by coke. These findings reflect different tendencies between the two zeolites towards forming coke in their micropores, which can be attributed to their varying shape selectivity properties.
Identification of coke species was made possible by extracting the retained hydrocarbons from post-reacted zeolites using typical extraction methods.29 These methods, however, allow the identification of the soluble fractions of coke. The identification of the insoluble coke fractions remains a challenge. Fig. 3 shows GC/MS chromatograms of the soluble coke extracted from post-reacted ZSM-5 and zeolite beta. A similar identity of soluble coke species was observed from the two chromatograms. For example, both chromatograms exhibit intense peaks corresponding to 1,3-di-tert-butylbenzene. Dimon et al.25 argued that for a species to be retained in a given zeolite and be considered as coke, its diameter has to be significantly larger than that of the zeolite pores. 1,3-Di-tert-butylbenzene has a kinetic diameter of approximately 8.4 Å (based on data for 1,3-di-isopropylbenzene),37 which exceeds the largest cavity diameter of both ZSM-5 and zeolite beta (7.0 Å).36 Therefore, it is not surprising to observe 1,3-di-tert-butylbenzene as a retained species in these zeolites. Other alkylated benzenes were observed as soluble coke species in ZSM-5 such as 1-methyl-3,5-diethylbenzene and 1,3-methyl-4-sec-butylbenzene.
 | ||
| Fig. 3 GC/MS chromatograms of soluble coke extracted from post-reacted ZSM-5 and zeolite beta [523 K; 50 kPa propene pressure; 2 gC3H6 gcat−1 h−1 WHSV; 90 min TOS]. | ||
Both chromatograms also show intense peaks corresponding to oligomers such as tetradecane and hexadecane. It could seem that these straight chain oligomers readily form and diffuse and thus would not be retained in zeolites, but tetradecane and hexadecane have long backbones that impede their diffusion within zeolite channels. Kärger and co-workers38,39 studied the diffusion of n-alkanes in MFI-type zeolites (i.e., ZSM-5) using the zero-length column technique and other experimental techniques. The authors found that n-alkane diffusivity at 423–475 K decreases considerably with increasing chain length (i.e., varies by a factor of 102–103 as carbon number increases from 6 to 14). The observed trend suggests that tetradecane experiences much stronger diffusion limitations than, for example, hexane, explaining why the latter species is observed in our study as a gaseous product, while the former one is found among the retained hydrocarbons.
3.4 Solid-state NMR spectroscopy
To complement GC/MS analysis in identifying deactivating species, solid-state NMR spectroscopy was performed over post-reacted zeolites. The post-reacted zeolites had been exposed to 13C-enriched propene at 523 K for a period of 10–15 minutes, which is sufficient to initiate deactivation. Mobility-dependent spectra were measured using NMR magnetization transfer schemes that allow the identification of mobile and rigid species by invoking through-bond and through-space mechanisms, respectively. The cross-polarized (CP) spectra, which denote rigid species or species with limited mobility, are shown in Fig. 4. Generally, the following features are observed from the spectra: (i) 10–40 ppm methyl and methylene groups and (ii) 120–155 ppm olefinic and aromatic groups. These features signify the presence of alkylated poly-olefins and -aromatics as rigid species in post-reacted zeolites. | ||
| Fig. 4 CP-based solid-state 13C NMR spectra of post-reacted ZSM-5 and zeolite beta [523 K; 100 kPa propene pressure; 10–15 min TOS]. | ||
Additionally, a peak around 250 ppm, which is characteristic of cyclopentenyl cations,15 was observed for both zeolites. Previous studies have established the significance of cyclopentenyl cations as mediators in the formation of aromatics from olefins.11,40 Aromatics were observed in this study but only as immobile species (135–155 ppm (13C), Fig. 4),41 not as mobile species (see insensitive nuclei enhanced by polarization transfer (INEPT) spectra in Fig. S6†), consistent with the observation of aromatics as deactivating species (from GC/MS analysis of retained hydrocarbons) and the absence of aromatics among gaseous products. These observations lead us to assign a specific role for cyclopentenyl cations; that is, to mediate the formation of deactivating aromatic species.
In 2D CP-based spectra (see Fig. 5), a cross-peak between ≈125 (13C) and ≈6.5 (1H) ppm was observed for both zeolites. According to Ye et al.,42 this cross-peak is attributed to non-cyclic conjugated dienes. The limited mobility observed for dienes suggests that they are also involved in catalyst deactivation. Allotta and Stair43 studied propene conversion on ZSM-5 and found that dienes are formed in the initial stages of reaction. As the reaction progressed, dienes transformed into polyenes, and these polyenes further reacted and formed deactivating polyaromatics. Pazè et al.44 investigated 1-butene interaction with ferrierite and made similar observations. Therefore, similar to cyclopentenyl cations, dienes can be considered as precursors for the formation of deactivating aromatic species.
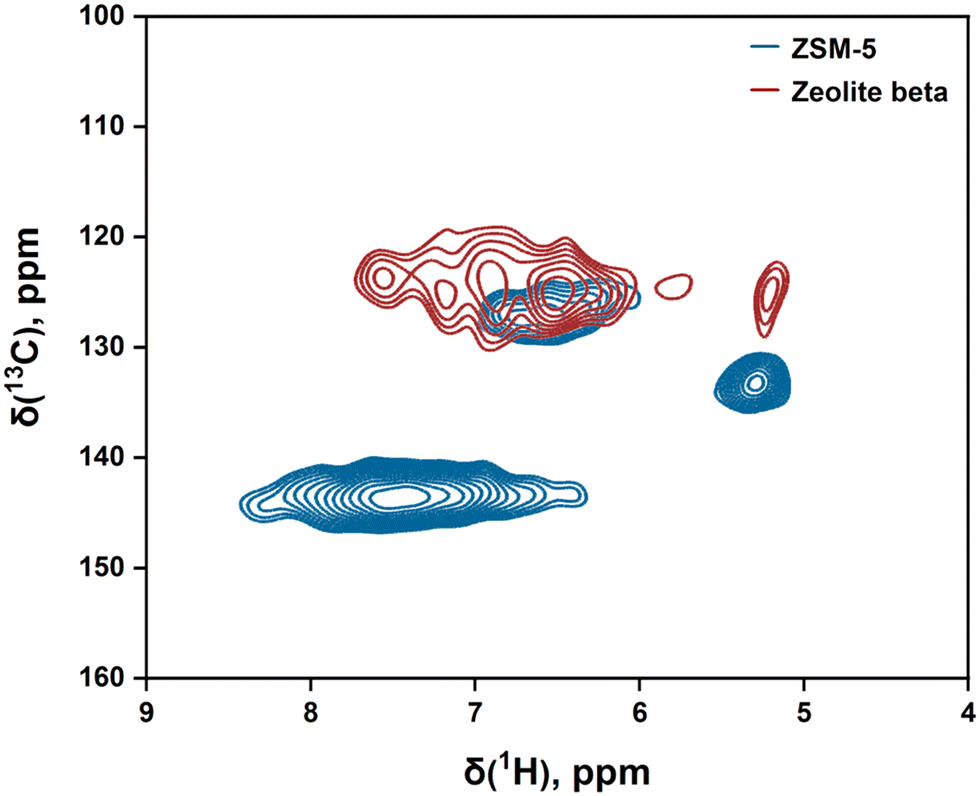 | ||
| Fig. 5 2D CP-based solid-state 1H–13C NMR spectra of post-reacted ZSM-5 and zeolite beta [523 K; 100 kPa propene pressure; 10–15 min TOS]. | ||
3.5 Operando UV-vis spectroscopy
The nature and evolution of deactivating species and their precursors have been monitored using operando UV-vis spectroscopy. The UV-vis spectra measured in the wavelength range of 200–667 nm for propene oligomerization on ZSM-5 and zeolite beta are shown in Fig. 6a and b. The spectra are shown only for the first hour of TOS because most of the spectral changes happen in this period. In the first few spectra, the Kubelka–Munk reflectance increased rapidly across the whole range of wavelengths (200–667 nm), and this was observed for both zeolites. This suggests that hydrocarbons are already forming and accumulating within the catalytic bed. By the tenth or eleventh minute of reaction, reflectance in the low wavelength range (200–300 nm) had reached saturation. This suggests that components represented by bands in this range are correlated with an induction period during which a “hydrocarbon pool” is formed. On the contrary, reflectance at higher wavelengths (>300 nm) continued to grow until the end of reaction. This growth coincides with the rapid deactivation of zeolites observed by online gas chromatography. This suggests that components represented by bands above 300 nm are highly correlated with catalyst deactivation. Notably, active species towards oligomerization such as alkyl cations have no absorption maxima above 220 nm.45 This presents a challenge to detect reaction intermediates in the wavelengths measured in our study. | ||
| Fig. 6 Operando UV-vis spectra measured during the first hour of TOS for propene oligomerization on (left) ZSM-5 and (right) zeolite beta. Subfigures a and b denote the raw spectra (taken every minute) while subfigures c and d denote the deconvolution of the spectrum measured at the third minute of TOS [523 K; 50 kPa propene pressure; 2 gC3H6 gcat−1 h−1 WHSV]. | ||
The highly convoluted and broad nature of bands makes it difficult to identify all bands from the spectra. To decode this complexity, band deconvolution was performed over the spectra using the Fityk software. The spectrum measured at the third minute of TOS was chosen for deconvolution since it captures most spectral features observed throughout the reaction. In performing deconvolution, a set of Gaussians was chosen as an initial estimate, and subsequently the Gaussians were fitted to the spectrum. The Kubelka–Munk reflectance at 667 nm was subtracted as baseline to account for negative signals.46 Care was taken to maintain full-width at half-maximum (FWHM) values below 100 nm for all bands.
Fig. 6c depicts deconvoluted bands from the spectrum measured at the third minute of TOS for propene oligomerization on ZSM-5. As discussed above, the spectra can be split into two groups based on the temporal evolution of bands. The first group includes bands between 200 and 300 nm whose Kubelka–Munk reflectance grows rapidly in the first few minutes of reaction and then plateaus. Therefore, the first group represents components that are strongly linked to the induction period of the reaction. In this group, a band is deconvoluted at 247 nm, which can be assigned to dienes.47,48 This assignment is consistent with the observation of dienes from CP 1H–13C NMR spectra (see Fig. 5). An assignment of the band to a specific diene species represents a challenge but based on Woodward's rules49 for dienes the band can be designated as a highly substituted diene. The fact that dienes are observed, together with alkanes and aromatics (see GC and GC/MS analyses), is a strong indication of the occurrence of hydrogen transfer reactions.
Another band is deconvoluted at 279 nm, which could be assigned to cyclopentenyl cations.40,50 This assignment is consistent with the observation of cyclopentenyl cations from CP 13C NMR spectra (Fig. 4). Olah et al.51 reported that cyclopentenyl cations absorbing light at 279 nm are trimethyl-substituted. In agreement with this observation, Hernandez and Jentoft52 developed a correlation between the wavelength of maximum absorption and the total number of carbon atoms in cyclopentenyl cations and showed that cyclopentenyl cations with absorption maxima at 278–280 nm have eight carbon atoms. Therefore, we can assign the band at 279 nm to a cyclopentenyl cation with intermediate degree of substitution.
The second group includes bands with wavelengths above 300 nm whose Kubelka–Munk reflectance grows at the same time the catalyst undergoes rapid deactivation. Therefore, the second group represents components that are highly correlated with catalyst deactivation. In this group, monoenyl cations are observed from a deconvoluted band at 314 nm.47 These cations are considered unstable to be observed as reaction intermediates, and Förster et al.10 related their observation during propene oligomerization to coke formation. GC/MS analysis of retained hydrocarbons (Fig. 3) shows that tetradecane and hexadecane constitute a major portion of coke/coke precursors formed in ZSM-5. Therefore, we can assign the band at 314 nm to tetradecenyl or hexadecenyl cations. A link between these cations and tetradecane or hexadecane can be established through hydrogen transfer reactions.
Furthermore, charged alkylated benzenes are observed from a deconvoluted band at 390 nm.46,48 Alkylated benzenes were also observed from GC/MS analysis, and among them, 1,3-di-tert-butylbenzene was found to exhibit the most intense signal. Therefore, we can assign the band at 390 nm to a 1,3-di-tert-butylbenzenyl cation. The deconvoluted bands above 400 nm signify the presence of charged or neutral polyaromatics.46 However, the low Kubelka–Munk reflectance of these bands suggests that the formation of polyaromatics is retarded. The absence of polyaromatics from the hydrocarbons retained in ZSM-5 further supports this argument. This can be related to the strong influences of shape selectivity in ZSM-5 as evident from TGA and nitrogen physisorption measurements (section 3.3).
A similar pattern to that of ZSM-5 is observed for zeolite beta. For example, dienes and cyclopentenyl cations are observed from deconvoluted bands at 240 and 297 nm, respectively (see Fig. 6d). These species belong to the first group of bands which represents components that are highly correlated with the induction period. The band at 240 nm can be assigned to a highly substituted diene, as discussed earlier. On the band at 297 nm, Sorensen53 observed that the 1,2,3,4,4-pentamethylcyclopentenyl cation has a wavelength of maximum absorption at 297 nm. Wulfers and Jentoft54 measured the UV-vis spectrum resulting from 1,2,3,4,5-pentamethylcyclopentadiene absorption and found a maximum at 297 nm. Sorensen55 also reported a wavelength of maximum absorption at 297 nm for the 1-ethyl-2,3,4-trimethylcyclopentenyl cation. Therefore, we attribute the band observed in our study at 297 nm to a highly substituted cyclopentenyl cation.
At higher wavelengths, monoenyl cations, charged alkylated benzenes, and charged/neutral polyaromatics are observed from deconvoluted bands at 318, 386, and 465–565 nm, respectively. These species belong to the second group of bands which represents components that are strongly linked to catalyst deactivation. On the basis of GC/MS analysis of retained hydrocarbons, we could assign the bands corresponding to monoenyl cations and charged alkylated benzenes to tetradecenyl or hexadecenyl and 1,3-di-tert-butylbenzenyl cations, respectively. However, we could not make assignments for the bands corresponding to charged/neutral polyaromatics since these species were not observed from GC/MS analysis. We note that a significant portion of coke formed in zeolite beta was insoluble in the organic solvent used during extraction. This insoluble fraction of coke could be possessing the polyaromatics observed from UV-vis spectra. Hita et al.32 used Fourier-transform ion cyclotron resonance mass spectrometry to elucidate the molecular structure of insoluble coke formed on Ni-modified zeolites during ethene oligomerization. In agreement with our hypothesis, the authors found that insoluble coke is composed essentially of polyaromatics with three or more benzene rings. Therefore, we attribute the bands at 465–565 nm to anthracenes or higher aromatics.
3.6 Proposed deactivation mechanisms
Operando UV-vis spectra described the nature and evolution of deactivating species (and their precursors) and GC/MS analysis helped in chemically identifying these species. Meanwhile, solid-state NMR spectroscopy provided information on the mobility of species formed during reaction. These methods, collectively, gave a complex picture of the deactivation mechanism.As inferred from UV-vis spectra, the reaction started with a short induction period in which a hydrocarbon pool involving dienes and cyclopentenyl cations is formed. These species play no role in oligomer formation, as reported in previous studies.11,15 Instead, their observation as rigid species by NMR spectroscopy hints at an involvement in catalyst deactivation. In alkene interactions with zeolites, it has been widely recognized that dienes and cyclopentenyl cations mediate aromatics formation.11,40 Indeed, aromatics were observed in this study but only as immobile species that cause catalyst deactivation. Mobile aromatics were neither detected by gas chromatography nor NMR spectroscopy. These findings suggest that dienes and cyclopentenyl cations mainly function as mediators in the formation of deactivating aromatic species.
After the induction period, UV-vis spectral features of charged alkylated benzenes (i.e., 1,3-di-tert-butylbenzenyl cations) grew markedly, and this was observed for both ZSM-5 and zeolite beta. Simultaneously, these zeolites underwent rapid deactivation. This suggests that the formation of alkylated benzenes such as 1,3-di-tert-butylbenzene is strongly responsible for the rapid deactivation of ZSM-5 and zeolite beta. In addition, UV-vis spectral features of monoenyl carbenium ions emerged as ZSM-5 and zeolite beta deactivated. These features were assigned, based on GC/MS analysis of retained hydrocarbons, to tetradecane and hexadecane. This suggests that the formation of long oligomers is also responsible for the deactivation of ZSM-5 and zeolite beta. At later stages of the reaction (TOS > 30 min), UV-vis spectral features of charged/neutral polyaromatics grew at the expense of those of charged alkylated benzenes (see Fig. 6b). This suggests that alkylated benzenes evolve into bulkier polycyclic aromatic hydrocarbons, in agreement with observations by Li and Stair.56 We note, however, that this trend was particularly prevalent in zeolite beta. In ZSM-5, the UV-vis spectral features of charged/neutral polyaromatics grew much less intensely, suggesting that their formation is retarded.
To better understand why long oligomers and alkylated benzenes are being retained, thus causing deactivation, temperature-programmed experiments were performed. The reactor was purged with nitrogen after reaction and temperature was increased gradually from 523 to 673 K. The Kubelka–Munk reflectance of the UV-vis bands measured during this temperature ramp are shown in Fig. S7.† The reflectance of the bands assigned previously to long oligomers (314–318 nm) dropped significantly as temperature increased, implying a temperature sensitive retention of these species. This further implies that the retention of long oligomers is due to diffusion limitations imposed on these long chain hydrocarbons. Meanwhile, the reflectance of the bands assigned previously to charged alkylated benzenes (386–390 nm) remained nearly changed as temperature increased, implying a temperature insensitive retention of alkylated benzenes. This further implies that alkylated benzenes, given their bulky size, are retained because of spatial limitations (see section 3.3 for further details).
Based on the aforementioned results, we propose that ZSM-5 deactivates when alkylated benzenes such as 1,3-di-tert-butylbenzene and long oligomers such as tetradecane and hexadecane are formed. The formation of alkylated benzenes proceeds through dienyl and cyclopentenyl hydrocarbon pool species, while the formation of long oligomers is mediated by monoenyl carbenium ions. Zeolite beta deactivates similarly but with an additional contribution from polycyclic aromatic hydrocarbons. Their formation proceeds through further growth of alkylated benzenes in steps mediated by dienyl and cyclopentenyl hydrocarbon pool species.
4. Conclusions
The nature and evolution of deactivating species and their precursors in alkene oligomerization (523 K and 50–100 kPa of propene pressure) have been studied over ZSM-5 and zeolite beta by operando UV-vis and solid-state NMR spectroscopy along with chemical analysis of retained hydrocarbons. In both zeolites, deactivation is initiated by the formation of dienes and cyclopentenyl cations as hydrocarbon pool species, acting as a precursor for the formation of alkylated benzenes such as 1,3-di-tert-butylbenzene. These alkylated benzenes are so bulky that they find difficulty desorbing and end up retained as coke species. Deactivation also arises from the coupling of monoenyl carbenium ions, forming long oligomers such as tetradecane and hexadecane. Though having linear backbones, tetradecane and hexadecane experience strong diffusional constraints which ultimately lead to their entrapment within zeolite pores. Particularly in zeolite beta, deactivation is additionally caused by the growth of alkylated benzenes into polycyclic aromatic hydrocarbons. This growth results in the deposition of heavier coke species in zeolite pores.Data availability
The data supporting this article have been included as part of the ESI.†Conflicts of interest
The authors declare no competing financial interest.Acknowledgements
The authors gratefully acknowledge Youssef Saih, Gerard Clancy, Omar El Tall, and Abdelhamid Emwas for assistance with structural and chemical characterization, GC/MS analysis of retained hydrocarbons, and solid-state NMR spectroscopy. The authors also thank Sandra Ramirez for designing the graphical abstract of this work.References
- Catalysis and Zeolites: Fundamentals and Applications, ed. J. Weitkamp and L. Puppe, Springer, Berlin, Heidelberg, 1999 Search PubMed.
- J. M. Martinis and G. F. Froment, Ind. Eng. Chem. Res., 2006, 45, 954–967 CrossRef CAS.
- R. L. Espinoza, Ind. Eng. Chem. Prod. Res. Dev., 1984, 23, 449–452 CrossRef CAS.
- J. F. Haw, W. Song, D. M. Marcus and J. B. Nicholas, Acc. Chem. Res., 2003, 36, 317–326 CrossRef CAS PubMed.
- G. A. Olah, in Carbocation Chemistry, ed. G. A. Olah and G. K. S. Prakash, John Wiley & Sons, Hoboken, NJ, 2004, pp. 7–41 Search PubMed.
- I. Kiricsi and H. Förster, J. Chem. Soc., Faraday Trans. 1, 1988, 84, 491–499 RSC.
- I. Kiricsi, H. Förster, G. Tasi and J. B. Nagy, Chem. Rev., 1999, 99, 2085–2114 CrossRef CAS.
- A. C. Corma and S. Iborra, in Catalysts for Fine Chemical Synthesis: Microporous and Mesoporous Solid Catalysts, ed. E. G. Derouane, John Wiley & Sons, Chichester, West Sussex, 2006, vol. 4, pp. 125–140 Search PubMed.
- M. C. Grady and R. J. Gorte, J. Phys. Chem., 1985, 89, 1305–1308 CrossRef CAS.
- H. Förster, I. Kiricsi and J. Seebode, in Innovation in Zeolite Materials Science, ed. P. J. Grobet, W. J. Mortier, E. G. Vansant and G. Schulz-Ekloff, Elsevier Science Publishers B. V., Amsterdam, The Netherlands, 1988, vol. 37, pp. 435–442 Search PubMed.
- R. Chiappetta, S. Bodoardo, F. Geobaldo, F. Fajula and E. Garrone, Res. Chem. Intermed., 1999, 25, 111–129 CrossRef CAS.
- E. Tabor, M. Bernauer, B. Wichterlová and J. Dedecek, Catal. Sci. Technol., 2019, 9, 4262–4275 RSC.
- R. A. van Santen and G. J. Kramer, Chem. Rev., 1995, 95, 637–660 CrossRef CAS.
- W. Wang and M. Hunger, Acc. Chem. Res., 2008, 41, 895–904 CrossRef CAS.
- J. F. Haw, B. R. Richardson, I. S. Oshiro, N. D. Lazo and J. A. Speed, J. Am. Chem. Soc., 1989, 111, 2052–2058 CrossRef CAS.
- M. Boronat, P. M. Viruela and A. Corma, J. Am. Chem. Soc., 2004, 126, 3300–3309 CrossRef CAS.
- J. A. van Bokhoven, A. M. J. van der Eerden and R. Prins, J. Am. Chem. Soc., 2004, 126, 4506–4507 CrossRef CAS.
- M. L. Sarazen, E. Doskocil and E. Iglesia, J. Catal., 2016, 344, 553–569 CrossRef CAS.
- G. Spoto, S. Bordiga, G. Ricchiardi, D. Scarano, A. Zecchina and E. Borello, J. Chem. Soc., Faraday Trans., 1994, 90, 2827–2835 RSC.
- F. Geobaldo, G. Spoto, S. Bordiga, C. Lamberti and A. Zecchina, J. Chem. Soc., Faraday Trans., 1997, 93, 1243–1249 RSC.
- M. Boronat and A. Corma, Appl. Catal., A, 2008, 336, 2–10 CrossRef CAS.
- V. B. Kazansky, Acc. Chem. Res., 1991, 24, 379–383 CrossRef.
- A. Bhan, Y. V. Joshi, W. N. Delgass and K. T. Thomson, J. Phys. Chem. B, 2003, 107, 10476–10487 CrossRef CAS.
- M. L. Sarazen and E. Iglesia, Proc. Natl. Acad. Sci. U. S. A., 2017, 114, E3900–E3908 CrossRef CAS PubMed.
- B. Dimon, P. Cartraud, P. Magnoux and M. Guisnet, Appl. Catal., A, 1993, 101, 351–369 CrossRef CAS.
- M. Díaz, E. Epelde, J. Valecillos, S. Izaddoust, A. T. Aguayo and J. Bilbao, Appl. Catal., B, 2021, 291, 120076 CrossRef.
- Collection of Simulated XRD Powder Patterns for Zeolites, ed. M. M. J. Treacy and J. B. Higgins, Elsevier, 4th edn, 2001 Search PubMed.
- C. A. Emeis, J. Catal., 1993, 141, 347–354 CrossRef CAS.
- P. Magnoux, P. Roger, C. Canaff, V. Fouche, N. S. Gnep and M. Guisnet, in Catalyst Deactivation, ed. G. F. Froment and B. Delmon, Elsevier Science Publishers B. V., Amsterdam, The Netherlands, 1987, vol. 34, pp. 317–330 Search PubMed.
- L. E. Sandoval-Díaz, J. A. González-Amaya and C. A. Trujillo, Microporous Mesoporous Mater., 2015, 215, 229–243 CrossRef.
- N. Y. Chen, W. E. Garwood and F. G. Dywer, Shape Selective Catalysis in Industrial Applications, Marcel Dekker, New York, NY, 2nd edn, 1996 Search PubMed.
- I. Hita, H. O. Mohamed, Y. Attada, N. Zambrano, W. Zhang, A. Ramírez and P. Castaño, Catal. Sci. Technol., 2023, 13, 1288–1300 RSC.
- C. Costa, J. M. Lopes, F. Lemos and F. R. Ribeiro, J. Mol. Catal. A: Chem., 1999, 144, 207–220 CrossRef CAS.
- D. Chen, H. P. Rebo, K. Moljord and A. Holmen, Ind. Eng. Chem. Res., 1997, 36, 3473–3479 CrossRef CAS.
- M. L. Sarazen, E. Doskocil and E. Iglesia, ACS Catal., 2016, 6, 7059–7070 CrossRef CAS.
- E. L. First, C. E. Gounaris, J. Wei and C. A. Floudas, Phys. Chem. Chem. Phys., 2011, 13, 17339–17358 RSC.
- S. F. Zaman, K. F. Loughlin and S. S. Al-Khattaf, Ind. Eng. Chem. Res., 2005, 44, 2027–2035 CrossRef CAS.
- H. Jobic, W. Schmidt, C. B. Krause and J. Kärger, Microporous Mesoporous Mater., 2006, 90, 299–306 CrossRef CAS.
- S. Brandani, J. Caro, H. Jobic, J. Kärger, C. Krause and R. Staudt, in From Zeolites to Porous MOF Materials – the 40th Anniversary of International Zeolite Conference, ed. R. Xu, Z. Gao, J. Chen and W. Yan, Elsevier B. V., Beijing, China, 2007, vol. 170, pp. 981–987 Search PubMed.
- J. C. Vedrine, P. Dejaifve, E. D. Garbowski and E. G. Derouane, in Catalysis by Zeolites, ed. B. Imelik, C. Naccache, Y. Ben Taarit, J. C. Vedrine, G. Coudurier and H. Parliuad, Elsevier Scientific Publishing Company, Amsterdam, The Netherlands, 1980, vol. 5, pp. 29–37 Search PubMed.
- E. G. Derouane, J.-P. Gilson and J. B. Nagy, Zeolites, 1982, 2, 42–46 CrossRef CAS.
- Y. Ye, E. Abou-Hamad, X. Gong, T. B. Shoinkhorova, A. Dokania, J. Gascon and A. D. Chowdhury, Angew. Chem., Int. Ed., 2023, 62, e202303124 CrossRef CAS PubMed.
- P. M. Allotta and P. C. Stair, ACS Catal., 2012, 2, 2424–2432 CrossRef CAS.
- C. Pazè, B. Sazak, A. Zecchina and J. Dwyer, J. Phys. Chem. B, 1999, 103, 9978–9986 CrossRef.
- G. A. Olah, C. U. Pittman Jr, R. Waack and M. Doran, J. Am. Chem. Soc., 1966, 88, 1488–1495 CrossRef CAS.
- J. Goetze, F. Meirer, I. Yarulina, J. Gascon, F. Kapteijn, J. Ruiz-Martínez and B. M. Weckhuysen, ACS Catal., 2017, 7, 4033–4046 CrossRef CAS.
- Y. Jiang, J. Huang, V. R. Reddy Marthala, Y. S. Ooi, J. Weitkamp and M. Hunger, Microporous Mesoporous Mater., 2007, 105, 132–139 CrossRef CAS.
- W. Dai, C. Wang, M. Dyballa, G. Wu, N. Guan, L. Li, Z. Xie and M. Hunger, ACS Catal., 2015, 5, 317–326 CrossRef CAS.
- R. B. Woodward, J. Am. Chem. Soc., 1942, 64, 72–75 CrossRef CAS.
- N. C. Deno, J. Bollinger, N. Friedman, K. Hafer, J. D. Hodge and J. J. Houser, J. Am. Chem. Soc., 1963, 85, 2998–3000 CrossRef CAS.
- G. A. Olah, C. U. Pittman and M. C. R. Symons, in Carbonium Ions, ed. G. A. Olah and P. von R. Schleyer, John Wiley & Sons, New York, NY, 1968, vol. V Search PubMed.
- E. D. Hernandez and F. C. Jentoft, ACS Catal., 2020, 10, 5764–5782 CrossRef CAS.
- T. S. Sorensen, Can. J. Chem., 1964, 42, 2768–2780 CrossRef CAS.
- M. J. Wulfers and F. C. Jentoft, ACS Catal., 2014, 4, 3521–3532 CrossRef CAS.
- T. S. Sorensen, J. Am. Chem. Soc., 1967, 89, 3794–3803 CrossRef CAS.
- C. Li and P. C. Stair, Catal. Today, 1997, 33, 353–360 CrossRef CAS.
Footnotes |
| † Electronic supplementary information (ESI) available. See DOI: https://doi.org/10.1039/d4cy01057d |
| ‡ These authors contributed equally. |
| This journal is © The Royal Society of Chemistry 2025 |