Ag/Cu foam catalyst for selective reduction of CO2 to CH3OH at low potential†
Ruitao
Nie
,
Xiaolong
Deng
 ,
Haoyu
Yang
,
Hongwei
Chen
,
Jie
Yang
,
Meiyi
Lu
,
Keqi
Peng
,
Xiaoyu
Zhou
,
Chen
Yang
,
Juan
Xie
,
Haoyu
Yang
,
Hongwei
Chen
,
Jie
Yang
,
Meiyi
Lu
,
Keqi
Peng
,
Xiaoyu
Zhou
,
Chen
Yang
,
Juan
Xie
 * and
Hu
Wang
 *
*
School of New Energy and Materials, Southwest Petroleum University (SWPU), Chengdu 610500, China. E-mail: jxie@swpu.edu.cn; hwang@swpu.edu.cn; Fax: +86 28 83037480; Tel: +86 28 83037480
First published on 8th November 2024
Abstract
Electrocatalytic selective reduction of CO2 to liquid phase products, particularly methanol, is a promising technique for CO2 utilization. However, the challenge is daunting because the reduction of carbon dioxide to CH3OH requires six electron transfer reactions and four protons derived from water. In this study, a complex plating method was employed to modify the surface of Cu foam catalyst with Ag. The electrolyte solution used for CO2 reduction at a low potential (−0.1 V vs. RHE) was 0.1 M Na2SO4. This is the minimum voltage reported for methanol production, with a remarkable Faraday efficiency (FE) of 81.33%. The reduction products of CO2 in this system included CH3OH, CH4, CO and H2, the impact of silver plating duration on the electrochemical performance of Ag/Cu foam catalyst was examined and a reduction pathway of Ag/Cu foam catalyst in selective electrocatalytic CO2 was proposed.
1. Introduction
The increasing atmospheric CO2 levels resulting from fossil fuel combustion have raised significant environmental concerns. Electrochemical reduction of CO2 (eCO2R) presents a promising solution to address the challenges of energy and environmental sustainability.1 However, the eCO2R process encounters numerous challenges due to the inherent stability of CO2, leading to sluggish reaction kinetics. Additionally, the low solubility of CO2 in the electrolyte and competing reactions like the hydrogen evolution reaction (HER) further restrict overall reaction efficiency.2 To overcome these obstacles, extensive efforts have been dedicated towards enhancing CO2 reduction reactivity, reducing overpotential, and enhancing selectivity for desired reduction products. One effective strategy involves harnessing efficient energy utilization processes for capturing, storing or transforming CO2 into valuable carbon compounds using renewable electricity sources such as solar and wind power along with water as a proton source. This approach enables conversion of CO2 into a diverse range of carbon compounds including carbon monoxide, formate, methanol, methane, ethanol and ethylene which can also serve as potential energy sources.Highly active electrocatalysts are crucial during the eCO2R process. Among the various metal catalysts investigated for CO2 reduction, Cu has been demonstrated as the most promising candidate.3 Previous studies have demonstrated that Cu is the only transition metal electrocatalyst capable of converting CO2 to multi-carbon hydrocarbons and oxygenates, albeit with low efficiency and selectivity towards products.4,5 This can be attributed to its strongest interaction with reactant intermediates during the CO2 reduction process, which helps capture and stabilize these intermediates while preventing further dissociation or oxidation. Furthermore, Cu possesses an appropriate electronic structure characterized by advantages in band filling and energy level distribution, enabling efficient electron transfer and regulated reactivity.6 Additionally, Cu exhibits a high adsorption capacity for both CO2 and its intermediates on its surface, thereby promoting catalytic activity. Notably, it is worth mentioning that Cu is unique in having negative adsorption energy7–10 for *CO, while displaying positive adsorption energy for *H. This characteristic facilitates the adsorption of the carbo-oxygen group (*CO) intermediate during eCO2R due to its proper binding strength with *CO and the carbo-oxygen group (*CHO). As a result of these factors, a prolonged average residence time of *CO on the surface active sites and increased surface coverage are achieved.
Recently, Cu-based bimetallic catalysts have emerged as a promising candidate for enhancing the selectivity of CO2 electroreduction towards desired products. This can be achieved by precisely regulating the composition, structure, or morphology of these components to further modulate the adsorption behavior of crucial intermediates on the catalyst surface. For example, the Cu–Ag surface exhibits enhanced activity and selectivity for CO, while the compressively strained bimetallic Cu–Ag selectively produces multi/carbon oxygenates. The presence of Ag tends to suppress the competitive hydrogen evolution reaction,11 thereby promoting the formation of hydrocarbon–oxygen products such as alcohols, aldehydes, and acids through the dimerization of *CO followed by its reaction with water molecules. Copper-based materials exhibit selectivity towards hydrocarbon–oxygen products due to their ability to further reduce carbohydrates.12 Moreover, silver demonstrates low overpotential and high current density, facilitating the selective catalysis of CO2 to CO which serves as an intermediate for subsequent conversion, thereby enhancing the eCO2R.
Studies suggest that Ag/Cu bimetallic catalysts exhibit the potential to generate a diverse range of reduction products, including methane, methanol, and formic acid, during CO2 electrocatalysis.13 However, attaining high selectivity remains a formidable challenge, particularly in practical applications necessitating specific products. The performance of Ag/Cu bimetallic catalysts in eCO2R is still limited by their activity and stability constraints. Despite their favorable electron transfer properties and catalytic activity, long-term durability continues to pose a significant challenge. High current density and prolonged operation time can lead to issues such as deactivation and corrosion, presenting a demanding task for enhancing the stability and durability of Cu–Ag catalysts.
However, simultaneously achieving low potential, high Faraday efficiency, and high selectivity for the electrochemical conversion of CO2 to methanol remains a formidable challenge. The reduction of CO2 to hydrocarbons, aldehydes and alcohols exhibits a slightly positive equilibrium potential of reversible hydrogen electrode (RHE), but its direct electrochemical production still necessitates substantial energy input. Moreover, eCO2R processes require significant overpotential, resulting in operation at higher potential that reflect the minimum energy requirement for a given product. Consequently, these factors pose challenges not only from a technical standpoint but also from an economic perspective as they influence the feasibility and viability of large-scale implementation. In this study, Ag-modified copper foam was employed as a highly efficient electrocatalyst for the reduction of CO2 to C1 products. The primary products obtained included CH4, CO and CH3OH, exhibiting an impressive Faraday efficiency of 81.33% at a low potential (−0.1 V vs. RHE) on Ag/Cu foam.
2. Experimental
2.1. Catalyst synthesis
The 2 mm thick copper foam purchased from Suzhou Kesen was cut into pieces measuring 1 cm × 1.5 cm. The pretreatment process involved sequential ultrasonic treatment in acetone, 10% hydrochloric acid, anhydrous ethanol, and deionized water for a duration of 15 min each. Subsequently, the samples were placed in a vacuum drying oven for 3 hours before proceeding to composite electroplating. For this purpose, the copper foam was immersed in a mixed solution containing 1 mmol of silver nitrate and 10 mmol of trisodium citrate followed by electroless plating at a temperature of 40 °C under constant stirring at a speed of 200 rpm for a period of 60 min. Finally, the sample underwent vacuum drying at a temperature of 60 °C for 6 h. The control factors were adjusted accordingly for other catalysts used in this study following the aforementioned steps. All chemicals utilized were procured from Chengdu Colon Chemical Co., Ltd., and possessed analytical purity.2.2. Electrochemical measurements
The CO2 reduction performance of the Ag/Cu foam working electrode was evaluated using a three-electrode H-type cell in 0.1 M Na2SO4 solution, with Pt foil and Ag/AgCl electrode (saturated KCl filling solution) employed as the counter and reference electrodes, respectively. Prior to testing, N2 or CO2 gas was continuously introduced into the cathode compartment to create N2-saturated 0.1 M Na2SO4 (pH 8.45) or CO2-saturated 0.1 M Na2SO4 (pH 4.68) solutions. Initially, polarization curves of the Ag/Cu foam electrodes were measured under N2- and CO2-saturated atmospheres, followed by cyclic voltammetry (CV) and electrochemical impedance spectroscopy (EIS) tests conducted in a CO2-saturated atmosphere. The EIS data were analyzed using Zview software. The potentials provided herein have been IR-corrected and referenced to the reversible hydrogen electrode (RHE), employing eqn (S1).†2.3. CO2 reduction experiments and product analysis
The eCO2R experiment was conducted in a 0.1 M Na2SO4 solution saturated with CO2, where electrolysis was carried out within the potential range of −0.05 V (V vs. RHE) to −0.5 V (V vs. RHE), with an increment of 0.05 V. Prior to the eCO2R process, a continuous supply of CO2 into the cathode chamber for 40 min ensured sufficient availability, followed by a closed electrolysis period of 2 h. Gas phase product composition analysis was carried out using gas chromatography (GC, Techcomp, GC-7980). The gaseous sample was prepared using N2 (99.9999%) and passed through a Plot-Q capillary column packed in series. H2 detection utilized TCD, while CO and CH4 were detected by FID. The FE of the gas phase products (CO, H2, and CH4) can be calculated using eqn (1). | (1) |
![[thin space (1/6-em)]](https://www.rsc.org/images/entities/char_2009.gif) 485 C mol−1. n is the number of moles of the produced H2, CO, and CH4. Q refers to the total charge during eCO2R for gas chromatograms and standard curves of gases shown in Fig. S7–S9.† The low concentration of methanol was determined using meteorological chromatography (Techcomp, GC-7980) and the standard curve was constructed (Fig. S10†). The FE calculation (eqn (2)) can be used to determine the efficiency of gas phase products such as CH3OH.
485 C mol−1. n is the number of moles of the produced H2, CO, and CH4. Q refers to the total charge during eCO2R for gas chromatograms and standard curves of gases shown in Fig. S7–S9.† The low concentration of methanol was determined using meteorological chromatography (Techcomp, GC-7980) and the standard curve was constructed (Fig. S10†). The FE calculation (eqn (2)) can be used to determine the efficiency of gas phase products such as CH3OH. | (2) |
![[thin space (1/6-em)]](https://www.rsc.org/images/entities/char_2009.gif) 485 C mol−1). n is the number of moles of the produced CH3OH, and Q indicates the total charge during eCO2R. The higher concentration of CH3OH was determined using an ultraviolet spectrophotometer (UV-1780, Shimadzu), and a color rendering method based on a standard curve (Fig. S11†) was employed to assess its concentration.
485 C mol−1). n is the number of moles of the produced CH3OH, and Q indicates the total charge during eCO2R. The higher concentration of CH3OH was determined using an ultraviolet spectrophotometer (UV-1780, Shimadzu), and a color rendering method based on a standard curve (Fig. S11†) was employed to assess its concentration.
2.4. Computational modeling and DFT calculations
The DFT calculations were performed using the Perdew–Burke–Ernzerhof (PBE) functional within the generalized gradient exchange approximation (GGA) correlational functional in the CASTEP module.14 A 3 × 3 × 1 supercell was employed for the calculation process. Free energy calculations were performed using the Dmol3 module of Materials Studio, with geometry optimization using the PBE function of GGA. The dual numerical additive polarization (DNP) basis set was employed, and van der Waals interactions were adjusted using the DFT-D method with Grimme parameters. To account for layer-to-layer interactions, a vacuum space of 15 Å was applied along the z-direction. The energy convergence accuracy was set at 1 × 10⁻⁵ Ha, with maximum stress and displacement limits of 4 × 10⁻³ Ha Å−1 and 5 × 10⁻³ Ha, respectively. The Gibbs free energy change (ΔG) was calculated using eqn (S2).†3. Results and discussion
3.1. Characterization of Ag/Cu foam electrocatalysts
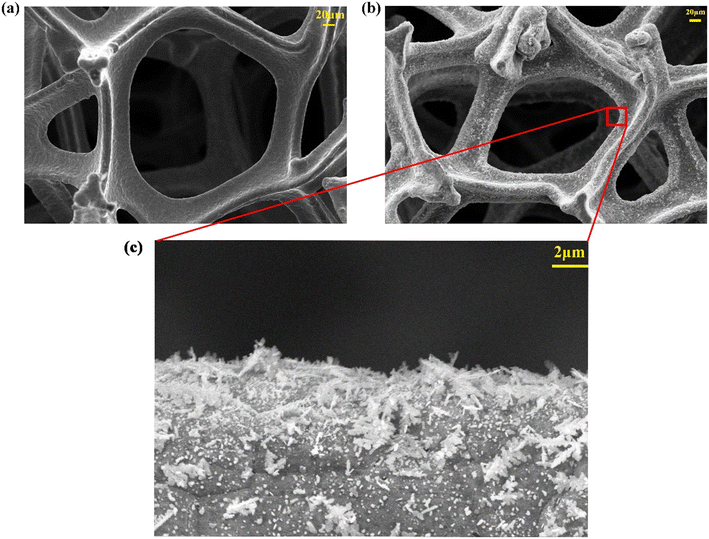
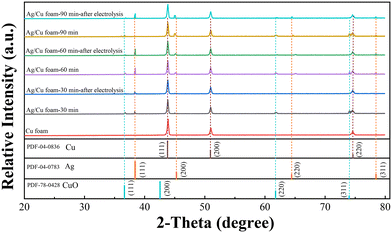
The morphology of Ag/Cu foam was examined via SEM analysis. As depicted in Fig. 1, the pore size and distribution of Ag on the copper foam were observed. It is evident that Ag/Cu foam contains a significantly higher amount of granular material compared to Cu foam. At higher magnification, the dendritic shape with intricate branches and leaves becomes clearly discernible. This hierarchical structure resembles that of trees, with sizes ranging from 0.3 μm to 2.5 μm. Under citrate conditions, dendritic structures were formed due to non-uniform growth and deposition processes on the surface of the Ag material.The crystal structure of Ag/Cu foam catalyst was analyzed using XRD patterns, as shown in Fig. 2. Ag/Cu foam-60 min refers to Cu foam silver plating for 60 min, and so forth. The XRD patterns of the prepared Cu catalysts exhibit distinct characteristic peaks corresponding to the microcrystalline structures of Cu (PDF card no. 04-0836) and CuO (PDF card no. 78-0428), indicating the formation of a composition consisting of both Cu and CuO phases. The formation of CuO is observed when Ag/Cu foam is crushed into particles. This can be attributed to the oxidation of the surface of Cu powder upon contact with air due to the presence of loaded Ag particles on the copper foam matrix, as confirmed by Ag (PDF card no. 04-0783). The XRD patterns obtained from bimetallic electrodes reveal that diffraction peaks corresponding to Cu (111) and Cu (200) shift towards higher angles, while those related to Ag (200) and Ag (220) shift towards lower angles. These observations suggest minimal alloying between Cu and Ag, with a more pronounced peak shift observed as complexation time increases. In particular, in the case of complex silver plating for 30 min on Ag/Cu foam, predominantly exposed crystal surfaces are identified as being composed solely by Ag (111), without any other visible crystalline surfaces evident in the XRD pattern analysis results. Furthermore, migration tendencies are more prominent for crystal surfaces represented by peaks related to Ag (200) and Ag (220), particularly noticeable when comparing samples plated for either 90 or 60 min on Ag/Cu foam. Through characterization after electrolysis, it was observed that the CuO peak was absent from all samples. This result can be attributed to the reached reduction potential of CuO during eCO2R, resulting in the reduction of CuO, and thus its disappearance on the electrode. The main peaks associated with Ag are present, indicating that the attached Ag is stable.
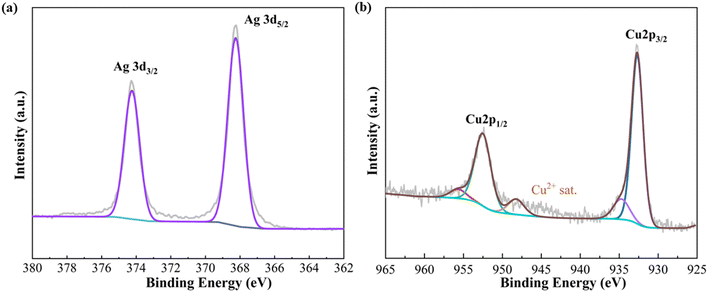
The XPS technique was employed to investigate the surface chemical state and electronic structure. As depicted in Fig. 3, the Ag/Cu foam-60 min sample exhibited identical peaks for Ag 3d3/2 (374.2 eV) and Ag 3d5/2 (368.2 eV), as shown in Fig. 3(a), indicating a zero valence chemical state (Ag0). This observation is consistent with the spin–orbit splitting characteristic of the Ag 3d peak. Analysis of the Cu 2p XPS spectrum of Ag/Cu foam-60 min revealed characteristic peaks corresponding to Cu0's Cu 2p3/2 and Cu 2p1/2 levels. Additionally, a prominent peak at 948 eV was observed in the Cu 2p region map, positioned on the high binding energy side of the main Cu 2p3/2 peak. Typically, satellite peaks associated with Cu2+ appear around 943 eV. However, considering the presence of CuO in the XRD spectrum, we attribute this shift towards higher binding energy to electron energy state modification induced by introduced Ag affecting the outermost copper orbitals.
3.2. Evaluation of electrochemical CO2 reduction performance of Ag/Cu foam
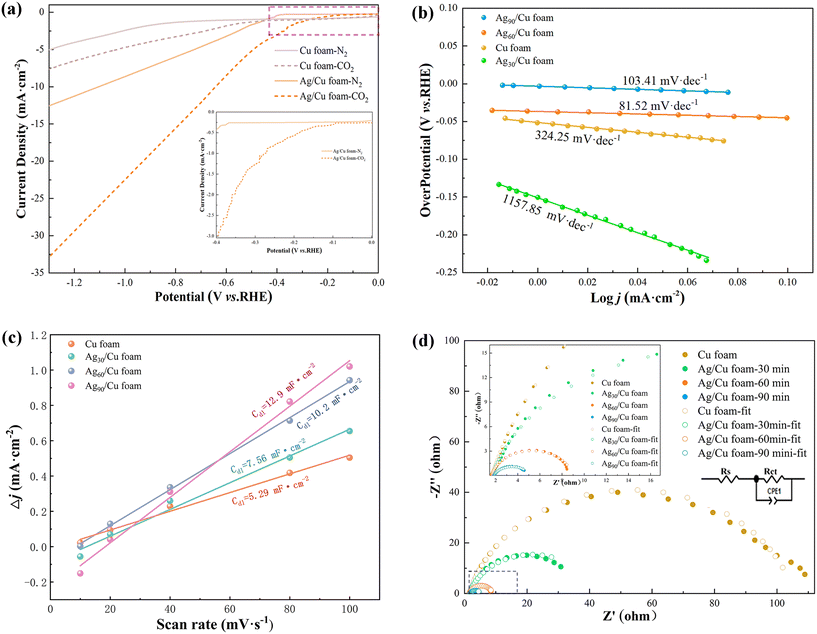
Based on Fig. 4(a), it can be inferred that Ag/Cu foam exhibits electrochemical reduction of CO2, enabling the investigation of the influence of silver plating time on eCO2R, as presented in Fig. S4.† The response of Ag/Cu foam-x min to eCO2R can be attributed to its higher current density in CO2-saturated electrolyte compared with N2-saturated electrolyte, further confirming the enhanced performance of Ag growth on copper foam over blank Cu foam. Furthermore, valuable insights into the eCO2R dynamics can be obtained from the Tafel curve analysis. As depicted in Fig. 4(b), the linear segment of the Tafel curve is fitted using eqn (3):
η = a + b![[thin space (1/6-em)]](https://www.rsc.org/images/entities/char_2009.gif) log log![[thin space (1/6-em)]](https://www.rsc.org/images/entities/char_2009.gif) j j | (3) |
The electrochemical experiment confirms that Ag/Cu foam-60 min exhibits the lowest Tafel slope among all tested samples of Ag/Cu foam-x min. Systems with lower Tafel slopes typically exhibit higher catalyst activity, indicating enhanced promotion of the reaction, and provide more efficient reaction sites at a reduced potential. A higher electron transfer rate facilitates faster progress in the reaction while achieving a greater current density response at a lower potential, as demonstrated in Fig. 4(a). Compared to Cu foam, Ag/Cu foam-60 min exhibited higher jCO2 than jN2 under different gas atmospheres and displayed an earlier inflection point. Furthermore, bifurcation of current density was observed for Ag/Cu foam-60 min at −0.1 V under two gas atmospheres, as shown in Fig. S4.† Inflection points were observed for Ag/Cu foam-30 min and Ag/Cu foam-90 min at −0.43 VRHE and −0.3 VRHE, respectively, indicating that Ag/Cu foam-60 min possesses comparatively lower potential for promoting eCO2R.
Additionally, to gain a more profound comprehension of the origin of Ag/Cu foam's enhanced activity, we conducted an analysis of the electrochemically active surface area by measuring double layer capacitance (Cdl). The electrode's Cdl was determined through CV analysis, which involved scanning rates ranging from 10 to 100 mV s−1 in CO2-saturated Na2SO4 electrolyte (0.1 M). The voltage range for the selected CV curve was between 0 V (V vs. RHE) and 0.05 V (V vs. RHE). Fig. 4(c) illustrates that Ag/Cu foam-60 min exhibits a maximum capacitance value of 10.2 mF cm−2. Complete CV diagrams can be found in Fig. S5.† EIS measurements were conducted under constant overpotential, as depicted in Fig. 4(d). EIS measurements provide valuable insights into catalysts' charge-transfer resistance with the semicircle observed in the Nyquist plot attributed to Rct representing charge transfer resistance where lower Rct indicates faster reaction rates. As expected, Ag/Cu foam-60 min displays significantly lower Rct compared to other catalysts and blank samples. To evaluate charge transfer behavior, EIS analyses were conducted, revealing excellent conductivity and faster reaction kinetics as demonstrated by impedance calculations described in Table S1.† Notably, during the complex silver plating process, Ag/Cu foam-90 min exhibited a relatively superior electrochemical performance, while Fig. S6† shows that the instability of IT prevented it from being chosen as an optimal catalyst evidenced by a sharp drop in current density during testing. The reduction of the Ag peak on the surface of Ag/Cu foam-90 min is observed in Fig. 2, following a complex plating process that lasted for 60 min. The complete exposure of Ag leads to the accumulation of tree-like morphologies, which are clearly visible in SEM images. This phenomenon can be attributed to the coupling between citric acid anions and metal ions, which affects nucleation and growth locations. Consequently, an excessive accumulation of dendritic Ag on the surface of copper foam occurs as a result. Notably, during the experiment, a gray flocculent structure was observed precipitating into the H-type electrolytic cell when high voltage was applied, which is consistent with previous XRD test findings.
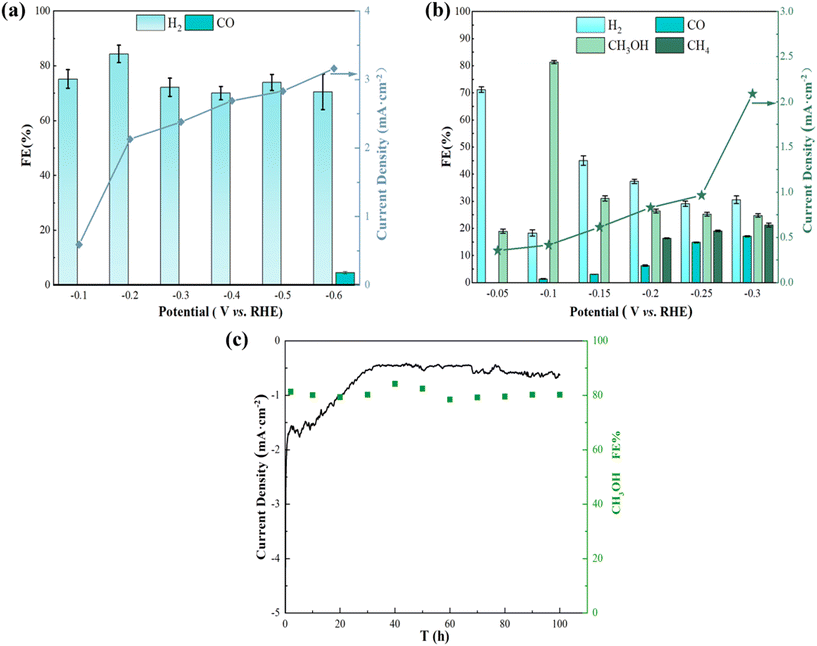
In order to further investigate the distribution of reduction products and narrow down the voltage gap between them, potentiostatic electrolysis experiments were conducted on Ag/Cu foam-60 min at various applied potentials. Additionally, potential-dependent electrolysis experiments with CO2-saturated 0.1 M Na2SO4 electrolyte (duration 2 h) were performed. The gas and liquid products were analyzed using gas chromatography and ultraviolet spectrophotometry, as detailed in Fig. S7–S11.† The results of the electrolysis experiments are presented in Fig. 5(b), indicating that eCO2R can be achieved at a remarkably low potential of Ag/Cu foam-60 min, while CH3OH formation occurs at −0.05 VRHE. At −0.1 VRHE, the Faraday efficiency of CH3OH reaches 81.33%, demonstrating that CO2 reduction to CH3OH is predominantly driven by Ag inhibition of the hydrogen evolution reaction. It was observed that an increase in voltage at −0.2 VRHE resulted in the appearance of CH4 as a product; however, its Faraday efficiency was low due to the requirement for more electrons for its reduction compared to generating CH3OH which requires only 6 electrons. Insufficient energy output at a lower potential hindered the enhancement of CH4 yield. In this work, we successfully regulated the Faraday efficiency of the product by adjusting the voltage: high selectivity for methanol was achieved when controlling the voltage at −0.1 VRHE, whereas methanol appeared when increasing the voltage level. As higher voltages were used, both Faraday efficiency and selectivity towards methanol decreased while methane production increased. Moreover, long-term electrolysis was performed for 100 h at a stationary cathode potential of −0.1 VRHE to test the stability of Ag/Cu foam (Fig. 5(c)), which was another major concern for eCO2R performance evaluation. The superior performance described in this study can be compared with other relevant studies as summarized in Table 1.
| Electrocatalyst | Electrolyte | Potential (V) | FE (%) | Ref. |
|---|---|---|---|---|
| Cu63.9Au36.1/NCF | 0.5 M KHCO3 | −1.1 (V vs. RHE) | 15.9 | 20 |
| FeS2/NiS | 0.5 M KHCO3 | −0.6 (V vs. RHE) | 64 | 21 |
| Pd/SnO2 | 0.1 M NaHCO3 | −0.24 (V vs. RHE) | 54.8 | 22 |
| Oxide-derived Cu/C | 0.1 M KHCO3 | −0.3 (V vs. RHE) | 43.2 | 23 |
| Cu2O/MWCNTs | 0.5 M NaHCO3 | −0.8 (V vs. RHE) | 38 | 24 |
| Ag/Cu foam | 0.1 M Na2SO4 | −0.10 (V vs. RHE) | 81.33 | This work |
| PO-5 nm Co/SL-NG | 0.1 M NaHCO3 | −1.0 (V vs. SCE) | 23.2 | 25 |
| Cu2O nanoparticles | KHCO3 | −2.0 (V vs. SHE) | 47.5 | 26 |
| BP | 0.1 M KHCO3 | −0.5 (V vs. RHE) | 92.0 | 27 |
| Zn/Ag | 0.1 M KHCO3 | −1.38 (V vs. RHE) | 10.5 | 28 |
| Pd83Cu17 aerogel | [Bmim][BF4]![[thin space (1/6-em)]](https://www.rsc.org/images/entities/char_2009.gif) : :![[thin space (1/6-em)]](https://www.rsc.org/images/entities/char_2009.gif) H2O (1 H2O (1![[thin space (1/6-em)]](https://www.rsc.org/images/entities/char_2009.gif) : :![[thin space (1/6-em)]](https://www.rsc.org/images/entities/char_2009.gif) 3) 3) |
−2.1 (V vs. Ag/Ag+) | 80 | 29 |
| Ag–Co3O4–CeO2-LGC | 0.1 M KHCO3 | −0.85 (V vs. RHE) | 23.4 | 30 |
| Cu1.63Se(1/3) | 30% [Bmim][PF6]/MeCN/H2O (5%) | −2.1 (V vs. Ag/Ag+) | 77.6 | 31 |
| Fe2P2S6 | 0.5 M NaHCO3 | −0.20 (V vs. RHE) | 65.2 | 32 |
| C–Py–Sn–Zn | 0.01 mol L−1 4-aminopyridine and 0.1 mol L−1 LiClO4 ethanol | −0.5 (V vs. RHE) | 59.9 | 33 |
| [PYD]@Pd | 0.5 M KCl | −0.04 (V vs. RHE) | 35 | 34 |
| Co(CO3)0.5(OH)·0.11H2O | 0.1 M KHCO3 | −0.34 (V vs. RHE) | 97 | 35 |
The Faraday efficiency of H2 observed on the bimetallic electrode is significantly lower compared to that observed on the Cu foam. In contrast, the Cu–Ag bimetallic electrode effectively utilizes most of this current for CH3OH production, achieving an average FE exceeding 20%. However, a fraction of the current is also utilized for synthesizing CO and CH4 on bare Cu foam at −0.6 VRHE with no CH4 generation. Remarkably, the bimetallic electrode exhibits exceptional selectivity towards carbon-containing oxygen compounds, reaching a maximum Faraday efficiency of 81.33%, which cannot be achieved using bare Cu foam.
3.3. High selectivity mechanism of Ag/Cu foam for electrocatalytic reduction of CO2 to CH3OH
The eCO2R reaction occurs at the interface between the electrode and the electrolyte, where the former serves as a solid electrocatalyst while the latter is an aqueous solution containing CO2.33 Electrocatalytic reactions typically occur at this interface between the active site of the material and the electrolyte, involving several steps:35 (1) CO2 molecules are adsorbed onto the electrode surface to form a partially charged *CO2δ− species through interaction with surface metal atoms. It should be noted that carbon dioxide can be physically adsorbed as a linear molecule during electrolysis and further activated by electrode surface defects and solvent action.36,37 (2) Electron transfer and protonation lead to the cleavage of C![[double bond, length as m-dash]](https://www.rsc.org/images/entities/char_e001.gif) O bonds, forming new C–H and C–O bonds. (3) Rearrangement of products is followed by desorption from active sites and diffusion into bulk electrolyte solutions. Carbon dioxide molecules possess linearity with two σ bonds and two π43 bonds between their carbon and oxygen atoms, resulting in partial triple bond properties for their double bonds that shorten their length significantly.
O bonds, forming new C–H and C–O bonds. (3) Rearrangement of products is followed by desorption from active sites and diffusion into bulk electrolyte solutions. Carbon dioxide molecules possess linearity with two σ bonds and two π43 bonds between their carbon and oxygen atoms, resulting in partial triple bond properties for their double bonds that shorten their length significantly.
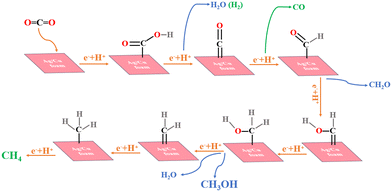
Based on previous experimental studies and DFT calculations,38–42 the eCO2R pathway43,44 in this catalyst is illustrated in Fig. 6. The selected crystal faces are Cu (111) and Ag (111), which correspond to the predominant crystal facets determined by XRD analysis. CO2 molecules adsorb onto the surface of Cu–Ag, forming partially charged *CO2δ− species that interact with Ag atoms for adsorption, subsequently generating *COOH groups at low voltage conditions. Free *H in water combines to produce H2 as a by-product. A fraction of *COOH transforms into *CO intermediates, which exhibit high instability and eventually lead to CO overflow in the electrolyte solution. Another portion of *CO reacts with available *H in solution to form *CH2O intermediates; notably, Cu exhibits positive adsorption energy towards *H, facilitating CH3OH formation through subsequent combination reactions with available hydrogen atoms. As voltage increases, some of the *H within the solvated *CH2O species undergoes dehydrogenation and forms intermediate species containing C double bonds (*CH2). These intermediates then combine with two additional hydrogen atoms (*H) to yield CH4 production, further confirming that Cu (111) promotes CH4 formation. This proposed mechanism aligns well with experimental observations where CH3OH and CO are predominantly produced at low voltage while an increase in voltage leads to enhanced generation of electrons, resulting in increased CH4 production.
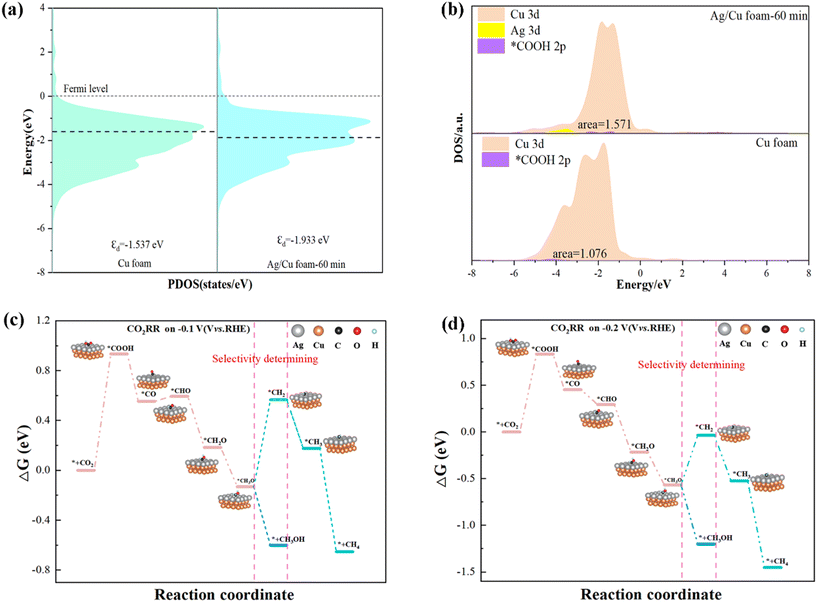
During the Materials Studio modeling process, the unit cells of Cu and Ag were imported. Subsequently, the crystal planes of Cu (111) and Ag (111) were cut, followed by stacking and optimization of the two supercell structures to obtain a minimum energy unit configuration consisting of two layers of Cu and one layer of Ag, as shown in Fig. 7. This structure will serve as our model for Ag/Cu catalysts, on which we will conduct a series of calculations. In this work, CH4 is produced at −0.2 V potential. Based on DFT calculations performed under two different potential conditions for all reduction products, it was determined that *COOH formation represents the rate-determining step with respect to the first carbon intermediate's energy barrier. In terms of hydrocarbon formation, *CO plays a crucial role; previous research conducted by Sargent et al.'s group45 on M-doped Cu systems revealed that Ag-doped Cu exhibits the lowest activation energy for C1–C1 and C1–C2 coupling reactions. These findings indicate that Ag-doped Cu serves as an efficient catalyst for generating C+ products from *CO intermediates, a conclusion consistent with our calculations.
Bader charge analysis was conducted to investigate the impact of electrons on the bonding strength of intermediates and the electronic structure of catalysts. Following Ag plating, the D-band center of Ag/Cu foam-60 min (−1.933 eV) catalyst was observed to be lower than that of Cu foam (−1.537 eV), indicating a doping effect and local structural deformation. It is reasonable to hypothesize that strong *COOH adsorption leads to the entrapment of intermediates on the Cu surface. In both doped catalysts, there are more electrons in the Cu active center near the heteroatom in Ag/Cu foam-60 min compared to Cu foam near the Fermi level (Fig. 7(a)). These disparities suggest that Ag/Cu foam-60 min exhibits a mild form of *COOH bonding, where orbital overlap area and anti-bonding orbitals co-regulate interactions, thereby facilitating subsequent methanol formation (Fig. 7(b)).
The voltage difference between the two is only 0.1 V, and the energy barrier does not result in a significant disparity (ΔG is 0.933 eV at −0.1 VRHE, and 0.833 eV at −0.2 VRHE). The relatively low free energy barrier that needs to be overcome at these voltages also accounts for the high FE% of eCO2R observed in this study. At −0.1 VRHE, the process from *CO hydrogenation to *COH necessitates overcoming an additional free energy barrier ΔG = 0.379 eV, indicating that electrochemical eCO2R at the Cu–Ag interface constructed here is both thermodynamically and kinetically feasible. The crucial intermediate for subsequent steps involves either hydrogenating *CH3O to CH3OH or dehydrating it to form *CH2; thus, our focus will be on its selectivity analysis. At −0.1 VRHE, ΔG for CH3OH formation is −0.6 eV while ΔG for *CH2 formation it is 0.566 eV; clearly demonstrating that under this voltage condition, CH3OH formation occurs more favorably than *CH2 formation does due to lower activation barriers associated with it in thermodynamic and kinetic aspects, respectively. At −0.2 VRHE, we can intuitively observe a decrease in the ΔG value of *CH2 which drops to −0.034 eV; further hydrogenation of *CH3 through two consecutive steps leads directly towards methane generation as predicted by favorable thermodynamic and dynamic conditions, explaining why CH4 production predominates at −0.2 VRHE. As depicted in Fig. 7(c) and (d), regardless of potential conditions considered, the pathway leading towards CH4 production must involve a dehydration step following the hydrogen evolution reaction involving *CH3O, whereas the selective determination step governing CH3OH production must involve direct hydrogenation of *CH3O as supported by DFT calculations presented in Fig. S11–S13.†
According to the aforementioned calculation results, it is evident that the intermediates involved in product formation can be effectively regulated by manipulating the voltage, thereby influencing the pathway of product generation. Specifically, at −0.1 V, *CH3O intermediates assume a pivotal role as they exhibit a higher propensity to react with *H and form methanol rather than eliminating water molecules to generate *CH2. This phenomenon substantiates our ability to achieve remarkably selective reduction of methanol under low voltage conditions.
4. Conclusion
We demonstrate that dual doping of Ag/Cu foam with appropriate components represents a promising strategy for enhancing the eCO2R to methanol. By adjusting the voltage, Ag/Cu foam exhibits improved selectivity towards CH3OH, achieving an FE% as high as 81.33%. Furthermore, this catalyst demonstrates excellent stability over a period of 100 h and promotes CH4 production. Our DFT calculations reveal that low voltages favor CH3OH generation, while high voltages lead to CH4 formation, consistent with experimental observations. The introduction of Ag effectively suppresses the hydrogen evolution reaction and facilitates the generation of *CO species, which can be readily protonated into *CHO intermediates and subsequently converted into either CH4 or CH3OH. These findings highlight the potential application of our efficient and stable catalyst in eCO2R for methanol synthesis.Data availability
The data supporting this article have been included as part of the ESI.†Conflicts of interest
The authors hereby disclose that they have no known financial or personal relationships that could be perceived as potential conflicts of interest and may have influenced the findings presented in this paper.Acknowledgements
This work was financially supported by the Production-Education Integration Demonstration Project of the Province “Photovoltaic Industry Production-Education Integration Comprehensive Demonstration Base of Sichuan Province (Sichuan Financial Education [2022] No. 106)”.References
- G. A. Olah, G. K. S. Prakash and A. Goeppert, J. Am. Chem. Soc., 2011, 133, 12881–12898 CrossRef CAS PubMed.
- D. T. Whipple and P. J. A. Kenis, J. Phys. Chem. Lett., 2010, 1, 3451–3458 CrossRef CAS.
- D. Raciti and C. Wang, ACS Energy Lett., 2018, 3, 1545–1556 CrossRef CAS.
- X. Hong, H. Zhu, D. Du, Q. Zhang and Y. Li, Catalysts, 2023, 13, 376 CrossRef CAS.
- O. F. Lopes and H. Varela, ChemistrySelect, 2018, 3, 9046–9055 CrossRef CAS.
- A. A. Peterson, F. Abild-Pedersen, F. Studt, J. Rossmeisl and J. K. Norskov, Energy Environ. Sci., 2010, 3, 1311–1315 RSC.
- S. Back, J.-H. Kim, Y.-T. Kim and Y. Jung, ACS Appl. Mater. Interfaces, 2016, 8, 23022–23027 CrossRef CAS.
- A. Bagger, W. Ju, A. S. Varela, P. Strasser and J. Rossmeisl, ChemPhysChem, 2017, 18, 3266–3273 CrossRef CAS.
- S. Nitopi, E. Bertheussen, S. B. Scott, X. Liu, A. K. Engstfeld, S. Horch, B. Seger, I. E. L. Stephens, K. Chan, C. Hahn, J. K. Norskov, T. F. Jaramillo and I. Chorkendorff, Chem. Rev., 2019, 119, 7610–7672 CrossRef CAS.
- S. Popovic, M. Smiljanic, P. Jovanovic, J. Vavra, R. Buonsanti and N. Hodnik, Angew. Chem., Int. Ed., 2020, 59, 14736–14746 CrossRef CAS.
- C. Kim, T. Eom, M. S. Jee, H. Jung, H. Kim, B. K. Min and Y. J. Hwang, ACS Catal., 2017, 7, 779–785 CrossRef CAS.
- J. Yuan, M.-P. Yang, Q.-L. Hu, S.-M. Li, H. Wang and J.-X. Lu, J. CO2 Util., 2018, 24, 334–340 CrossRef CAS.
- W. Zhu, B. M. Tackett, J. G. Chen and F. Jiao, Top. Curr. Chem., 2018, 376, 41 CrossRef PubMed.
- J. Xie, P. Bai, C. Wang, N. Chen, W. Chen, M. Duan and H. Wang, ACS Appl. Energy Mater., 2022, 5, 9559–9570 CrossRef CAS.
- W. Su, L. Ma, Q. Cheng, K. Wen, P. Wang, W. Hu, L. Zou, J. Fang and H. Yang, J. CO2 Util., 2021, 52, 101698 CrossRef CAS.
- A. Dutta, I. Z. Montiel, R. Erni, K. Kiran, M. Rahaman, J. Drnec and P. Broekmann, Nano Energy, 2020, 68, 104331 CrossRef CAS.
- A. Courty, M. Bayle and R. Carles, J. Raman Spectrosc., 2019, 50, 74–84 CrossRef CAS.
- J. Greeley, T. F. Jaramillo, J. Bonde, I. B. Chorkendorff and J. K. Norskov, Nat. Mater., 2006, 5, 909–913 CrossRef CAS PubMed.
- E. L. Clark, C. Hahn, T. F. Jaramillo and A. T. Bell, J. Am. Chem. Soc., 2017, 139, 15848–15857 CrossRef CAS PubMed.
- F. Jia, X. Yu and L. Zhang, J. Power Sources, 2014, 252, 85–89 CrossRef CAS.
- S. Zhao, S. Guo, C. Zhu, J. Gao, H. Li, H. Huang, Y. Liu and Z. Kang, RSC Adv., 2017, 7, 1376–1381 RSC.
- W. Zhang, Q. Qin, L. Dai, R. Qin, X. Zhao, X. Chen, D. Ou, J. Chen, T. T. Chuong, B. Wu and N. Zheng, Angew. Chem., Int. Ed., 2018, 57, 9475–9479 CrossRef CAS.
- K. Zhao, Y. Liu, X. Quan, S. Chen and H. Yu, ACS Appl. Mater. Interfaces, 2017, 9, 5302–5311 CrossRef CAS PubMed.
- M. I. Malik, Z. O. Malaibari, M. Atieh and B. Abussaud, Chem. Eng. Sci., 2016, 152, 468–477 CrossRef.
- J. Huang, X. Guo, G. Yue, Q. Hu and L. Wang, ACS Appl. Mater. Interfaces, 2018, 10, 44403–44414 CrossRef CAS.
- J. Hazarika and M. S. Manna, Electrochim. Acta, 2019, 328, 135053 CrossRef CAS.
- S. Mou, T. Wu, J. Xie, Y. Zhang, L. Ji, H. Huang, T. Wang, Y. Luo, X. Xiong, B. Tang and X. Sun, Adv. Mater., 2019, 31, 1903499 CrossRef.
- Q. H. Low, N. W. X. Loo, F. Calle-Vallejo and B. S. Yeo, Angew. Chem., Int. Ed., 2019, 58, 2256–2260 CrossRef CAS PubMed.
- L. Lu, X. Sun, J. Ma, D. Yang, H. Wu, B. Zhang, J. Zhang and B. Han, Angew. Chem., Int. Ed., 2018, 57, 14149–14153 CrossRef CAS.
- Q. Zhang, J. Du, A. He, Z. Liu and C. Tao, J. CO2 Util., 2019, 34, 635–645 CrossRef CAS.
- D. Ren, Y. Deng, A. D. Handoko, C. S. Chen, S. Malkhandi and B. S. Yeo, ACS Catal., 2015, 5, 2814–2821 CrossRef CAS.
- L. Ji, L. Chang, Y. Zhang, S. Mou, T. Wang, Y. Luo, Z. Wang and X. Sun, ACS Catal., 2019, 9, 9721–9725 CrossRef CAS.
- W. Huang and G. Yuan, Electrochem. Commun., 2020, 118, 106789 CrossRef CAS.
- H.-P. Yang, S. Qin, H. Wang and J.-X. Lu, Green Chem., 2015, 17, 5144–5148 RSC.
- J. Huang, Q. Hu, X. Guo, Q. Zeng and L. Wang, Green Chem., 2018, 20, 2967–2972 RSC.
- M. R. Singh, E. L. Clark and A. T. Bell, Phys. Chem. Chem. Phys., 2015, 17, 18924–18936 RSC.
- J. L. Inglis, B. J. MacLean, M. T. Pryce and J. G. Vos, Coord. Chem. Rev., 2012, 256, 2571–2600 CrossRef CAS.
- A. Politano, V. Formoso and G. Chiarello, J. Chem. Phys., 2008, 129, 164703 CrossRef CAS.
- H.-R. M. Jhong, S. Ma and P. J. A. Kenis, Curr. Opin. Chem. Eng., 2013, 2, 191–199 CrossRef.
- J. D. Goodpaster, A. T. Bell and M. Head-Gordon, J. Phys. Chem. Lett., 2016, 7, 1471–1477 CrossRef PubMed.
- X. Nie, M. R. Esopi, M. J. Janik and A. Asthagiri, Angew. Chem., Int. Ed., 2013, 52, 2459–2462 CrossRef CAS.
- G. L. D. Gregorio, T. Burdyny, A. Loiudice, P. Iyengar, W. A. Smith and R. Buonsanti, ACS Catal., 2020, 10, 4854–4862 CrossRef.
- Y. R. Lei, Y. X. Niu, X. L. Tang, X. T. Yu, X. B. Huang, X. Q. Lin, H. H. Yi, S. Z. Zhao, J. Y. Jiang, J. Y. Zhang and F. Y. Gao, J. Energy Chem., 2024, 97, 593–611 CrossRef CAS.
- L. Xue, C. Zhang, J. Wu, Q.-Y. Fan, Y. Liu, Y. Wu, J. Li, H. Zhang, F. Liu and S. Zeng, Appl. Catal., B, 2022, 304, 120951 CrossRef CAS.
- X. Wang, Z. Wang, T.-T. Zhuang, C.-T. Dinh, J. Li, D.-H. Nam, F. Li, C.-W. Huang, C.-S. Tan, Z. Chen, M. Chi, C. M. Gabardo, A. Seifitokaldani, P. Todorovic, A. Proppe, Y. Pang, A. R. Kirmani, Y. Wang, A. H. Ip, L. J. Richter, B. Scheffel, A. Xu, S.-C. Lo, S. O. Kelley, D. Sinton and E. H. Sargent, Nat. Commun., 2019, 10, 5186 CrossRef PubMed.
Footnote |
| † Electronic supplementary information (ESI) available. See DOI: https://doi.org/10.1039/d4cy01056f |
| This journal is © The Royal Society of Chemistry 2025 |

