 Open Access Article
Creative Commons Attribution 3.0 Unported Licence
Photoluminescence and self-assembly of three different Eu complexes†
Adrian
Ebert
 *a,
Lukas
Gerhard
 b,
Julia
Feye
 c,
Senthil Kumar
Kuppusamy
 d,
Barbora
Brachnakova
d,
Mario
Ruben
d,
Barbora
Brachnakova
d,
Mario
Ruben
 bde,
Peter W.
Roesky
 cd and
Wulf
Wulfhekel
b
aInstitute for Quantum Materials and Technologies, Karlsruhe Institute of Technology, Karlsruhe, Germany. E-mail: adrian.ebert@kit.edu
bInstitute for Quantum Materials and Technologies, Karlsruhe Institute of Technology, Karlsruhe, Germany
cInstitute for Inorganic Chemistry, Karlsruhe Institute of Technology, Karlsruhe, Germany
dInstitute of Nanotechnology, Karlsruhe Institute of Technology, Karlsruhe, Germany
eCentre Européen de Sciences Quantiques (CESQ), Institut de Science et d’Ingénierie Supramoléculaire (ISIS), Université de Stras-bourg, Strasbourg, France
First published on 10th June 2025
Abstract
In this study, we investigate the photoluminescence and the self-assembly of three distinct europium (Eu) complexes—[Eu(tta)3(bpy)] (tris(thenoyltrifluoroacetonate)europium(III)2,2'-bipyridine), [Eu(btfa)3(bpy)] (tris(4,4,4-trifluoro-1-phenyl-1,3-butanedione)europium(III)2,2'-bipyridine), and [Eu(tta)3(H2O)2] (tris(thenoyltrifluoroacetonate)europium(III)dihydrate)—on a Au(111) surface. Utilizing scanning tunneling microscopy (STM), we explore the molecular topography and the ordered structures formed by these complexes, providing insight into their surface interactions. The europium (Eu3+) ion, a member of the lanthanide series, is renowned for its unique photophysical properties, particularly its sharp emission bands and relatively long-lived luminescence, which make it a valuable component in light-emitting devices, bio-imaging, and sensing applications.
1. Introduction
Rare-earth elements such as europium (Eu) have garnered significant attention in materials science due to their unique luminescent properties1,2 which make them ideal candidates for applications in optoelectronics,3–5 sensors6–9 and spintronic devices.10,11 Europium-based complexes, in particular, exhibit strong photoluminescence,12 owing to their ability to undergo efficient energy transfer to the Eu3+ ion, which emits in the red region of the electromagnetic spectrum. Furthermore, Eu3+ complexes have also been shown to exhibit luminescence after excitation via an electron beam.13 Scanning tunneling microscopy (STM) experiments towards the luminescence of single Eu3+ ions are limited to nano islands on MgO14 and thin films.15,16 However, the electronic and structural properties of molecular Eu complexes, when interfaced with conductive surfaces, remain insufficiently understood, which hinders their integration into nanoscale devices.The investigation of organometallic complexes adsorbed onto metal surfaces is critical for advancing both fundamental surface science and practical applications, as surface interactions can significantly alter the electronic structure and optical properties of these materials. Among the most widely studied surfaces, Au(111) stands out due to its well-defined atomic structure, chemical inertness, and utility in surface-enhanced techniques, making it an ideal substrate for self-assembled monolayers of functional molecules.
In this study, we explore the fluorescence as well as the growth and adsorption behavior of three europium(III) complexes: [Eu(tta)3(H2O)2],8,17–20 [Eu(btfa)3(bpy)],4,21–23 and [Eu(tta)3(bpy)]5,22,24,25 on Au(111) using STM. These complexes differ in their ligands (btfa: 4,4,4-trifluoro-1-phenyl-1,3-butanedione; tta: 2-thenoyltrifluoroacetone) and the presence of either 2,2'-bipyridine (bpy) or water ligands. The importance of organic ligands for light excitation and emission is well known.12 However, each variation in ligand composition is expected to influence the molecular adsorption geometry, intermolecular interactions, and electronic coupling to the gold surface, and to a lower extent the observed fluorescence.
STM, with its high spatial resolution, allows for a detailed study of the surface morphology and molecular ordering of these Eu-complexes. By comparing the growth of these three molecules, we aim to elucidate how ligand composition affects their adsorption behavior on Au(111), providing valuable insights into the design of surface-functionalized materials for potential use in luminescent and electronic applications.
2. Experimental
2.1. Sample preparation
Low-temperature STM and measurements were carried out using a homemade UHV STM (4.4 K, ∼10−10 mbar).26 Au(111) gold single crystals from MaTeck were cleaned by repeated cycles of sputtering with Ar+ ions with an energy of 1.5 keV, followed by annealing to a temperature of 500–600 °C.A Kentax 3 cell evaporator was used for thermal sublimation of [Eu(tta)3(bpy)] and [Eu(btfa)3(bpy)] complexes.
Photoluminescence spectra were recorded using a spectrometer (150 mm focal length) equipped with a grating of 300 groves mm−1. The optical resolution of this setup is about 2 nm when the entrance slit is closed to 10 μm. All photon spectra presented in the manuscript are corrected for the collection efficiency of the detection setup. Excited state lifetimes were measured using time-correlated single photon counting.
3. Results and discussion
3.1. Photophysical properties
The ligand antenna effect27–29 plays a crucial role in the efficient excitation of europium complexes, facilitating their widespread use in luminescent applications. This phenomenon involves the absorption of light by an organic ligand, which acts as an antenna, followed by energy transfer to the Eu3+ ion, leading to its characteristic sharp emission bands (see scheme in Fig. 1). Ligands with strong absorption in the ultraviolet or visible range and suitable triplet-state energies are particularly effective, as they enable efficient intersystem crossing and resonance energy transfer to the lanthanide ion.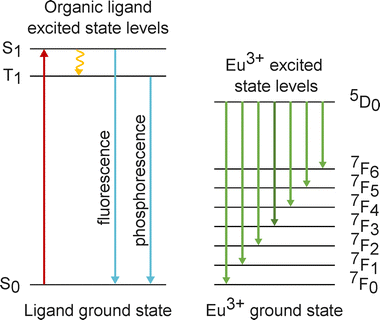 | ||
| Fig. 1 Excitation and transition scheme of Eu complexes utilizing the ligand antenna effect after.12,32–34 | ||
Eu3+ complexes exhibit well-defined and sharp transitions due to the characteristic 4f6 electron configuration of the Eu3+ ion. The primary electronic transitions in these complexes are f–f transitions within the 4f orbitals.30,31 These transitions are inherently Laporte-forbidden in free Eu3+ ions, but coordination environments can partially relax these selection rules, resulting in distinct, narrow emission bands.
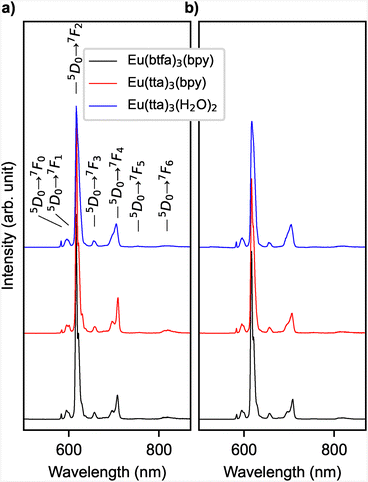
To ensure that the molecules remain intact when deposited on a substrate, we prepared samples for photoluminescence measurements using methods that are also suitable for STM experiments. All three complexes were deposited via drop-casting of an ethanol solution as well as vacuum sublimation onto a glass substrate. In full agreement with previous experiments, the emission spectrum shows prominent transitions from the excited 5D0 state to the lower-energy 7FJ levels (J = 0, 1, 2, 3, 4, 5, 6), with the 5D0 → 7F2 transition being particularly intense (see Fig. 2).
The integral intensity of this forced electric-dipole and hypersensitive transition vs. the magnetic-dipole allowed and insensitive transition to 7F1 has been used as an indicator for symmetry in the local environment, because for a Eu3+ ion at a site with an inversion center, the 5D0 → 7F2 transition is forbidden.12 From the observed spectra, we determined the integrated intensity ratios (5D0 → 7F2)/(5D0 → 7F1), which are for all six samples in the range of 15 to 19, confirming the lack of inversion symmetry expected from the metal center of the complex being linked to two different ligands.
The peaks of the photoluminescence spectra of all three molecules in ethanol solution, as a drop-casted film, in powder form and as a sublimed film were fitted. The width of each peak was weighted with the integrated intensity of the peak and the average width of all peaks in a spectrum taken (see Fig. 3). The highest peak width is observed in the spectra of drop-casted films, while sublimed molecules have the tendency to show sharper emission bands. This can be rationalized by a more well-defined local environment for the latter. The first may still contain solvents in the film. In powder, micro crystallites may still be present, resulting in a highly ordered environment.
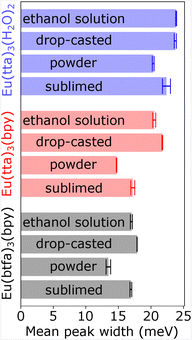 | ||
| Fig. 3 Mean peak widths of photoluminescence spectra. For each spectrum, all peaks are fitted and normalized to the integrated intensity, then the average peak width of the spectrum is calculated. | ||
While the influence of the local environment on the emission spectrum is small, more significant changes are expected for the observed lifetime τobs of the excited state, depending on the chemical environment35 and the optical environment at distances close to the wavelength of the emitted light.36 In powder, [Eu(tta)3(bpy)] and [Eu(btfa)3(bpy)] show a lifetime of about 800 μs. In agreement with previous work,37 the lifetime of 230 μs of [Eu(tta)3(H2O)2] is significantly shorter (see Fig. 4(a)). These experimentally determined lifetimes in combination with the integrated intensity of the 5D0 → 7F1 emission bands with respect to the total intensity allow us to estimate radiative (Arad) and non-radiative (Anrad) decay rates, and the intrinsic quantum yield12,38 as summarized in Table 1. This analysis explains the experimental results as follows: The radiative decay rate Arad for all three complexes is in the kHz range as expected for the Eu3+ ion with slightly lower values for [Eu(tta)3(bpy)] and [Eu(btfa)3(bpy)] (see Table 1). The similar values for the three complexes are expected from the similar coordination of the Eu3+. τobs= (Arad + Anrad)−1 of [Eu(tta)3(H2O)2] is significantly shorter, mostly due to a high non-radiative decay rate (Anrad) via OH vibrations.39 In the sublimed thin film (see Fig. 4(b)), lifetimes of [Eu(tta)3(bpy)] and [Eu(btfa)3(bpy)] are slightly reduced while τobs of [Eu(tta)3(H2O)2] is unchanged, because ambient humidity brings water to the sublimed thin films, increasing Anrad (decreasing τobs) in the films of [Eu(tta)3(bpy)] and [Eu(btfa)3(bpy)]. Anrad of the sublimed film of [Eu(tta)3(H2O)2] is still determined by the non-radiative decay via hydrogen-bond vibrations in the water ligands and thus τobs is almost identical to the bulk value. This is taken as an indication of [Eu(tta)3(H2O)2] being intact after sublimation and their water ligand not being cleaved off. In the ethanol solution (see Fig. 4(c)), the reduced refractive index leads to a decrease of Arad (see Table 1). Here, we assumed a refractive index of 1.55 for the solid state12 and 1.33 for ethanol. For [Eu(tta)3(bpy)] and [Eu(btfa)3(bpy)], this decrease in Arad does not translate to an increased τobs, because of the enhanced radiation-less deactivation (enhanced Anrad) caused by the surrounding ethanol molecules, i.e. non-radiative decay mediated by higher harmonics of hydrogen-bond vibrations.19,40–42 In the case of [Eu(tta)3(H2O)2], quenching by OH vibrations39 is intrinsic to the molecule and Anrad is even higher for the powder and sublimed samples compared to the ethanol and drop-casted samples. Thus, the reduced refractive index of ethanol leads to a small increase of τobs in the case of [Eu(tta)3(H2O)2]. The drop-casted film from the ethanol solution shows intermediate values of Anrad, indicating residual ethanol molecules (see Fig. 4(d)) in the dried film. The ratio τobs/τrad is an estimate for the internal quantum efficiency and is significantly lower for [Eu(tta)3(H2O)2] compared to [Eu(tta)3(bpy)] and [Eu(btfa)3(bpy)] (see Table 1), due to the quenching by OH vibrations, which is in agreement with previous literature.37,43 Judd–Ofelt (JO) parameters were estimated using values for the reduced matrix elements from literature12,38,44 in order to ensure comparability with the values in Stavale et al.43 Overall, the JO parameters Ω2 and Ω4 of the three complexes agree well with previous work.43 A large Ω2 is derived from the very intense 5D0 → 7F2 transition and much smaller Ω4 and Ω6 arise from the corresponding low intensity lines. The drop-casted [Eu(tta)3(H2O)2] sample deteriorated due to humidity and thus has not been measured.
| Sample | Ω 2 [10−20 cm2] | Ω 4 [10−20 cm2] | Ω 6 [10−20 cm2] | A rad [s−1] | A nrad [s−1] | Φ int |
|---|---|---|---|---|---|---|
| [Eu(tta)3(H2O)2]e | 34.98 | 7.69 | 9.32 | 893.43 | 1738.15 | 0.34 |
| [Eu(tta)3(H2O)2]d | 17.64 | 8.24 | 10.95 | 747.57 | 2193.61 | 0.25 |
| [Eu(tta)3(H2O)2]s | 26.75 | 9.96 | 16.34 | 1067.0 | 3280.82 | 0.25 |
| [Eu(tta)3(H2O)2]p | 31.22 | 7.02 | 7.11 | 1145.25 | 3202.57 | 0.26 |
| [Eu(tta)3(bpy)]e | 33.26 | 7.38 | 9.26 | 852.53 | 1779.05 | 0.32 |
| [Eu(tta)3(bpy)]d | 24.3 | 8.61 | 23.74 | 973.26 | — | — |
| [Eu(tta)3(bpy)]s | 22.36 | 10.22 | 26.38 | 932.74 | 791.4 | 0.54 |
| [Eu(tta)3(bpy)]p | 17.27 | 7.12 | 11.02 | 715.12 | 550.71 | 0.56 |
| [Eu(btfa)3(bpy)]e | 26.31 | 6.09 | 9.29 | 692.61 | 1746.41 | 0.28 |
| [Eu(btfa)3(bpy)]d | 22.83 | 6.84 | 14.79 | 899.16 | 1061.62 | 0.46 |
| [Eu(btfa)3(bpy)]s | 25.63 | 7.67 | 19.23 | 1030.56 | 556.74 | 0.65 |
| [Eu(btfa)3(bpy)]p | 20.0 | 6.39 | 10.92 | 789.28 | 460.72 | 0.63 |
3.2. Surface deposition and STM analysis of [Eu(tta)3(H2O)2]
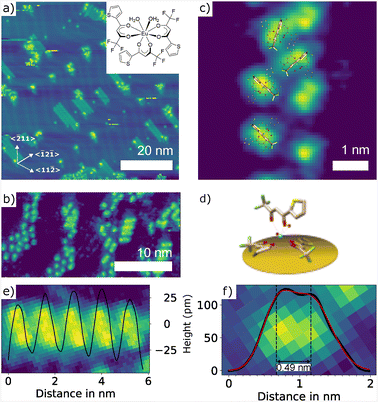
Although our photoluminescence experiments do not indicate a decomposition of sublimed molecular complexes, it cannot be fully excluded. It has been reported that heating of [Dy(tta)3(H2O)2] in ultra-high vacuum (UHV) conditions results in sublimation of the anhydrous [Dy(tta)3].45 For this reason, [Eu(tta)3(H2O)2] molecules were deposited by vacuum spray deposition as reported before.46,47 Therefore, the Au(111) sample was placed underneath a pinhole opening in a vacuum chamber with a pressure of ∼1 mbar. A 2 μL dichloromethane solution with a concentration of 1 mg mL−1 was sprayed onto the Au(111) surface followed by annealing to 100 °C for 2 min in UHV conditions resulting in samples with a sub monolayer coverage (see Fig. 5(a)). Islands of [Eu(tta)3(H2O)2] selectively nucleate next to the pinched elbows of the herringbone reconstruction of the Au(111) surface where the fcc domains are maximized. The molecules form a stripe-like pattern with a periodicity of about 1.22 nm (see Fig. 5(b) and (e)) and a preferred orientation perpendicular to the 〈1![[2 with combining macron]](https://www.rsc.org/images/entities/char_0032_0304.gif) 1〉 direction. Bulged elbows are mostly decorated by decomposed molecules or solvent residues. A similar behavior is well documented for atoms and molecules.48,49 Depending on the molecule adsorption, hcp or fcc domains, and in turn, bulged or pinched elbows, can be preferred energetically50,51 which, for instance, results in the formation of C60 islands with a uniform orientation.52
1〉 direction. Bulged elbows are mostly decorated by decomposed molecules or solvent residues. A similar behavior is well documented for atoms and molecules.48,49 Depending on the molecule adsorption, hcp or fcc domains, and in turn, bulged or pinched elbows, can be preferred energetically50,51 which, for instance, results in the formation of C60 islands with a uniform orientation.52
Both the overall arrangement of the molecules on the Au(111) surface (see Fig. 5(a) and (b)) and the shape of individual molecules (see Fig. 5(c)) strongly resemble the corresponding STM images reported for [Dy(tta)3(H2O)2].45 This suggests that spray deposition (which includes the necessary post-annealing to 100 °C) also results in [Eu(tta)3(H2O)2] adsorbed in a similar configuration. Fig. 5(c) shows the molecular model superimposed to scale based upon this assumption. In this model, the typical shape is then identified with one tta ligand pointing upward (see 3D model in Fig. 5(d)), which is consistent with the distance between the two protrusions as determined by a double peak fit (see Fig. 5(f)).
3.3. Surface deposition and STM analysis of [Eu(tta)3(bpy)]
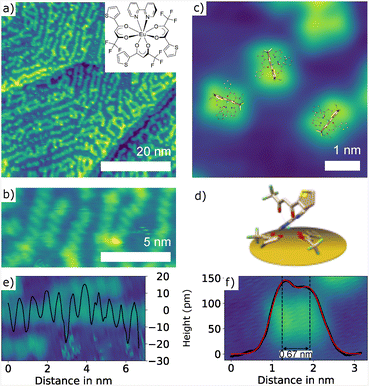
[Eu(tta)3(bpy)] is composed of the same three tta ligands as [Eu(tta)3(H2O)2], but does not contain water but a 2,2′-bipyridine ligand. Together with improved stability in the sublimation process, this also avoids a possible quenching of the luminescence signal due to energy dissipating via OH vibrations.19,41,42 [Eu(tta)3(bpy)] complexes were deposited onto clean Au(111) via sublimation for 3 min at a crucible temperature of 160 °C which results in a submonolayer coverage as shown in Fig. 6(a). [Eu(tta)3(bpy)] molecules on a Au(111) surface form one-dimensional chains with a periodicity of about 0.65 nm roughly following the pattern of the herringbone domains (see Fig. 6(b) and (e)). Similarly to [Eu(tta)3(H2O)2], single isolated [Eu(tta)3(bpy)] typically show two separated lobes, which we tentatively identify with one tta ligand pointing upward (see Fig. 6(d)) as indicated by the molecular models superimposed to scale in Fig. 6(c). A double peak fit to the cross-section results in a distance of about 0.67 nm (see Fig. 6(f)).3.4. Surface deposition and STM analysis of [Eu(btfa)3(bpy)]
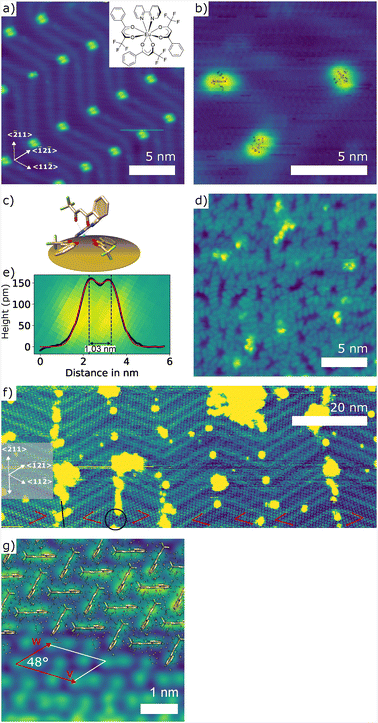
The [Eu(btfa)3(bpy)] complexes were deposited onto clean Au(111) via sublimation at 150 °C for 3-5 min depending on the desired coverage. At low coverages, we observe that [Eu(btfa)3(bpy)] molecules adsorb at the elbows of the herringbone reconstruction, with a highly preferred orientation perpendicular to the 〈1![[2 with combining macron]](https://www.rsc.org/images/entities/char_0032_0304.gif) 1〉 mirror symmetry axis of Au(111) (see Fig. 7(a)). In contrast to [Eu(tta)3(bpy)], the two lobe structure of the molecule form highly ordered structures, at high coverages, as displayed in Fig. 7(g). Three molecules in different orientations as shown in Fig. 7(b) allow us to unambiguously identify the molecular motif of two lobes separated by a nodal plane, similar to [Eu(tta)3(H2O)2] and [Eu(tta)3(bpy)]. Based on this similarity, we assume the analogous configuration on the surface (see Fig. 7(c)). The distance between the two lobes as inferred from a cross-section (see Fig. 7(e)) appears to be larger than for single [Eu(tta)3(bpy)] and [Eu(tta)3(H2O)2] molecules, which can be explained by the chemical difference of a btfa instead of a tta ligand that points upward. At higher coverages, but still below 1 ML, the [Eu(btfa)3(bpy)] molecules start to loosely arrange in chains, similarly to [Eu(tta)3(bpy)] (see Fig. 6(d) and 7(a), (b)). At a coverage above 1 ML, [Eu(btfa)3(bpy)] forms ordered layers over distances of several tens of nanometers (see Fig. 7(f)). A similar highly ordered pattern was not observed for the [Eu(tta)3(bpy)] molecules that only differ to [Eu(btfa)3(bpy)] in the sulfur being present in the ligands. Sulfur is well known to act as an anchor, enhancing the adsorption of the ligand to the gold surface.53 This however restricts the diffusion of the [Eu(tta)3(bpy)] molecules, suppressing the ordering into a lattice. The lattice directions of [Eu(btfa)3(bpy)] are indicated by red arrows in Fig. 7(f). It can be seen that one of them (shorter red arrow in Fig. 7(f)) mostly follows the local herringbone reconstruction, i.e. one of the 〈11
1〉 mirror symmetry axis of Au(111) (see Fig. 7(a)). In contrast to [Eu(tta)3(bpy)], the two lobe structure of the molecule form highly ordered structures, at high coverages, as displayed in Fig. 7(g). Three molecules in different orientations as shown in Fig. 7(b) allow us to unambiguously identify the molecular motif of two lobes separated by a nodal plane, similar to [Eu(tta)3(H2O)2] and [Eu(tta)3(bpy)]. Based on this similarity, we assume the analogous configuration on the surface (see Fig. 7(c)). The distance between the two lobes as inferred from a cross-section (see Fig. 7(e)) appears to be larger than for single [Eu(tta)3(bpy)] and [Eu(tta)3(H2O)2] molecules, which can be explained by the chemical difference of a btfa instead of a tta ligand that points upward. At higher coverages, but still below 1 ML, the [Eu(btfa)3(bpy)] molecules start to loosely arrange in chains, similarly to [Eu(tta)3(bpy)] (see Fig. 6(d) and 7(a), (b)). At a coverage above 1 ML, [Eu(btfa)3(bpy)] forms ordered layers over distances of several tens of nanometers (see Fig. 7(f)). A similar highly ordered pattern was not observed for the [Eu(tta)3(bpy)] molecules that only differ to [Eu(btfa)3(bpy)] in the sulfur being present in the ligands. Sulfur is well known to act as an anchor, enhancing the adsorption of the ligand to the gold surface.53 This however restricts the diffusion of the [Eu(tta)3(bpy)] molecules, suppressing the ordering into a lattice. The lattice directions of [Eu(btfa)3(bpy)] are indicated by red arrows in Fig. 7(f). It can be seen that one of them (shorter red arrow in Fig. 7(f)) mostly follows the local herringbone reconstruction, i.e. one of the 〈11![[2 with combining macron]](https://www.rsc.org/images/entities/char_0032_0304.gif) 〉 directions. The domain boundaries between these domains are located at the elbows of the reconstruction and aligned along the 〈2
〉 directions. The domain boundaries between these domains are located at the elbows of the reconstruction and aligned along the 〈2![[1 with combining macron]](https://www.rsc.org/images/entities/char_0031_0304.gif)
![[1 with combining macron]](https://www.rsc.org/images/entities/char_0031_0304.gif) 〉 mirror axis of the surface (see Fig. 7(f)). The more open first layer at these domain boundaries is where the second layer nucleates. At the lower right of the STM scan shown in Fig. 7(f) a single domain spans across two elbow areas and almost 40 nm without interruption of the molecular order, indicative of a high mobility of the molecular complexes on the surface and a strong molecule–molecule interaction. The periodicity of the ordered structure is indicated by the vectors of the unit cell
〉 mirror axis of the surface (see Fig. 7(f)). The more open first layer at these domain boundaries is where the second layer nucleates. At the lower right of the STM scan shown in Fig. 7(f) a single domain spans across two elbow areas and almost 40 nm without interruption of the molecular order, indicative of a high mobility of the molecular complexes on the surface and a strong molecule–molecule interaction. The periodicity of the ordered structure is indicated by the vectors of the unit cell ![[small nu, Greek, vector]](https://www.rsc.org/images/entities/i_char_e0ea.gif) and
and ![[w with combining right harpoon above (vector)]](https://www.rsc.org/images/entities/i_char_0077_20d1.gif) as displayed in Fig. 7(g). This leads to a unit cell size of 1.2 nm2 containing two molecules with an elongated motif, as shown by superimposed molecular models in Fig. 7(g). Crystallographic data of monoclinic [Eu(btfa)3(bpy)] has been reported with unit cell vectors of
as displayed in Fig. 7(g). This leads to a unit cell size of 1.2 nm2 containing two molecules with an elongated motif, as shown by superimposed molecular models in Fig. 7(g). Crystallographic data of monoclinic [Eu(btfa)3(bpy)] has been reported with unit cell vectors of ![[a with combining right harpoon above (vector)]](https://www.rsc.org/images/entities/i_char_0061_20d1.gif) = 11.122 Å,
= 11.122 Å, ![[b with combining right harpoon above (vector)]](https://www.rsc.org/images/entities/i_char_0062_20d1.gif) = 22.860 Å,
= 22.860 Å, ![[c with combining right harpoon above (vector)]](https://www.rsc.org/images/entities/i_char_0063_20d1.gif) = 15.870 Å and Z= 4.21 The surface spanned by
= 15.870 Å and Z= 4.21 The surface spanned by ![[a with combining right harpoon above (vector)]](https://www.rsc.org/images/entities/i_char_0061_20d1.gif) ×
× ![[b with combining right harpoon above (vector)]](https://www.rsc.org/images/entities/i_char_0062_20d1.gif) is about 2.5 nm2. This is equivalent to four times the footprint of one [Eu(btfa)3(bpy)] complex that we determined from the unit cell to 0.61 nm2.
is about 2.5 nm2. This is equivalent to four times the footprint of one [Eu(btfa)3(bpy)] complex that we determined from the unit cell to 0.61 nm2.
The single molecule (see Fig. 7(c)) appears larger in comparison to the ordered structure at higher coverages. Besides the fact that there is always a convolution of the density of states of the tip with that of the sample, which typically leads to an increase of the apparent size of an isolated object, the observation of a densely packed self assembled layer is taken as an indication for a strong intermolecular interaction compared to the interaction between molecule and substrate.
4. Conclusions
The chemical similarity of the three investigated Eu3+ complexes [Eu(tta)3(H2O)2], [Eu(tta)3(bpy)] and [Eu(btfa)3(bpy)] reflects in their photophysical properties: All three show very similar photoluminescence spectra resulting from 5D0 → 7FJ transitions with intense hypersensitive lines, independently of the preparation method of the sample. The observed lifetimes, however, are clearly sensitive to the local environment i.e. to the presence of non-radiative decay pathways via hydrogen-bond vibrations. Our UHV STM studies of thin films deposited on atomically flat Au(111) surfaces show very similar appearances of the isolated entities for all three molecular complexes. Typically, there are two bright lobes of similar size distinguishable, separated by a darker nodal plane. When it comes to higher coverages close to 1 ML, the chemical differences of the ligands do play a role: While [Eu(tta)3(H2O)2] and [Eu(tta)3(bpy)] show only partial order along one direction, perfectly ordered films over tens of nanometers can be achieved for [Eu(btfa)3(bpy)] molecules. This indicates that the self-assembly process for lattice formation is suppressed by sulfur that is present in the ligands of [Eu(tta)3(H2O)2] and [Eu(tta)3(bpy)] but not [Eu(btfa)3(bpy)]. This is consistent with the sulfur enhancing the gold ligand adsorption,53 thus competing with the intermolecular interaction.These results pave the way toward studies of the photophysical properties in the well-defined environment of thin films that will help to disentangle the influence of various parameters on the excitation–emission process in Eu3+ molecular complexes.
Data availability
The topographical STM data is included in the main text. The synthesis of the reported complexes is included as part of the ESI.†Conflicts of interest
There are no conflicts to declare.Acknowledgements
We acknowledge funding by the Deutsche Forschungsgemeinschaft (DFG, German Research Foundation) through the Collaborative Research Center “4f for Future” (CRC 1573, project number 471424360) project C1 and C2 and support by the Helmholtz Association via the programs Natural, Artificial, and Cognitive Information Processing (NACIP) and Materials Systems Engineering (MSE).References
- G. Urbain, C. R. Hebd. Seances Acad. Sci., 1906, 142, 205 CAS
.
- E. Demarçay, Rep. Acad. Sci, 1900, 130, 1469–1472 Search PubMed
.
- G. Santos, F. J. Fonseca, A. M. Andrade, V. Deichmann, L. Akcelrud, S. S. Braga, A. C. Coelho, I. S. Gonçalves, M. Peres, W. Simões, T. Monteiro and L. Pereira, J. Non-Cryst. Solids, 2008, 354, 2897–2900 CrossRef CAS
.
- W. Quirino, R. Reyes, C. Legnani, P. Nóbrega, P. Santa-Cruz and M. Cremona, Synth. Met., 2011, 161, 964–968 CrossRef CAS
.
- J. Liu, K. Wang, W. Zheng, W. Huang, C.-H. Li and X.-Z. You, Prog. Photovoltaics Res. Appl., 2013, 21, 668–675 CrossRef CAS
.
- G. E. Khalil, K. Lau, G. D. Phelan, B. Carlson, M. Gouterman, J. B. Callis and L. R. Dalton, Rev. Sci. Instrum., 2004, 75, 192–206 CrossRef CAS
.
- W. W. Al-Qaysi and A. Duerkop, Analyst, 2018, 143, 3176–3183 RSC
.
- S. Chen, S. Fan, G. Zhao, X. Fu and F. Zhang, React. Funct. Polym., 2024, 201, 105942 CrossRef CAS
.
- T.-T. Li, J.-Z. Liu, S.-J. Zheng, F. Jiang, J.-Y. Liu, W.-N. Dong, Y. Zhang, S.-P. Zheng, Y.-N. Li, Z.-N. Wu and X. Bai, Rare Met., 2025, 44, 2438–2449 CrossRef CAS
.
- A. S. Borukhovich, N. I. Ignateva, K. I. Yanushkevich, A. I. Stognii and Y. A. Fedotova, JETP Lett., 2009, 89, 191–193 CrossRef CAS
.
- C. Belman-Rodriguez, J. Guerrero-Sánchez, J. López-Medina, S. Sharma, N. Tabaray, C. Velez, A. Reyes-Serrato, M. H. Farías, S. A. Aguila and R. Ponce-Perez, ACS Omega, 2025, 10, 11762–11769 CrossRef CAS PubMed
.
- K. Binnemans, Coord. Chem. Rev., 2015, 295, 1–45 CrossRef CAS
.
- A. Abdel-Kader and M. Elkholy, J. Mater. Sci., 1992, 27, 2887–2895 CrossRef CAS
.
- F. Stavale, N. Nilius and H.-J. Freund, Appl. Phys. Lett., 2012, 101, 013109 CrossRef
.
- G. Dovbeshko, O. Fesenko, R. Fedorovich, T. Gavrilko, A. Marchenko, G. Puchkovska, L. Viduta, A. Naumovets, D. Chubich, A. Vitukhnovskii and D. Fichou, J. Mol. Struct., 2006, 792–793, 115–120 CrossRef CAS
.
- D. Marinotto, C. A. Marin, I. Rau, A. Colombo, F. Fagnani, D. Roberto and C. Dragonetti, Molecules, 2025, 30, 1395 CrossRef CAS PubMed
.
- R. G. Charles and R. C. Ohlmann, J. Inorg. Nucl. Chem., 1965, 27, 255–259 CrossRef CAS
.
- A. V. S. Lourenço, C. A. Kodaira, E. M. Ramos-Sanchez, M. C. F. Felinto, H. Goto, M. Gidlund, O. L. Malta and H. F. Brito, J. Inorg. Biochem., 2013, 123, 11–17 CrossRef PubMed
.
- O. Malta, H. Brito, J. Menezes, F. E. Silva, S. Alves, F. Farias and A. de Andrade, J. Lumin., 1997, 75, 255–268 CrossRef CAS
.
- W. M. Faustino, L. A. Nunes, I. A. Terra, M. C. F. Felinto, H. F. Brito and O. L. Malta, J. Lumin., 2013, 137, 269–273 CrossRef CAS
.
- H. J. Batista, A. V. M. de Andrade, R. L. Longo, A. M. Simas, G. F. de Sá, N. K. Ito and L. C. Thompson, Inorg. Chem., 1998, 37, 3542–3547 CrossRef CAS PubMed
.
- C. G. Gameiro, C. A. Achete, R. A. Simão, E. F. da Silva and P. A. Santa-Cruz, J. Alloys Compd., 2002, 344, 385–388 CrossRef CAS
.
- G. F. de Sá, S. Alves Jr, B. J. da Silva and E. F. da Silva Jr, Opt. Mater., 1998, 11, 23–28 CrossRef
.
- D. Chitnis, N. Thejo Kalyani and S. Dhoble, Results Phys., 2019, 13, 102302 CrossRef
.
- D. Chitnis, N. Thejokalyani and S. Dhoble, J. Lumin., 2017, 185, 61–71 CrossRef CAS
.
- K. Edelmann, L. Gerhard, M. Winkler, L. Wilmes, V. Rai, M. Schumann, C. Kern, M. Meyer, M. Wegener and W. Wulfhekel, Rev. Sci. Instrum., 2018, 89, 123107 CrossRef PubMed
.
- G. A. Crosby, R. E. Whan and J. J. Freeman, J. Phys. Chem., 1962, 66, 2493–2499 CrossRef CAS
.
- M. W. Mara, D. S. Tatum, A.-M. March, G. Doumy, E. G. Moore and K. N. Raymond, J. Am. Chem. Soc., 2019, 141, 11071–11081 CrossRef CAS PubMed
.
- G. Crosby, R. Whan and R. Alire, J. Chem. Phys., 1961, 34, 743–748 CrossRef CAS
.
- J. Claude and G. Bünzli, Inorg. Chim. Acta, 1987, 139, 219–222 CrossRef
.
- E. G. Moore, A. P. S. Samuel and K. N. Raymond, Acc. Chem. Res., 2009, 42, 542–552 CrossRef CAS PubMed
.
- A. N. Grasso, L. d S. Teixeira, N. D. Vieira and L. C. Courrol, J. Fluoresc., 2009, 19, 715–721 CrossRef CAS PubMed
.
- M. F. K. Trautnitz, C. Doffek and M. Seitz, Chem. Phys. Chem., 2019, 20, 2179–2186 CrossRef CAS PubMed
.
- P. A. Tanner, W. Thor, Y. Zhang and K.-L. Wong, J. Phys. Chem. A, 2022, 126, 7418–7431 CrossRef CAS PubMed
.
- W. D. Horrocks and D. R. Sudnick, J. Am. Chem. Soc., 1979, 101, 334–340 CrossRef CAS
.
- R. E. Kunz and W. Lukosz, Phys. Rev. B: Condens. Matter Mater. Phys., 1980, 21, 4814–4828 CrossRef CAS
.
- A. S. Borges, E. V. Caliman, J. D. L. Dutra, J. G. Da Silva and M. H. Araujo, J. Lumin., 2016, 170, 654–662 CrossRef CAS
.
- R. Renata, AIMS Mater. Sci., 2015, 2, 37–60 Search PubMed
.
- S. V. Eliseeva, D. N. Pleshkov, K. A. Lyssenko, L. S. Lepnev, J.-C. G. Bünzli and N. P. Kuzmina, Inorg. Chem., 2010, 49, 9300–9311 CrossRef CAS PubMed
.
-
E. Kreidt, C. Kruck and M. Seitz, Including Actinides, Elsevier, 2018, vol. 53, pp. 35–79 Search PubMed
.
- J. Guan, B. Chen, Y. Sun, H. Liang and Q. Zhang, J. Non-Cryst. Solids, 2005, 351, 849–855 CrossRef CAS
.
-
E. Kreidt, C. Kruck and M. Seitz, Handbook on the Physics and Chemistry of Rare Earths, Elsevier, 2018, vol. 53, pp. 35–79 Search PubMed
.
- G. B. V. Lima, J. C. Bueno, A. F. da Silva, A. N. Carneiro Neto, R. T. Moura, E. E. S. Teotonio, O. L. Malta and W. M. Faustino, J. Lumin., 2020, 219, 116884 CrossRef CAS
.
- W. T. Carnall, H. Crosswhite and H. M. Crosswhite, Energy level structure and transition probabilities in the spectra of the trivalent lanthanides in LaF3, Argonne National Lab. (ANL), Argonne, IL (United States) Technical Report ANL-78-XX-95, 1978 Search PubMed.
- P. Stoll, M. Bernien, D. Rolf, F. Nickel, Q. Xu, C. Hartmann, T. R. Umbach, J. Kopprasch, J. N. Ladenthin, E. Schierle, E. Weschke, C. Czekelius, W. Kuch and K. J. Franke, Phys. Rev. B, 2016, 94, 224426 CrossRef
.
- M. Valášek, K. Edelmann, L. Gerhard, O. Fuhr, M. Lukas and M. Mayor, J. Org. Chem., 2014, 79, 7342–7357 CrossRef PubMed
.
- T. Frauhammer, L. Gerhard, K. Edelmann, M. Lindner, M. Valášek, M. Mayor and W. Wulfhekel, Phys. Chem. Chem. Phys., 2021, 23, 4874–4881 RSC
.
- D. D. Chambliss, R. J. Wilson and S. Chiang, Phys. Rev. Lett., 1991, 66, 1721–1724 CrossRef CAS PubMed
.
- M. Böhringer, K. Morgenstern, W.-D. Schneider, R. Berndt, F. Mauri, A. De Vita and R. Car, Phys. Rev. Lett., 1999, 83, 324–327 CrossRef
.
- L. W. Liu, K. Yang, W. D. Xiao, Y. H. Jiang, B. Q. Song, S. X. Du and H.-J. Gao, Appl. Phys. Lett., 2013, 103, 023110 CrossRef
.
- M. Edmondson and A. Saywell, Nano Lett., 2022, 22, 8210–8215 CrossRef CAS PubMed
.
- X. Zhang, L. Tang and Q. Guo, J. Phys. Chem. C, 2010, 114, 6433–6439 CrossRef CAS
.
- H. Häkkinen, Nat. Chem., 2012, 4, 443–455 CrossRef PubMed
.
Footnote |
| † Electronic supplementary information (ESI) available. See DOI: https://doi.org/10.1039/d5cp01079a |
| This journal is © the Owner Societies 2025 |

