
 Open Access Article
 This Open Access Article is licensed under a Creative Commons Attribution-Non Commercial 3.0 Unported Licence
Microsolvation of cationic alkali dimers in helium: quantum delocalization and solid-like/liquid-like behaviors of He shells†
Raquel
Yanes-Rodríguez
 ,
Pablo
Villarreal
and
Rita
Prosmiti
*
,
Pablo
Villarreal
and
Rita
Prosmiti
*
Institute of Fundamental Physics (IFF-CSIC), CSIC, Serrano 123, 28006 Madrid, Spain. E-mail: rita@iff.csic.es; Tel: + 34 915616800
First published on 24th March 2025
Abstract
We performed path-integral molecular dynamics (PIMD) simulations in the NVT ensemble to investigate the quantum solvation of Li2+ in He nanoclusters at a low temperature of 2 K. The interaction potentials were modeled using a sum-of-potentials approach, incorporating automated learning ab initio-based models up to three-body terms. Additionally, the semiclassical quadratic Feynman–Hibbs approach was applied to incorporate quantum effects into classical computations effectively, enabling the study of HeNLi2+ complexes with up to 50 He atoms. The quantum simulations revealed strong evidence of local solid-like behavior in the He atoms within the first solvation shell surrounding the Li2+ dimer cation. In contrast, the second and third solvation shells displayed delocalized He densities, allowing for the interchange of He atoms between these layers, indicative of a liquid-like structure. Our findings align with earlier studies of He-doped clusters, particularly in systems where the charged impurity interacts strongly with the solvent medium, significantly impacting the helium environment at the microscopic level.
1. Introduction
The investigation of nano-sized He droplets has received great attention in the last few years, being a challenge for both theoreticians and experimentalists.1–17 Doped He nanodroplets have become a standard medium for high-resolution spectroscopy of ultracold molecular species.18–24 More recently, they have also been used for real-time observation of the primary steps of ion solvation at the atomic level, with open possibilities for time-resolved measurements of cation-molecule complex formation.25 Molecular impurities immersed in liquid He nanodrops and small/medium He clusters have yielded some extremely interesting properties, such as the microscopic superfluid behavior, bubble/snowball effect, and local nanoscale supersolidity.2,10,26–29The microsolvation process of molecular impurities in He droplets is governed by the relative strengths of the He-dopant and He–He interactions, with charged cationic impurities typically exhibiting strong interactions with He. Depending on the type and size of the cation, the attraction with He atoms dominates over the very weak He–He interactions. Such competition between ionic forces and van der Waals (vdW) interactions gives rise to a range of intriguing phenomena.
Considerable efforts have been devoted, with rather intensive experimental activity and a variety of computational methodologies used to deal with impurities, and their reactions in He droplets and clusters, concerning the understanding of cations' frictionless motion, the solid-like/liquid-like shell formation and the slow ion mobility in the quantum He environment at the atomic scale.5,30–34 In this vein, alkaline and alkaline-earth cations have been frequently used to investigate the superfluid properties of He droplets/clusters, as well as the microscopic structure of the He solvation shells around them.3,10,13,15,17,35–41
High-resolution mass spectrometry experiments involving doped helium droplets have revealed anomalies in the abundance distributions for various ions, including alkali ions and their dimers.26,37,42,43 The relation between the size dependence of the ion yield in the experiments and unimolecular He-doped cluster dissociation energies has been investigated, and directly correlated with the closure of solvation sub/shells or formation of stable structures. For example, the number of surrounding He atoms in the first shell varies from 8 to 18 for Li+ to Mg+ and up to 25 for Ca+, while for the Na2+ and K2+ dimers distinct anomalies in the ion yield have been identified, with the formation of a linear structure with 2 He atoms, followed by another with 6, when a subshell is completed.3,10,15,17,36,37,39,40
Here, Li2+-doped He clusters have been chosen, as the strong interaction of these cations with the He solvent (≈350 cm−1) makes them prototypes of snowball structures, whose expected solid-like signature can provide a useful benchmark in the study of the other ions. As the local He structure around the ion in large enough clusters should be very similar to that developed in bulk He3, it is of interest to explore the anisotropic ionic interaction effects, due to the alkali-dimer cation, in comparison with the monoatomic Li+ counterparts.35,43 The classical picture for the Li2+ He-doped clusters indicates a selective growth on the basis of compact solid-like He3-motifs surrounded by less-delocalized liquid-like regions, with well-defined structural transformations and magic number structures up to 30 He atoms.40 However, one should definitely consider quantum delocalization effects given the nature of the solvent medium. Thus, we study the quantum microsolvation of the Li2+ cation in He nanoclusters through both the Feynman–Hibbs (FH) model,44 and accurate path-integral molecular dynamics (PIMD) simulations. In this way, the performance of the FH approach for such liquid–solid mixture (heterogeneous low temperature) systems against exact PIMD calculations is assessed.
2. Methods and computational details
2.1. Potential energy surface models
As previously reported,11,39,40 the analytical sum-of-potentials approach was employed to represent the potential energy surface (PES) of the HeNLi2+ aggregates. The total potential is written as, | (1) |
The Ri and r are the vectors connecting the center of mass of the Li2+ molecule with each He atom, and the Li atoms along the z (Li2+) axis (see Fig. 1), respectively, with θi being the angles between each ![[R with combining right harpoon above (vector)]](https://www.rsc.org/images/entities/i_char_0052_20d1.gif) i and r vector, while the Ril are the vectors between distinct (i, l) He atoms. The cylindrical (ρ, z, φ) coordinates are also displayed in Fig. 1.
i and r vector, while the Ril are the vectors between distinct (i, l) He atoms. The cylindrical (ρ, z, φ) coordinates are also displayed in Fig. 1.
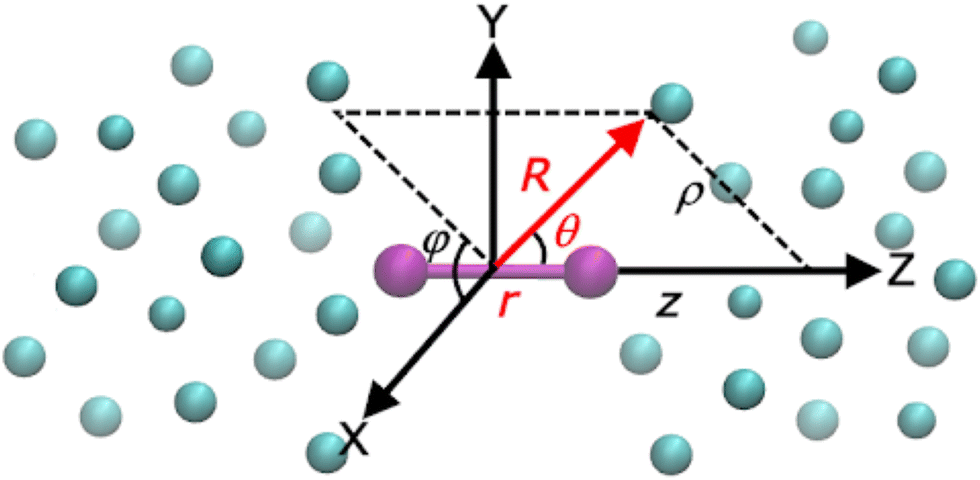 | ||
| Fig. 1 Cartesian (x, y, z), Jacobi (r, R, θ) and cylindrical (ρ, z, φ) coordinates used for the HeNLi2+ systems. | ||
The VHei–Li2+ three-body (3B) terms correspond to the RKHS (reproducing kernel Hilbert space) PES, trained on RCCSD(T)/CBS[Q5] interaction energies,45 while the VHe–He two-body (2B) interactions are given by the Aziz–Slaman potential.46 The three-body contributions have been taken into account only for the He–Li2+ interactions, while such corrections for the interactions between He atoms have been neglected.36 In Fig. 2 one can observe that the VHei–Li2+ RKHS PES presents the correct long-range behavior, ∼R−4, with a global minimum at −343.54 cm−1 for the linear configurations. The strength of the interaction gradually decreases for bent configurations down to −16.84 cm−1 for the T-shaped arrangement, but is still stronger compared to the potential well of 7.69 cm−1 for the He dimer.
 | ||
| Fig. 2 The VHei–Li2+ (left panel) and VHe–He (right panel) potentials (solid lines) from ref. 45 and 46, respectively, in comparison with the corresponding UHe–Li2+ and UHe–He effective FH2 potentials at T = 2 K (dashed lines). | ||
2.2. Feynman–Hibbs effective potentials
Initially, quantum corrections by means of second-order Feynman–Hibbs (FH2) effective potentials44,47–51 have been introduced for the 2B and 3B interactions as, | (2) |
 | (3) |
![[scr R, script letter R]](https://www.rsc.org/images/entities/char_e531.gif) denotes the vector joining the two interacting atoms/species (Ril or R), y′ = cos(θ), μ is their reduced mass, kB is the Boltzmann constant and T is the simulation temperature. The V(R) and V(, y′) are the VHe–He or VHei–Li2+ potentials (see eqn (1)), while
denotes the vector joining the two interacting atoms/species (Ril or R), y′ = cos(θ), μ is their reduced mass, kB is the Boltzmann constant and T is the simulation temperature. The V(R) and V(, y′) are the VHe–He or VHei–Li2+ potentials (see eqn (1)), while  and
and  are their first- and second-order derivatives or gradients, respectively, with respect to the Ril or R/θ coordinates, respectively. The total VFH2 effective potential is obtained by using the sum-of-potentials (see eqn (1)) with the corresponding 2B and 3B terms from eqn (2),
 | (4) |
In Fig. 2 we also present the effective UHe–Li2+ and UHe–He potentials in comparison with the VHe–Li2+ (see left panel) and VHe–He (see right panel) ones. Both V′ and V′′ derivatives and gradients of the potentials (forces) are calculated analytically52 or through automatic differentiation tools.53 One can clearly see that the FH2 corrections clearly modify the 2B and 3B potential terms, with the effective UFH2 being more repulsive with shallower well-depths of 6.65 and 236 cm−1 at larger equilibrium distances of 3.475 and 4.03 Å, respectively.
2.3. Semiclassical MD and quantum PIMD simulations
In turn, classical MD and quantum PIMD NVT simulations have been performed using the UFH2 and V (see eqn (1)) potentials, respectively, for the HeNLi2+ clusters, with N up to 50 He atoms. The Li2+ interaction is described by a very flexible harmonic oscillator potential with a force constant of 0.009113 a.u., and an equilibrium distance of re = 3.11 Å. This has no consequence for classical MD simulations, as the system looks for the minimum on the full PES, although in the quantum PIMD case a separated Li2+ calculation (calibration) was performed.All simulations were carried out using the i-PI open code of Ceriotti et al.54,55 at a temperature of 2 K, that is slightly below the critical value for He superfluidity, and high enough for neglecting exchange effects. The thermostatted NVT calculations were carried out based on the simple, white noise, Langevin thermostat, employing the global version of the path integral Langevin equation stochastic thermostatting scheme,56 with the thermostat time constant, τ0, for the centroid mode, defining the friction coefficient and the strength of the thermostat. The input value of the τ0 parameter was 1 fs along the T = 2 K simulations. We used a large cubic simulation cell with a side length of 450 Å, maintaining the pressure close to zero, and thus no barostats were applied in the simulations.
A time interval Δt = 2 fs was chosen to be of the order of 1/5000 times the smallest period in the physical system (∼100 fs, corresponding to the maximum kinetic energy of the linear Li2+–He interaction), and the quality of the simulation was also controlled through the so-called effective energy57 in addition to the temperature, that oscillates around 2 K within 0.0008 K.
We performed the NVT simulations considering an increasing number of beads M in the extended system (ring polymer) from M = 1 (classical) up to M = 400. The initial configurations for each cluster were those produced by an evolutionary programming algorithm58–61 on the corresponding PES (see eqn (1)), while initial velocities were generated from a Maxwell–Boltzmann distribution at the given temperature. The centroid approximation was employed to estimate all computed properties and quantities in this work.
3. Results and discussion
In Fig. 3 we display the energies of various low-lying minima on the PES of each HeNLi2+ cluster with N up to 30 using the evolutionary algorithm.58 The global minimum energies are highlighted in red color lines, while those of local minima are displayed in black lines, and their number is increasing as the size N of the cluster increases. With the aim of investigating the nuclear quantum and thermal effects occurring during the gradual microsolvation of the Li2+ cation in HeN clusters, we have performed two different kinds of MD simulations. On the one hand, quantum PIMD calculations employing the V PESs from eqn (1), and on the other hand, semiclassical MD simulations using the quantum-corrected FH2 version U of the effective interaction potentials from eqn (4). The corresponding global minimum geometries for each HeNLi2+ cluster were those used as initial configurations in both MD and PIMD simulations in this work. | ||
| Fig. 3 Low-lying minima (black color) predicted by the evolutionary algorithm using the potential of eqn (1), with those corresponding to the global minimum energy configurations highlighted in red color, compared with average energies 〈E〉 obtained from semiclassical FH2 (cyan color) and quantum PIMD (blue color) at T = 2 K. | ||
The first step in the PIMD calculations consists in running convergence tests in order to choose the number of beads (M) in the extended system (ring polymer), which ensures a description of the system as accurate as possible considering a balance between error and computational time. Starting with the global PES minimum configurations, we performed PIMD calculations along 150![[thin space (1/6-em)]](https://www.rsc.org/images/entities/char_2009.gif) 000 steps for the Li2+, HeLi2+ and He30Li2+ systems, using different numbers of beads ranging from M = 1 (classical case) to M = 400. In Fig. 4 we present the convergence of the kinetic, potential and total energy as a function of the number of beads (left panels), as well as the extrapolation of the last fully converged energy values (right panels) following a quadratic fit7 of a + bΔτ2 type, where Δτ2 corresponds to 1/M, with a and b being parameters, so as to compare these total energy values with the one corresponding to M → ∞ (see dashed lines). One can see that the values obtained with M = 300 are converged and therefore, we have considered this number of beads to correctly describe the interactions of the systems under consideration. Consequently, all the subsequent PIMD computations are performed with M = 300 (see ESI†).
000 steps for the Li2+, HeLi2+ and He30Li2+ systems, using different numbers of beads ranging from M = 1 (classical case) to M = 400. In Fig. 4 we present the convergence of the kinetic, potential and total energy as a function of the number of beads (left panels), as well as the extrapolation of the last fully converged energy values (right panels) following a quadratic fit7 of a + bΔτ2 type, where Δτ2 corresponds to 1/M, with a and b being parameters, so as to compare these total energy values with the one corresponding to M → ∞ (see dashed lines). One can see that the values obtained with M = 300 are converged and therefore, we have considered this number of beads to correctly describe the interactions of the systems under consideration. Consequently, all the subsequent PIMD computations are performed with M = 300 (see ESI†).
 | ||
| Fig. 4 Convergence of kinetic, potential and total energy as a function of the number of beads (M) (left panels), and extrapolation of the total energy in the M → ∞ limit (right panels) for the Li2+ (lower panels), HeLi2+ (middle panels) and He30Li2+ (upper panels) systems at T = 2 K. | ||
The next step consists in performing MD-FH2 simulations for all HeNLi2+ systems with N = 1–50 and PIMD simulations in certain HeNLi2+ systems with N = 1–6, 10, 13, 14, 18, 22, 24 and 30. We have also carried out a PIMD NVT simulation for the Li2+ at T = 2 K, and a bond energy of 129.68 ± 0.68 cm−1 is obtained in accordance with the ground vibrational state value reported in the literature. This energy value was subtracted from the total average PIMD energies of all HeNLi2+ clusters studied.
The primary quantities investigated in our simulations are total, kinetic and potential energies, single-atom evaporative energies and probability densities of He atoms around the alkali dimer cation. Fig. 3 shows the total average energies, 〈E〉, for the semiclassical (FH2) (see cyan color lines) and quantum (PIMD) (see blue color lines) thermal isomers computed for the different size N He-doped clusters. One can clearly see in Fig. 3 the impact of nuclear quantum effects on the energetics and binding of the HeNLi2+ clusters. The quantum total energies are considerably higher than those of the classical potential minima (at the same temperature), as well as those obtained from the semiclassical FH2, specially for larger size clusters, indicating high anharmonic zero-point energy (ZPE) quantum effects.
Computation of single-atom evaporation energies, EN−1 − EN, and average energies per He atom,  , was used to investigate the cluster's stabilities in connection with experimentally observed ion yield distributions and identify stable isomers and completion of solvation shells, as well as to quantify the performance of the FH2 approach. In Fig. 5 we display such energetic quantities as a function of the cluster size as obtained from the classical, semiclassical and quantum calculations. One can clearly see the improvement of the FH2 energies with respect to the classical PES ones. Despite the expected quantitative differences, both classical and semiclassical approaches shown here exhibit qualitatively the same trend as the corresponding QM counterparts for the average energies per He atom curves. In the case of evaporation energy curves, they show pronounced drop offs at small values of N = 2, 4 and 6, while their behavior for larger size clusters is rather distinct for both computations, with a noticeable plateau between N = 7 and 13 or 14, followed by an oscillatory behavior. Thus, it should be noted that two slopes are distinguished in the evaporative energy curves: one fairly pronounced from approximately N = 1–6 and another softer one between N = 7–30. Moreover, from the quantum point of view the energy variation between N = 7–30 is significantly much smaller than that from the classical point of view.
 | ||
| Fig. 5 Computed single-atom evaporative energies (solid lines) of HeNLi2+ clusters, their average energy per He atom (dashed lines) from the EP potential optimizations (red color), FH2 MD simulations (cyan color) and PIMD calculations (blue color) as a function of N. Given the lack of experimental data for the HeNLi2+ clusters, we decided to compare them with the experimental integrated yields reported for the HeNLi+ clusters43 shown by a black circle. | ||
As there are no experimental observations for the HeNLi2+, we consider to compare the results with previous studies on HeNLi+ clusters,43 and the experimentally observed ion yield distribution is displayed in Fig. 5. One can see peaks at N = 2, 6, 8, 14, 21 and 26, with N = 6 and 8 being quite stable.
Given that the trends in energies are not conclusive on the stability of specific medium size clusters studied here, we thus continued with the analysis of the computed HeNLi2+ clusters' structures that could provide some further insight into this issue. In Fig. 6, the radial probability distributions obtained from the quantum PIMD simulations are shown as a function of R distance. One can clearly see a sharp peak localized between 3.3 and 3.8 Å, featuring the first solvation shell for clusters up to 6 He atoms. For larger clusters the radial distributions become wider and shift towards slightly larger values of R, as N increases, with the appearance of additional peaks, suggesting the onset of a second and a third shell, located around 4.6 and 6.25 Å, for N > 6 and 10, respectively. As seen, there is no He atom interchange in between the first and second solvation shells, with the density being close to zero between the corresponding peaks. In the inset plots, we show the fraction of He atoms in each shell, as computed by integrating the density in each shell/peak, as defined by the vertical dashed lines that indicate the R values at 4.0, 5.7 and 7.1 Å, for the completion of the corresponding shell.
 | ||
| Fig. 6 Radial probability distributions obtained from the quantum PIMD simulations for the indicated HeNLi2+, with N = 1–30 at T = 2 K. The inset plots show the fraction of He atoms in each solvation shell as a function of N computed by integrating the density in each shell. The vertical dashed lines mark the separation of each shell. | ||
The radial and angular densities as a function of the He–He distances and cos(θ) angles, respectively, are displayed in Fig. 7 from both FH2 and PIMD calculations for selected cluster sizes. We should note here that for structural transition from N = 2 to 3 up to 6, the He atoms initially prefer linear arrangements along the Li2+ axis, while for 2 < N < 9 this linear arrangement no longer holds, as indicated by the angular probability density distributions in Fig. 7 (see also plots in the ESI†). By comparing the same quantities, we observe similar patterns with well structured He atom arrangements around the Li2+ cation, with sharp and high density peaks in the first peak. Such a highly compact and well-defined position structure is clearly observed in the spatial distribution functions shown in Fig. 8. The He densities are computed by the PIMD simulations at T = 2 K around a fixed Li2+ cation, and by analyzing the 3D distributions of He atoms for several HeNLi2+ clusters, such as N = 10, 18 and 30 in the plot (see top and side views), the presence of a solid-like first shell has been identified, in contrast to broader, delocalized or liquid-like structures for the remaining shells.
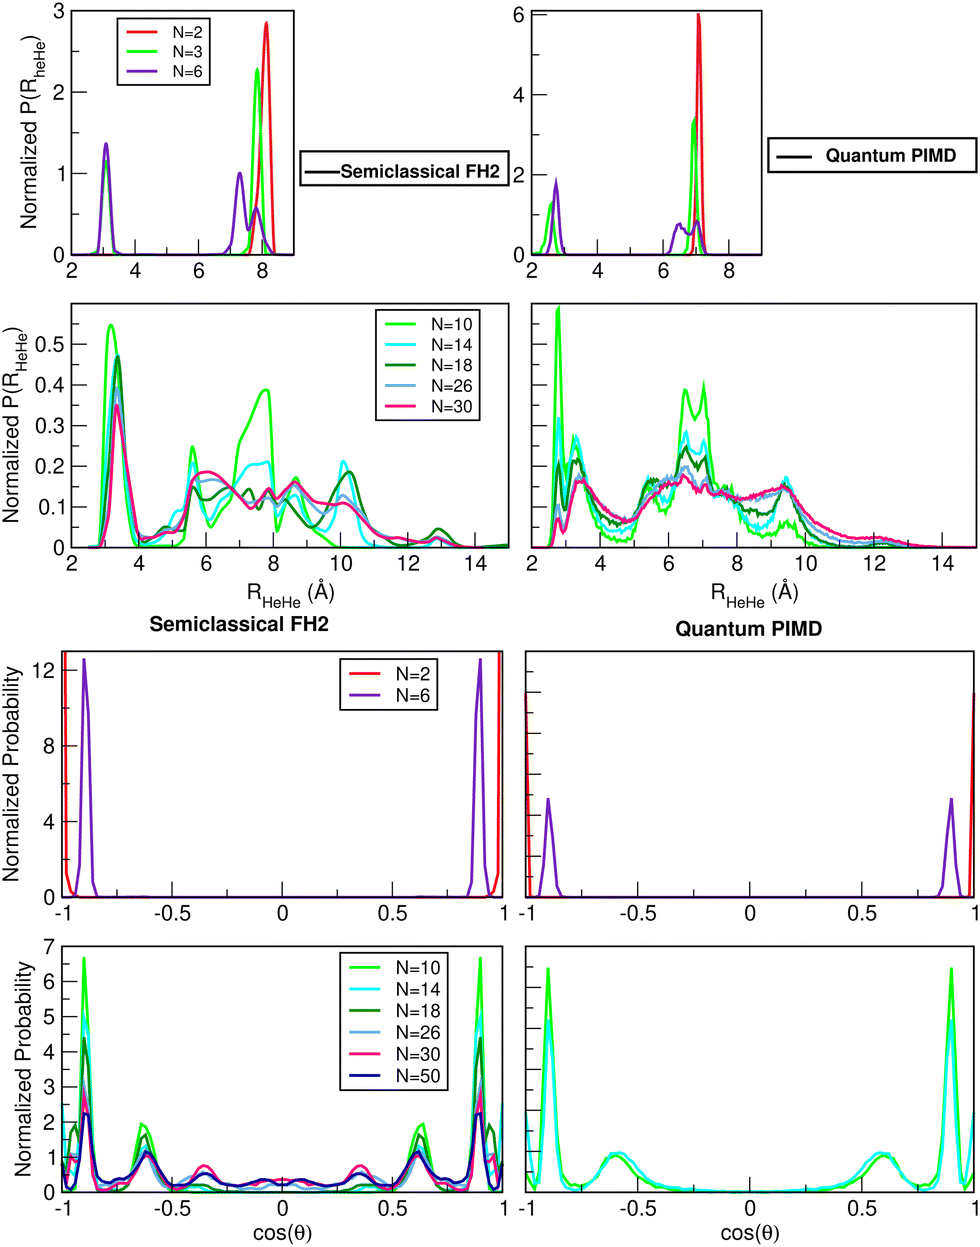 | ||
| Fig. 7 Probability distributions of He–He distances (upper panels) and cos(q) angle (lower panels) obtained from semiclassical FH2 and quantum PIMD simulations for the indicated HeNLi2+, with N = 1–50 at T = 2 K. | ||
 | ||
| Fig. 8 Side/top-view of the spatial distribution functions of He atoms around the Li2+ cation. The He densities are computed by the PIMD simulations at T = 2 K, while for a clearer visual representation the Li2+ is plotted in its equilibrium geometry instead of its PIMD fluctuating one, as given next in Fig. 9. The isosurface values are 0.05, 0.025, and 0.0165 NHe/Å3 for N = 10, 18 and 30, respectively. | ||
In Fig. 9, 2D probability distributions of selective clusters with increasing number of He atoms (N = 2, 6, 10, 14, 18, 26 and 30) are depicted, considering the (z, ρ) cylindrical coordinates as obtained from semiclassical FH2 and quantum PIMD simulations at T = 2 K. One can see the evolution of the 2D contour plots with the formation of more He layers around the Li2+ ion. First, one can observe that He2Li2+ shows a strong localization of the He atoms almost in the linear configuration. As the number of He atoms increases, there is always a preference around z = 3.2 Å at both sides of the Li2+ cation, which holds regardless of the number of atoms. From N ≥ 10, one can distinguish new zones in the contour plots corresponding to larger values of ρ and z. Finally, in He26Li2+ and He30Li2+ we can even see that the z = 0 zone is starting to be accessible. Although this general behaviour is similar between semiclassical and quantum 2D distributions, the maxima peaks that appeared in the semiclassical FH2 calculations are shifted to larger z values following the displacements of the effective FH2 potentials, as shown in Fig. 2.
 | ||
| Fig. 9 Semiclassical FH2 (left panels) and quantum (right panels) contour plots of the probability distributions in (z, ρ)-plane and corresponding thermal conformers of the HeNLi2+, with N = 2, 6, 10, 14, 18, 26 and 30 at T = 2 K. | ||
By performing partial integrations in selected spatial regions corresponding to solvation rings around the cation, we quantified the He atom probability density in each of these areas. In Fig. 10 we plotted this number of He atoms in each solvation shell as a function of the cluster size. Both semiclassical FH2 and quantum PIMD results show that for all clusters the first shell maintains fixed the number of 6 He atoms, confirming that there is no interchange with the outer shells. The second shell appears for clusters with N > 6, and a third for N > 10. The differences found between the FH2 and PIMD 2D distributions for N = 18 are also clear in the number of He atoms in these shells, with the FH2 results predicting a larger number of He atoms in the third shell, while PIMD data show a fixed number of two He's in the N = 14 and 18 clusters in this shell, as well as for the He26Li2+ and He30Li2+ with 16 He's in the second shell. In turn, for the He50Li2+ cluster, the number of He's in the outer shells is similar counting 20 and 24 He's in each of them.
 | ||
| Fig. 10 The number of He atoms in the solvation shells as a function of cluster size for the indicated HeNLi2+, with N = 1–50, obtained from FH2 and PIMD simulations at T = 2 K. | ||
Our analysis was primarily based on structural distributions and energy comparisons, although, for a more quantitative analysis, the use of alternative robust indicators of solid-like and liquid-like behavior can also provide additional insights. One such measure is the Lindemann index,62,63 with its formula given by  , where rij is the distance or angle of interest, which quantifies atomic fluctuations relative to their time-averaged positions. We evaluated averaged δ for both RHeHe and R distance fluctuations for the HeNLi2+ clusters, as well as for each He atom in specific clusters. Fig. 11 displays the computed δ values for each He atom in specific HeNLi2+ clusters (see upper panel), along with the system-averaged values (see lower panel) for each cluster obtained from our PIMD simulations. The magnitude of δ serves as an indication of structural rigidity, such as solid-like behavior when the He atoms are localized, meaning that their relative positions fluctuate very little, thus giving small δ values (typically < 0.1), while for a liquid-like behavior the He atoms exhibit significant fluctuations in their relative positions, leading to larger δ values (typically > 0.2). By comparing the averaged δ values for RHeHe and R distance fluctuations (see lower panel in Fig. 11), we observe that the fluctuations in R are small, remaining below 0.2 for all clusters studied, suggesting structural stability around the Li2+, while the RHeHe fluctuations are found to be larger than 0.2 for N > 12 clusters, indicating increased He atom mobility. This supports the formation of ring arrangements, with the exchange of He atoms between them. Additionally, Fig. 11 shows the δ values for each He atom in specific HeNLi2+ clusters up to N = 30. Notably, at least 5–6 He atoms in each cluster (see also Fig. 10) have δ ≤ 0.1, indicating the presence of well-localized solid-like structures in the inner shell. Beyond this, larger fluctuations were found for the remaining He atoms in the N = 10, 18 and 30 clusters, where some He atoms exhibit fluctuations more than three times higher than those in the inner shell, highlighting the coexistence of solid-like and liquid-like behavior as the cluster size grows.
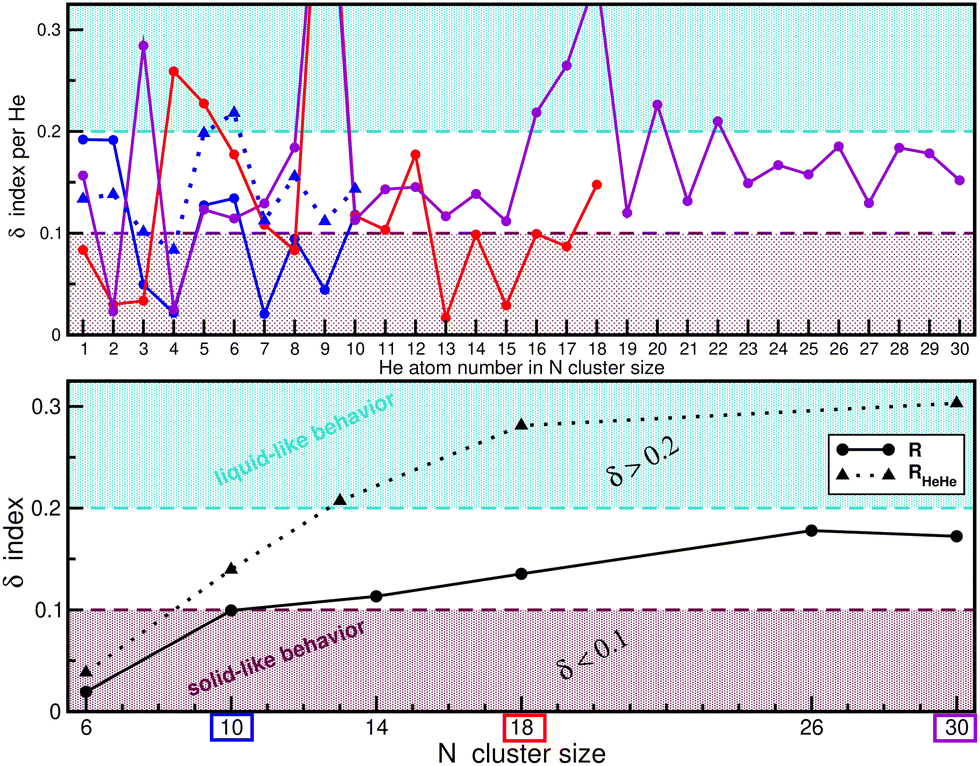 | ||
| Fig. 11 Lindemann index, δ, values calculated for the Ri distance fluctuations for each He atom (upper panel) in the indicated clusters. The lower panel shows the average δ values obtained for both RHeHe (dotted triangle lines) and Ri (solid-circle lines) distance fluctuations for each HeN = 1–30Li2+ cluster, as obtained from the PIMD simulations at T = 2 K. | ||
4. Summary and conclusions
This study investigates quantum microsolvation effects in Li2+ ion-doped helium clusters at low temperatures, employing both FH2 and PIMD simulations. Results from semiclassical and quantum calculations provide consistent qualitative insights into the structural and energetic properties during the microsolvation of the cation by He atoms.Our findings confirm the selective growth of the HeNLi2+ clusters, governed by the anisotropic nature of the interactions. In the first solvation shell, well-localized solid-like structures form around the cation, with no interchange of He atoms between the inner and outer shells. This pronounced local order suggests a strong magic shell effect, evident in the single-atom evaporative energetics. In contrast, the second and third shells exhibit liquid-like characteristics, with significant He exchange between them.
The presence of such local microstructures may relate to the experimentally observed slow mobility of ions in ultra-cold He droplets. Cations could transiently become trapped, influencing short-time solute–solvent dynamics. This shell effect may extend to various ions, warranting future studies to calculate local superfluid densities in the shells. Furthermore, exploring the solid-like/liquid-like behavior in He clusters induced by charged molecules, particularly in terms of local order and localization degree, could provide insights into the transition of dissolved molecules from clusters to bulk.
Data availability
Data are generally included in the article itself. Kinetic, potential, and total average energy values for the HeNLi2+ and Li2+, together with their corresponding errors from the PIMD simulations are listed in the ESI.†Conflicts of interest
There are no conflicts to declare.Acknowledgements
The authors thank the Centro de Cálculo del IFF/SGAI-CSIC and CESGA-Supercomputing centre for allocation of computer time. We acknowledge financial support by the MINECO grant No. PID2020-114654GB-I00, CSIC-PEICT Ref: 2024AEP119, and COST Actions CA21101(COSY) and CA21126(NanoSpace).References
- J. P. Toennies, A. F. Vilesov and K. B. Whaley, Phys. Today, 2001, 54, 31–37 CAS.
- J. P. Toennies and A. F. Vilesov, Angew. Chem., Int. Ed., 2004, 43, 2622–2648 CAS.
- M. Rossi, M. Verona, D. E. Galli and L. Reatto, Phys. Rev. B: Condens. Matter Mater. Phys., 2004, 69, 212510 CrossRef.
- F. Stienkemeier and K. K. Lehmann, J. Phys., B, 2006, 39, R127–R166 CrossRef CAS.
- S. Paolini, F. Ancilotto and F. Toigo, J. Chem. Phys., 2007, 126, 124317 CrossRef PubMed.
- E. Coccia, E. Bodo, F. Marinetti, F. A. Gianturco, E. Yildrim, M. Yurtsever and E. Yurtsever, J. Chem. Phys., 2007, 126, 124319 CrossRef CAS PubMed.
- R. E. Zillich and K. B. Whaley, J. Phys. Chem. A, 2007, 111, 7489–7498 CrossRef CAS PubMed.
- D. Bonhommeau, M. Lewerenz and N. Halberstadt, J. Chem. Phys., 2008, 128, 054302-1-18 CrossRef PubMed.
- R. Prosmiti, G. Delgado-Barrio, P. Villarreal, E. Yurtsever, E. Coccia and F. A. Gianturco, J. Phys. Chem. A, 2009, 113, 14718–14729 CrossRef CAS PubMed.
- D. E. Galli, D. M. Ceperley and L. Reatto, J. Phys. Chem. A, 2011, 115, 7300–7309 CrossRef CAS PubMed.
- R. Pérez de Tudela, P. Barragán, A. Valdés and R. Prosmiti, J. Phys. Chem. A, 2014, 118, 6492–6500 CrossRef PubMed.
- M. Gatchell, P. Martini, F. Laimer, M. Goulart, F. Calvo and P. Scheier, Faraday Discuss., 2019, 217, 276–289 CAS.
- R. Pérez de Tudela, P. Martini, M. Goulart, P. Scheier, F. Pirani, J. Hernández-Rojas, J. Bretón, J. Ortiz de Zárate, M. Bartolomei, T. González-Lezana, M. I. Hernández, J. Campos-Martínez and P. Villarreal, J. Chem. Phys., 2019, 150, 154304 CrossRef PubMed.
- A. Czáscár, T. Szidarovszy, O. Asvany and S. Schlemmer, Mol. Phys., 2019, 117, 1559–1583 Search PubMed.
- T. González-Lezana, O. Echt, M. Gatchell, M. Bartolomei, J. Campos-Martínez and P. Scheier, Int. Rev. Phys. Chem., 2020, 39, 465–516 Search PubMed.
- A. Castillo-García, A. W. Hauser, M. P. de Lara-Castells and P. Villarreal, Molecules, 2021, 26, 5783 Search PubMed.
- M. Bartolomei, P. Martini, R. Pérez de Tudela, T. González-Lezana, M. I. Hernández, J. Campos-Martínez, J. Hernández-Rojas, J. Bretón and P. Scheier, Molecules, 2021, 26, 3642 Search PubMed.
- K. Nauta and R. E. Miller, Science, 2000, 287, 293–295 CAS.
- Y. Xu, W. Jäger, J. Tang and A. R. W. McKellar, Phys. Rev. Lett., 2003, 91, 163401 Search PubMed.
- M. Y. Choi, G. E. Douberly, T. M. Falconer, W. K. Lewis, C. M. Lindsay, J. M. Merritt, P. L. Stiles and R. E. Miller, Int. Rev. Phys. Chem., 2006, 25, 15–75 Search PubMed.
- S. Moroni and S. Baroni, Comput. Phys. Commun., 2005, 169, 404–407 CAS.
- C. Callegari and W. E. Ernst, Handbook of High-Resolution Spectroscopy, Hoboken, NJ, 2011, pp. 1551–1594 Search PubMed.
- F. Lackner, G. Krois and W. E. Ernst, J. Chem. Phys., 2017, 147, 184302 Search PubMed.
- D. Verma, R. M. P. Tanyag, S. M. O. O'Connell and A. F. Vilesov, Adv. Phys.: X, 2019, 4, 1553569 CAS.
- S. Albrechtsen, C. Schouder, A. Viñas Muñoz, J. Christensen, C. Petersen, M. Pi, M. Barranco and H. Stapelfeldt, Nature, 2023, 623, 319–323 CAS.
- S. Müller, M. Mudrich and F. Stienkemeier, J. Chem. Phys., 2009, 131, 044319 Search PubMed.
- P. Bartl, C. Leidlmair, S. Denifl, P. Scheier and O. Echt, J. Phys. Chem. A, 2014, 118, 8050 CAS.
- E. Kim and M. H. W. Cham, Nature, 2004, 427, 225 CAS.
- F. Brieue, C. Schran and D. Marx, Phys. Rev. Res., 2023, 5, 043083 CrossRef.
- K. R. Atkins, Phys. Rev., 1959, 116, 1339–1343 CrossRef CAS.
- W. I. Glaberson and W. W. Johnson, J. Low Temp. Phys., 1975, 20, 313–338 CrossRef CAS.
- F. Bartis, Phys. Lett. A, 1977, 60, 417 CrossRef.
- P. Moroshkin, V. Lebedev and A. Weis, Phys. Rev. Lett., 2009, 102, 115301 CrossRef CAS.
- S. L. Fiedler, D. Mateo, T. Aleksanyan and J. Eloranta, Phys. Rev. B: Condens. Matter Mater. Phys., 2012, 86, 144522 CrossRef.
- C. Di Paola, F. Sebastianelli, E. Bodo, F. A. Gianturco and M. Yurtsever, J. Chem. Theory Comput., 2005, 1, 1045–1054 CrossRef CAS PubMed.
- F. Marinetti, L. Uranga-Piña, E. Coccia, D. López-Durán, E. Bodo and F. A. Gianturco, J. Phys. Chem. A, 2007, 111, 12289–12294 CrossRef CAS PubMed.
- L. An der Lan, P. Bartl, C. Leidlmair, R. Jochum, S. Denifl, O. Echt and P. Scheier, Chem. – Eur. J., 2012, 18, 4411–4418 CrossRef CAS PubMed.
- N. Alharzali, H. Berriche, P. Villarreal and R. Prosmiti, J. Phys. Chem. A, 2019, 123, 7814–7821 CrossRef CAS PubMed.
- N. Alharzali, R. Rodríguez-Segundo and R. Prosmiti, Phys. Chem. Chem. Phys., 2021, 23, 7849–7859 RSC.
- R. Yanes-Rodríguez, R. Rodríguez-Segundo, P. Villarreal and R. Prosmiti, Eur. Phys. J. D, 2023, 77, 116 CrossRef.
- R. Prosmiti and T. González-Lezana, ChemPhysChem, 2024, 25, e202400207 CrossRef CAS PubMed.
- M. Theisen, F. Lackner and W. E. Ernst, Phys. Chem. Chem. Phys., 2010, 12, 14861–14863 RSC.
- M. Rastogi, C. Leidlmair, L. An der Lan, J. Ortiz de Zárate, R. Pérez de Tudela, M. Bartolomei, M. I. Hernández, J. Campos-Martínez, T. González-Lezana, J. Hernández-Rojas, J. Bretón, P. Scheier and M. Gatchell, Phys. Chem. Chem. Phys., 2018, 20, 25569–25576 CAS.
- R. Feynman and A. Hibbs, Quantum Mechanics and Path-Integrals, McGraw-Hill, New York, 1965 Search PubMed.
- N. Alharzali, H. Berriche, P. Villareal and R. Prosmiti, J. Phys. Chem. A, 2019, 123, 7814–7821 CrossRef CAS PubMed.
- R. A. Aziz and M. J. Slaman, J. Chem. Phys., 1991, 94, 8047 CrossRef CAS.
- L. Sesé, Mol. Phys., 1995, 85, 931–947 CrossRef.
- F. Calvo, J. Doye and D. Wales, J. Chem. Phys., 2001, 114, 7312–7329 CrossRef CAS.
- P. Kowalczyk, L. Brualla, P. A. Gauden and A. P. Terzyk, Phys. Chem. Chem. Phys., 2009, 11, 9182–9187 RSC.
- R. Rodríguez-Cantano, R. Pérez de Tudela, M. Bartolomei, M. Hernández, J. Campos-Martínez, T. González-Lezana, P. Villarreal, J. Hernández-Rojas and J. Bretón, J. Phys. Chem. A, 2016, 120, 5370–5379 CrossRef PubMed.
- M. Kuhn, M. Renzler, J. Postler, S. Ralser, S. Spieler, M. Simpson, H. Linnartz, A. Tielens, J. Cami, A. Mauracher, Y. Wang, M. Alcamí, F. Martín, M. K. Beyer, R. Wester, A. Lindinger and P. Scheier, Nat. Commmun., 2016, 7, 13550 CAS.
- V. Muñoz, Métodos de la Física Matemática II, https://macul.ciencias.uchile.cl/alejo/clases/mfm2.pdf Search PubMed.
- S. Stamatiadis, R. Prosmiti and S. Farantos, Comput. Phys. Commun., 2000, 127, 343 CAS.
- M. Ceriotti, J. More and D. E. Manolopoulos, Comput. Phys. Commun., 2014, 185, 1019–1026 CAS.
- V. Kapil, M. Rossi, O. Marsalek, R. Petraglia, Y. Litman, T. Spura, B. Cheng, A. Cuzzocrea, R. H. Meißner, D. M. Wilkins, B. A. Helfrecht, P. Juda, S. P. Bienvenue, W. Fang, J. Kessler, I. Poltavsky, S. Vandenbrande, J. Wieme, C. Corminboeuf, T. D. Kühne, D. E. Manolopoulos, T. E. Markland, J. O. Richardson, A. Tkatchenko, G. A. Tribello, V. van Speybroeck and M. Ceriotti, Comput. Phys. Commun., 2019, 236, 214–223 CAS.
- M. Ceriotti, M. Parrinello, T. E. Markland and D. E. Manolopoulos, J. Chem. Phys., 2010, 133, 124104 Search PubMed.
- G. Bussi and M. Parrinello, Phys. Rev. E: Stat., Nonlinear, Soft Matter Phys., 2007, 75, 056707 Search PubMed.
- M. Iwamatsu, Comput. Phys. Commun., 2001, 142, 214–218 CAS.
- D. Fogel, Evolutionary Computation: Toward a New Philosophy of Machine Intelligence, IEEE Press-Wiley, Hoboken, New Jersey, 2006 Search PubMed.
- J. Martínez, M. F. López, J. A. Martín-Gago and M. V. Distributed Computing, Artificial Intelligence, Bioinformatics, Soft Computing, and Ambient Assisted Living, Berlin, Heidelberg, 2009, pp. 280–283 Search PubMed.
- F. T. Silva, M. X. Silva and J. C. Belchior, Front. Chem., 2019, 7, 707 CAS.
- T. Beck, J. Doll and D. Freeman, J. Chem. Phys., 1989, 90, 5651–5656 CAS.
- P. Barragán, R. Pérez de Tudela, C. Qu, R. Prosmiti and J. Bowman, J. Chem. Phys., 2013, 139, 024308 Search PubMed.
Footnote |
| † Electronic supplementary information (ESI) available. See DOI: https://doi.org/10.1039/d5cp00318k |
| This journal is © the Owner Societies 2025 |