
 Open Access Article
 This Open Access Article is licensed under a
 Creative Commons Attribution 3.0 Unported Licence
Exploring the decay mechanisms of isoindigo from indolin-2-one-based derivatives: molecular isomerism vs. aromatic rigidity†
Carla
Cunha
,
Marta
Pineiro
 and
J. Sérgio
Seixas de Melo
*
and
J. Sérgio
Seixas de Melo
*
University of Coimbra, CQC-IMS, Department of Chemistry, Rua Larga, Coimbra 3004-535, Portugal. E-mail: sseixas@ci.uc.pt
First published on 29th April 2025
Abstract
The excited state decay pathways of indigo (IND) and its structural isomers, indirubin (INR) and isoindigo (ISO), have received considerable attention in recent years, with a focus on the molecular mechanisms involving excited state proton transfer (ESPT) and rotational isomerisation. In this work, we aim to deepen the understanding of the decay mechanisms of ISO for which we have synthesized two new structures derived from indolin-2-one. The first structure consists of two indolin-2-one units linked by two double bonds, designated 3,3′-(ethane-1,2-diylidene)bis(indolin-2-one), abbreviated as EBI, while the second structure is a fused aromatic system with a double bond, 6,12-dihydrodibenzo[c,h][2,6]naphthyridine-5,11-dione (abbreviated as DBND). EBI consists of a flexible structure, allowing for different isomeric forms in both the ground and excited states, while DBND is a rigid, polyaromatic molecule. Three geometrical isomers of EBI were identified on the basis of their geometries (E,E′-EBI, Z,E′-EBI and Z,Z′-EBI) and efficiently purified using high-performance liquid chromatography (HPLC). The excited state properties were studied using steady-state absorption and emission spectroscopy and femtosecond transient absorption spectroscopy (fs-TA). Quantum chemical calculations provided insight into the observed spectral features. The flexible structure of EBI in the excited state, regardless of its isomeric form, enables efficient radiationless decay. In contrast, the rigid molecular structure of DBND leads to predominant deactivation by a radiative pathway.
Introduction
Organic π-conjugated compounds are increasingly recognised as promising candidates for applications in conductivity, photonics, and magnetism due to their efficient π-electronic communication.1–3 Isoindigo (ISO) is of particular interest due to its planar structure, stability, degree of π-conjugation, electron deficiency and ease of functionalisation. The ability to modify ISO, particularly at the endocyclic nitrogen atom, allows fine-tuning of its electronic properties for various applications.4–8A common approach to the preparation of π-conjugated organic materials is to create donor–acceptor (D–A) systems, in which an electron-rich donor is combined with an electron-deficient acceptor.9,10 The interaction between their boundary orbitals reduces the effective band gap. Among the electron-deficient acceptors, ISO which occurs naturally in the leaves of Isatis tinctoria as a minor isomer of indigo dye,11 has attracted attention as a useful building block for high-performance organic semiconductors due to its easy and scalable synthesis with high yields, high hole mobility, good charge transport and stability.12–15 The two fused planar lactam rings adjacent to the aryl moieties make ISO a strong electron-withdrawing molecule with a low LUMO energy level, strong electronic absorption and a highly reactive conjugated system.16–19 These factors led to the beginning of many studies on ISO as a platform for the construction of polymeric materials for various purposes.16,20,21 Furthermore, these molecules were incorporated into materials for transistor applications due to their extended delocalised planar aromatic π-system, which may facilitate π−π stacking and enable high-charge carrier mobility, hole mobility and excellent stability.1,21–24
Previous studies have identified the radiationless internal conversion process as the primary deactivation pathway in IND, INR and ISO.11,25–31 In IND, the deactivation of the excited state involves an excited state proton transfer (ESPT), which, despite involving the N–H and C![[double bond, length as m-dash]](https://www.rsc.org/images/entities/char_e001.gif) O groups of indigo, can occur either intra- or inter-molecularly.27,28,30,32,33 In ISO, the molecular mechanism behind this efficient radiationless deactivation involves rotation in the first singlet excited state, S1, around the dihedral angle (OC)–CC–(CO). This rotation results in a conformation that, when evaluated at a conical intersection (with a dihedral angle of 79.4°), provides an effective pathway for deactivation to the ground state. This mechanism differs from that of its analogues, indigo (IND) and indirubin (INR), the main difference being that this molecule is more photostable.25
O groups of indigo, can occur either intra- or inter-molecularly.27,28,30,32,33 In ISO, the molecular mechanism behind this efficient radiationless deactivation involves rotation in the first singlet excited state, S1, around the dihedral angle (OC)–CC–(CO). This rotation results in a conformation that, when evaluated at a conical intersection (with a dihedral angle of 79.4°), provides an effective pathway for deactivation to the ground state. This mechanism differs from that of its analogues, indigo (IND) and indirubin (INR), the main difference being that this molecule is more photostable.25
In this work, with the aim of further elucidating the excited state deactivation mechanism of ISO, we present the results of the study of the excited state dynamics of isoindigo analogues – 3,3′-(ethane-1,2-diylidene)bis(indolin-2-one), abbreviated as EBI. We found that the three possible isomers, E,E′-EBI, Z,Z′-EBI and Z,E′-EBI, can be formed, each with different electronic signatures, allowing their individual study. In addition, we investigate the rigid molecule resulting from the isomerisation of ISO, 6,12-dihydrodibenzo[c,h][2,6]naphthyridine-5,11-dione (DBND), a tetracyclic fused building block (Scheme 1).
 | ||
| Scheme 1 Molecular structures of (A) isoindigo, ISO, (B) 3,3′-(ethane-1,2-diylidene)bis(indolin-2-one), EBI, and (C) 6,12-dihydrodibenzo[c,h][2,6]naphthyridine-5,11-dione, DBND. | ||
Results and discussion
Synthesis of 3,3′-(ethane-1,2-diylidene)bis(indolin-2-one) (EBI)
The isoindigo analogue 3,3′-(ethane-1,2-diylidene)bis(indolin-2-one) (EBI) is an extended π-conjugated dimeric heterocycle in which two 2-oxindole rings are connected by an ethylene unit. This structure is less rigid than isoindigo due to rotational freedom in the single bonds. Its potential as an attractive building block for conjugated photovoltaic polymers has recently been reported.4,34 The synthesis, using previously described methods,4 involved heating 2-oxindole with glyoxal in methanol under reflux, yielding EBI in about 32% yield in a single step, see Scheme 2.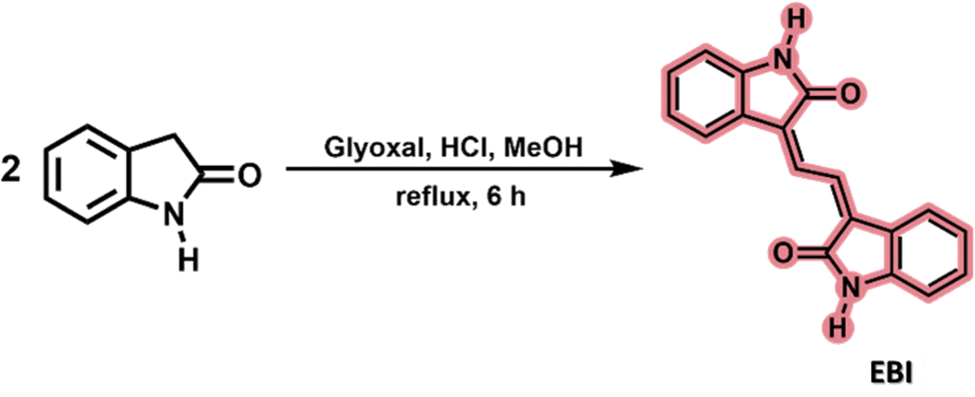 | ||
| Scheme 2 Synthesis of 3,3′-(ethane-1,2-diylidene)bis(indolin-2-one), EBI. | ||
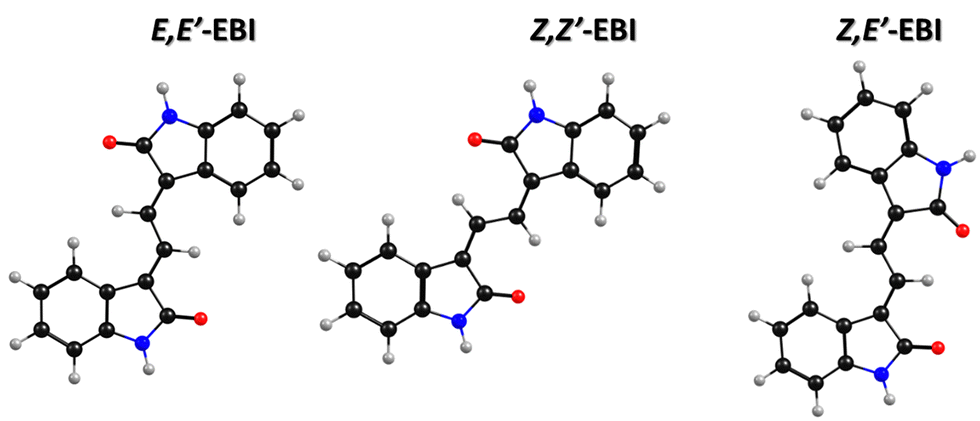
The HRMS analysis confirmed the molecular formula of EBI; however, 1H-NMR and 13C-NMR analysis determined that the product was a mixture of three isomeric structures, as shown in Fig. S1 and S2 (ESI†). HPLC-DAD analysis at room temperature revealed three distinct peaks with different retention times, confirming that the synthesised compound is a mixture of three isomers: Z,Z′-EBI, Z,E′-EBI and E,E′-EBI, resulting from different orientations of the 2-oxindole moieties around the central ethylene bonds (Fig. 1).
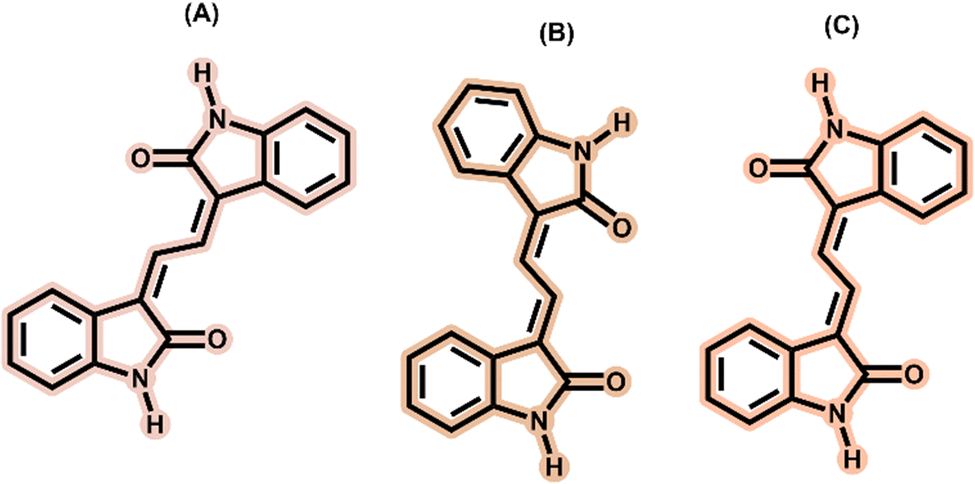 | ||
| Fig. 1 Structures of the three isomers of 3,3′-(ethane-1,2-diylidene)bis(indolin-2-one), EBI: (A) (3Z,3′Z)-3,3′-(ethane-1,2-diylidine)bis(indolin-2-one), Z,Z′-EBI, (B) (3Z,3′E)-3,3′-(ethane-1,2-diylidine)bis(indolin-2-one), Z,E′-EBI and (C) (3E,3′E)-3,3′-(ethane-1,2-diylidine)bis(indolin-2-one), E,E′-EBI. | ||
HPLC chromatography was used for the separation and identification of the EBI isomers, using a reversed-phase technique on a C-18 column with a mobile phase consisting of H2O: 0.2% TFA and MeOH: 0.2% TFA, with varying gradients (see the Experimental section for details), at a flow rate of 0.85 mL min−1. The effect of column temperature on the elution of the three isomers was evaluated. Small changes in temperature did not affect elution, but larger increments of 5 °C resulted in shorter elution times (Table S1, ESI†). Higher column temperatures not only reduced elution times but also affected the resolution of the isomer separation. To achieve an optimal balance between resolution and isomer separation, 60 °C was chosen as the column elution temperature, with detection at 280 nm (Fig. 2).
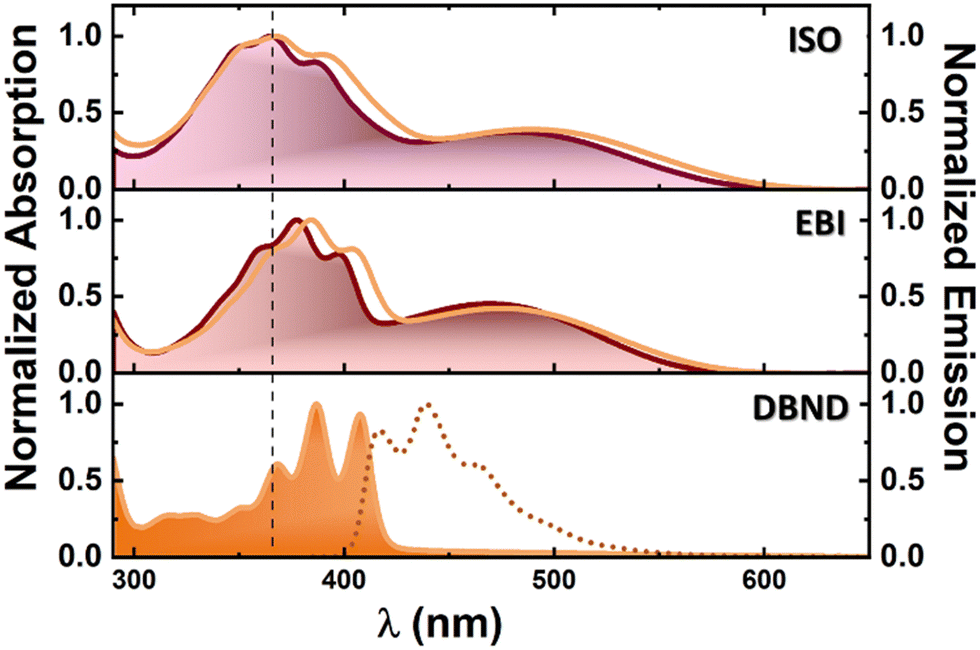 | ||
| Fig. 2 Room temperature normalized absorption spectra of ISO, EBI and DBND in THF and DMSO. Fluorescence emission spectra (dotted line) of DBND in DMSO. The vertical dashed lines are just meant to be a guide to the eye. Color legend for lines: THF in purple and DMSO in orange. | ||
Fig. S3 (ESI†) shows the EBI chromatogram with three peaks corresponding to retention times of 13.6–20.3 min (peak I), 15.5–24.9 min (peak II) and 16.7–25.5 min (peak III). The peak area values (Table S1, ESI†) and absorption spectra (Fig. S3, ESI†) are unaffected by temperature, indicating that the three isomers do not undergo thermal interconversion at temperatures below 60 °C.
The products were separated, analysed by 1H-NMR and spectrophotometry and the three isomers were identified. Fig. S4 (ESI†) shows the corresponding chromatogram of the isomers obtained by HPLC from the same EBI solution. Due to the structural similarity between EBI and ISO, the chromatograms and absorption spectra of the two compounds were compared (Fig. S5, ESI†) to confirm the absence of ISO contamination in EBI, thus ensuring the purity of the isolated compounds.
The 1H-NMR spectra of the isolated fractions of EBI, measured in DMSO-d6 (Fig. S6–S8, ESI†), indicate that fraction F2 corresponds to Z,Z′-EBI. The spectra, consistent with those previously reported for this isomer4, show two singlets at 10.69 ppm and 8.80 ppm, assigned to the NH and CH protons of the linker, respectively, and four signals between 7.52 ppm and 6.84 ppm (two doublets and two triplets) corresponding to the aromatic protons. Fraction F1 shows a similar pattern, with two singlets and four signals corresponding to the aromatic protons. The singlet for the NH proton appears at 10.74 ppm, while the singlet for the two protons of the linker is shifted to a higher magnetic field at 7.79 ppm. The 1H-NMR spectrum of fraction F3 shows two distinct signals for the NH groups (10.60 ppm and 10.68 ppm) as well as for the Hs of the linker (8.65 ppm and 8.68 ppm). Considering the symmetry of the two other isomers, F1 was assigned to the E,E′-EBI isomer and F3 to the more asymmetrical Z,E′-EBI.
Synthesis of 6,12-dihydrodibenzo[c,h][2,6]naphthyridine-5,11-dione (DBND)
Unlike isoindigo, DBND consists of a fused aromatic system. Its fully planar structure favours better solid state π−π stacking and hence better carrier mobility, making it an excellent candidate for high performance applications in optoelectronic devices.35,36DBND was synthesized using a previously described methodology.35 Briefly, the double bond of ISO was quantitatively reduced using Zn/trifluoroacetic acid. The resulting product was isomerised in a HCl/H2O/THF solution to give a fused saturated bis-lactam, which was then oxidised in air with K2CO3 to give the compound as a yellow solid in almost quantitative yield (Scheme 3). The 1H NMR data obtained are consistent with the previously described data.35 Further details can be found in the ESI† (see Fig. S9).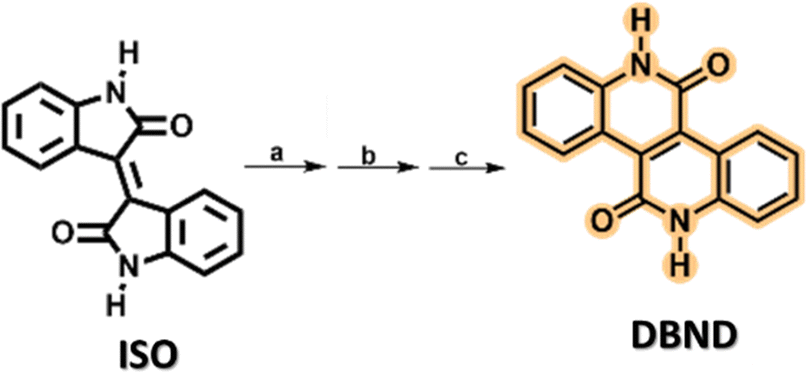 | ||
Scheme 3 Synthesis of 6,12-dihydrodibenzo[c,h][2,6]naphthyridine-5,11-dione (DBND). Reagents and conditions: (a) Zn, CF3COOH, THF, r.t. 1 h; (b) HCl (conc.)![[thin space (1/6-em)]](https://www.rsc.org/images/entities/char_2009.gif) :THF (1:2), 100 °C, 8 h; and (c) K2CO3, DMF, bubbling air, r.t., 48 h. :THF (1:2), 100 °C, 8 h; and (c) K2CO3, DMF, bubbling air, r.t., 48 h. | ||
Electronic ground and excited state characterisation
Fig. 2 shows the absorption and fluorescence emission spectra of ISO, EBI and DBND compounds in THF and DMSO at room temperature (293 K). Data for ISO from previous studies are included for comparison.25As previously observed for ISO, the lower energy band (∼480–490 nm) is assigned to the π→π* transition of the 2-oxindole moieties (HOMO→LUMO transition) and the band at ∼370–390 nm to the HOMO−2→LUMO transition, also a π→π* transition. This is further supported by TDDFT calculations, where the relevant electronic transitions are found in the oxindole core.25
The UV-vis absorption spectrum of EBI in THF and DMSO is similar to that of ISO,25 reflecting the structural similarities between the two derivatives. EBI shows an absorption maximum between 465 nm and 475 nm, attributed to the π→π* transition, with a secondary high-resolution band between 377 nm and 384 nm corresponding to the HOMO−2→LUMO transition, affected by solvent polarity.
All EBI isomers show a maximum for the first absorption band similar to that reported for ISO25 in the same solvents. Compared to the maximum observed for ISO, the absorption band corresponding to the S0 → S1 transition is blue-shifted for EBI. The extended conjugation, enhanced by the addition of a second (central) double bond, reduces flexibility and promotes planar conformations, as reflected in the more structured absorption spectra of the three EBI isomers (Fig. 3). This is also present in DBND, but now with the disappearance of the lowest wavelength absorption band and a very small Stokes shift. The absorption spectral profile and maxima are unaffected by changes in solvent polarity, as shown by the similarity of the spectra in THF (ε′ = 7.58) and DMSO (ε′ = 46.7), in Fig. 2. Furthermore, EBI shows negligible emission in all solvents.
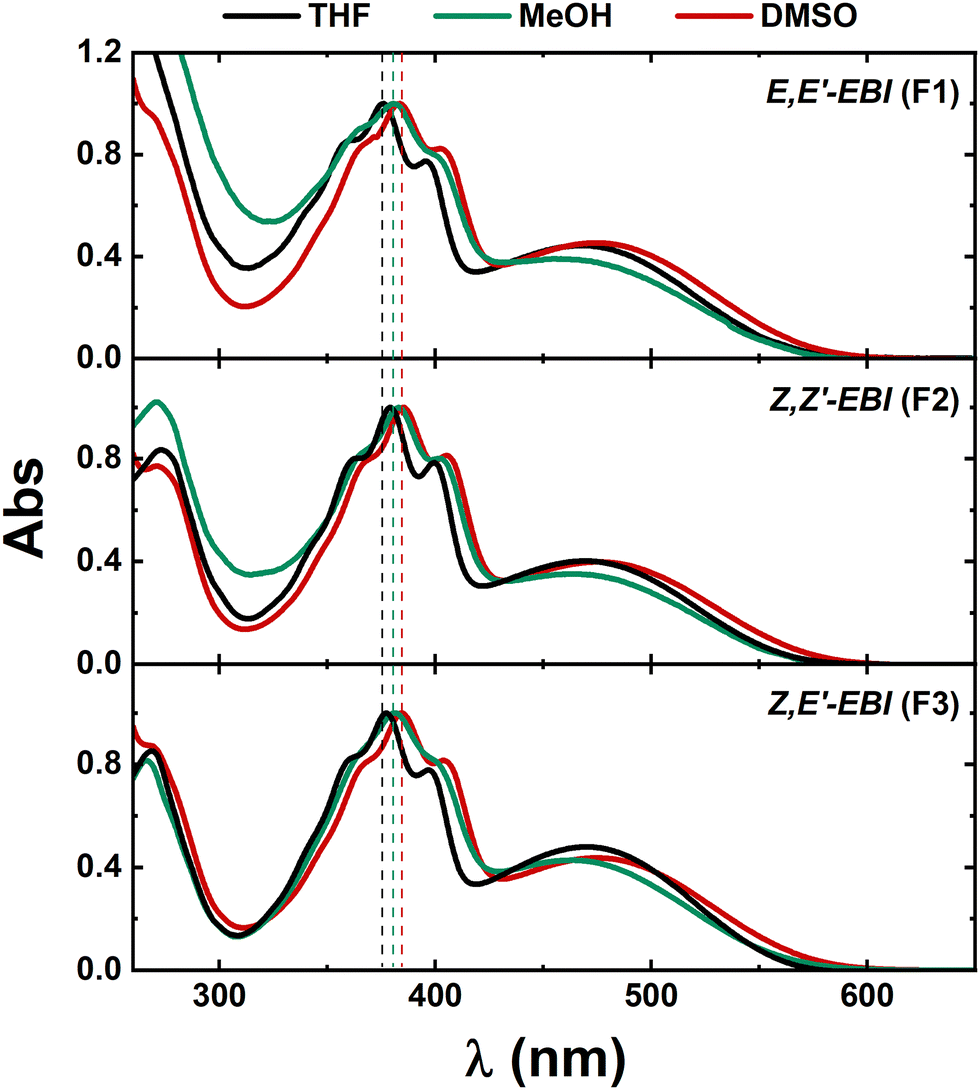 | ||
| Fig. 3 Absorption spectra of isomers E,E′-EBI (F1), Z,Z′-EBI (F2) and Z,E′-EBI (F3) in THF and DMSO (polar aprotic solvents) and MeOH (polar protic solvent), at room temperature. The dashed vertical lines are meant to be a guide to the eye. | ||
For DBND in DMSO, the absorption (λmax = 387 nm) and fluorescence emission (λmax = 439 nm) spectra are shown in Fig. 2, with fluorescence quantum yield values of ∼13%. Time-resolved fluorescence experiments for DBND in DMF and DMSO with excitation at 391 nm and emission at 415, 440 and 465 nm showed mono-exponential decays, with values of 490 ps in DMF and 510 ps in DMSO. TDDFT calculations predict an absorption band at 365 nm (HOMO→LUMO transition, f = 0.486) and an emission band at 431 nm, which is slightly blue-shifted (∼7 nm) with respect to the experimental value of 439 nm (with f = 0.724), Fig. S10 (ESI†).
The solvent dependence of the absorption spectra of the three EBI isomers was investigated in THF, MeOH and DMSO at room temperature (Fig. 3).
The absorption spectra of the three EBI isomers are essentially the same (Fig. 3 and Table S2, ESI†), with two distinct bands: one related to conjugation and another corresponding to the S0→S1 (π–π*) transition, with an observed slight blue-shift of the main absorption band from THF to DMSO. This is further supported by TDDFT calculations which show that the relevant transitions are localised in the 2-oxindole moieties (see discussion below). In addition, a less intense band at 270 nm is observed for the three EBI isomers.
To further investigate the ground state geometry of EBI, DFT calculations were carried out to optimise the geometries, density of states and electronic structures of the different isomers. Fig. 4 shows the most stable ground state geometry optimised for the three isomers of EBI. As expected, the calculations showed that the all the EBI isomers adopt a planar conformation with π-electrons delocalized throughout the molecule. As shown in Fig. 5 and Fig. S11–S13 (ESI†), the electrons in the highest occupied molecular orbital (HOMO) remain delocalised throughout the EBI molecule, irrespective of the isomer. To investigate the effect of the solvent on the isomeric structures, geometry optimisations were performed for different solvents (THF, TFE, MeOH and DMSO) using the same level of theory.
 | ||
| Fig. 4 Optimized molecular geometries structures in THF obtained from TDDFT calculations for the three possible isomers of the EBI derivative. | ||
 | ||
| Fig. 5 Energetically more favorable molecular structures, obtained from TDDFT calculations, for different isomers (from left to right: E,E′-EBI; Z,Z′-EBI and Z,E′-EBI) and natural transition orbitals of EBI for the electronic transitions (HOMO and LUMO) in THF. | ||
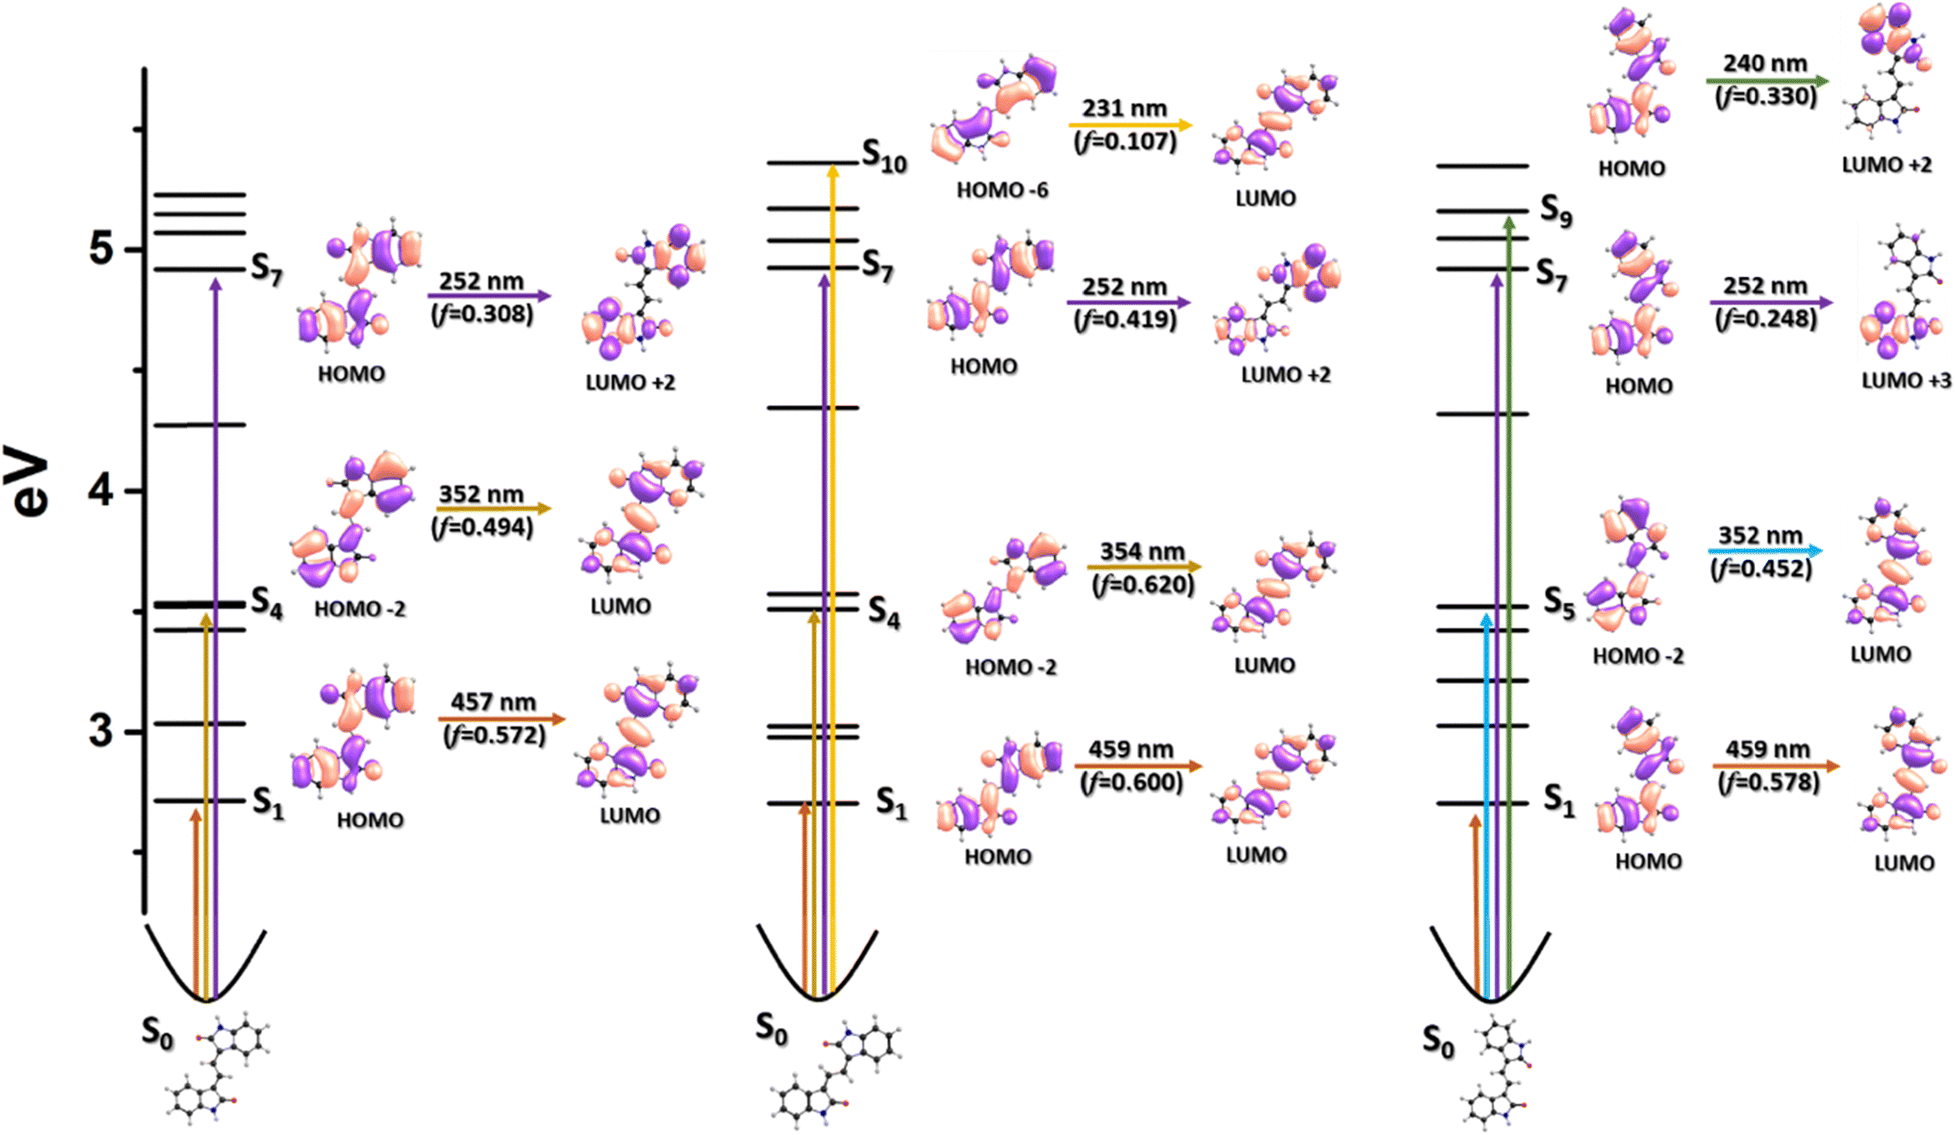
Fig. 5 and Fig. S11 (ESI†) show that the electronic structures and the density of states diagrams for the three isomers are similar in both THF and DMSO, respectively. The energy difference between the Z,E′-EBI and Z,Z′-EBI isomers is negligible (0.03 eV), with similar spectral and photophysical behaviour predicted for the two isomers. Consequently, the lowest energy band in the UV-vis spectra is attributed to the HOMO→LUMO transition. The highest intensity band, at ca. 360 nm, is attributed to the HOMO−2→LUMO transition. Fig. S12 and S13 (ESI†) show the representative calculated UV-vis spectra for EBI in TFE (ε′ = 26.67) and MeOH (ε′ = 32.66). Furthermore, the predicted spectra for the three isomers are very similar, regardless of the solvent. This is evident from the density diagrams, where the transitions corresponding to the absorption maxima, their oscillator strengths, and the orbital density distribution are nearly identical for the different isomers of EBI (see Fig. 5 and Fig. S11–S13, ESI†). The computed charge densities reveal a similar trend in both implicit polar and non-polar solvents.
Fig. 5 also shows the relevant S1→Sn transitions, i.e., those with oscillator strength values higher than 0.1. These transitions give extra support to the discussion of the excited state behaviour and structures based on the transient absorption data (see the next section).
Femtosecond-transient absorption (fs-TA) measurements
Due to the very low or absent fluorescence emission from the three isomers of EBI, the excited state deactivation processes - including the type and number of species involved and their associated decay mechanisms - were investigated using femtosecond transient absorption (fs-TA) experiments.37 These experiments provide both kinetic and spectral band information. Fig. 6 and Fig. S14 (ESI†) show the transient absorption spectra at different delay times, after excitation at 370 nm, obtained on a picosecond timescale, for the three EBI isomers, in two solvents: THF and DMSO. Experimental data for additional solvents, in particular for Z,E′-EBI, are presented in Table S3 (ESI†). In THF and DMSO, excitation of the three isomers of EBI with laser pulses (> 250 fs) at the second transition (maximum) of the ground state absorption band (Fig. 3) results in a broad band from 450 nm to 750 nm. For time delays (τ) longer than 25 ps, no signal evolution is observed (Fig. 6 and Fig. S14, ESI†). Overall, they show comparable spectral and temporal evolution with, however, different decay time values, see Table S3 (ESI†).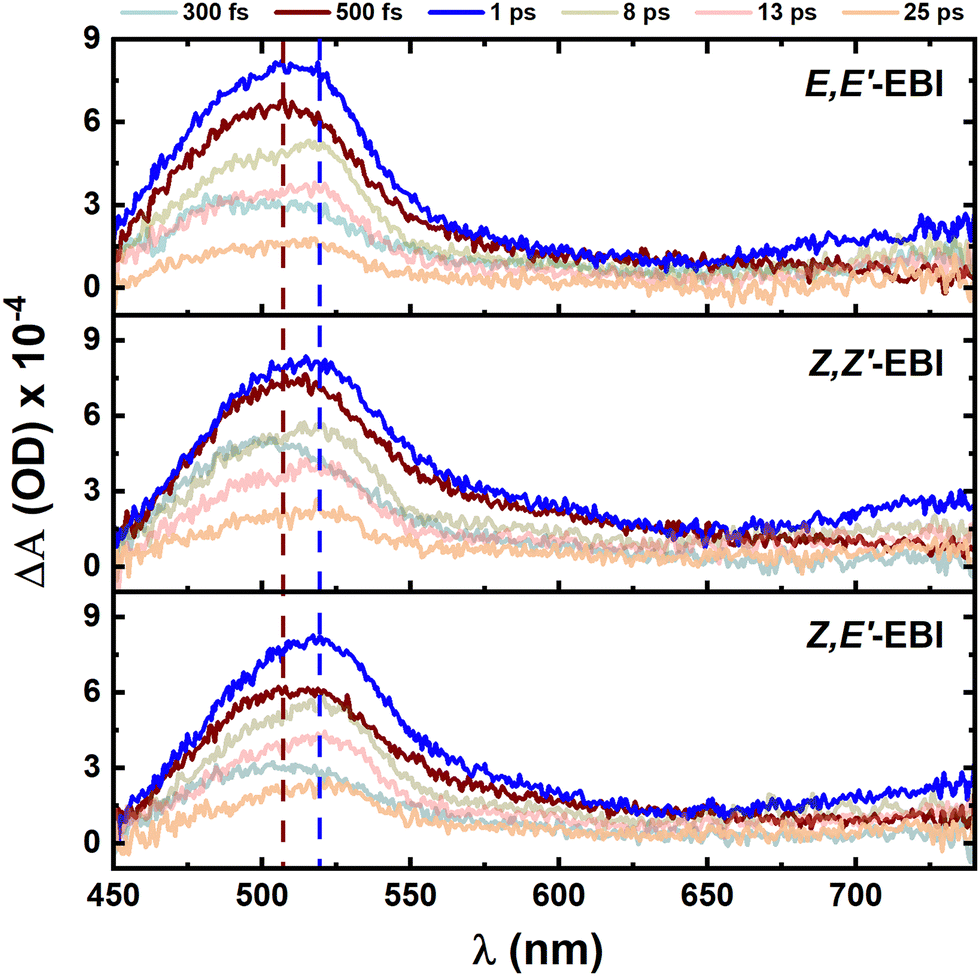 | ||
| Fig. 6 Time-resolved transient absorption (TA) data for the EBI isomers E,E′-EBI; Z,Z′-EBI and Z,E′-EBI, in THF, upon 370 nm pump at room temperature. TA spectra at indicated delay times for EBI along with their corresponding kinetic traces for three different isomers of EBI. | ||
As expected from the absorption spectra (Fig. 3) and further complemented by DFT and TDDFT calculations, the transient absorption data for the EBI isomers (E,E′-EBI; Z,Z′-EBI and Z,E′-EBI) are very similar in all solvents, with an excited state absorption (ESA) band centred at around 470–520 nm (see Fig. S15, ESI†).
The transient absorption (TA) data sets and the global analysis show that the lifetimes of E,E′-EBI; Z,Z′-EBI and Z,E′-EBI are essentially identical but solvent-dependent. Indeed, the overall excited state decay process is slower (longer decay times) in non-polar solvents (e.g. toluene with ∼45 ps) compared to polar solvents (e.g. 4 ps in methanol), see Fig. S16 (ESI†).
Furthermore, a comparison of the transients resulting from the S1→Sn transitions, obtained from the fs-TA spectral data in Fig. 6, and the predictions from TDDFT electronic quantum calculations, summarized in Table 1, reveals that: (i) for the E,E′-EBI isomer, the transient band maximum is observed at approximately 510 nm (with TDDFT predictions indicating an S1→S8 transition at 445–462 nm) in different solvents and (ii) for the Z,E′-EBI and Z,Z′-EBI isomers, the broad ESA band appears at about 500–515 nm, corresponding to the predicted S1→S8 transition at 449–462 nm for Z,E′-EBI and at 452–467 nm for Z,Z′-EBI. The TDDFT calculated values further demonstrate the similarity in the spectral properties of the different isomers, predicting the same transition (S1→S8) with almost identical transient maxima, regardless of the solvent.
| Solvent | Compound | TA (transient absorption) | ||
|---|---|---|---|---|
| λ (nm) | f | S1→Sn | ||
| a For isoindigo data from ref. 25. | ||||
| THF | ISO | 588 | 0.030 | S1→S6 |
| 430 | 0.045 | S1→S7 | ||
| TFE | E,E′-EBI | 466 | 0.000 | S1→S7 |
| 445 | 0.611 | S1→S8 | ||
| MeOH | 465 | 0.000 | S1→S7 | |
| 445 | 0.613 | S1→S8 | ||
| DMSO | 468 | 0.000 | S1→S7 | |
| 456 | 0.598 | S1→S8 | ||
| THF | 477 | 0.001 | S1→S7 | |
| 462 | 0.574 | S1→S8 | ||
| TFE | Z,Z′-EBI | 457 | 0.000 | S1→S7 |
| 453 | 0.419 | S1→S8 | ||
| MeOH | 456 | 0.000 | S1→S7 | |
| 452 | 0.424 | S1→S8 | ||
| DMSO | 460 | 0.001 | S1→S7 | |
| 459 | 0.419 | S1→S8 | ||
| THF | 469 | 0.001 | S1→S7 | |
| 467 | 0.384 | S1→S8 | ||
| TFE | Z,E′-EBI | 459 | 0.187 | S1→S7 |
| 450 | 0.484 | S1→S8 | ||
| MeOH | 458 | 0.189 | S1→S7 | |
| 449 | 0.484 | S1→S8 | ||
| DMSO | 462 | 0.255 | S1→S7 | |
| 457 | 0.426 | S1→S8 | ||
| THF | 471 | 0.209 | S1→S7 | |
| 462 | 0.441 | S1→S8 | ||
Summarizing, (i) the spectral positions of the two ESA bands (∼480 nm) and the main ESA band (∼500 nm) are identical for the three EBI isomers; (ii) the S1 state decay (∼3–45 ps timescale) leads to the population of a vibrationally hot ground state, positive transient absorption signal at ∼470–520 nm, after 1 ps. Global lifetime analyses of the transient absorption data show the presence of two time constants describing the decay of the EBI isomers E,E′-EBI; Z,Z′-EBI and Z,E′-EBI, of the S1 excited state (∼450–800 fs and 3–45 ps); and (iii) kinetically, an increase in solvent polarity correlates with a decrease in lifetime (observed in the fs-TA experiments). The decay pathways are dependent on solvent polarity and (iv) in comparison with analogous compounds, for ISO, previous ultrafast studies reveal the fs-TA spectra show the excited singlet state absorption (ESA) positive bands in the 540–650 nm range with maxima at ∼580 nm that decays on a sub-picosecond scale (∼3–10 ps – single exponential decay laws, in different solvents), which corresponds to a vertically-excited nearly planar S1 state.25
Experimental
Materials and methods
Chemicals were purchased from Sigma-Aldrich, ABCR GmbH or TCI chemicals and used without further purification, unless described otherwise. All the solvents were of spectroscopic or equivalent grade and were used as received. All measured solutions were freshly prepared (within the day) unless noted otherwise. NMR spectra were recorded at room temperature in deuterated dimethyl sulfoxide (DMSO-d6) solutions on a Bruker Avance III operating at 400.1 MHz for 1H and 100.6 MHz for 13C. Chemical shifts are given in δ values (ppm) relative to TMS (1H) and coupling constants J are given in Hz. High-resolution mass-spectra (HRMS) was performed on a Bruker microTOF-Focus mass spectrometer equipped with an electrospray ionization time-of-flight source. Multiplicity is expressed as: s (singlet), d (doublet) and m (multiplet).Synthesis of 3,3′-(ethane-1,2-diylidene)bis(indolin-2-one) EBI (C18H12N2O2)
To a magnetically stirred solution of 2.00 g 2-oxindole (15.00 mmol) in 8 cm3 ethanol, 1.08 g glyoxal (40% w/w, 7.50 mmol) and 1 cm3 of concentrated hydrochloric acid were added and the mixture was heated for 6 h at reflux. After cooling, the mixture was filtered and the solid was washed with diethyl ether, ethyl acetate, and cold ethanol to give EBI. A red solid was obtained in 32% yield. HRMS(ESI): m/z = 289.0968 (found), 289.0977 (calculated for C18H13N2O2 [M+H]+). The three isomers were separated by HPLC (see the HPLC-DAD section for further details).(3E,3′E)-3,3′-(ethane-1,2-diylidene)bis(indolin-2-one), E,E′-EBI
1H-NMR (400.1 MHz, DMSO-d6): δ [ppm] = 6.92 (d, J = 7.6 Hz, 2H), 7.10 (t, J = 7.6 Hz, 2H), 7.34 (t, J = 7.6 Hz, 2H), 7.72 (d, J = 7.2 Hz, 2H), 7.79 (s, 2H), 10.74 (s, 2H)(3Z,3′Z)-3,3′-(ethane-1,2-diylidene)bis(indolin-2-one), Z,Z′-EBI
1H-NMR (400.1 MHz, DMSO-d6): δ [ppm] = 6.84 (d, J = 7.2 Hz, 2H), 7.01 (t, J = 7.6 Hz, 2H), 7.28 (t, J = 7.6 Hz, 2H), 7.52 (d, J = 7.6 Hz, 2H), 8.80 (s, 2H), 10.69 (s, 2H)(3Z,3′E)-3,3′-(ethane-1,2-diylidene)bis(indolin-2-one), Z,E′-EBI
1H-NMR (400.1 MHz, DMSO-d6): δ [ppm] = 6.84 (d, J = 8.0 Hz, 2H), 6.88 (t, J = 8.0 Hz, 1H), 7.01–7.04 (m, 2H), 7.28–7.31 (m, 2H), 8.01 (d, J = 7.2 Hz, 1H), 8.08 (d, J = 13.2 Hz, 1H), 8.65 (d, J = 7.6 Hz, 1H), 8.66 (d, J = 13.2 Hz, 1H), 10.60 (s, 1H), 10.68 (s, 1H)6,12-dihydrodibenzo[c,h][2,6]naphthyridine-5,11-dione (DBND)
TFA (4.7 mL, 60 mmol) was added dropwise to a cooled (0 °C) suspension of ISO (1 g, 2.39 mmol) and activated Zn dust (940 mg, 14.5 mmol) in THF solution (125 mL). The mixture was stirred at room temperature for 1 hour. Then the mixture was precipitated in a stirring H2O (500 mL). The white solid obtained was collected, washed with H2O and dried under reduced pressure. Since the obtained product could be easily oxidized back to ISO, it was directly used for the next step without further purification (1.03 g). A suspension of the white powder obtained (1 g, 2.38 mmol) in conc. HCl (10 mL) and THF (20 mL) was added to a Schlenk tube. The mixture was stirred for 10 hours at 100 °C. The mixture was then cooled down to r.t. and the precipitate was collected, washed with water, ethanol and ethyl acetate to give a white solid, which was used in the next step (609 mg, 61%). To the solution of the white solid obtained in the previous step in DMF (0.01 M) was added K2CO3 (4 equiv.). The suspension was stirred for 48 hours with air bubbling into the system. The yellow solid DBND obtained was filtered and washed with water and THF before drying under reduced pressure. DBND is insoluble in non-polar and moderately polar solvents. Because of the low solubility of DBND in the conventional organic solvents, it was difficult to get the high-quality 13C-NMR spectra. 1H-NMR (400.1 MHz, DMSO-d6): δ [ppm] = 6.88 (d, J = 7.8 Hz, 2H), 6.98 (td, J = 7.5 Hz, 1.0 Hz, 2H), 7.25–7.16 (m, 4H), 10.43 (s, 2H). 13C-NMR (101.6 MHz, DMSO-d6): δ [ppm] = 115.6, 120.7, 122.5, 128.6, 129.7, 138.0, 168.6.HPLC-DAD
The HPLC-DAD system used a Merck Purospher® STAR RP-18 endcapped (5 μm) stationary phase column, an L-2130 pump and an L-2200 autosampler. For HPLC separations, solvents consisting of water (solvent A) and methanol, MeOH (solvent B), both containing 0.2% TFA, were used. Water and methanol were deaerated in an ultrasonic bath before use. Different isocratic elution conditions were adopted to separate three fractions. Gradient elution steps were as follows: 0–10 min: 85% A/15% B to 75% A/25% B; 10–30 min: 75% A/25% B to 30% A to 70% B; 30–50 min: 30% A/70% B; 50–60 min: 30% A/70% B to 85% A/15% B. A flow rate of 0.85 mL min−1 with the column temperature set at 60 °C was used, and 20 μL of the sample was injected and the peak elution was monitored at 280 nm. Percentage of total chromatogram integration at 60 °C, and retention times 13.6 min (peak I), 15.5 min (peak II) and 16.6 min (peak III) is 25%, 37% and 38%, respectively.Photophysical measurements
For the photophysical experiments, all solvents used were of spectroscopic or equivalent grade. All measured solutions were freshly prepared (within the day) unless noted otherwise. Absorption spectra were obtained in a 10 mm quartz cuvette in different organic solvents, at room temperature, on a Shimadzu UV-2600 spectrophotometer. Fluorescence spectroscopic studies were performed using a Horiba-Jobin-Yvon Fluorolog 3.22. All spectra were recorded using a 10 mm path length quartz cuvette at room temperature. Fluorescence spectra were corrected for the wavelength response of the system with the appropriate correction files obtained for the instrument. The fluorescence quantum yields (ϕF) of the DBND compound, in solution, were measured using anthracene as the standard (ϕF = 0.27 in ethanol).38Time-resolved photoluminescence spectroscopy
Time-resolved photoluminescence measurements were recorded on a FLS1000 photoluminescence spectrometer through the time-correlated single photon counting (TCSPC) technique coupled with a picosecond pulsed supercontinuum white light laser (SuperK, repetition rate: 9.8 MHz, NKT Photonics) and a microchannel plate (MCP-900) detector in cooled housing in the spectral range from 200 to 850 nm and in the picosecond domain. The fluorescence decay curves were deconvoluted using the experimental instrument response function signal collected with a scattering solution (aqueous Ludox solution). The IRF is about 150 ps for all excitations used in our setup. All spectra were recorded using a 1 cm path length quartz cuvette at room temperature.Femtosecond transient absorption (fs-TA)
The experimental setup used for ultrafast spectroscopic and kinetic measurements was described elsewhere37 and consists of a broadband (350–1600 nm) HELIOS pump–probe femtosecond transient absorption spectrometer from Ultrafast Systems, equipped with an amplified femtosecond Spectra-Physics Solstice-100F laser (800 nm central wavelength displaying a pulse width of 128 fs at a 1 kHz repetition rate) coupled with a Spectra-Physics TOPAS Prime F optical parametric amplifier (195–22000 nm) for pulse pump generation. Probe light in the UV range was generated by passing a small portion of the 800 nm light from the Solstice-100F laser through a computerized optical delay (with a time window up to 8 ns) and focusing on a vertical translating CaF2 crystal to generate white-light continuum (350–750 nm). All measurements were obtained in a 2 mm quartz cuvette with absorption lower than 0.4 at the pump excitation wavelength. The instrumental response function of the system was assumed to be equal to that of the pump–probe cross correlation determined from the measurement of the instantaneous stimulated Raman signal from the pure solvent (in a 2 mm cuvette). Typical values for the IRF of the system were found to be better than 250 fs. To avoid photodegradation the solutions were stirred during the experiments or in movement using a motorized translating sample holder. The spectral chirp of the data was corrected using the Surface Xplorer PRO program from Ultrafast Systems. Global analysis (GA) of the data (using a sequential model) was performed after single value decomposition using Glotaran software. The transient absorption kinetic data were analyzed using both a single-analysis (wavelength) fit and a global analysis fit. An exponential decay function convoluted with a Gaussian instrumental response function was used in both analyses.
TDDFT calculations
All theoretical calculations were of the density functional theory (DFT) type and carried out using GAMESS-US version R3.39 A range corrected LC-BPBE (ω = 0.20 au−1) functional, as implemented in GAMESS-US,39 was used in both ground and excited-state calculations. TDDFT calculations, with similar functionals, were used to probe the excited-state potential energy surface (PES). A solvent was included using the polarizable continuum model with the solvation model density to add corrections for cavitation, dispersion, and the solvent structure. In TDDFT calculation of Franck–Condon excitations, the dielectric constant of the solvent was split into a “bulk” component and a fast component, which is essentially the square of the refractive index. Under “adiabatic” conditions, only the static dielectric constant was used. A 6-31G** basis set was used in either DFT or TDDFT calculations. The results obtained with the LC-BPBE(20) functional are essentially unscaled raw data from calculations; for the S0→Sn transitions, a small correction, which results in the subtraction of 0.05 eV, to account for the difference between the zero point and the first vibronic level, was considered. For the resulting optimized geometries, time dependent DFT calculations (using the same functional and basis set as those in the previously calculations) were performed to predict the vertical electronic excitation energies. Ground state optimized geometry structures, and relevant HOMO and LUMO energy levels, together with the electronic transitions (obtained by time dependent DFT, TDDFT), were calculated with the same level of theory, DFT//LC-BPBE (ω = 0.2), and compared to the experimental data. Frequency analyses of each compound were also carried out and no imaginary frequencies were observed, thus indicating that the structure of each molecule corresponds to, at least, a local minimum on the potential energy surface. Molecular orbital contours were plotted using the ChemCraft 1.7 program. The UV-vis spectra of the three structures considered, E,E′-EBI, Z,Z′-EBI and Z,E′-EBI, have been calculated using time-dependent density functional theory (TDDFT) for the ground state equilibrium geometries, using the same exchange correlation functionals and basis sets as those used for the geometry optimisation.Conclusions
Three isomers of the 3,3′-(ethane-1,2-diylidene)bis(indolin-2-one), E,E′-EBI, Z,E′-EBI and Z,Z′-EBI, isoindigo derivative were separated with HPLC and studied with spectroscopic methods including femtosecond transient absorption spectroscopy (fs-TA). The photophysical properties of these geometrical isomers are found to be different in comparison with their analogous compound – isoindigo (ISO). Transient absorption studies showed that the transient absorption maximum is red-shifted and the lifetime of the S1 state of the three isomers is longer in non-polar solvents compared to that of ISO. In contrast, the lifetimes in polar solvents are considerably closer. On the other hand, the molecular conformation of the three isomers studied individually has a negligible effect on the lifetime and maximum transient absorption, regardless of solvent polarity. EBI isomer molecules generated after relaxation of the excited state are described by a two lifetime distribution at ∼450–800 fs: (i) with a negative amplitude at ∼480 nm, accounting for the recovery of the GSB; (ii) with a positive amplitude at ∼510 nm, accounting for the decay of the absorption of the molecules. The flexible structure of EBI in the excited state (independently of the different isomeric structure) allows an efficient radiationless decay, while DBND, rigid and aromatic, efficiently deactivates through a radiative channel.Author contributions
CC performed the synthesis of the compounds, performed all the experimental work and part of the theoretical calculations. Marta Pineiro contributed to the interpretation of the experimental data. JSSM contributed to funding acquisition, supervision, conception, design of the study and writing of the article.Data availability
The data supporting this article have been included as part of the ESI.† Other files are available upon reasonable request.Conflicts of interest
The authors declare no competing financial interest.Acknowledgements
We acknowledge funding from FEDER (Fundo Europeu de Desenvolvimento Regional) through COMPETE (Programa Operacional Factores de Competitividade). The Coimbra Chemistry Centre – Institute of Molecular Sciences (CQC-IMS) is supported by the Fundação para a Ciência e a Tecnologia (FCT), Portuguese Agency for Scientific Re-search, through Projects UIDB/00313/2025 and UIDP/00313/2025. NMR data collected at the UC-NMR facility are supported in part by the EDRF through the COMPETE Program and by national funds from the FCT through grants RECI/QEQ-QFI/0168/2012 and CENTRO-07-CT62-FEDER-002012, and also through support to Rede Nacional de Ressonância Magnética Nuclear (RNRMN) and to Coimbra Chemistry Centre through grant UID/QUI/00313/2019. C. C. thanks FCT for a PhD Grant (2020.09661.BD). Dr João Pina is acknowledged for the technical help in the fs-TA measurements. Dra. Susana M. M. Lopes is acknowledged for the technical help in the NMR preparations.References
- A. V. Bogdanov and V. F. Mironov, Beilstein J. Org. Chem., 2021, 17, 1533–1564 CrossRef CAS PubMed.
- K. C. Ranjeesh, A. Rezk, J. I. Martinez, S. Gaber, A. Merhi, T. Skorjanc, M. Finšgar, G. E. Luckachan, A. Trabolsi and B. R. Kaafarani, Adv. Sci., 2023, 10, 2303562 CrossRef CAS PubMed.
- M. Yang, X. Chen, Y. Zou, C. Pan, B. Liu and H. Zhong, J. Mater. Sci., 2013, 48, 1014–1020 CrossRef CAS.
- G. Khalili, A. C. Willis and P. A. Keller, Monatsh. Chem., 2018, 149, 2103–2111 CrossRef CAS.
- X. Cheng, Y. Ma, X. Ju, W. Zhao, J. Zhao, Q. Li, Z. Sang, H. Du and Y. Zhang, Synth. Met., 2020, 270, 116589 CrossRef CAS.
- P. Deng and Q. Zhang, Polym. Chem., 2014, 5, 3298–3305 RSC.
- J. L. Li, J. J. Cao, L. L. Duan and H. L. Zhang, Asian J. Org. Chem., 2018, 7, 2147–2160 CrossRef CAS.
- S. Li, L. Ma, C. Hu, P. Deng, Y. Wu, X. Zhan, Y. Liu and Q. Zhang, Dyes Pigm., 2014, 109, 200–205 CrossRef CAS.
- A. Facchetti, Chem. Mater., 2011, 23, 733–758 CrossRef CAS.
- S. M. Vijayan, N. Sparks, J. K. Roy, C. Smith, C. Tate, N. I. Hammer, J. Leszczynski and D. L. Watkins, J. Phys. Chem. A, 2020, 124, 10777–10786 CrossRef CAS PubMed.
- C. Cunha and J. Sérgio Seixas de Melo, in Photochemistry: Volume 51, ed. S. Crespi and S. Protti, Royal Society of Chemistry, 2023 10.1039/BK9781837672301-00045.
- H. Dinçalp, G. M. Saltan, C. Zafer and A. Mutlu, Spectrochim. Acta, Part A, 2018, 202, 196–206 CrossRef PubMed.
- Z. Ma, E. Wang, K. Vandewal, M. R. Andersson and F. Zhang, Appl. Phys. Lett., 2011, 99, 143302 CrossRef.
- M. Liu, S. Qiu, Y. Ye and G. Yin, Tetrahedron Lett., 2016, 57, 5856–5858 CrossRef CAS.
- G. Zhang, Y. Dai, Y. Liu, J. Liu, H. Lu, L. Qiu and K. Cho, Polym. Chem., 2017, 8, 3448–3456 RSC.
- R. Stalder, J. Mei, K. R. Graham, L. A. Estrada and J. R. Reynolds, Chem. Mater., 2014, 26, 664–678 CrossRef CAS.
- E. H. Jung, H. Ahn, W. H. Jo, J. W. Jo and J. W. Jung, Dyes Pigm., 2019, 161, 113–118 CrossRef CAS.
- A. V. Bogdanov, L. I. Musin and V. F. Mironov, ARKIVOC: Online J. Org. Chem., 2015, 2015, 362–392 CrossRef.
- E. Wang, W. Mammo and M. R. Andersson, Adv. Mater., 2014, 26, 1801–1826 CrossRef CAS PubMed.
- T. Lei, J.-Y. Wang and J. Pei, Acc. Chem. Res., 2014, 47, 1117–1126 CrossRef CAS PubMed.
- B. P. Charron, M. U. Ocheje, M. Selivanova, A. D. Hendsbee, Y. Li and S. Rondeau-Gagné, J. Mater. Chem. C, 2018, 6, 12070–12078 RSC.
- H. Gu, S. Ming, K. Lin, S. Chen, X. Liu, B. Lu and J. Xu, Electrochim. Acta, 2018, 260, 772–782 CrossRef CAS.
- H. Patil, J. Chang, A. Gupta, A. Bilic, J. Wu, P. Sonar and S. V. Bhosale, Molecules, 2015, 20, 17362–17377 CrossRef CAS PubMed.
- H.-H. Cho, G. Han, R. Younts, W. Lee, B. R. Gautam, S. Lee, C. Lee, T. Kim, F. S. Kim and K. Gundogdu, J. Mater. Chem. A, 2017, 5, 21291–21299 RSC.
- C. Cunha and J. S. Seixas de Melo, Dyes Pigm., 2024, 229, 112307 CrossRef CAS.
- D. C. Nobre, E. Delgado-Pinar, C. Cunha, A. M. Galvão and J. S. Seixas de Melo, Dyes Pigm., 2023, 212, 111116 CrossRef CAS.
- J. S. Seixas de Melo, in Photochemistry: Volume 49, The Royal Society of Chemistry, 2022, vol. 49, pp. 31–52 Search PubMed.
- D. Pinheiro, M. Pineiro, A. M. Galvão and J. S. Seixas de Melo, Chem. Sci., 2021, 12, 303–313 RSC.
- J. S. Seixas de Melo, in Photochemistry, ed. A. Albini and S. Protti, The Royal Society of Chemistry, London, 2020, vol. 47, pp. 196–216 Search PubMed.
- J. S. Seixas de Melo, in Photochemistry, ed. A. Albini, E. Fasani and S. Protti, The Royal Society of Chemistry, London, 2018, vol. 45, pp. 68–100 Search PubMed.
- J. Pina, D. Sarmento, M. Accoto, P. L. Gentili, L. Vaccaro, A. Galvão and J. S. Seixas de Melo, J. Phys. Chem. B, 2017, 121, 2308–2318 CrossRef CAS PubMed.
- S. Yamazaki and K. Banno, J. Phys. Chem. A, 2024, 128(31), 6351–6361 CrossRef CAS PubMed.
- D. Pinheiro, C. Cunha, M. Pineiro, A. M. Galvão and J. S. Seixas de Melo, Phys. Chem. Chem. Phys., 2024, 26, 28046–28054 RSC.
- S. Chen, B. Sun, C. Guo, W. Hong, Y. Meng and Y. Li, Chem. Commun., 2014, 50, 6509–6512 RSC.
- M. Cai, X. Bao, X. Wang, H. Zhang, M. Qiu, R. Yang, C. Yang and X. Wan, Chem. Mater., 2016, 28, 6196–6206 CrossRef CAS.
- C. Papageorgiou and X. Borer, Helv. Chim. Acta, 1988, 71, 1079–1083 CrossRef CAS.
- J. Pina, M.-J. Queiroz and J. Seixas de Melo, Photochem. Photobiol. Sci., 2016, 15, 1029–1038 CrossRef CAS PubMed.
- J. Seixas de Melo, A. Moura and M. Melo, J. Phys. Chem. A, 2004, 108, 6975–6981 CrossRef CAS.
- M. W. Schmidt, K. K. Baldridge, J. A. Boatz, S. T. Elbert, M. S. Gordon, J. H. Jensen, S. Koseki, N. Matsunaga, K. A. Nguyen and S. Su, J. Comput. Chem., 1993, 14, 1347–1363 CrossRef CAS.
Footnote |
| † Electronic supplementary information (ESI) available. See DOI: https://doi.org/10.1039/d5cp00148j |
| This journal is © the Owner Societies 2025 |