
 Open Access Article
 This Open Access Article is licensed under a
 Creative Commons Attribution 3.0 Unported Licence
Control of circular dichroism in ion yield of 3-methyl cyclopentanone with femtosecond laser pulses
Sagnik
Das
 *a,
Jayanta
Ghosh
ab,
Sudheendran
Vasudevan
a,
Simon T.
Ranecky
a,
Tonio
Rosen
a,
Nicolas
Ladda
a,
Han-gyeol
Lee
a,
Till-Jakob
Stehling
a,
Fabian
Westmeier
a,
Jochen
Mikosch
a,
Arne
Senftleben
a,
Thomas
Baumert
a and
Hendrike
Braun
*a
*a,
Jayanta
Ghosh
ab,
Sudheendran
Vasudevan
a,
Simon T.
Ranecky
a,
Tonio
Rosen
a,
Nicolas
Ladda
a,
Han-gyeol
Lee
a,
Till-Jakob
Stehling
a,
Fabian
Westmeier
a,
Jochen
Mikosch
a,
Arne
Senftleben
a,
Thomas
Baumert
a and
Hendrike
Braun
*a
aUniversität Kassel, Institut für Physik, Heinrich-Plett-Str. 40, 34132 Kassel, Germany. E-mail: sagnikd@uni-kassel.de; braun@physik.uni-kassel.de
bElettra – Sincrotrone Trieste S.C.P.A., Strada Statale 14, 34149 Basovizza, Trieste, Italy
First published on 21st February 2025
Abstract
Circular dichroism (CD) in ion yield in the gas phase is a promising chiral recognition technique. Combining it with broadband ultrafast laser pulses allows us to examine the possibility of coherent control. We used shaped femtosecond laser pulses to control the CD in ion yield of 3-methylcyclopentanone observed from a 1 + 1 + 1 resonance-enhanced multiphoton ionisation around 309![[thin space (1/6-em)]](https://www.rsc.org/images/entities/char_2009.gif) nm. The duration of the pulses is increased via their spectral width or a frequency chirp, and a pulse pair with adjustable delay is employed to study the effect on the CD in ion yield. Furthermore, we used strongly chirped pulses of different central wavelengths to control the observed anisotropy. A clear enhancement of the anisotropy can be achieved, and possible mechanisms are discussed.
nm. The duration of the pulses is increased via their spectral width or a frequency chirp, and a pulse pair with adjustable delay is employed to study the effect on the CD in ion yield. Furthermore, we used strongly chirped pulses of different central wavelengths to control the observed anisotropy. A clear enhancement of the anisotropy can be achieved, and possible mechanisms are discussed.
1 Introduction
Chirality, the property of an object by which it can exist in two forms, called enantiomers, which are non-superimposable mirror images of each other, is ever present in everyday life. For example, our hands, the shell of a snail, or, very often, the molecular structure of medicines are chiral. The handedness of biomolecules is crucial as it dictates their interaction with other chiral molecules. For instance, all chiral amino acids occur naturally only in the left-handed configuration. This homochirality of life is still not fully understood.1 Identification and purification of the two enantiomers of a chiral substance is an active research field. In this regard, control over and enhancement of chiral signatures is an important endeavor.There are many ways of differentiating between the two enantiomers of a chiral molecule, such as cavity-enhanced polarimetry with a Fabry–Perot interferometer,2 cavity ring down spectroscopy,3 photoelectron circular dichroism (PECD),4,5 and microwave three-wave mixing.6 Optical activity7 can be observed when linearly-polarised light passes through a chiral material, and the polarisation is rotated due to the interaction of the light with the material. The difference in absorption of left and right circularly polarised light with a chiral molecule is known as the circular dichroism (CD).8 CD in absorption is a well-established technique in the liquid and gas phase.9
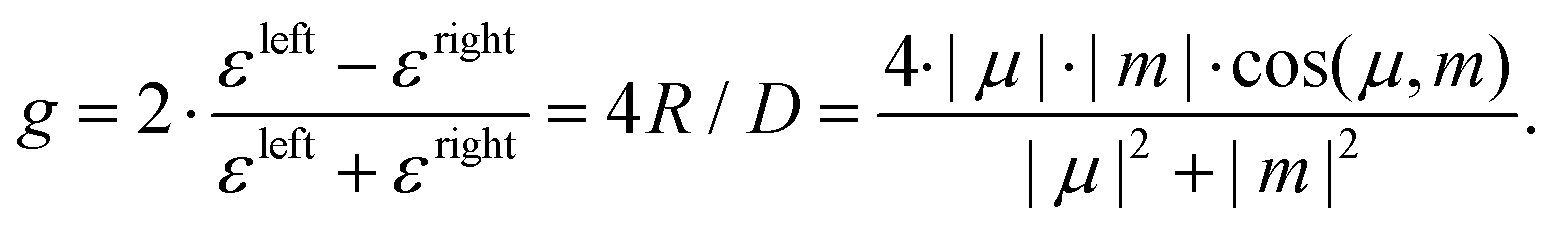
Differential absorption of left and right circularly polarised light or the CD arises due to the interplay of electric and magnetic transition dipole moments μ and m. In absorption spectroscopy, the CD is often specified by the anisotropy factor g, calculated as the difference of the extinction coefficients ε for the two helicities left and right (εleft/right), as the ratio of the rotatory strength R and the dipole strength D, or from the transition moments μ and m:8,10
 | (1) |
CD is generally a very weak effect on the order of few or less than one percent. For electric dipole allowed transitions, the electric dipole transition moment is much larger than the magnetic transition dipole moment. Hence, the resulting anisotropy g is very small, as seen from eqn (1). The electric and magnetic dipole moments are often perpendicular, making the cosine very small, resulting in small anisotropies. For some electric dipole forbidden transitions, like the π* ← n transition in carbonyl chromophores, the electric and magnetic dipole transition moments are of the same order of magnitude, giving rise to strong CD signals. Even then, the effect is in the few percent regime and thus requires a very robust setup to detect.
Over the last years, CD measurements using nanosecond laser pulses were combined with mass spectrometry measurements to observe CD in the ion yield (CDIY) of chiral molecules.11,12 In these experiments, the chiral molecule is ionised via a resonant intermediate state by REMPI (resonance-enhanced multiphoton ionisation). The ion yield from left or right circularly polarised light Ileft/right is evaluated to calculate the g-value:
 | (2) |
The ion yield due to left and right circularly polarised light from a given molecule can, for example, be measured via time-of-flight mass spectrometry. It has the advantage that the CD can be evaluated on any selected mass. Hence, fragments of chiral molecules or mixtures of different molecular samples can be analysed. In addition, as a gas phase measurement technique, it requires very small amounts of sample compared to the liquid phase and circumvents solvent interaction effects. Using nanosecond lasers, the vibrational mode dependence of vibronic CD bands and their conformation-selectivity are accessible.13,14 CDIY can also be measured in coincidence with PECD.15 In many cases, the CD of the fragment ions has been reported, for example, for methyl oxirane at 810 nm.16 Recently, for femtosecond laser pulses centered at 800 nm, not only CD of fragments and the parent ions but also their dependence on the angle of emission was observed in bromochlorofluoromethane and methyl oxirane.17
While nanosecond laser sources have high spectral resolution, femtosecond laser sources, on the other hand, offer the possibility of spectral shaping. Such schemes potentially allow to exert coherent control over atomic or molecular processes. Coherent control uses tailored light fields to induce and control intramolecular dynamics such as electronic or nuclear coherences (ref. 18 and 19 and references therein). Coherent control of the ion yield with the help of feedback-optimized laser pulses was demonstrated already in 1998.20 Physically motivated pulse shapes are the basis of quantum control spectroscopy (e.g.21) and are currently used to discriminate between strong-field molecular ionisation pathways,22 for charge oscillation controlled molecular excitation in K2,23,24 to study laser-driven molecular fragmentation25 and adiabatic excitation schemes on atoms26,27 and molecules.28 However, coherent control of circular dichroism in ion yield has not been fully explored.
A suitable molecule for coherent control studies of CDIY is the cyclic ketone 3-methyl cyclopentanone (3-MCP). It has been studied extensively for its large value of circular dichroism in the π* ← n transition.29,30 CDIY as an experimental technique was demonstrated for the first time in this molecule.11,12 The π* ← n absorption band in 3-MCP extends from around 250 nm to 330 nm. In this wavelength range, the C![[double bond, length as m-dash]](https://www.rsc.org/images/entities/char_e001.gif) O stretching mode gives rise to four distinct absorption maxima [figure IV-1 in ref. 31,32] that also appear as peaks in the absorption CD spectra.29
O stretching mode gives rise to four distinct absorption maxima [figure IV-1 in ref. 31,32] that also appear as peaks in the absorption CD spectra.29
Several CDIY studies on 3-MCP have been performed using both nanosecond and femtosecond laser sources. For example, in,10 a correlation between the linear CD in absorption of an intermediate state and the CD in ion yield is reported. In addition, they observed a subsequent transition to an intermediate bound (Rydberg) state that led to an enhancement of the CD value from 22% to 27%.33 In general, CD in ion yield strongly depends on the wavelength. Breunig et al.30 reported a CD in ion yield with femtosecond pulses with 3-MCP at 311 nm of 10%. At 324 nm the reported CDIY with femtosecond pulses was 2%.
In this work, we investigate how the CDIY of 3-MCP can be controlled via shaped ultraviolet femtosecond laser pulses. We chose the π* ← n band near 310 nm (32245 cm−1), as it has shown a high anisotropy in several previous studies with femtosecond laser pulses.34,35 Specifically, we employ double pulses with adjustable time delay, pulses of varying duration, linearly chirped laser pulses, and pulses of different central wavelengths to drive the 1 + 1 + 1 REMPI process in 3-MCP. We analyse their capability to control the neutral enantiomer's two-photon absorption and the resulting measured anisotropy.
First, we will introduce our self-referencing setup, including the optical components and the Time-of-Flight (ToF) spectrometer. Next, we will present the anisotropy measurements using the different laser pulses. We will then discuss the pulses' effect on the observed CDIY and possible explanations.
2 Experimental setup
The basic experimental setup has been introduced in detail elsewhere.35 The complete experimental setup is depicted in Fig. 1(a), including three dedicated optical beam paths for the different experiments. In short, it consists of titanium: sapphire-based femtosecond laser (Femtopower HE, Femtolasers) that pumps an optical parametric amplifier (OPA) with integrated frequency doubling/mixing stages (TOPAS, Light Conversion) to obtain UV pulses that are focused with the twin peak setup (discussed below) into a ToF spectrometer, where they interact with the molecular sample introduced via an effusive inlet. The output of the OPA is either directly set to the desired UV wavelength, spectra shown in Fig. 1(b), or it is set to ∼618nm and frequency doubled to the desired UV wavelength using β-BBO crystals of various thicknesses, spectra shown in Fig. 1(c).
 | ||
| Fig. 1 (a) Experimental setup consisting of femtosecond laser system, optical parametric amplifier (OPA), prism compressor (P1 and P2), beam splitter (BS), barium borate crystal (β-BBO), neutral density filter (ND), half-wave plate (HWP), Wollaston prism (WP), quarter-wave plate (QWP) and focusing lens (L). The beams are focused in the time of flight mass spectrometer (ToF-MS), consisting of the repeller (R), extractor (E), and ground (G) electrodes to detect the ions on the microchannel plate (MCP) detector. The three beam paths provide the laser pulses for the control experiments: (i) linearly chirped pulses, (ii) two pulses with adjustable time delay for pulse-pair measurements, (iii) pulses with different duration by using BBO crystals of varying thicknesses, (b) OPA output spectra centered at 308.8 nm (blue), 309.9 nm (orange) and 310.9 nm (green) central wavelength. The central wavelength is determined by Gaussian fitting. In the text, the spectra are referred to by rounding the central wavelength to 309 nm, 310 nm, and 311 nm, respectively, (c) frequency-doubled spectrum of 618 nm OPA output, using β-BBO crystals of various thickness (1 mm to 5 mm). The corresponding bandwidth-limited pulse duration of each spectrum is given in the legend. | ||
A novel twin peak setup, introduced in ref. 35 is used to simultaneously produce spatially displaced foci with left- and right-circularly polarised light in the interaction region. It consists of a half-wave plate (λ/2 300–470 nm, B. Halle), a Wollaston prism (Wollaston Div 10, B. Halle) and a quarter-wave plate (λ/4 300–470 nm, B. Halle). This combination can produce two beams of opposite helicity that are then focused (f = +30 cm lens) into the ToF spectrometer. Molecules ionised in the two foci, displaced along the ToF axis, result in slightly different flight times for equal mass-to-charge ratios. The peak intensity at each focus is estimated as ∼0.5 to 2 × 10¹² W cm−2 at 3 kHz repetition rate of the laser system. The anisotropy, as defined by eqn (2), can, in principle, be quantified in the twin peak setup for each laser shot. This is achieved by simultaneously measuring the ion yield from both left and right circularly polarised light in the mass spectrum. The anisotropy calculation using data from the twin peak setup including the use of a reference substance is described in detail in the SI of ref. 35. The twin peak measurement technique reduces the statistical error of the determined anisotropy as it accounts for shot-to-shot laser fluctuations and fluctuations in the target density. Additionally, both beams have equal residual chirp compensation.
To perform the experiments reported here, one out of the three beam paths (i), (ii), or (iii) in Fig. 1 was used at a time.
• In path (i) of the experimental setup, the linear chirp of the laser pulses can be introduced using the double-pass prism compressor. The group delay dispersion (GDD) can be adjusted such that in the foci of the twin peak setup, the laser pulses show positive or negative chirp or are bandwidth-limited (BWL). Prism P2 of the prism compressor is placed on a translation stage that can be moved to adjust the chirp by introducing less (negative chirp) or more (positive chirp) amount of glass while leaving the angle of incidence unchanged. The amount of chirp is calculated from the amount of glass (prism) introduced via P2 in the beam path. In our experiment, the position xbwl of P2 to generate the BWL pulse for a given wavelength is obtained by maximizing the ionisation signal of potassium in the ToF spectrometer. Then, the GDD at position x on the prism is calculated as:
 | (3) |
• Path (ii) comprises a Michelson interferometer for pulse-pair experiments. It was used with the prism compressor to ensure BWL pulses in the foci. Maximum overlap of pump and probe, i.e. zero delay was determined in a delay scan on potassium. In experiments with paths (i) and (ii), the central wavelength was scanned between 307 nm and 314 nm using the OPA.
• For path (iii), the OPA output is tuned to ∼618 nm and frequency-doubled to 309 nm using different β-BBO crystals. The frequency-doubled pulses’ bandwidth (hence pulse duration) is changed using BBO crystals of different thicknesses. Due to the small bandwidth of the frequency-doubled pulses, the minimal amount of dispersive material after the BBO crystal does not significantly change the pulse duration. From the bandwidth of the pulses, we estimated the pulse duration, shown in Fig. 1(c).
A dispenser in the spectrometer chamber provides potassium atoms as an achiral reference target. The potassium signal is recorded simultaneously with the sample time-of-flight spectra. The ionisation of the potassium atoms is also used to determine xbwl of prism P2, for which BWL compression is achieved by maximising its ionisation yield. Minor anisotropies measured for the achiral reference arise from systematic error and were removed from the sample's anisotropy. A pure sample (R)-(+)-3-MCP or (S)-(−)-3-MCP is introduced into the spectrometer through a nozzle with a diameter of 100 μm which is placed, without differential pumping, about 7 cm away from the interaction region. With the sample in the chamber, the pressure is ∼3 × 10⁻⁶ mbar.
The voltages on the electrodes (extractor and repeller) in the ToF spectrometer are deliberately detuned from the Wiley–McLaren configuration37 such that, with the twin peak setup, ions with the same m/z-ratio from the two foci have distinct flight times. As all ions are from singly ionised species, we obtain double peaks for each mass in the time-of-flight ion spectra (see Fig. 2), one produced by left and the other by right circularly polarised light. The helicity of the two foci flips with a 90° rotation of the quarter-wave plate (QWP). The ion signal on the micro-channel plate detector (APTOF-40 Photonis) is averaged for 2560 laser shots on an oscilloscope (Waverunner 640Zi) to obtain a ToF spectrum with a high signal-to-noise ratio. After each obtained spectrum, the QWP is rotated to flip the helicity of the two foci to correct for any systematic deviation between the two foci. The reported anisotropy of the measurements, as shown in Fig. 4–8, is the average anisotropy of 250 spectra, and the 3σ error is reported as the measurement error. All reported anisotropies in this work are on the parent mass at 98 amu. Further information on the data evaluation can be found in ref. 35.
 | ||
| Fig. 2 Example mass spectrum arising from the twin peak technique for (S)-3-MCP with 309 nm femtosecond laser pulses, averaged over all rotations (45° and 135°) of the quarter-wave plate. Peaks at 98 m/z corresponding to the lower and upper focus are highlighted in green and orange. The highlighted signals originate from the 3-MCP parent mass. The most prominent fragments of 3-MCP are observed at m/z = 69 and m/z = 55. The signals at m/z = 39 and m/z = 41 stem from potassium. | ||
The (R)-enantiomer of 3-MCP (99% substance purity) was obtained from Sigma Aldrich. The (S)-enantiomer (95% substance purity) was custom-produced by Chemspace. Both enantiomers were used without further purification. 3-MCP mainly exists as two conformers, equatorial and axial. It has been previously established that the two conformers exhibit opposite circular dichroism.38 The relative abundance of the two conformers is temperature-dependent.12 At room temperature, the equatorial conformer dominates over the axial. Various methods have estimated its relative abundance to the range of 70:30 to 90:10.39–41 Due to the low backing pressure, we do not expect a significant cooling of the molecular sample upon expansion into the vacuum chamber. All reported anisotropies are hence weighted averages for the equatorial and axial conformers at near room temperature.
3 Results
In 3-MCP, a 1 + 1 + 1 REMPI process takes place for irradiation with λ = 309 nm photons from the ground state via the π* and a Rydberg state to the ionisation continuum. The ionisation scheme is shown in Fig. 3(a). | ||
| Fig. 3 (a) Simplified ionisation scheme of 3-MCP at 309 nm, (b) molecular structure of (R)-(+)-3-MCP and (S)-(−)-3-MCP. | ||
As a first attempt to control the CD in ion yield, we studied its pulse duration dependence for (R)-(+)-3-MCP at 309 nm. We increased the pulse duration in two different ways: (a) by introducing linear chirp, both positive and negative, and (b) by reducing the spectral bandwidth by frequency-doubling in BBO crystals of different thicknesses (resulting spectra displayed in Fig. 1(c)). The pulse energy was fixed in each pulse duration scan (positive chirp, negative chirp, and BBO crystals), resulting in different intensities. The results of these pulse duration scans are shown in Fig. 4. In general, increasing the pulse duration enhances the CDIY, imitating the results by Horsch et al.,42 who changed the pulse duration by chirping the laser pulses. Even though the excitation wavelengths are slightly different in the two experiments, the anisotropy is similar in magnitude. However, we do not observe a stabilization of the anisotropy after a specific pulse duration like in the previous experiment.42 In our experiments, the enhancement is similar for the two different techniques employed to increase the pulse duration (introducing GDD, both positive and negative, or narrowing the spectrum). The differences between positive and negative chirp have been studied thoroughly in the following experiments.
 | ||
| Fig. 4 Left: CDIY-dependence on increasing pulse duration, introduced by positive chirp (downward triangles), negative chirp (circles), and different BBO crystals (orange diamonds). The amount of GDD for the chirped datapoints is represented by their color. Right: CDIY with BWL pulse pairs as a function of inter-pulse delay (black squares). All measurements were performed at a central wavelength of 309 nm. | ||
Plotted along with the pulse duration scans in Fig. 4 is the pulse-pair CDIY scan performed on (R)-(+)-3-MCP at 309 nm. For this data set, the x-axis refers to the inter-pulse delay and reaches up to 1333 fs. In the pulse-pair experiment, the energies of the pump and the probe pulses were adjusted to be equal and non-ionising on their own. The pulse duration of the pump and probe pulse is estimated to be equal and BWL (∼40 fs). An increase in anisotropy from 4% to 6% can be observed for increasing delays up to ∼350 fs. After that, the anisotropy stabilizes at 6% for delays up to 1.2 ps. In the region where the anisotropy increases in the pulse pair experiment, it mimics the pulse duration scans. There is a marked difference from 350 fs onwards, for which the anisotropy increases further with increasing pulse duration but does not increase with increasing inter-pulse delay.
In the next series of measurements, we investigated the role of peak intensity for the CDIY. The pulse energy was kept constant in the chirped pulse measurements presented in Fig. 4. Hence, the peak intensity is reduced for increasing pulse duration. Peak intensity effects on CDIY for 3-MCP have previously been observed for nanosecond pulses. Due to saturation effects, the anisotropy decreased with increasing peak intensity for some excitations33 at 324 nm. In the case of femtosecond laser ionisation, the pulse energies are much lower, and saturation effects do not play a role. We performed peak intensity scans using BWL pulses to disentangle the effects of reduced peak intensity and longer pulse duration onto the CDIY. For comparison, the CDIY of chirped and BWL pulses as a function of peak intensity is plotted in Fig. 5. The data points from chirped-pulse excitation are the same as in Fig. 4. No significant change in the anisotropy can be observed for the BWL pulses of varying peak intensity. Linear regressions of all six datasets, i.e., BWL, positively and negatively chirped pulses for both R and S enantiomers, are shown in the same plot. The linear fits of the positively and negatively chirped pulses are not flat for both enantiomers. The slope of the linear fit for the positive chirp (blue dashed lines) is larger than the slope of the linear fit for the negative chirp (red solid lines) for both enantiomers. In contrast, fits for the BWL pulses feature no slope (black dotted lines). Hence, we do not attribute the observed enhancement/control of CDIY due to pulse duration to the change in peak intensity of the chirped laser pulses.
 | ||
| Fig. 5 Peak intensity scans at 309 nm central wavelength with BWL pulses (left and right pointed triangles), positively chirped pulses (downward and upward pointed triangles), and negatively chirped pulses (circle and pentagon) on (R)-(+)-3-MCP and (S)-(−)-3-MCP. For the BWL pulses with increasing peak intensity, only a small decrease in the anisotropy is observed. A clear drop of the anisotropy can be seen for pulses with increasing intensity due to decreasing chirp. The solid (BWL), dashed (positive chirp), and dotted (negative chirp) lines are linear fits of the corresponding data sets. Error bars denote the statistical error of 500 rotations of the QWP. The amount of GDD for the chirped data points is represented by their color. | ||
Already from Fig. 4 and 5, it is evident that the effect of positive and negative chirp on the CDIY of 3-MCP is not the same. In Fig. 6, we plot several anisotropy measurements as a function of chirp parameter obtained under slightly different measurement conditions. The different datasets are colored in shades of red for (S)-(−)-3-MCP and blue for (R)-(−)-3-MCP, overall highlighting the reproducibility of the chirp dependent behaviour. All scans were performed at 309 nm between −6200 fs2 and +8200 fs2 GDD, for both enantiomers. We observe an asymmetric enhancement of the anisotropy due to interaction with positively and negatively chirped pulses for both enantiomers. The mirrored behaviour of the enantiomers is maintained, the anisotropy factor flips its sign when the sample is switched between (R)-(+)-3-MCP (shades of blue) and (S)-(−)-3-MCP (shades of red).
 | ||
| Fig. 6 Multiple anisotropy measurements as a function of chirp parameter at a central wavelength of 309 nm for (R)-(+)-3-MCP (shades of blue) and (S)-(−)-3-MCP (shades of red). Positive chirp leads to a larger enhancement of the anisotropy than negative chirp at this wavelength. | ||
For a deeper analysis of the observed asymmetry in CDIY of 3-MCP for positive and negative chirp, we performed additional chirp scans at slightly detuned central wavelengths. The three laser spectra with central wavelengths separated by ∼1 nm are shown in Fig. 1(b). The maxima lie at 309 nm, 310 nm, and 311 nm, and the spectra have similar bandwidth, hence equivalent pulse duration (∼40 fs) when BWL. The three spectra have regions of overlap and some common wavelength components. The corresponding chirp scans from −6000 fs2 to +6000 fs2 for (R)-(+)-3-MCP are shown in Fig. 7. All chirp scans show an anisotropy enhancement for chirped pulses compared to the BWL pulse (at GDD = 0 fs2). For BWL pulses, the anisotropy is ∼3.2% at the three central wavelengths. Asymmetric enhancement of anisotropy is observed for the positively and negatively chirped pulses at all three wavelengths. The anisotropies at −4000 fs2 and +4000 fs2 are compared to the CDIY at 0 fs2 for all three wavelengths in Table 1. The enhancement due to positive and negative chirp is least asymmetric for 310 nm. Interestingly, the asymmetry is inverted when the central wavelength changes from 309 nm to 311 nm. The asymmetry in the chirp scan at 311 nm central wavelength seems to qualitatively agree with the previous work of Horsch [figure 76 in ref. 43].
 | ||
| Fig. 7 Chirp scans of the anisotropy of (R)-(+)-3-MCP at the three central wavelengths shown in Fig. 1(b). Two sets of measurements are plotted for each wavelength in light and dark colors. The left plot was obtained at a central wavelength of 309 nm, the middle plot at 310 nm, and the right plot at 311 nm. | ||
| λ central (nm) | −4000 fs2 | 0 fs2 | +4000 fs2 |
|---|---|---|---|
| 309 | 7.81% (2.44) | 3.2% | 9.41% (2.94) |
| 310 | 8.32% (2.6) | 3.2% | 9.22% (2.88) |
| 311 | 9.55% (3.03) | 3.15% | 8.54% (2.71) |
A similar effect was observed when scans of the central wavelength with the two chirp values of +3450 fs2 and −3370 fs2 were performed on (R)-(+)-3-MCP. The results are shown in Fig. 8. A pronounced wavelength shift between the maxima of anisotropy for positively and negatively chirped pulses is observed. For the wavelength scan with positively chirped pulses, a maximum anisotropy of 6.9 ± 0.9% is obtained for pulses with 308.6 nm central wavelength. Whereas for the negatively chirped wavelength scan, the maximum anisotropy of 8.2 ± 1.3% is measured at 311.6 nm central wavelength. This clearly shows the influence of chirped laser pulses on the CDIY.
 | ||
| Fig. 8 Wavelength scan of the anisotropy of (R)-(+)-3-MCP at similar positive (+3450 fs2) (in orange) and negative (−3370 fs2) (in blue) linear chirp. The pulse energy was fixed for all measurements. | ||
The ionic fragments of 3-MCP can also show circular dichroism.32 However, for the twin peak setup, the signals of close-lying fragments overlap and are difficult to analyse. For some of the measurements, the dominant 69 amu fragment was analysed. Its anisotropy always shows the same sign of anisotropy as the parent. The size of the effect can, however, not be reliably evaluated since the signal of 69 amu from the upper focus merges with the signal of 70 amu from the lower focus in our twin peak setup.
4 Discussion
The ionisation of 3-MCP at 309 nm can be described as a 1 + 1 + 1 REMPI process, as shown in Fig. 3. With the first absorbed photon, the π* state is reached. The π* ← n transition is very weak, characterized by its low dipole strength (D = 3.78 × 10⁻³e2a02)44 and is known to exhibit a high CD.29 In addition, the second photon can influence the CDIY, as observed when comparing 1 + 1 + 1 REMPI (CDIY 28%) to 1 + 1′ (CDIY 22%) REMPI.45 The dipole strength of the second bound-bound transition from the π* to the Rydberg state is unknown. It could be high, resulting in strong coupling between the π* and the Rydberg state. Finally, the ionisation step, initiated by the third photon, does not depend on the helicity of the laser pulse and does not change the observed CDIY. It only acts as a projection of the helicity-dependent population of the Rydberg state into the ionisation continuum.46 Both intermediate states, the π* and the Rydberg state, can contribute to the observed CDIY. From the above experiments presented in Fig. 5, we conclude that the major enhancement in CDIY in Fig. 4 is due to pulse duration and not due to reduced peak intensity. The linear chirp also plays a role, cf.Fig. 6–8.For the pulse-pair measurements, Fig. 4, wavepacket dynamics in the π* state seem to be responsible for the observed change in CDIY. A tentative disentanglement of the first two excitation steps, leading to this interpretation, is possible as follows: Since the pump and probe pulses were non-ionising on their own, ions were measured only when both pulses had interacted with the sample: either 1pump + (1 + 1)probe or (1 + 1)pump + 1probe. To observe a delay-dependent anisotropy, the pump pulse must always excite the molecule into the π* state, and the probe pulse must ionise the Rydberg state. In principle, the second photon (Rydberg ← π*) could be absorbed from either pulse. Molecules promoted to the Rydberg state by the pump and ionised by the probe pulse (1 + 1)pump + 1probe at any given delay will always show a constant anisotropy in the ion yield. Note that ultrafast decay into other states that may have different cross sections for ionisation does not influence the CDIY because of its normalisation, (cf.eqn (2)). Consequently, any change in the anisotropy associated with a change in the delay between the pump and probe pulse must be due to molecules excited to the π* state by the pump and to the Rydberg state by the probe pulse 1pump + (1 + 1)probe. These molecules undergo field-free dynamics between the pulses in the π* state. The field-free evolution of the wave packet in the π* state may influence the anisotropy by a change in the amplitude of the magnetic (m) or electric (μ) transition dipole moment or the angle between them for the transition between π* and different Rydberg states, see eqn (1). The transition to the Rydberg state elicited by the probe pulse at some delay would show a different anisotropy, which is projected onto the ion yield. In other words, the observed increase of the anisotropy from 4% to 6% in Fig. 4 may be due to a change in the molecule's geometry in the π* state. A possible physical mechanism might be ultrafast conformer dynamics, from the axial to the equatorial conformers in the π* state. Changing the conformer distribution could enhance the observed total CDIY (as an ensemble averaged value) due to the opposite signs of the CD in both conformers. The observed saturation of the g-factor for delay times >350 fs at around 6% for pump–probe delays up to 1.3 ps hints at the stabilization of μ and m and, hence, a stable geometry. A temperature dependent experiment changing the ratio of conformers may help to answer this question.
A similar explanation based on conformer dynamics is not possible for the pulse-duration measurements presented in Fig. 4 (measurements using BBO crystals and chirped pulses). Considering the distribution of the conformers to be 80:20 in the ground state and their CD equal but of opposite sign,44 a transformation of all axial conformers going to equatorial in the excited π* state would lead to an anisotropy enhancement of up to 1.66 times. In the pulse duration measurement, a 3 times enhancement was seen. Therefore, conformational dynamics in the first excited state do not represent the complete picture. Following our arguments from the pulse-pair experiment, we might deduce that the second bound-bound transition is responsible for the observed enhancement. In the pulse-pair experiment, the molecules excited to the π* state by the pump pulse undergo field-free evolution. In the pulse-duration experiments, the molecules are continuously interacting with the light field and an increase of CDIY is observed up to a pulse duration of 600 fs, maybe even longer.
In the case of decreasing spectral width (using BBO crystals) and corresponding elongation of the pulse duration, the increase in anisotropy could also be explained by the spectral sharpening of the excitation spectrum to the maximum of the π* ← n anisotropy band around 309 nm. We thereby cease to address transitions with lower anisotropy and, in consequence, increase the observed average anisotropy.
When chirped laser pulses initiate the underlying REMPI process, the sign and magnitude of the chirp, as well as the precise central wavelength of the laser pulse, have a significant influence on the observed anisotropy, cf.Fig. 7 and 8. While for the pump–probe experiments, we associate the change in anisotropy with the Rydberg ← π* transition, and for the BBO experiments with the π* ← n transition, for chirped pulses, the interplay of the two transitions is responsible for the control of CDIY. From perturbation theory, no control over one-photon transitions by spectral phase modulation is expected.47 In the case of excitation of 3-MCP with ultrashort laser pulses around 310 nm, two sequential one-photon transitions occur between molecular potentials before the third photon ionises the molecule. Previous studies have shown that in the perturbative regime, the population distribution in such a multistate system can be controlled via chirp.48 The sensitivity of CDIY in 3-MCP to the vibrational level in the π* ← n band through which it is ionised was demonstrated.49 Those experiments were performed using narrow linewidth nanosecond pulses on cooled molecules. For one of these vibrational levels, an anisotropy of 40% was observed. The high anisotropy was explained by the ring twisting and ring bending modes of the 3-MCP molecule, which favor the parallel alignment of the electric and magnetic transition dipole moments. For the presented experiments with femtosecond pulses, all Franck–Condon-accessible vibrational states in the π* ← n and Rydberg ← π* transitions covered by the bandwidth of the femtosecond pulses (3–4 nm) contribute to the observed anisotropy. Consequently, changing the population distribution of these vibrational levels can change the observed CDIY. Moreover, with the second photon and the bandwidth of our femtosecond pulses, not a single but several Rydberg states can be populated. Single-photon absorption and CD of such higher lying Rydberg states in (R)-(+)-3-MCP are known.50,51 The CD spectrum is rich and can change signs, giving even more playground to influence the anisotropy via altered population distributions of vibrational levels. While the π* ← n transition is weak, no information exists about the Rydberg ← π* coupling. If this coupling were to be high, strong-field scenarios like RAP might play a role in the second relevant transition, where selectivity as a function of chirp was demonstrated.26
The significant influence of the central wavelength onto the chirp-induced asymmetry of the CDIY, Fig. 7 might be explained by different overlap of the employed spectra with the absorption maximum of 3-MCP around 310 nm.44
5 Conclusions
Various pulse parameters were used to gain control over the CDIY of 3-MCP observed in a 1 + 1 + 1 REMPI via the π* ← n transition and a Rydberg state using femtosecond laser pulses with central wavelengths near 309 nm. We observed an anisotropy enhancement for increased pulse duration, which is consistent with previous studies. We further showed that this enhancement is independent of how the pulse duration was increased. That is, the enhancement in anisotropy is similar for both chirped and narrow-spectrum pulses. As the longer pulse duration reduces the peak intensity of the pulses, we investigated the dependence of CDIY with peak intensity. Under our experimental conditions, the anisotropy does not depend on the peak intensity of the pulses. Furthermore, we used a pulse pair experiment to examine the anisotropy dynamics of the two-photon excitation processes via the π* and Rydberg states. An anisotropy enhancement was observed in these measurements up to a pulse delay of 350 fs. This hints at possible dynamics of the conformers in the excited π* state of the 3-MCP. Besides the pulse duration, the chirp sign, the central wavelength of the excitation, and their combination affect the anisotropy. In the neutral system, two successive one-photon absorptions take place. The vibrational population distribution after these transitions might depend on chirp and central wavelength, leading to a change in the observed CDIY. The effects of pulse parameters like interpulse delay and chirp are a promising starting point for future coherent control experiments using, for example, evolutionary algorithms. Together with the authors of44 detailed investigations of the underlying wavepacket dynamics are underway. In the future, temperature-dependent measurements could shed more light on the role of conformer dynamics in the CDIY.Author contributions
S. D. and J. G. conducted the experiment; S. D. analyzed the data; S. V., H. L. and N. L. gave experimental support; S. D. and J. G. wrote the manuscript with contributions from H. B., J. M., A. S., and T. B.; H. B. supervised the project; all authors discussed the results and commented on the manuscript.Data availability
The data that support the findings of this study are available from the corresponding author upon reasonable request.Conflicts of interest
There are no conflicts to declare.Acknowledgements
Funding by the Deutsche Forschungsgemeinschaft (DFG, German Research Foundation) – Project-ID 328961117 – SFB 1319 ELCH is gratefully acknowledged. We thank T. Ring for experimental support in the early stage of the experiment. We are grateful to Daniel Reich and Leon Kerber for fruitful discussions.Notes and references
- D. G. Blackmond, Cold Spring Harbor Perspect. Biol., 2010, 2, a002147 Search PubMed.
- J. Poirson, M. Valle, F. Bretenaker, A. Le Floch and J. Y. Thépot, Anal. Chem., 1998, 70, 4636–4639 CrossRef CAS PubMed.
- T. Müller, K. B. Wiberg and P. H. Vaccaro, J. Phys. Chem. A, 2000, 104, 5959–5968 CrossRef.
- C. Lux, M. Wollenhaupt, T. Bolze, Q. Liang, J. Köhler, C. Sarpe and T. Baumert, Angew. Chem., Int. Ed., 2012, 51, 5001–5005 CrossRef CAS PubMed.
- C. S. Lehmann, N. Bhargava Ram, I. Powis and M. H. M. Janssen, J. Chem. Phys., 2013, 139, 234307 CrossRef PubMed.
- D. Patterson and J. M. Doyle, Phys. Rev. Lett., 2013, 111, 023008 CrossRef PubMed.
- L. D. Barron, Molecular light scattering and optical activity, University Press, Cambridge, 2004, vol. 2 Search PubMed.
- Circular Dichroism – Principles and Applications, ed. N. Berova, K. Nakanishi and R. W. Woody, WILEY-VCH, New York, Chichester, Weinheim, Brisbane, Singapore, Toronto, 2000 Search PubMed.
- D. Patterson and M. Schnell, Phys. Chem. Chem. Phys., 2014, 16, 11114–11123 RSC.
- U. Boesl, A. Bornschlegl, C. Logé and K. Titze, Anal. Bioanal. Chem., 2013, 405, 6913–6924 CrossRef CAS PubMed.
- U. Boesl von Grafenstein and A. Bornschlegl, ChemPhysChem, 2006, 7, 2085–2087 CrossRef PubMed.
- R. Li, R. Sullivan, W. Al-Basheer, R. M. Pagni and R. N. Compton, J. Chem. Phys., 2006, 125, 144304 CrossRef CAS PubMed.
- J. Yun, C. Jeong, J. Heo and N. J. Kim, J. Phys. Chem. Lett., 2024, 15, 11615–11619 CrossRef CAS PubMed.
- A. Hong, C. M. Choi, H. J. Eun, C. Jeong, J. Heo and N. J. Kim, Angew. Chem., Int. Ed., 2014, 53, 7805–7808 CrossRef CAS PubMed.
- C. S. Lehmann and K.-M. Weitzel, Phys. Chem. Chem. Phys., 2020, 22, 13707–13712 RSC.
- P. Horsch, G. Urbasch and K.-M. Weitzel, Chirality, 2012, 24, 684–690 CrossRef CAS PubMed.
- K. Fehre, S. Eckart, M. Kunitski, C. Janke, D. Trabert, M. Hofmann, J. Rist, M. Weller, A. Hartung, L. P. H. Schmidt, T. Jahnke, H. Braun, T. Baumert, J. Stohner, P. V. Demekhin, M. S. Schöffler and R. Dörner, Phys. Rev. Lett., 2021, 126, 083201 CrossRef CAS PubMed.
- M. Shapiro and P. Brumer, Quantum Control of Molecular Processes, WILEY-VCH, Berlin, 2011, vol. 2 Search PubMed.
- M. Wollenhaupt and T. Baumert, Faraday Discuss., 2011, 153, 9–26 RSC.
- A. Assion, T. Baumert, M. Bergt, T. Brixner, B. Kiefer, V. Seyfried, M. Strehle and G. Gerber, Science, 1998, 282, 919–922 CrossRef CAS PubMed.
- S. Thallmair, R. Siemering, P. Kölle, M. Kling, M. Wollenhaupt, T. Baumert and R. de Vivie-Riedle, in Molecular Quantum Dynamics, ed. F. Gatti, Springer, Heidelberg, New York, Dordrecht, London, 2014, pp. 213–248 Search PubMed.
- W. D. M. Lunden, D. Geißler, P. Sándor and T. C. Weinacht, Phys. Rev. A: At., Mol., Opt. Phys., 2014, 89, 053404 CrossRef.
- T. Bayer, H. Braun, C. Sarpe, R. Siemering, P. von den Hoff, R. de Vivie-Riedle, T. Baumert and M. Wollenhaupt, Phys. Rev. Lett., 2013, 110, 123003 CrossRef PubMed.
- H. Braun, T. Bayer, C. Sarpe, R. Siemering, R. de Vivie-Riedle, T. Baumert and M. Wollenhaupt, J. Phys. B: At., Mol. Opt. Phys., 2014, 47, 124015 CrossRef.
- K. M. Tibbetts, X. Xing and H. Rabitz, J. Chem. Phys., 2013, 139, 144201 CrossRef PubMed.
- M. Krug, T. Bayer, M. Wollenhaupt, C. Sarpe-Tudoran, T. Baumert, S. S. Ivanov and N. V. Vitanov, New J. Phys., 2009, 11, 105051 CrossRef.
- H. Braun, T. Bayer, D. Pengel, M. Wollenhaupt and T. Baumert, J. Mod. Opt., 2017, 64, 1042–1053 CrossRef CAS.
- H. Braun, T. Bayer, M. Wollenhaupt and T. Baumert, in Molecular spectroscopy and quantum dynamics, ed. R. Marquardt and M. Quack, Elsevier, Amsterdam, 2020, pp. 79–112 Search PubMed.
- S. Feinleib, F. A. Bovey and J. W. Longworth, Chem. Commun., 1968, 238 RSC.
- H. G. Breunig, G. Urbasch, P. Horsch, J. Cordes, U. Koert and K.-M. Weitzel, ChemPhysChem, 2009, 10, 1199–1202 CrossRef CAS PubMed.
- C. Logé, PhD thesis, TUMünchen, 2011.
- C. Logé and U. Boesl, ChemPhysChem, 2012, 13, 4218–4223 CrossRef PubMed.
- C. Logé, A. Bornschlegl and U. Boesl, Anal. Bioanal. Chem., 2009, 395, 1631–1639 CrossRef PubMed.
- P. H. Horsch, G. Urbasch and K.-M. Weitzel, Z. Phys. Chem., 2011, 225, 1–8 CrossRef.
- T. Ring, C. Witte, S. Vasudevan, S. Das, S. T. Ranecky, H. Lee, N. Ladda, A. Senftleben, H. Braun and T. Baumert, Rev. Sci. Instrum., 2021, 92, 033001 CrossRef CAS PubMed.
- M. Wollenhaupt, A. Assion and T. Baumert, in Springer Handbook of Lasers and Optics, ed. F. Träger, Springer, Dordrecht Heidelberg London New York, 2012, vol. 2, pp. 1047–1094 Search PubMed.
- W. C. Wiley and I. H. McLaren, Rev. Sci. Instrum., 1955, 26, 1150–1157 CrossRef CAS.
- A. Rizzo, N. Lin and K. Ruud, J. Chem. Phys., 2008, 128, 164312 CrossRef PubMed.
- J. He, A. G. Petrovic and P. L. Polavarapu, J. Phys. Chem. B, 2004, 108, 20451–20457 CrossRef CAS.
- Y.-S. Li, J. Mol. Spectrosc., 1984, 104, 302–307 CrossRef CAS.
- D. Kim and T. Baer, Chem. Phys., 2000, 256, 251–258 CrossRef CAS.
- P. Horsch, G. Urbasch, K.-M. Weitzel and D. Kröner, Phys. Chem. Chem. Phys., 2011, 13, 2378–2386 RSC.
- P. Horsch, PhD thesis, Philipps-Universität Marburg, Marburg, 2013.
- L. A. Kerber, O. Kreuz, T. Ring, H. Braun, R. Berger and D. M. Reich, ChemPhysChem, 2025, e202400898 CrossRef PubMed.
- A. Bornschlegl, PhD thesis, TU München, 2007.
- C. Logé and U. Boesl, Phys. Chem. Chem. Phys., 2012, 14, 11981–11989 RSC.
- B. W. Shore, Manipulating quantum structures using laser pulses, Cambridge University Press, Cambridge, 2011 Search PubMed.
- A. Assion, T. Baumert, J. Helbing, V. Seyfried and G. Gerber, Chem. Phys. Lett., 1996, 259, 488–494 CrossRef CAS.
- U. Boesl and A. Kartouzian, Annu. Rev. Anal. Chem., 2016, 9, 343–364 CrossRef CAS PubMed.
- L. Otoole, P. Brint, C. Kosmidis, G. Boulakis and A. Bolovinos, J. Chem. Soc., Faraday Trans., 1992, 88, 1237–1243 RSC.
- W. C. Johnson, Rev. Sci. Instrum., 1971, 42, 1283–1286 CrossRef CAS PubMed.
| This journal is © the Owner Societies 2025 |