
 Open Access Article
 This Open Access Article is licensed under a
 Creative Commons Attribution 3.0 Unported Licence
Molecular dynamics of evaporative cooling of water clusters
Martin
Klíma
 ,
Jiří
Janek
and
Jiří
Kolafa
*
,
Jiří
Janek
and
Jiří
Kolafa
*
Department of Physical Chemistry, University of Chemistry and Technology, Prague Technická 5, 166 28 Praha 6, Czechia. E-mail: kolafaj@vscht.cz
First published on 13th December 2024
Abstract
The cooling of water clusters through evaporation into a vacuum is studied using classical molecular dynamics with the SPC water model, and the results are compared with macroscopic theory. A simple model based on the Hertz–Knudsen equation significantly underestimates cooling rates. A modified approach that accounts for the Kelvin equation provides better results. Further insight is gained by comparing temperatures derived from different degrees of freedom. While the rotational temperature of the clusters is only slightly lower than their internal temperature and decreases over time, the translational temperature of the clusters, considered as individual particles, remains nearly unchanged.
1 Introduction
Nucleation is an important process in the formation of a new, more stable phase, which is separated from a less stable phase by a first-order phase transition. Nucleation from vapor to liquid occurs in many industrial processes, primitive solar nebulae, planetary atmospheres, and other environments. The pristine particle undergoes further changes in a dilute gas or vacuum. In the laboratory, one can observe such nucleation in the supersonic expansion. Here, a pressurized gas expands through a nozzle into a vacuum.1–4 The jet adiabatically cools down, reaching supersonic speeds, which leads to nucleation into clusters of various sizes that eventually freeze.5–8 Water clusters obtained via supersonic expansion4 can serve as proxies for atmospheric aerosol particles9 and contribute to our understanding of various aspects of surface chemistry.10 Frozen clusters11,12 can mimic ice particles13–18 which play a crucial role in atmospheric chemistry.The process of supersonic expansion has been extensively studied both experimentally19–23 and theoretically.24–26 Experimental measurements of nucleation rates, cluster size distributions, and other properties are used to test nucleation theories.27–34 Spectroscopic techniques provide insight into the thermodynamic properties and cluster pickup characteristics.35–40 Numerous experiments, particularly in Laval nozzles, have determined nucleation rates during expansion,20,21,41 while conical nozzles have been explored in other studies.42 These experimental efforts are complemented by a variety of modeling and computational approaches.5,43–47
In our laboratory, we have developed an original method for simulating supersonic expansion.48 A parcel of gas flowing through a nozzle is enclosed in an expanding periodic box and simulated using classical molecular dynamics. During the expansion, the pressure–volume work is determined. Using this and the Bernoulli equation, the flux is calculated. If the flux is not constant (i.e., the system does not reach a steady-state condition), the expansion protocol is modified, and the simulation is repeated until the results align with the equations of fluid dynamics. The obtained cluster distribution49,50 is in agreement with experimental results. We also found that the clusters are warmer than the global system temperature, which includes the surrounding dilute gas. Since the results for different cluster temperatures (internal, rotational, and translational) were inconclusive, we initiated the current project to simulate the cooling process through evaporation into a vacuum.
One significant study51 explores the thermochemical and kinetic aspects of cooling isolated liquid droplets, particularly amorphous water, via evaporation. It reveals that centrally placed electric charges in molecular clusters make evaporation more endothermic, especially in smaller clusters, leading to larger cluster size distributions and higher temperatures. The role of inert gases in the evaporative cooling of water clusters has been also studied.52 It shows that hydrogen-bonded water clusters with adsorbed inert gases can control fragmentation in mass spectrometry by rapidly lowering internal energy, thus reducing fragmentation rates. This approach facilitates the production of “unprotonated” water clusters, whose structures match theoretical predictions, and could expand mass spectrometry applications to complex polymers, including biopolymers. Studies on alkali metal ion-doped water–argon clusters reveal that these ions lower the O–H stretch frequencies and increase IR intensity of the symmetric mode, enhancing our understanding of ion solvation in water. Simulations closely match experimental temperatures, further illuminating the cooling process.53,54
Traditional models like the Hertz–Knudsen relation have been used to describe evaporation but have limitations. Newer models, such as those based on liquid film evaporation into a vacuum, better match simulation results and offer more accurate descriptions of water droplet evaporation.55–57 Research on evaporative cooling during supersonic expansion has introduced the energy balance model that predicts water cluster temperatures accurately. Reduced cooling in larger clusters indicates the onset of crystallinity, offering a new structural marker.35 Lastly, research on Na(NH3)n clusters shows that their dissociation dynamics are driven by ionic evaporation, with this effect being more pronounced in smaller clusters. In larger clusters, ionic state evaporation plays a dominant role, highlighting the influence of ionization cross-section variations in femtosecond experiments.58
This work tackles the topic from a purely simulation side. A range of clusters have been simulated and the results have been compared with thermodynamic models.
2 Theory
2.1 Temperature of evaporating clusters
For technical reasons, it is useful to calculate the translational kinetic energy, Etr, and the corresponding temperature, Ttr = 2Etr/fkB (f = 3N), from the velocities of the molecular centers of mass (CoMs) or, alternatively, from the linear momenta of the molecules. Then, the internal temperature of molecules can be calculated from the difference Ekin–Etr. Since the SPC water is rigid, f = 3N and this temperature includes only rotations; we will denote it as Trot. For systems in equilibrium, Trot = Ttr should hold. To quantify this condition, we define the equipartition error as
| ΔTeqp = Ttr − Trot. | (1) |
In contrast, we can treat individual clusters as large particles. The translational kinetic temperature of the clusters, considered as particles, can be calculated from their linear momenta (LM) or, equivalently, from the velocities of their centers of mass. We will denote this temperature as TLM. Since we always have only one cluster in a simulation box, the number of degrees of freedom is f = 3. Similarly, we define the rotational temperature of a “cluster as particle” from its angular momentum (AM). To do this, the cluster is centered to its CoM, its linear momentum is removed, and the inertia tensor I and the vector of angular momentum M are calculated. The corresponding rotational temperature is

 | (2) |
![[v with combining macron]](https://www.rsc.org/images/entities/i_char_0076_0304.gif) 2 = kBT/m and m denotes the mass of a molecule. In the following discussion, condensation events will be ignored, resulting in the cooling of the cluster during evaporation into a vacuum.
2 = kBT/m and m denotes the mass of a molecule. In the following discussion, condensation events will be ignored, resulting in the cooling of the cluster during evaporation into a vacuum.
Let us first assume that the N-cluster has zero velocity of its CoM, vN = 0. The velocities of the evaporated molecule and the remaining (N − 1)-cluster must then satisfy the momentum conservation law,
| v1 + (N − 1)vN−1 = 0. |
 . For the energy divided by
  , it holds
| v12 + (N − 1)vN−12 = 2. |
Let us rename this quantity to ΔvN−1 and let us assume now that the original N-cluster has a velocity vN (in the above-defined direction) corresponding to the Maxwell–Boltzmann law at temperature T. Then

Since the recoil velocity is not correlated with vN, 〈vN·ΔvN−1〉 = 0, the averaged velocities squared (variances) are additive,
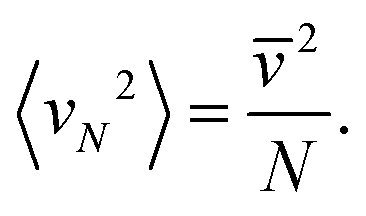
Since the mass of this cluster is (N − 1)m, we get from eqn (2) that the translational temperature of the (N − 1)-cluster equals T.
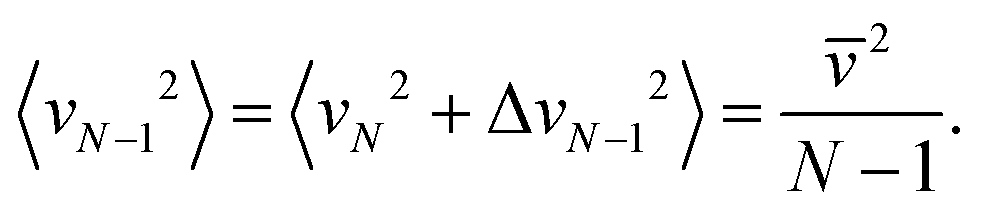
In other words, the translational temperature of clusters “as particles”, TLM, remains unchanged on evaporation of one molecule. However, the cluster (internal) temperature decreases by Q/N on one evaporation event, where Q is the ratio of the vaporization enthalpy and the isobaric heat capacity, Q = ΔvapH/Cp ≈ 540–600 K (for real bulk water in dependence on temperature). The translational temperature in the second evaporation event (assuming that N is large enough) decreases by 2Q/N2, in the third event by 3Q/N2, and after nev evaporations the decrease is  which is a second-order effect. We thus conclude that TLM remains nearly constant during evaporative cooling.
2.2 Simulation methodology
Water was modeled using an SPC potential59 truncated and smoothed at 12.7 Å, see ref. 50 for the formulas. No cutoff corrections are applied. While it is technically possible to use the full potential in Cartesian space, removing a molecule would lead to a sudden energy change, which would disrupt adiabacity.In ref. 50, we evaluated the impact of truncation on the similar SPC/E model. We found that the surface tension, 62 mN m−1 for the full SPC/E, is reduced by 0.7 mN m−1 and 2.65 mN m−1 due to the truncation of electrostatic and dispersion forces, respectively. The dielectric constant remains unaffected within the standard error of 0.8, and the density change is less than 0.3%.
Due to technical constraints, the simulations were performed in the cubic periodic boundary conditions with box edge length L = 48 Å. To handle nonbonded interactions efficiently, the linked-cell list method was used. The Verlet/leap-frog method was employed for integrating the equations of motion, and the SHAKE algorithm was implemented to preserve molecular rigidity. For a good time reversibility, SHAKE employs superrelaxation with a bond length tolerance of 10−10 Å
The kinetic energy was calculated by the leap-frog formula, which for one atom i at time t reads as
 | (3) |
Each simulation began with a pre-formed cluster. Velocities were reassigned according to the Maxwell–Boltzmann distribution, followed by a 20 ps equilibration phase using the Andersen thermostat applied to the molecular centers of mass, with a correlation time τT = 1 ps. Afterward, the thermostat was turned off, and a microcanonical simulation ensued. During each cycle, lasting 60h = 0.1 ps, the cluster center along the x-coordinate was calculated using the formula

2.3 Evaporative cooling model
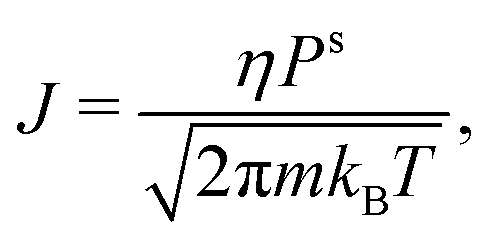
In this section, we develop a continuous macroscopic model of evaporative cooling of a spherical cluster to a vacuum. We assume that the evaporation can be expressed by the Hertz–Knudsen effusion formulawhere J is the flux (in molecules per unit area and time), Ps is the saturated vapor pressure, and η is the sticking coefficient. This formula with η = 1 (aka Knudsen effusion) is exact for a virtual planar plaquette in the gas phase. If we place this plaquette next to the liquid surface in equilibrium, the flux is the sum of the effusing molecules (η) and the molecules reflected from the surface (1 − η). Since almost all incoming thermal molecules are attached at water surface, η = 1 is sufficiently accurate. Note that it was proposed56 to use an “outer temperature” in the Hertz–Knudsen formula; however, we do not know this temperature in the evaporation to a vacuum.
The saturated vapor pressure Psr above a spherical droplet of radius r is higher than vapor pressure Ps over a flat surface, and can be (for r large enough) approximated by the Kelvin (Ostwald–Freundlich) equation,60

The evaporation rate is given by the Hertz–Knudsen flux and the surface area A = 4πr2 of the cluster,
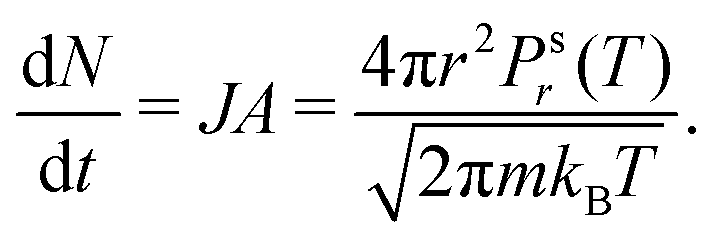 | (4) |
As the cluster evaporates, the temperature decreases. The cooling rate is
 | (5) |
ΔvapH1 = RT2d![[thin space (1/6-em)]](https://www.rsc.org/images/entities/char_2009.gif) lnPsr/dT, lnPsr/dT, |
| Cp,1 = ∂H1/∂T = 4kB − ∂ΔvapH1/∂T, |
In addition to this model taking into account the Kelvin equation, we test also a simple model using Ps instead of Psr in the above equations.
Mathematically, the problem reduces to a set of two ordinary differential equations. The first one is eqn (4) and the second is
 t).
t).
2.4 Input data for the evaporation model
The evaporative cooling model in Section 2.3 is based on the thermodynamic properties of the same molecular model as used in the simulation of evaporation – the truncated SPC force field. It is not our aim to compare the force field-based results to real experiments.In classical mechanics, atomic masses can be adjusted without affecting the thermodynamic averages of static quantities. Therefore, we equalized the masses of atoms (in g mol−1: O = 8, H = 5) in these calculations, allowing the use of a longer time step of h = 2 fs. The rigid geometry of a molecule was maintained using SHAKE (accuracy 10−9, with superrelaxation), and a constant temperature was ensured by the Nosé–Hoover thermostat (characteristic time τT = 0.25 ps, TRVP (k = 2)62).
1. The surface tension is calculated by formula63
 | (6) |
| σ = a(c − T)b, | (7) |
2. The saturated vapor pressure equals the zz-component of the pressure tensor. For T ≤ 300 K, the accuracy is not sufficient because the vapor pressure is too low. Note that the “kinetic pressure correction”,64 which takes care about zero linear momentum in the periodic boundary conditions, is not (and should not be) included here.
3. The liquid density at the vapor pressure was obtained from the z-density profile. These densities differ slightly from those calculated in a box, see Table 2.
| T (K) | ΔvapHm (J mol−1) | ρ (kg m−3) |
|---|---|---|
| 250 | 46615.5(50) |
1001.23(30) |
| 300 | 44018.9(20) |
973.14(12) |
| 350 | 41576.7(15) |
929.64(8) |
| 400 | 39160.0(12) |
874.58(7) |
4. Similarly, the vapor density is obtained. The pressure obtained from the gas density by the virial equation of state with the second virial coefficient shows a good agreement with the Pzz-based pressure.
| ΔvapH1 = −〈Epot〉 + kBT. |
The mass densities have been fitted to
| ρ = 960.86537 + 0.80351917T− 0.002548497T2 |
The Widom method is based on a numerical derivative of the residual (not containing the kinetic term) Helmholtz energy. Using the discrete step of ΔN = 1, the residual chemical potential (relative to the chemical potential of ideal gas at the same temperature T and number density n = (N + 1/2)/V, where V is the system volume) becomes
 | (8) |
Since inserting a molecule into a dense liquid is difficult, a small molecule is inserted first. A series of (N + 1)VT simulations is then performed with an incomplete molecule, which is periodically virtually expanded to the next bigger one until the full molecule is reached. Then
 | (9) |
| wi = 〈e−βΨ(i−1→i)〉(N+1)VT, | (10) |
In the simulation, the equilibrium number density n0 at a pressure P0 close to the (yet unknown) vapor pressure is determined as in Section 2.4.2. The volume is set to V = (N + 1/2)/n0 and w is calculated. The vapor pressure is
 | (11) |
where Vl is the molecular volume in liquid, B the isothermal bulk modulus (reciprocal value of compressibility), and Δρ = ρ(Ps) − ρ(P0). The derivation of this formula follows the path of the derivation of the Kelvin equation. This correction was not applied in this study because Ps was close enough to P0.

In step i = 0, the virtual particle was inserted N-times every 0.1 ps, in steps i > 0, the average was accumaled also every 0.1 ps. The parameters of the small molecules (Lennard-Jones cross-terms and partial charges) are collected in Tables 14 and 15 (ref. 65) along with the partial averaged Boltzmann factors, wi, and their error estimates.
| lnPs = a − b/T + cln(T), | (12) |
3 Results and discussion
3.1 Cluster sizes
The time-dependence of the averaged cluster size, N, is shown in Fig. 1. The calculations are based on m = 5001 independent evaporative runs for N0 = 60, 100 and 160 molecules. The N0 = 40 calculations (shorter) are based on m = 17576 independent runs. The simulation methodology is described in Section 2.2.
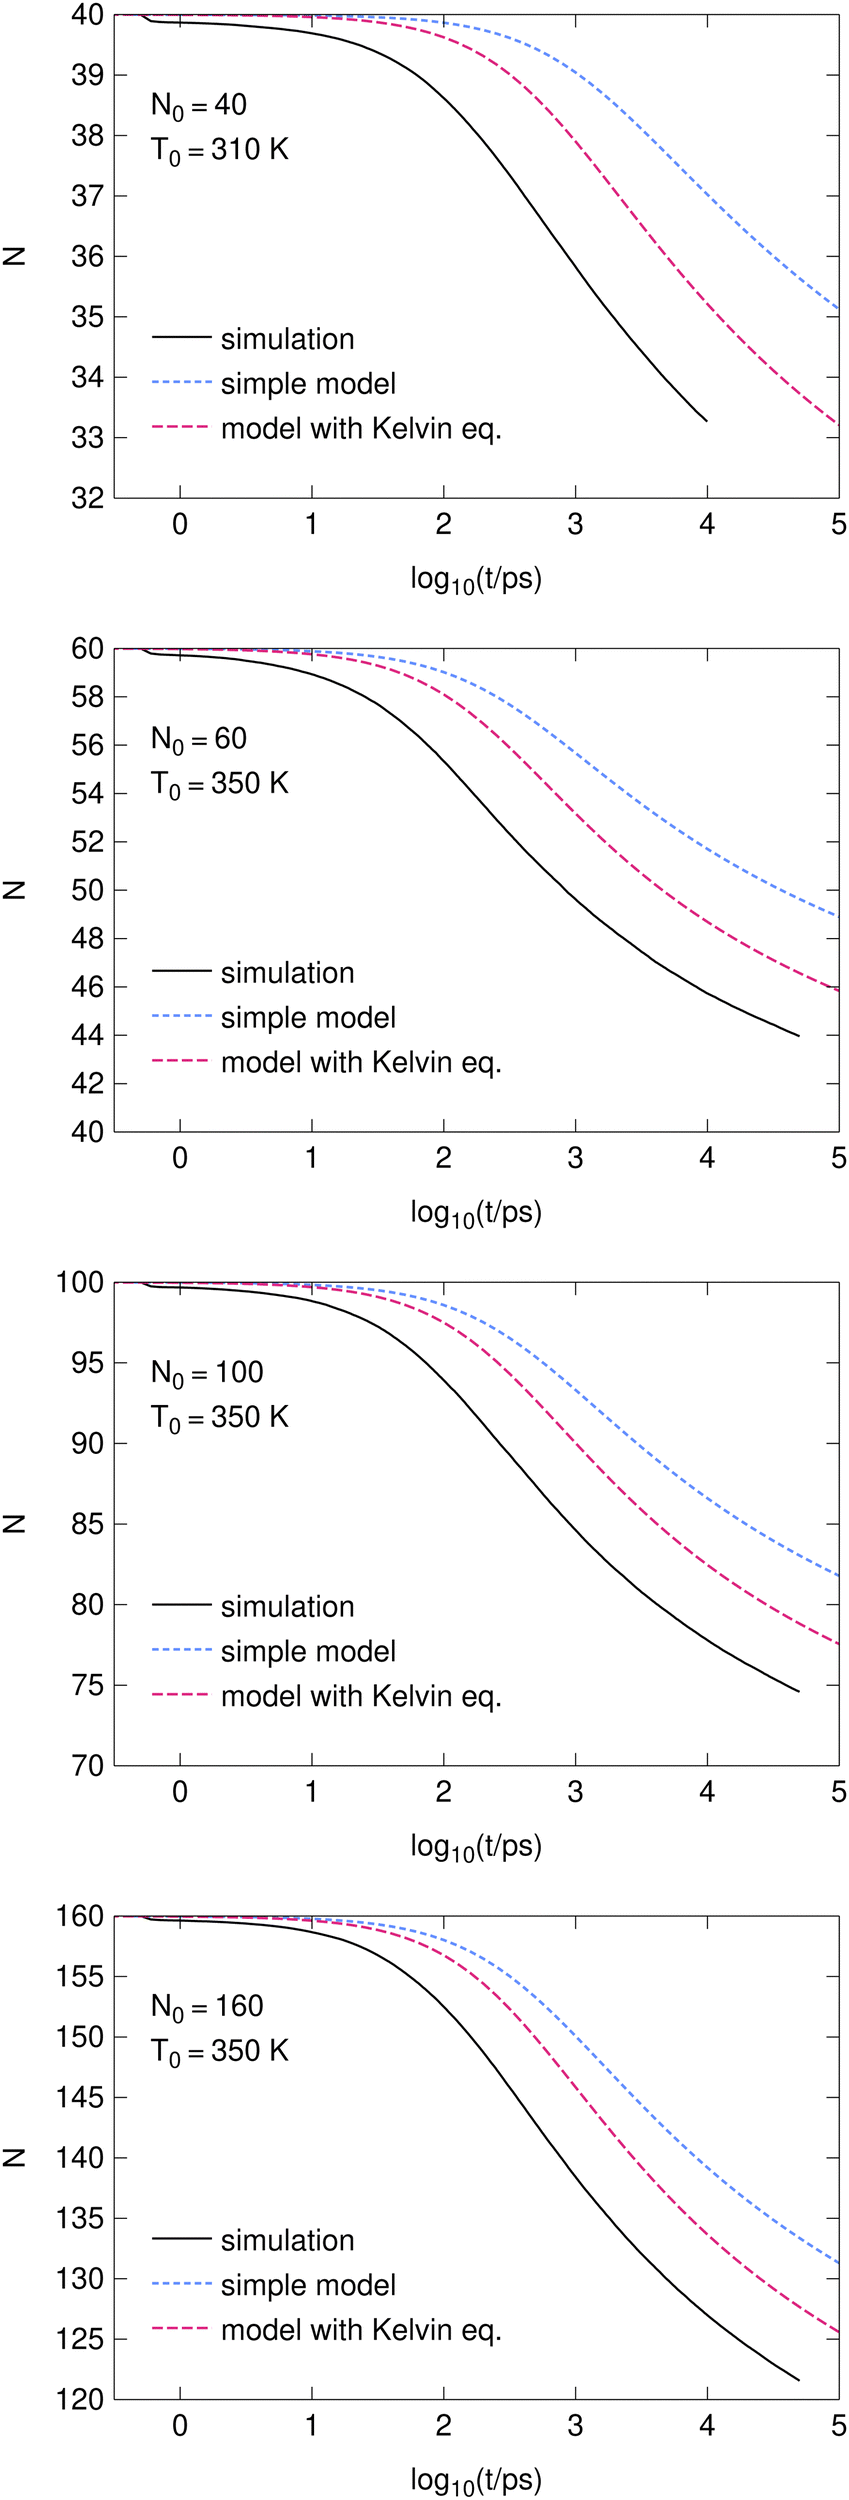 | ||
| Fig. 1 The number of particles in clusters as a function of time (logarithmic scale). | ||
It is seen that there is a small artefact at short times corresponding to occasional evaporation events during the cluster preparation. This phenomenon decreases the average number of particles by several tenths on average.
Both models (see Section 2.3) predict slower evaporation than the simulations. The more accurate model taking into account the cluster thermodynamics as described by the Kelvin equation works better than the simple model with clusters just replaced by bulk water. Roughly we may conclude that including the Kelvin equation takes into account about one half of the finite-size phenomena. The agreement is better for larger clusters, but the convergence (if it exists) for N → ∞ is slow.
3.2 Cluster temperatures
The cooling profiles are shown in Fig. 2. Again, the macroscopic evaporation models predict slower evaporation and consequently smaller cooling rates. Since the models do not account for recoil, we also provide Tkin/LM (shown as a dashed yellow line over the black solid of Tkin) where the linear momentum is removed. However, the difference from Tkin is negligible. Rotations are not removed because Tkin ≈ TAM with a higher precision than Tkin compares to TAM. | ||
| Fig. 2 Cooling profiles of clusters. Tkin is the total kinetic temperature and Tkin/LM is the total kinetic temperature with the linear momentum removed. Symbols TLM and TAM denote the respective translational (calculated from the linear momentum) and rotational (from the angular momentum) temperatures, the error bar (1σ) shown in the left top corner applies to both. | ||
The translational and rotational temperatures of whole clusters “as particles” are based on three degrees of fredom and m independent measurements. Since the variance of a single kinetic degree of freedom is VarTkin = 2T2, the standard error of both TLM and TAM is given by  which is depicted as an error bar in Fig. 2.
The translational temperature of whole clusters, TLM, remains constant within statistical noise, which is in agreement with the theory explained in Section 2.1.2.
The rotational temperature of whole clusters, TAM, is lower than the cluster internal temperature for N = 40 and N = 60, although for the latter, the difference is close to the common confidence limit of 2σ. For large clusters (N = 100 and N = 160), this observation is inconclusive because the differences are comparable to the error bars, and TAM is already lower than Tkin/LM at the start of evaporation (by 1σ and 1.7σ, respectively).
At the same time, the decrease in TAM is approximately −T/N or − 2T/N; therefore, we suggest that it is a finite-size effect on the order of  . In other words, the cluster rotations are almost thermalized with the internal cluster temperature, except for small clusters where the rotations are slightly colder. Thermalization of the angular momentum is possible because the clusters are in a liquid state. For solid clusters undergoing sublimation, one would expect a constant TAM, similarly to what is observed for TLM.
3.3 Equipartition
The last observation is rather technical. The equipartition error ΔTeqp according to eqn (1) should equal zero for systems in equilibrium. It converges to zero as for Verlet-like integrators, which is a purely numerical effect. In addition, ΔTeqp depends on the formula used to calculate the velocities. If the more common velocity Verlet formula vi(t) = [r(t + h) − r(t − h)]/2h = [vi(t − h/2) + vi(t + h/2)]/2 is used to calculate Ekin instead of the leap-frog-based eqn (3), the value of ΔTeqp has oposite sign and is twice as large62,64 – this is the reason why we prefer eqn (3). Note that the kinetic energy formulas are independent of the specific details of the Verlet or leap-frog algorithm. However, for the leap-frog method, the formula in eqn (3) is more natural, while the previously defined vi(t) appears in the velocity Verlet method. (We note in passing that Beeman's method uses yet another velocity, specifically vi(t) = [2vi(t + h/2) + 5vi(t − h/2) − vi(t − 3h/2)]/6).
Simulations in a box with the same setup as for the cluster simulations (i.e., without equalizing masses and with h = 1.67 fs) give ΔTeqp = −0.53 K for T = 250 K, which decreases to −0.88 K for T = 400 K. The equipartition errors for cluster simulations are drawn in Fig. 3. It is seen that the values are negative at simulation start in agreement with the numerical error. However, they grow to +1 or +2 K as the evaporation proceeds. The sign is in accord with the observation that the total angular momentum of evaporating cluster is on average smaller that would correspond to its internal temperature.
 | ||
| Fig. 3 Equipartition error as a function of time for evaporating clusters. The data are smoothed (rectangular window 10 ps wide) and reduced. | ||
Our equilibrium calculations (see Section 2.4) were performed with a longer timestep, h = 2 fs, and equalized masses. The equipartition error ΔTeqp is smaller in absolute value, ranging from −0.2 K at T = 250 K to −0.28 K at T = 400 K.
4 Conclusions
First, the evaporative cooling of water clusters has been simulated. The results are in a qualitative agreement with a model of evaporative cooling assuming the Hertz–Knudsen flux. The model taking into account the change of the chemical potential due to the Kelvin equation is more accurate, yet it does not take into account all finite-size effects.Next, the kinetic energy of the system of clusters “as particles” does not decrease with temperature but remains constant, in agreement with the theoretical considerations in Section 2.1.2. This does not apply to the rotational temperature, which is slightly colder than the internal cluster temperature; however, for larger clusters, this observation is inconclusive.
Author contributions
MK performed the MD calculations of cluster evaporation. JJ coded the evaporation model. JK proposed the idea and performed simulations of the truncated SPC water model (to be used in the model of evaporation), and also finalized the paper using parts of the PhD thesis by MK.Data availability
Averaged convergence profiles of the evaporation, data used to draw the figures, and selected raw simulation data are available.65Conflicts of interest
There are no conflicts to declare.Acknowledgements
This work was supported by the Czech Science Foundation, project 22-28869S, and by the project “The Energy Conversion and Storage”, funded as project no. CZ.02.01.01/00/22_008/0004617 by Programme Johannes Amos Comenius, call Excellent Research.References
- J. Lengyel, A. Pysanenko, V. Poterya, P. Slavíček, M. Fárník, J. Kočišek and J. Fedor, Phys. Rev. Lett., 2014, 112, 113401 CrossRef CAS.
- A. Bende, G. Perretta, P. Sementa and T. M. Di Palma, ChemPhysChem, 2015, 16, 3021–3029 CrossRef CAS PubMed.
- R. Baumfalk, U. Buck, C. Frischkorn, S. Gandhi and C. Lauenstein, Ber. Bunsen-Ges., 1997, 101, 606–613 CrossRef CAS.
- A. Borner, Z. Li and D. A. Levin, J. Chem. Phys., 2013, 138, 064302 CrossRef.
- W. Christen, K. Rademann and U. Even, J. Chem. Phys. A, 2010, 114, 11189–11201 CrossRef CAS PubMed.
- R. L. Johnston, Atomic and Molecular Clusters, CRC Press, 2002 Search PubMed.
- U. Buck and R. Krohne, J. Chem. Phys., 1996, 105, 5408–5415 CrossRef CAS.
- C. Bobbert, S. Schütte, C. Steinbach and U. Buck, Eur. Phys. J. D, 2002, 19, 183–192 CAS.
- C. E. Kolb and D. R. Worsnop, Annu. Rev. Phys. Chem., 2012, 63, 471–491 CrossRef CAS PubMed.
- T. Bartels-Rausch, Nature, 2013, 494, 27–29 CrossRef CAS.
- A. J. Amaya, H. Pathak, V. P. Modak, H. Laksmono, N. D. Loh, J. A. Sellberg, R. G. Sierra, T. A. McQueen, M. J. Hayes, G. J. Williams, M. Messerschmidt, S. Boutet, M. J. Bogan, A. Nilsson, C. A. Stan and B. E. Wyslouzil, J. Phys. Chem. Lett., 2017, 8, 3216–3222 CrossRef CAS.
- A. J. Amaya and B. E. Wyslouzil, J. Chem. Phys., 2018, 148, 084501 CrossRef PubMed.
- A. Bogdan, M. J. Molina, H. Tenhu, E. Mayer and T. Loerting, Nat. Chem., 2010, 2, 197–201 CrossRef CAS PubMed.
- D. R. Moberg, D. Becker, C. W. Dierking, F. Zurheide, B. Bandow, U. Buck, A. Hudait, V. Molinero, F. Paesani and T. Zeuch, Proc. Natl. Acad. Sci. U. S. A., 2019, 116, 24413–24419 CrossRef CAS PubMed.
- T. E. Gartmann, L. Ban, B. L. Yoder, S. Hartweg, E. Chasovskikh and R. Signorell, J. Phys. Chem. Lett., 2019, 10, 4777–4782 CrossRef CAS.
- B. Bandow and B. Hartke, J. Chem. Phys. A, 2006, 110, 5809–5822 CrossRef CAS.
- R. Zhang, A. Khalizov, L. Wang, M. Hu and W. Xu, Chem. Rev., 2011, 112, 1957–2011 CrossRef.
- J. M. Anglada, G. J. Hoffman, L. V. Slipchenko, M. M. Costa, M. F. Ruiz-López and J. S. Francisco, J. Chem. Phys. A, 2013, 117, 10381–10396 CrossRef CAS PubMed.
- A. Bhabhe, H. Pathak and B. E. Wyslouzil, J. Chem. Phys. A, 2013, 117, 5472–5482 CrossRef CAS PubMed.
- D. Ghosh, A. Manka, R. Strey, S. Seifert, R. E. Winans and B. E. Wyslouzil, J. Chem. Phys., 2008, 129, 124302 CrossRef.
- A. Khan, C. H. Heath, U. M. Dieregsweiler, B. E. Wyslouzil and R. Strey, J. Chem. Phys., 2003, 119, 3138–3147 CrossRef CAS.
- A. Manka, H. Pathak, S. Tanimura, J. Wölk, R. Strey and B. E. Wyslouzil, Phys. Chem. Chem. Phys., 2012, 14, 4505 RSC.
- K. A. Streletzky, Y. Zvinevich, B. E. Wyslouzil and R. Strey, J. Chem. Phys., 2002, 116, 4058–4070 CrossRef CAS.
- E. Rathakrishnan, Gas Dynamics, PHI Learning, 2017 Search PubMed.
- S. Toxvaerd, J. Chem. Phys., 2015, 143, 154705 CrossRef PubMed.
- W. Sun, S. Chen, Y. Hou, S. Bu, Z. Ma and L. Zhang, Int. J. Multiphase Flow, 2019, 121, 103118 CrossRef CAS.
- S. Sinha, A. Bhabhe, H. Laksmono, J. Wölk, R. Strey and B. Wyslouzil, J. Chem. Phys., 2010, 132, 064304 CrossRef PubMed.
- Y. J. Kim, B. E. Wyslouzil, G. Wilemski, J. Wölk and R. Strey, J. Chem. Phys. A, 2004, 108, 4365–4377 CrossRef CAS.
- J. Farges, M. de Feraudy, B. Raoult and G. Torchet, Surf. Sci., 1981, 106, 95–100 CrossRef CAS.
- X.-Z. Wu, J.-J. Yan, W.-J. Li, D.-D. Pan and G.-Y. Liu, Exp. Therm. Fluid Sci., 2010, 34, 10–19 CrossRef.
- H. Bae, I. Kim, E. Kim and J.-W. Lee, J. Aerosol Sci., 2010, 41, 243–256 CrossRef CAS.
- P. Parneix and F. Calvo, EPJ Web Conf., 2011, 18, 03003 CrossRef.
- K. K. Dingilian, R. Halonen, V. Tikkanen, B. Reischl, H. Vehkamäki and B. E. Wyslouzil, Phys. Chem. Chem. Phys., 2020, 22, 19282–19298 RSC.
- R. Halonen, V. Tikkanen, B. Reischl, K. K. Dingilian, B. E. Wyslouzil and H. Vehkamäki, Phys. Chem. Chem. Phys., 2021, 23, 4517–4529 RSC.
- D. Becker, C. W. Dierking, J. Suchan, F. Zurheide, J. Lengyel, M. Fárník, P. Slavíček, U. Buck and T. Zeuch, Phys. Chem. Chem. Phys., 2021, 23, 7682–7695 RSC.
- U. Buck and F. Huisken, Chem. Rev., 2000, 100, 3863–3890 CrossRef CAS PubMed.
- U. Buck and F. Huisken, Chem. Rev., 2000, 101, 205–206 CrossRef PubMed.
- U. Buck, R. Krohne and P. Lohbrandt, J. Chem. Phys., 1997, 106, 3205–3215 CrossRef CAS.
- N. I. Hammer, J. R. Roscioli, J. C. Bopp, J. M. Headrick and M. A. Johnson, J. Chem. Phys., 2005, 123, 244311 CrossRef.
- Y.-F. Lee, A.-M. Kelterer, G. Matisz, S. Kunsági-Máté, C.-Y. Chung and Y.-P. Lee, J. Chem. Phys., 2017, 146, 144308 CrossRef.
- S. Tanimura, H. Pathak and B. E. Wyslouzil, J. Chem. Phys., 2013, 139, 174311 CrossRef PubMed.
- P. Hirunsit, Z. Huang, T. Srinophakun, M. Charoenchaitrakool and S. Kawi, Powder Technol., 2005, 154, 83–94 CrossRef CAS.
- A. Borner, Z. Li and D. A. Levin, AIP Conf. Proc., 2012, 1501, 565–572 CrossRef.
- R. Jansen, N. Gimelshein, S. Gimelshein and I. Wysong, J. Chem. Phys., 2011, 134, 104105 CrossRef PubMed.
- G. Colonna and M. Capitelli, J. Thermophys. Heat Transfer, 2001, 15, 308–316 CrossRef CAS.
- G. Cao, L. Pan and K. Xu, J. Comput. Phys., 2021, 439, 110402 CrossRef CAS.
- A. Bastida, J. Zúñiga, A. Requena, B. Miguel, J. A. Beswick, J. Vigué and N. Halberstadt, J. Chem. Phys., 2002, 116, 1944–1953 CrossRef CAS.
- M. Klíma and J. Kolafa, J. Chem. Theory Comput., 2018, 14, 2332–2340 CrossRef.
- D. Celný, M. Klíma and J. Kolafa, J. Chem. Theory Comput., 2021, 17, 7397–7405 CrossRef.
- M. Klíma, D. Celný, J. Janek and J. Kolafa, J. Chem. Phys., 2023, 159, 124302 CrossRef PubMed.
- C. E. Klots, J. Chem. Phys., 1985, 83, 5854–5860 CrossRef CAS.
- R. T. Jongma, Y. Huang, S. Shi and A. M. Wodtke, J. Chem. Phys. A, 1998, 102, 8847–8854 CrossRef CAS.
- T. D. Vaden, C. J. Weinheimer and J. M. Lisy, J. Chem. Phys., 2004, 121, 3102–3107 CrossRef CAS.
- O. M. Cabarcos and J. M. Lisy, Int. J. Mass Spectrom., 1999, 185–187, 883–903 CrossRef.
- A. H. Persad and C. A. Ward, Chem. Rev., 2016, 116, 7727–7767 CrossRef CAS PubMed.
- R. Hołyst and M. Litniewski, J. Chem. Phys., 2009, 130, 074707 CrossRef PubMed.
- L. Dombrovsky, A. Fedorets, V. Levashov, A. Kryukov, E. Bormashenko and M. Nosonovsky, Atmosphere, 2020, 11, 965 CrossRef CAS.
- G. Grégoire, M. Mons, I. Dimicoli, C. Dedonder-Lardeux, C. Jouvet, S. Martrenchard and D. Solgadi, J. Chem. Phys., 1999, 110, 1521–1525 CrossRef.
- H. J. C. Berendsen, J. P. M. Postma, W. F. van Gunsteren and J. Hermans, in Interaction Models for Water in Relation to Protein Hydration, ed. B. Pullman, Springer Netherlands, Dordrecht, 1981, pp. 331–342 Search PubMed.
- P. Atkins and J. de Paula, Atkins’ Physical Chemistry, Oxford University Press, 9th edn, 2010 Search PubMed.
- MapleSoft, Maple, 2024, https://www.maplesoft.com/products/maple/.
- J. Kolafa and M. Lísal, J. Chem. Theory Comput., 2011, 7, 3596–3607 CrossRef CAS PubMed.
- M. P. Allen and D. J. Tildesley, Computer Simulation of Liquids, Oxford University Press, Oxford, 2017 Search PubMed.
- J. Janek and J. Kolafa, J. Chem. Phys., 2024, 160, 184111 CrossRef CAS.
- J. Kolafa, K. Bouzek and Š. Paušová, Dataset of ‘Molecular dynamics of evaporative cooling of water clusters’ DOI:10.5281/zenodo.13932327.
| This journal is © the Owner Societies 2025 |