 Open Access Article
Creative Commons Attribution 3.0 Unported Licence
Correction: Carbon-dot-based ratiometric fluorescent sensor for detecting hydrogen sulfide in aqueous media and inside live cells
Changmin
Yu
,
Xizhen
Li
,
Fang
Zeng
*,
Fangyuan
Zheng
and
Shuizhu
Wu
*
College of Materials Science & Engineering, State Key Lab of Luminescent Materials & Devices, South China University of Technology, Guangzhou 510640, China. E-mail: mcfzeng@scut.edu.cn; shzhwu@scut.edu.cn
First published on 24th March 2025
Abstract
Correction for ‘Carbon-dot-based ratiometric fluorescent sensor for detecting hydrogen sulfide in aqueous media and inside live cells’ by Changmin Yu et al., Chem. Commun., 2013, 49, 403–405, https://doi.org/10.1039/C2CC37329G.
The authors regret that there were several unclear statements and errors that appeared in the original text and Supplementary Information for this article. These are addressed as follows:
At the end of the 3rd paragraph (page 405) in the main text, we would like to include the following statement for clarity regarding the mechanism of internalization:
“The nanosized and CD-based sensor is likely internalized into cells via the endosome/lysosome pathway. As shown in fluorescence images presented in Fig. 3 and Fig. S20, some CD-based sensors seem to be entrapped in endosomes/lysosomes, and some others appear to escape into cytosols from endosomes.”
For Fig. 3, we have added scale bars and brightfield images of the cells have been added as below:
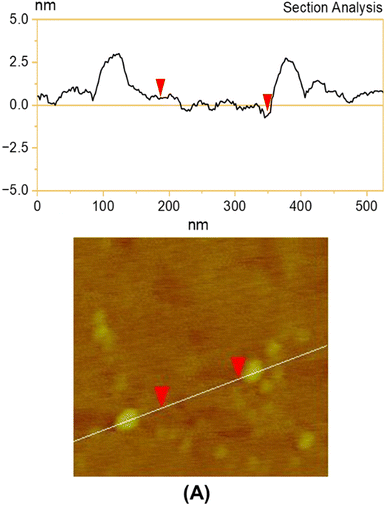
There were also errors in Fig. S1A and Fig. S12A in the ESI of this article. The authors noticed that the atomic force microscopy (AFM) image in Fig. S1A does not correspond to the intended sample. In Fig. S12A, two of the arrows were incorrect. Specifically, the arrows should indicate that, with the addition of H2S, the emission at 425 nm should gradually decrease, while the emission at 526 nm should increase. The ESI has been updated and corrected versions of Fig. S1A and Fig. S12A are shown below:
![[thin space (1/6-em)]](https://www.rsc.org/images/entities/char_2009.gif) :
:![[thin space (1/6-em)]](https://www.rsc.org/images/entities/char_2009.gif) 1, v/v).
1, v/v).
Finally, the standard name of the H2S probe (naphthalimide-azido) should have been listed as “4-(2-(6-azido-1,3-dioxo-1H-benzo[de]isoquinolin-2(3H)-yl)ethoxy)-4-oxobutanoic acid” based on IUPAC nomenclature.
The Royal Society of Chemistry apologises for these errors and any consequent inconvenience to authors and readers.
| This journal is © The Royal Society of Chemistry 2025 |


