
 Open Access Article
 This Open Access Article is licensed under a
 Creative Commons Attribution 3.0 Unported Licence
Thiolate-CLPG (chemiluminescent protecting groups) based on coumaranone thiolcarbamates†
Tim
Lippold
 *a,
Julia
Kosolapova
b,
Niko T.
Flosbach
b,
Robert
Herzhoff
c,
Axel G.
Griesbeck
*a and
Mathias
Wickleder
b
*a,
Julia
Kosolapova
b,
Niko T.
Flosbach
b,
Robert
Herzhoff
c,
Axel G.
Griesbeck
*a and
Mathias
Wickleder
b
aFaculty of Mathematics and Natural Sciences, Department of Chemistry and Biochemistry, Institute of Organic Chemistry, University of Cologne, Greinstr. 4, 50939 Köln, Germany. E-mail: griesbeck@uni-koeln.de; Fax: +49-221-4701166
bFaculty of Mathematics and Natural Sciences, Department of Chemistry and Biochemistry, Institute of Inorganic and Materials Chemistry, University of Cologne, Greinstr. 6, 50939 Köln, Germany
cFaculty of Mathematics and Natural Sciences, Department of Chemistry and Biochemistry, Institute of Light and Materials, University of Cologne, Greinstr. 4-6, 50939 Köln, Germany
First published on 25th January 2025
Abstract
The base-induced oxidative release of aromatic and aliphatic thiols from novel coumaranone-thiolurethanes 3a–3e is accompanied by long-lasting blue or green chemiluminescence. Thus, these compounds serve as base/oxidation-labile protecting groups that decompose with strong visible luminescence and subsequent quantitative release of the protected thiolate as leaving group.
Protecting groups are essential as intermediate blockers in complex organic syntheses but also relevant for the selective release of small molecules in numerous chemical and/or biological applications.1–5 This release can be initiated by acids, bases, metals, enzymes, redox-active reagents, or visible light. In the latter case, the abbreviation PRPG was introduced to mark these protecting groups as photoreleasable.6–12 The photon might, however, appear at two parts of the release process: at the beginning as in PRPG or as a consequence of the release process, i.e. as chemiluminescence (CL). We have termed the latter PG's as CLPG, chemi-luminescent protecting groups.13 An advantage of these groups is that the release process can be detected spacially by measuring the emitted light and kinetically evaluated by determining the decay rates. Thus, a spatio-temporal detection of (thermal) release becomes possible with CLPG. We have demonstrated this principle for alkoxides as leaving groups13 using the coumaranone-carbamates that were investigated intensively by Schramm and coworkers.14–16 We could show that the leaving group ability is crucial for this release step by comparing urea- with urethane-linked coumaranones: whereas the release of phenolates is fast and directly connected with CL, aliphatic alkoxides and amide anions are not released. CL can be detected, but decays very fast in the case of the latter.13 For this study the thiolcarbamate precursors were prepared according to the synthesis approach by Graf et al.17 for aromatic thiols by Loev and Kormendy18 for aliphatic thiols (Scheme 1). The yields are summarised in Table 1.
 | ||
| Scheme 1 (top) Illustration of the synthesis of thiolcarbamates. Method (I) is according to the adapted synthesis protocol of ref. 17 and method (II) according to ref. 18. (bottom) Substrates used for the synthesis of thiolcarbamates. | ||
| Thiolcarbamate from | Coumaranone from |
|---|---|
| p-Bromothiophenol (2a, 83%) | p-Bromothiophenol (3a, 20%) |
| Naphthalene-2-thiol (2b, 67%) | Naphthalene-2-thiol (3b, 12%) |
| Ethanethiol (2c, 35%) | Ethanethiol (3c, 8%) |
| Butanthiol (2d, 55%) | Butanthiol (3d, 4%) |
| Octanethiol (2e, 69%) | Octanethiol (3e, 17%) |
The subsequent conversion to the corresponding coumaranones is based on a synthetic protocol by Schramm et al.15 with minor modifications. After condensation with glyoxylic acid monohydrate 4, TFA was used instead of a mixture of acetic and sulfuric acid and p-fluorophenol 5, which delivered the highest yields (Scheme 2). The coumaranones 3a–e could be successfully synthesised in moderate yields, and derivative 3a with the highest yield (Table 1).
 | ||
| Scheme 2 Synthesis of coumaranones with a thiolcarbamate substructure according to the adapted synthesis protocol of Schramm et al.15 | ||
Initially, the decomposition of the coumaranone protected derivatives of p-bromothiophenol 3a (Fig. 1) and octanethiol 3e (Fig. 2) were investigated via1H-NMR. The decomposition of thiolcarbamate–coumaranone 3a is illustrated in Fig. 1. The signals corresponding to the α-CH group at 5.54 ppm and the NH group at 9.67 ppm vanish, along with notable changes in the aromatic region between 6.0 and 7.8 ppm after the addition of DBU. Initially, the CL changes from blue to green and gradually fades after more than 10 minutes. During this time, the two signals of p-bromothiophenol (1a-A) at 7.47 and 7.59 ppm show a significant increase. After 30 minutes, no further changes are observed, confirming the complete deprotection of 3a. 1H-NMR analysis of 3e also confirms the successful deprotection of octane thiol (1e-A) (Fig. 2). As with 3a, the α-CH and NH signals disappear following DBU addition, and a distinctive aromatic byproduct appears in the range between 7.0 and 7.5 ppm within 5 minutes. The chemiluminescence of 3e lasts for 30 minutes and exhibits a light blue colour. Once the CL fully decays, no further changes are detected in the 1H-NMR spectrum. Subsequent 2D NMR spectra identified fully deprotected octanethiol (1e-A) and compound 6 as the main aromatic byproduct of the reaction. Overall, both experiments verified the complete removal of the CLPG.
 | ||
| Fig. 1 1H-NMR (in DMSO-d6, 0.1 M) of the base triggered decomposition of 3a: CL-photographs after the addition of DBU and constant saturation with oxygen. Left: Complete NMR-spectrum, right: enlarged area from 4.8–10.0 ppm. Blue boxes = change in signal intensity and occurrence of new signals; red boxes = disappearance of the NH/α-CH signals due to deprotonation after 1 min; dark green box = additional signals of DBU. | ||
 | ||
| Fig. 2 1H-NMR (in DMSO-d6, 0.1 M) of the base triggered decomposition of 3e: CL-photographs after the addition of DBU and constant saturation with oxygen. Left: Complete NMR-spectrum, right: enlarged area from 4.8–10.0 ppm. Blue boxes = change in signal intensity and occurrence of new signals; red boxes = disappearance of the NH/α-CH signals due to deprotonation after 1 min; dark green box = additional signals of DBU. | ||
The photophysical properties of all five thiolcarbamate coumaranones have been characterised as well. For each compound, a stock solution with a concentration of c = 10−2 mol l−1 in acetonitrile was prepared. To initiate the reaction, 50 equivalents of DBU were added to 1 ml of the respective stock solution in a cuvette. After brief and thorough mixing, the progress was monitored over several scans, with each one requiring 45 seconds. The cuvette itself was not sealed to reduce oxygen deficiency. Overall, three distinctive sets of experiments were conducted: (a) duration and intensity of CL immediately after the addition of DBU without external excitation, (b) investigation of the new emitting species with external excitation after CL was finished and (c) excitation spectroscopy for the previously observed photoluminescence.
Since the NMR results of 3a and 3e indicate the consistent release of the corresponding thiolate from the CLPG, similar decomposition patterns and potent CL were anticipated for all derivatives. Fig. 3 presents the luminescence spectra of 3a. Initially, the CL exhibited an emission peak at 435 nm, which shifts constantly to 455 nm with significant intensity loss after the 10th scan (Fig. 3a), aligning with the NMR experiment. Subsequent excitation at 410 nm revealed a fluorescent species with an emission peak at 468 nm (Fig. 3b) and the corresponding excitation scan (Fig. 3c, λem = 465 nm) showed strong absorption at λmax = 411 nm.
 | ||
| Fig. 3 Emission and excitation spectra of 3a in acetonitrile (every scan took 45 s): (a) emission scans of CL (i.e. without external excitation, slit: 0.4), the arrow indicates the decrease in CL; (b) emission scan after CL was finished (external excitation λex = 410 nm, slit: 0.7); (c) excitation scan after CL was finished (λem = 465 nm, slit: 0.7). | ||
In the case of the protected aliphatic thiol derivative 3e, the CL maximum was centered around 446 nm (Fig. 4a, top). After the oxidation process is finished, a fluorescent species is produced emitting at 452 nm and showing a corresponding absorption at 407 nm (Fig. 4b and c, top). In a large-scale experiment (Fig. 4, bottom), the strong blue CL could be easily detected even in an illuminated room. After 5 minutes, the CL decreased and the solution appeared pink and eventually leads to an orange-coloured solution after 7 minutes. Fig. 5 displays the luminescence spectra of 3b–d. The CL emission of 3b peaks between 450 and 455 nm and was perceived to be weaker both visually and in terms of counts per second (Fig. 5a). This might originate from a CL quenching contribution from the aromatic thiolurethane group, which competes with the fluorescence and reduces the total CL but not the release rate of the thiolate group. The fluorescent species in this reaction has similar properties to 3a, emitting at 467 nm and an excitation scan showed an absorbance with a maximum at 409 nm (see ESI†).
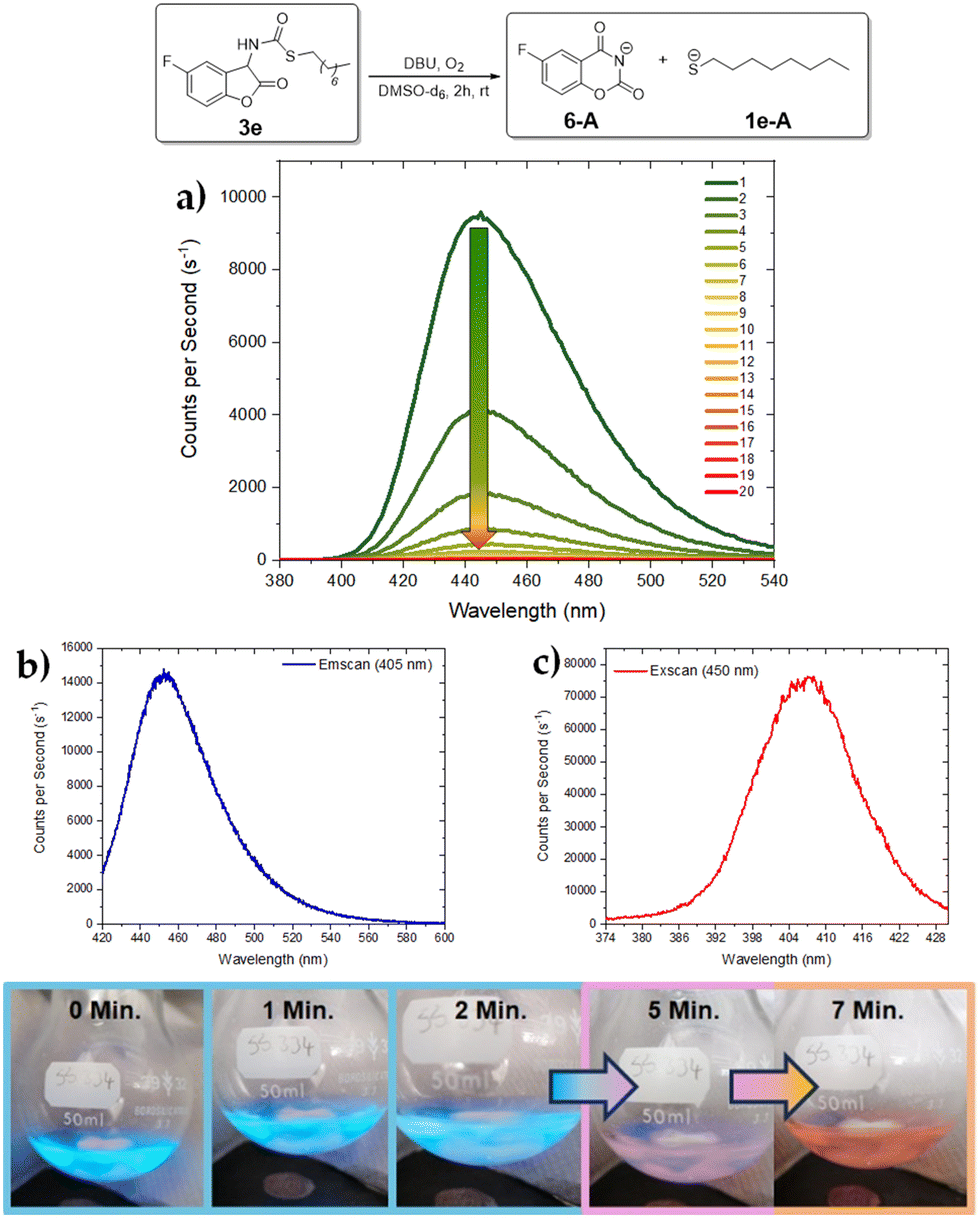 | ||
| Fig. 4 (top) Emission and excitation spectra of 3e in acetonitrile (every scan took 45 s): (a) emission scans of CL (i.e. without external excitation, slit: 0.2), arrow indicates the decrease in the CL; (b) emission scan of 3e after CL was finished (external excitation λex = 405 nm, slit: 0.5); (c) excitation scan of 3e after CL was finished (λem = 450 nm, slit: 0.5). (bottom) Photographs of the CL of coumaranone 3e (1.5 × 10⁻² M) in a round-bottom flask (50 mg were dissolved in 10 ml MeCN and 2 equivalents of DBU were added). | ||
 | ||
| Fig. 5 CL spectra of 3b–d in acetonitrile (every scan took 45 s): (a) emission scans of CL of 3b (i.e., without external excitation, slit: 0.2); (b) emission scans of CL of 3c (i.e., without external excitation, slit: 0.8); (c) emission scans of CL of 3d (i.e., without external excitation, slit: 0.2). The arrow indicates the decrease of CL. | ||
Comparison among the protected aliphatic thiol derivatives (3c to 3e) revealed a decrease in CL duration with longer alkyl side chains. As mentioned above, 3e's CL fades after 5 scans/4 minutes, while that of 3d remained for 7 scans/5 minutes (Fig. 5c). Derivative 3c exhibited the longest emission of CL lasting for 36 scans/27 minutes (Fig. 5b). In contrast, the CL maxima of all three derivatives are very similar, ranging from 443 to 446 nm. Additionally, emission and excitation scans of the fluorescent byproducts post-CL decay exhibited similar photophysical properties across all three derivatives as well.
Table 2 summarises the results of all luminescence experiments, exhibiting strong CL between 443 and 455 nm for each derivative, with variations in duration influenced by alkyl side chain length or aromatic system complexity. The generated fluorescent species demonstrated similar photophysical properties, with 3c showing the most variation in absorption and fluorescence maxima at 387 nm and 443 nm, respectively.
| Entry | CL λmax [nm] | CL intensity/duration | Abs./Fl. λmax [nm] |
|---|---|---|---|
| 3a | 435/453 | Bright/5 min | 411/468 |
| 3b | 450–455 | Bright/4 min | 409/467 |
| 3c | 443 | Very bright/30 min | 387/443 |
| 3d | 444 | Very bright/5 min | 415/450 |
| 3e | 446 | Very bright/4 min | 407/452 |
Following the release of the protected substrate, it is generally anticipated that a benzoxazinedione derivative (e.g.6-A) emerges as the final product (beside the released component), which was also observed in the reaction of thiolcarbamate–coumaranone 3e: this would lead to the assumption that it serves as the fluorescent species after CL is finished (Scheme 3). Additional theoretical calculations regarding its photophysical properties were conducted (see ESI†). The calculated data indicated that for efficient fluorescence, the terminal benzoxazinedione ought to be protonated.
 | ||
| Scheme 3 (top) Decomposition of coumaranone 3e with oxygen and DBU. The release of 1e-A and the byproduct of the benzoxazinedione 6-A could be verified by NMR as (bottom) benzoxazinedione in its protonated 6 and deprotonated state 6-A. | ||
Moreover, the absorption and emission maxima wavelengths calculated for the S0 → S1 and S1 → S0 transitions do not align with those of the fluorescent species detected after the oxidation of thiolcarbamate–coumaranone 3e. Consequently, it is plausible that a more improbable and different fragmentation process takes place that deviates from the mechanisms established in the literature and could be responsible for the formation of different fluorescent species.
With respect to the deprotection mechanism, the applied analytical methods make it possible to follow and comprehend the relevant steps of the overall process. The initiation via deprotonation can be traced via NMR, showing that the α-CH proton disappears as soon as DBU has been added (Scheme 4, 3-I). It is noteworthy that the signal of the NH-proton vanishes as well. After the formation of the peroxide anion 3-II and subsequent decarboxylation of the 1,2-dioxetanone intermediate 3-III, the emitting species 3-IV* can be tracked through its bright CL. The rate of thiolate release correlates with the leaving group ability (aromatic thiolates are faster) and also influences CL intensity and wavelength. The weaker CL emission for 3a,b can be due to an interaction between FG and the fluorophore, resulting in a stronger fluorescence quenching of 3-IV* (see Table 2). The degradation of all protected thiols also appears to be comparable to each other, as the photophysical properties of the detected fluorescent species do not show major differences, with the exception of the absorption maximum of the fluorescent species of 3c. It remains unknown which exact species is responsible for the obtained absorption and fluorescence values. Compound 6-A can be discarded as one potential option.
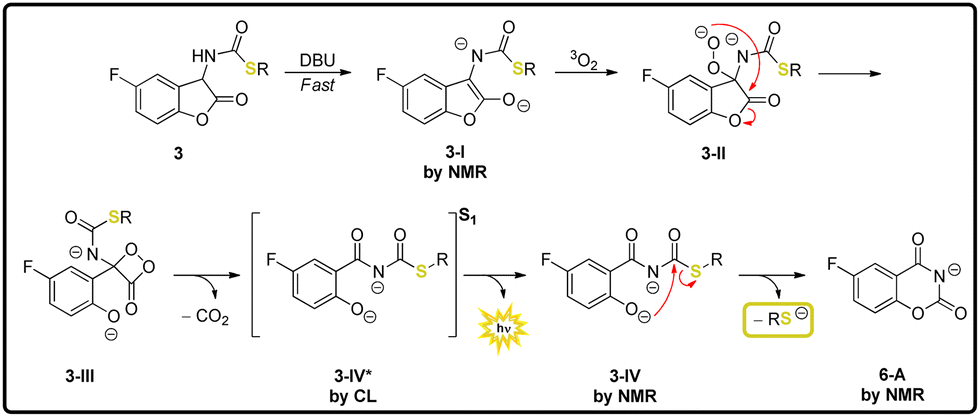 | ||
| Scheme 4 Proposal for the general mechanism of thiolcarbamate–coumaranones and the methods used for the reconstruction. | ||
Overall, thiolcarbamate–coumaranones represent a potent class of CLPG with bright blue/greenish CL that allow fast and efficient release of both aromatic and aliphatic thiols. Aromatic thiols are released faster, possibly due to a literature-described dark side reaction.16 Further insight was gained into the relationship between the duration and emission maximum of the CL and the potential nucleofuge. Recent applications of thiol-PGs concern the de-protection of thiols (especially cysteine)1,19 to allow a more facile synthesis of peptides, peptoides and proteins,20,21 and new chromatic orthogonal PRPGs.22–24 Considering the importance of thiols for antioxidant properties, the formation of disulfide bonds to stabilise protein structures, applications in chelation therapy and medicinal applications, the release of thiol-protected molecules via CLPGs could open up new opportunities for biological and medical research.
Data availability
The data supporting this article have been included in the ESI.†Conflicts of interest
There are no conflicts to declare.Notes and references
- T. W. Greene and P. G. M. Wuts, Protective Groups in Organic Synthesis, John Wiley & Sons, Hoboken, NJ, 5th edn, 2014 Search PubMed.
- S. Vidal, Protecting Groups: Strategies and Applications in Carbohydrate Chemistry, Wiley-VCH, Weinheim, Germany, New York, NY, USA, 1st edn, 2019 Search PubMed.
- K. Jarowicki and P. J. Kocieński, J. Chem. Soc., Perkin Trans. 1, 2001, 2109–2135 RSC.
- P. J. Kocieński, Protecting Groups: Foundations of Organic Chemistry, Thieme, Stuttgart, Germany, 3rd edn, 2005 Search PubMed.
- M. Schelhaas and H. Waldmann, Angew. Chem., Int. Ed. Engl., 1996, 35, 2056–2083 CrossRef CAS.
- P. Klan, et al., Chem. Rev., 2013, 113, 119–191 CrossRef CAS.
- P. Wang, Asian J. Org. Chem., 2013, 2, 452–464 CrossRef CAS.
- A. P. Pelliccioli and J. Wirz, Photochem. Photobiol. Sci., 2002, 1, 441–458 CrossRef.
- C. G. Bochet, J. Chem. Soc., Perkin Trans. 1, 2002, 125–142 CAS.
- A. G. Griesbeck, et al., Synthesis, 2017, 539–553 CAS.
- A. Herrmann, Photochem. Photobiol. Sci., 2012, 11, 446–459 CrossRef CAS.
- D. E. Falvey and C. Sundararajan, Photochem. Photobiol. Sci., 2004, 3, 831–838 CrossRef CAS.
- T. Lippold, et al., Photochem, 2023, 3, 373–389 CrossRef CAS.
- S. Schramm, et al., Arkivoc, 2015, 2015, 44–59 Search PubMed.
- S. Schramm, et al., Eur. J. Org. Chem., 2016, 678–681 CrossRef CAS.
- S. Schramm, et al., Phys. Chem. Chem. Phys., 2017, 19, 22852–22859 RSC.
- R. Graf, Chem. Ber., 1963, 96, 56–67 CrossRef CAS.
- B. Loev and M. F. Kormendy, J. Org. Chem., 1963, 28, 3421–3426 CrossRef CAS.
- R. J. Spears, et al., Chem. Soc. Rev., 2021, 50, 11098–11155 RSC.
- Y.-K. Qi, et al., Org. Biomol. Chem., 2016, 14, 4194–4198 RSC.
- X. Qiu, et al., RSC Adv., 2023, 13, 2483–2486 RSC.
- N. Kotzur, et al., J. Am. Chem. Soc., 2009, 131, 16927–16931 CrossRef CAS PubMed.
- J. A. Karas, et al., Chem. – Eur. J., 2014, 20, 9549–9552 CrossRef CAS PubMed.
- H. Yang, et al., ChemistrySelect, 2022, 7, 1–4 Search PubMed.
Footnote |
| † Electronic supplementary information (ESI) available. See DOI: https://doi.org/10.1039/d4cc06150k |
| This journal is © The Royal Society of Chemistry 2025 |