
 Open Access Article
 This Open Access Article is licensed under a
 Creative Commons Attribution 3.0 Unported Licence
Utilization of phenolic lignin dimer models for the quantification of monolignols in biomass and in its derived organosolv lignins via thioacidolysis and GC-MS analysis†
T. Tran
Ho
 *,
Olivia-Stella
Salm
,
Tiit
Lukk
and
Maria
Kulp
*,
Olivia-Stella
Salm
,
Tiit
Lukk
and
Maria
Kulp
Department of Chemistry and Biotechnology, Tallinn University of Technology, Akadeemia tee 15, 12618 Tallinn, Estonia. E-mail: thihol@taltech.ee; olivia-stella.salm@taltech.ee; tiit.lukk@taltech.ee; maria.kulp@taltech.ee
First published on 8th April 2025
Abstract
A thorough understanding of lignin's fundamental chemistry in lignocellulosic materials is essential for maximizing the efficiency of biorefineries. Thioacidolysis, followed by gas chromatography-mass spectrometry (GC-MS), has emerged as a reliable method for quantifying uncondensed monolignols, which are linked by labile aryl ether bonds within lignin network. However, the lack of commercially available pure thioethylated lignin monomers for GC analysis poses a challenge. This necessitates a multi-step synthesis process, which may not be feasible for all laboratories. We propose a novel approach that utilizes readily available phenolic lignin model dimers to establish a calibration curve for thioacidolysis quantification. These dimers, guaiacylglycerol-β-guaiacyl ether (GGE) and syringylglycerol-β-guaiacyl ether (SGE), upon thioacidolysis, yield thioethylated non-condensed guaiacyl (G) and syringyl (S) monomers. The GC-MS responses of these monomers are compared to those of bisphenol E, an internal standard (IS) to generate the calibration curve. This methodology exhibits excellent performance characteristics and was successfully employed to determine the thioethylated monomer contents and calculate of S/G ratios in three representative biomasses: aspen, barley straw, pine, and their organosolv lignin extracts.
1. Introduction
Lignin, a major constituent of plant biomass (15 to 36%), serves as a protective barrier against biological and chemical degradation by covalently crosslinking cellulose and hemicellulose.1 Lignin's backbone is primarily formed of three monolignols, each with varying methoxylation levels: p-hydroxyphenyl (H), guaiacyl (G), and syringyl (S) units. These monolignols are polymerized by radical coupling mechanism from the three fundamental monomers, p-coumaryl, coniferyl, and sinapyl alcohols, respectively (Fig. 1).1 The composition of lignin significantly differs based on botanical origin. Softwood lignin primarily derives from coniferyl and a minor portion of p-coumaryl and sinapyl monolignols,2 while hardwood lignin is synthesized from coniferyl and sinapyl units, with the latter being more prevalent. In contrast, non-woody biomass is characterized as an H–G–S type lignin, indicating the presence of all three monolignols.3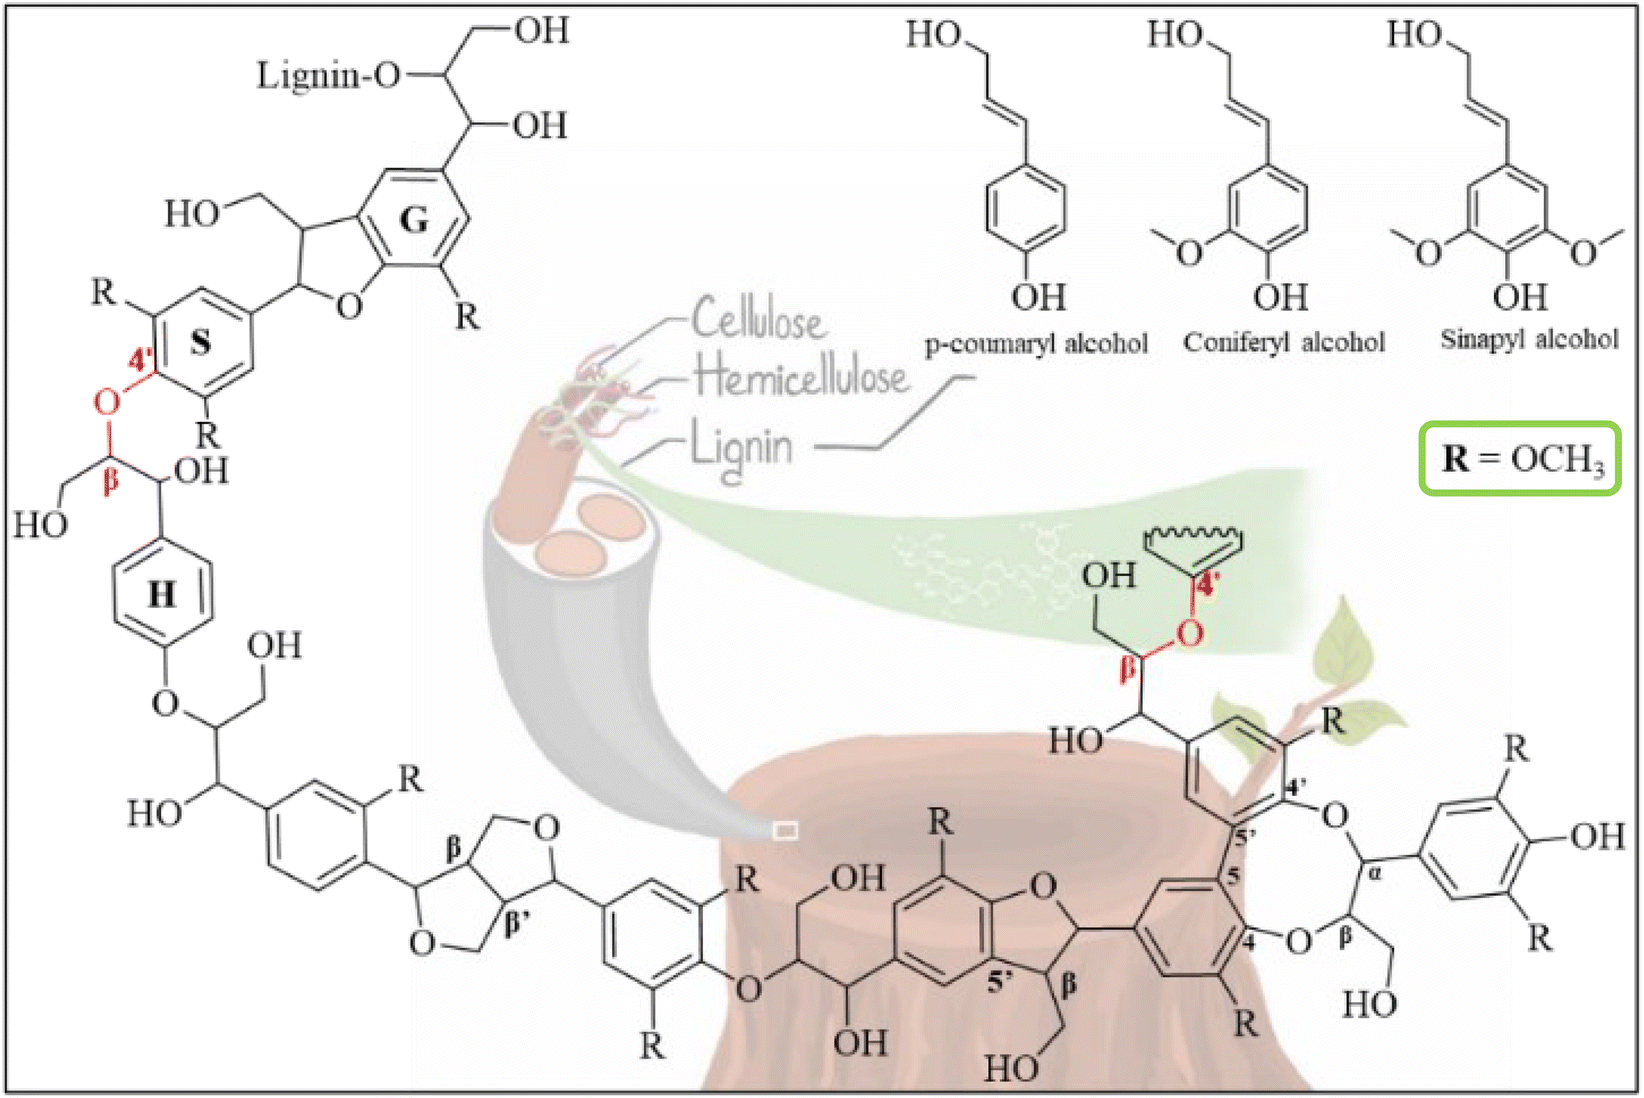 | ||
| Fig. 1 Lignin monolignol compositions and interunit bonding motifs. | ||
Lignin's macromolecular structure is crosslinked by distinct bonding motifs, including β-O-4′, β-β′, β-5′, and dibenzodioxocin, as illustrated in Fig. 1. The β-O-4′ aryl–ether bond, present in approximately 50% of spruce (softwood), and 60% of birch or eucalyptus (hardwood), is the most common of these linkages.4 During the fractionation of lignocellulosic biomass, lignin fragments are primarily released from the breakdown of these interunit linkages, altering the lignin structure.5–7 One of the consequences of this modification is the irreversible repolymerization or condensation in isolated lignin, leading to a higher proportion of condensed structures (C–C bond) compared to its native form.8,9 This undesirable reaction hampers the selective depolymerization of residual lignin into valuable phenolic monomers.10–12 Although organosolv delignification is a mild method for fractionating lignocellulose, it unavoidably alters lignin's structure.13,14 Considering lignin's variable composition and the inevitability of structural changes under specific pulping conditions, chemical analysis is an essential step prior to lignin valorization.
In recent decades, lignin chemistry has gathered significant attention from scientists seeking to decipher its complex structural network using a variety of analytical techniques. Among these, thioacidolysis followed by gas chromatography-mass spectrometry (GC-MS) has emerged as a prominent method for quantifying uncondensed monolignols. This technique, initially introduced by Lapierre in 1985 as a diagnostic test,15 employs a mixture of ethanethiol dissolved in 1,4-dioxane and boron trifluoride (BF3) etherate to efficiently and selectively depolymerize lignin into its constituent phenolic monomers (H, G, and S) which lack condensed structures and are interconnected by β-O-4′ bonds (Fig. 2a).15–17 The obtained non-condensed H/G/S ratios provide crucial information for the lignin-first strategy, which aims to preserve the aryl–ether bond for the subsequent conversion of lignin into valuable chemicals.11
 | ||
| Fig. 2 Thioacidolysis reaction scheme (a) and phenolic lignin model compounds (b). | ||
Since its inception, the original thioacidolysis protocol has undergone progressive refinement.18–23 Robinson and colleagues' modified the protocol by reducing the initial mass and thioacidolysis reagent by tenfold compared to the conventional method. This modification allowed for the processing of multiple samples simultaneously by facilitating the purification of thioehtylated monomers in a 5 mL screw-capped glass vial instead of a separatory funnel.18 Further advancements focused on miniaturizing the workup processes, including derivatization and liquid–liquid extraction, and replacing chlorinated solvents with ethyl acetate or diethyl ether.19,21 Harman-Ware introduced the innovative approach of Low Thermal Mass Modular Accelerated Column Heater (LTM MACH) coupled with gas chromatography-flame ionization detector (GC-FID), enabling results within five minutes per analysis.20 Additionally, the multi-reaction monitoring (MRM) mode of MS detectors has been developed, significantly enhancing the sensitivity for detecting monolignols down to the ppb concentration range.23 While these improvements have been addressed various aspects, the recovery of thioacidolysis-derived monomers through liquid extraction remains time-consuming. Fortunately, F. Chen's protocol eliminates this step without compromising the results.22
However, it is challenging to obtain authentic standard of lignin. To address this challenge, Yue et al.24 introduced a method that utilizes pure synthetic thioethylated monolignols and their relative response factors (RRFs) for GC-MS analysis. This approach allows for the quantification of lignin-derived monomers without the need for commercial standards. The RRF is calculated by using the concentration of the analyte and internal standard together with their peak areas, as below:24
 | (1) |
In this study, we propose phenolic lignin model compounds (LMCs) as the alternatives to authentic standards for thioacidolysis analysis that has not yet covered in literature.27 They are guaiacylglycerol-β-guaiacyl ether (GGE) and syringylglycerol-β-guaiacyl ether (SGE) (Fig. 2b), which closely mimic the non-condensed G and S subunits in lignin, respectively. Moreover, each of these LMCs is linked to another aromatic subunit via a β-O-4′ bond, a key structural feature of lignin. This structural resemblance and the thioacidolysis depolymerization selectivity (Fig. 2a) suggest that these chosen molecules can effectively represent a substantial portion of lignin during thioacidolysis reaction. By submitting the LMCs with varying concentrations to thioacidolysis without purification, the ratio of initial molar concentrations between GGE/SGE and IS are employed as the independent variable. Simultaneously, the peak areas of thioethylated monomers obtained from GC-MS are utilized as dependent variables to construct calibration curves. These calibration curves, in this instance, incorporate measurement uncertainty components including thioacidolysis depolymerization and derivatization reaction efficiency. As a result, they provide more reliable quantitative outcomes. Based on this approach, we predicted the non-condensed monolignols of lignin in three lignocellulosic biomass types: softwood (pine sawdust), hardwood (aspen chips), and non-woody (barley straw). We also examined those in organosolv lignin samples. Furthermore, the method was validated by evaluating its linearity range, limit of detection, precision, accuracy, and combined uncertainty parameters.
2. Materials and methods
2.1. Chemicals and materials
Guaiacylglycerol-β-guaiacyl ether (GGE, 97%, TCI, Tokyo), syringylglycerol-β-guaiacyl ether (SGE, 96%, BLDpharm, Germany). Pyridine (99.8%, anhydrous), bisphenol E (≥98%, analytical grade), boron trifluoride diethyl etherate (BF3), and ethanethiol (97%) were purchased from Sigma-Aldrich. 1,4-Dioxane (analytical grade, ≥99.8%, Fisher). N,O-Bis(trimethylsilyl)trifluoroacetamide containing 1.0% trimethylchlorosilane (BSTFA, 1.0% TMCS) was from Thermo Fisher Scientific, Germany.The biomass and organosolv lignin preparations were identical to those used in our previous study.28 In this study, the biomass was comminuted to a target size and sized by a 1 mm metal mesh. Both lignin samples that extracted by ethanol and 1,4-dioxane were investigated.
2.2. Thioacidolysis
Thioacidolysis protocol was adapted from F. Chen's publication with some changes in the use of glassware.22 Briefly, 2.0–3.0 mg of biomass or organosolv lignin (analytical balance, accuracy of 0.01 mg) was weighed into a 1.5 mL aluminum sealed-cap vial. Next, 1.0 mL of thioacidolysis reagent was pipetted into each vial and tightly sealed. These vials were placed in a preheated MULTIVAP (model JXDC-10, China) at 100 °C for 4 hours reaction, a quick vortex required every 1 hour. The mixture was left to cool down at room temperature. In the meantime, a set of 1.5 mL vials was prepared with 190.0 μL of saturated NaHCO3. The reaction was quenched by transferring 400.0 μL of reaction mixture into the vials containing NaHCO3 solution and mixing by pipette for two times. Prior to derivatizing with silylation agent for GC-MS analysis, these vials were dried under nitrogen gas stream at 55 °C on the same MULTIVAP assisted with gas distribution system. For preparation of calibration using LMCs, the same volume of thioacidolysis reagent was added into the vials containing the known amount of dried matter of LMCs and all the steps were carried out as identical to sample preparation. Each standard point was prepared with three parallels, while samples from lignocellulosic materials and their corresponding organosolv lignins were duplicated.
2.3. GC-MS analysis
The ready-made dried samples were each derivatized with 200.0 μL of BSTFA (1.0% TMCS)![[thin space (1/6-em)]](https://www.rsc.org/images/entities/char_2009.gif) :pyridine (1:1, v/v), at 55 °C for 30 min, a quick vortex required in the end. The volume of silylated sample was transferred by Pasteur pipette into the GC-vial containing a 400 μL micro insert, then, sealed. The GC-MS analysis was carried out with an Agilent Technologies 7890A instrument equipped with an Agilent 5975C VL mass selective detector (MSD), using electron ionization (EI) mode together with quadrupole mass analyzer. An ultra-inert split liner (Agilent Technologies, 5190-2295) was used. A Phenomenex ZB-5plus capillary column (30 m × ID 0.25 mm, film thickness 0.25 μm) was used to achieve the separation of thioethylated monomers. Helium was used as carrier gas with a flowrate of 1.3 mL min−1. The injection volume was 1.0 μL with a split ratio of 1:10.
:pyridine (1:1, v/v), at 55 °C for 30 min, a quick vortex required in the end. The volume of silylated sample was transferred by Pasteur pipette into the GC-vial containing a 400 μL micro insert, then, sealed. The GC-MS analysis was carried out with an Agilent Technologies 7890A instrument equipped with an Agilent 5975C VL mass selective detector (MSD), using electron ionization (EI) mode together with quadrupole mass analyzer. An ultra-inert split liner (Agilent Technologies, 5190-2295) was used. A Phenomenex ZB-5plus capillary column (30 m × ID 0.25 mm, film thickness 0.25 μm) was used to achieve the separation of thioethylated monomers. Helium was used as carrier gas with a flowrate of 1.3 mL min−1. The injection volume was 1.0 μL with a split ratio of 1:10.
The GC inlet temperature was kept at 250 °C. The oven temperature program started at 100 °C, held for 1 min, then increased to 300 °C at stepwise 25 °C min−1 and held for 3 min. The temperature of MSD transfer line, MS quadrupole, and ion source were set at 280 °C, 150 °C, and 230 °C, respectively. The ionization energy for EI mode operated at 70 eV. The signals were collected under a full scanning method in which the mass ranges from 30 to 500 m/z with solvent delay until 6.5 min. For quantification, the extracted ion chromatogram (EIC) was employed with characteristic fragments: 343 m/z for bisphenol E (IS), 269 m/z for thioethylated non-condensed G-derived monomers and 299 m/z for S-derived monomers. MSD ChemStation F.01.03.2357 software was used for integration.
2.4. Thioacidolysis method validation
The developed procedure was validated according to Eurachem validation guideline.29 The GC-MS method was evaluated for selectivity, limits of detection and quantification (LOD and LOQ), linearity, precision, and accuracy. Measurement uncertainty of the quantitative results was also assessed at a confidence level of 95%.Selectivity is defined as the ability of an analytical method to distinguish a target analyte from matrix components or other substances in the sample. Mass spectrometry is currently considered the most selective method for identifying compounds in complex mixtures using fragmentation patterns of their ions.30 In the present study, the identity of S and G thioethylated monomers presenting in biomass and organosolv lignin samples were confirmed by comparing the relative retention times of the analytes to those of thioethylated monomers released from LMCs with a time window of ±0.5%.30 The identity of the analytes was additionally approved by characteristic peak splitting due to the conformational isomer and mass fragments of G- and S-derived monomers.
Instrumental detection and quantification limits (IDL and IQL) were determined by calculating the ratio of the residual standard deviation of a regression line (the standard deviation of y-intercepts) and the slope, multiplied by 3.3 for IDL and 10 for IQL. Quantification limits of the thioacidolysis GC-MS procedure (LOQ) were calculated in μmol per g of lignin according to the methodology. For biomass analysis, LOQ was expressed per g of lignin, measured by Klason method.
Precision and trueness of the procedure were evaluated based on recovery of spiked samples (n = 8) on the barley straw matrix containing both G and S units. Trueness was expressed as the absolute difference (bias) between the experimental mean recovery and 100%, while precision was presented as relative standard deviation (RSD%). The recovery (R%) was calculated by taking the total concentration of analyte in spike sample (Crecovered, μmol) excluding the inherent amount of that in biomass matrix (Cnon-spiked, μmol), followed by comparing to the initial known spiked concentration (Cspiked, μmol) of LMCs (eqn (2)). The mean recovery was the average of eight individual spiked samples. The un-spike and spike samples were prepared in the same way as described in Section 2.2.
 | (2) |
3. Results and discussions
3.1. Calibration using lignin model compounds (LMCs)
Instead of synthesizing pure thioethylated monolignols for the determination of their relative response factors (RRFs), we explored the feasibility of using commercially available reference models (GGE and SGE) to create calibration curves for GC-MS quantification of uncondensed G and S subunits in lignin. This approach eliminates the need for tedious synthesis, work-up, and characterization of pure thioethylated monolignols, as reported previously.24 While the purification step of the final products can be bypassed by creating calibration curves rather than calculating absolute RRF values, the synthesis itself still requires certain expertise.20,23 Instead, our proposed approach for constructing the calibrations using LMCs offers several advantages: (i) LMCs are white powders, making them easier to handle and prepare compared to viscous, oily thioethylated products that requires high precision and accuracy;24 (ii) the conversion efficiency of LMCs is relatively stable or similar across the investigated dynamic range, ensuring consistent results; (iii) LMCs are dimers that mimic the β-O-4′ linking motif, making them more representative of lignin molecules for thioacidolysis depolymerization; (iv) this approach is readily applicable to various laboratories, particularly for routine analysis. In this study, the calculation of RRFs was not deemed favorable due to the inherent challenges of determining the precise thioacidolysis yield.Fig. 3 represents chromatograms of two derivatized thioethylated monomers released from model compounds (GGE and SGE), biomass and lignin samples. The stacked TIC chromatograms of the individual model substance (Fig. 3a and b) demonstrate clear separation of the chosen IS, S- and G-monomers released from LMCs. The impurity of LMCs may give rise to the unknown peak (marked as an asterisk), however it does not interfere or overlap with the main compounds. The ability to yield analytes of interest via thioacidolysis and no interfering degraded products, the chosen compounds were proved to be the best fit for uncondensed monolignols quantification. From the reported data of pure lignin-derived thioacidolysis monomers, the identity of the substances was firmly confirmed by their characteristic splitting peak shape due to the mixture of diastereomers, erythro and threo; and m/z values for the main fragments of thioethylated non-condensed G- and S-derived monomers, 269 m/z and 299 m/z, from their mass spectra, respectively (Fig. S1a and b†).24 The peak integration for quantitative analysis was relied on the extracted ion chromatogram (EIC) of these two quantitation ions for G- and S- units, with the relevance to the retention time on TIC. For the real samples, the relative retention times of the analytes (Fig. 3c–f) closely align those of the standards (Fig. 3a and b) with the average tolerances of 0.25 ± 0.02% for S-units and 0.11 ± 0.01% for G-units, satisfying the performance criteria requirements for confirmation GC-MS method (max. 0.5%).30
 | ||
| Fig. 3 TIC of: G – (a), and S – (b) derived thioacidolysis monomers, originated from phenolic lignin model compound, ethanol extracted lignin from barley straw (c), raw biomass barley straw (d), pine sawdust (e), aspen chips (f). | ||
Table 1 summarizes thioacidolysis GC-MS method performance characteristics. The plots of peak area ratios (S- and G-monomers to IS) versus molarity of LMCs demonstrated adequate linearity for the studied analytes with acceptable statistical parameters: coefficients of determination greater than 0.99 and regression error less than 7.5%. The high correlation coefficients of two calibrations achieved from LMCs (Fig. S2 and S3†) were comparable to those established from aryl glycerol monomers (R2 ≥ 0.99).20,23 These results confirm the feasibility of estimating monolignols by using the same sample preparation protocol.
| Compound | Linearity range (μm ml−1) | R 2 | Regression error (%) | IQLa (μg ml−1) | LOQ (μm g−1 of lignin) | Precision (RSD, %) | Trueness (%) |
|---|---|---|---|---|---|---|---|
| a IQL was expressed in mass units based on the base fragments of GGE and SGE, which are 269, 299 m/z, respectively. | |||||||
| G-Monomer | 0.25–3.10 | 0.9900 | 7.1 | 48.11 | 30.0 | 9.0 | 11.1 |
| S-Monomer | 0.11–2.82 | 0.9970 | 5.4 | 43.58 | 25.0 | 10.5 | 2.9 |
The estimation of IDL, IQL was calculated based on the concentration range close to zero (0.2–1.2 μmol mL−1 for G-monomer and 0.1–0.6 μmol mL−1 for S- monomer). The LOQ was expressed per g of lignin and obtained LOQ values ensured the quantitation of both monomers in original biomass and lignin samples. The precision of the thioacidolysis procedure (Table 1), based on parallel measurements of eight spiked samples and expressed in RSD% were both less than or equal to 10.5% for S- and G-monomer. Herein, for the first time, the recovery test based on biomass matrix was examined. The mean recoveries (n = 8) were obtained for G, 88.9% and S, 97.1%, reflecting the accuracy of entire process including thioacidolysis and derivatization performance. Standard deviation and RSD% obtained from recovery test were shown in Table S2.† This yielded estimates of combined uncertainty of the procedure around 10.9% for S-units and 14.3% for G-units, which confirms the reliability of the developed method. The validity of the method eases the monolignols quantification for lignin in the absence of authentic standards, which require time and costly synthetic procedure. By that the application of such is broaden and feasible for all the lignin-related analytical testing laboratories.
3.2. Thioacidolysis analysis of uncondensed monolignols in biomass and lignin
The developed calibrations were used to quantitatively determine the amount of uncondensed S and G monomers in three representative lignocellulosic biomasses: hardwood (aspen), softwood (pine), non-woody (barley straw), and their organosolv lignins. As expected, the lignin compositions vary depending on biomass type and change accordingly under specific pulping conditions, all of which are reflected in the results of thioacidolysis monomers yields, summarized in Table 2. As typical lignin's components for softwood, S-derived thioacidolysis monomers were quantified at small amount in pine (39.28 μmol g−1 of Klason lignin). Instead, the recovery yield of characteristic G units was detected at 1037 (μmol g−1 of Klason lignin), which was close to the reported value obtained by calculating based on the RRF, 1020 (μmol g−1 of Klason lignin).24 The monolignols ratio in hardwood aspen (P. tremula) S/G was 1.39, which was lower than previously reported 1.81,31 the variation was due to the difference in methodology, meanwhile the S-monomer content was 1334.7 (μmol g−1 of Klason lignin), which was in consistent with reported value 1260 (μmol g−1 of Klason lignin).31 In contrast, thioethylated S and G monomers were detected in lignin from barley biomass and are reported here for the first time with the ratio of S/G being 1.12. Notably, the abundance of these monomers was observed in aspen about 2300 μmol g−1 of Klason lignin, which was twice higher than in barley, 1017 μmol g−1 of Klason lignin. The difference in thioacidolysis yield was also dependent on the Klason lignin content of biomass (Table S1†).| Biomass | S (±SD) | G (±SD) | S/G | Organosolv lignin | S (±SD) | G (±SD) | S/G |
|---|---|---|---|---|---|---|---|
| Aspen | 1334.7 (±86.8) | 959.2 (±8.5) | 1.39 | EtOH | 902.2 (±3.83) | 339.1 (±23.9) | 2.66 |
| 1,4-Dioxane | 379.9 (±14.11) | 102.1 (±0.1) | 3.72 | ||||
| Barley | 538.4 (±111.6) | 478.6 (±11.4) | 1.12 | EtOH | 413.4 (±6.74) | 491.3 (±13.7) | 0.84 |
| 1,4-Dioxane | 109.1 (±1.66) | 39.3 (±6.2) | 2.77 | ||||
| Pine | 39.3 (±0.3) | 1037.4 (±201.5) | 0.04 | EtOH | 36.5 (±3.9) | 801.5 (±8.8) | 0.05 |
| 1,4-Dioxane | 34.2 (±2.5) | 174.7 (±14.4) | 0.20 |
For comparison purposes, thioacidolysis analyses were also conducted on organosolv lignin extracted from the same lignocellulosic materials. The results (Table 2) support two key observations: (i) β-O-4′ cleavage is the primary mechanism driving organosolv delignification; (ii) repolymerization or condensation is unavoidable when organosolv pulping is performed in dilute acid environment.32 As a result of these processes, the total amount of uncondensed monolignols (S and G) connected by aryl ether bonds decreases for both solvent systems. Additionally, it is noteworthy that the recovery rates of thioacidolysis S and G monomers were higher for all ethanol organosolv-based lignins compared to dioxane lignins. In other words, acidic ethanol pulping conditions proved to be more effective in preserving lignin's native structure (β-O-4′ bond) for subsequent chemical valorization. These thioacidolysis findings are consistent with our observations of 2D-heteronuclear single quantum coherence (HSQC) data where the abundance of aryl–ether bond cross peaks drastically decreased when using 1,4-dioxane as solvent.28 It was evident that the thioacidolysis protocol was efficient to analyze highly condensed lignin structure as it was in the case of 1,4-dioxane-extracted lignins.
4. Conclusions
This study introduces the use of lignin model compounds as reference substances for thioacidolysis analysis of uncondensed monolignols, offering an alternative to the traditional method of synthesizing the pure aryl glycerol monomers. This approach is highly adaptable to various laboratories, as it eliminates the need for elaborate synthesis and characterization steps. The obtained calibration curves exhibit efficient linear regression coefficients within the dynamic range, demonstrating the suitability of lignin model compounds for analysis. Applying the calibrations enabled the quantification of thioacidolysis non-condensed S and G monomers contents in three lignocellulosic biomasses and their corresponding organosolv lignin products, yielding results that are consistent with our previous study and literature. These quantification outcomes provide a comprehensive understanding of the variation in lignin composition and unveil the relationship between lignin’ structural behavior under various treatment conditions. Nevertheless, our study was unable to verify some unknown degraded products released from LMCs, which could be further investigated for a better understanding whether it comes from the intrinsic impurity of the standards themselves or other causes.Data availability
The data supporting this article has been included as part of the main article and the ESI.†Author contributions
Tran T. Ho: methodology, investigation, formal analysis, visualization, writing – original draft preparation, writing – review and editing. Olivia-Stella Salm: investigation, writing – review and editing. Tiit Lukk: writing – original draft preparation, funding acquisition, supervision. Maria Kulp: conceptualization, methodology, supervision, validation, writing – original draft preparation, writing – review and editing. All authors read and approved the final manuscript.Conflicts of interest
The authors declared there are no competing interests.Acknowledgements
This study was supported by ERDF and Estonian Research Council via RESTA11 and TemTA49.References
- R. Whetten and R. Sederoff, Plant Cell, 1995, 7, 1001–1013 CrossRef CAS.
- A. V. Faleva, A. Y. Kozhevnikov, S. A. Pokryshkin, D. I. Falev, S. L. Shestakov and J. A. Popova, J. Wood Chem. Technol., 2020, 40, 178–189 CAS.
- L. Yao, H. Yang, X. Meng and A. J. Ragauskas, Front. energy res., 2022, 9, 804086 Search PubMed.
- J. Zakzeski, P. C. A. Bruijnincx, A. L. Jongerius and B. M. Weckhuysen, Chem. Rev., 2010, 110, 3552–3599 CAS.
- E. I. Evstigneyev and S. M. Shevchenko, Wood Sci. Technol., 2020, 54, 787–820 CAS.
- H. Yang, C. G. Yoo, X. Meng, Y. Pu, W. Muchero, G. A. Tuskan, T. J. Tschaplinski, A. J. Ragauskas and L. Yao, Bioresour. Technol., 2020, 295, 122240 CrossRef CAS PubMed.
- M. R. Sturgeon, S. Kim, K. Lawrence, R. S. Paton, S. C. Chmely, M. Nimlos, T. D. Foust and G. T. Beckham, ACS Sustain. Chem. Eng., 2014, 2, 472–485 CAS.
- V. Patil, S. Adhikari, P. Cross and H. Jahromi, Renewable Sustainable Energy Rev., 2020, 133, 110359 CAS.
- K. H. Kim and C. S. Kim, Front. Energy Res., 2018, 6, 1–7 Search PubMed.
- P. J. Deuss, C. S. Lancefield, A. Narani, J. G. De Vries, N. J. Westwood and K. Barta, Green Chem., 2017, 19, 2774–2782 CAS.
- T. Renders, S. Van Den Bosch, S. F. Koelewijn, W. Schutyser and B. F. Sels, Energy Environ. Sci., 2017, 10, 1551–1557 CAS.
- S. Wang, W. X. Li, Y. Q. Yang, X. Chen, J. Ma, C. Chen, L. P. Xiao and R. C. Sun, ChemSusChem, 2020, 13, 4548–4556 CrossRef CAS PubMed.
- R. El Hage, N. Brosse, P. Sannigrahi and A. Ragauskas, Polym. Degrad. Stab., 2010, 95, 997–1003 CrossRef CAS.
- C. G. Yoo, X. Meng, Y. Pu and A. J. Ragauskas, Bioresour. Technol., 2020, 301, 122784 CrossRef CAS PubMed.
- C. Lapierre, B. Monties, C. Rolando, C. Lapierre, B. Monties and C. Rolando, J. Wood Chem. Technol., 1985, 5, 277–292 CrossRef CAS.
- C. Lapierre, B. Monties and C. Rolando, Holzforschung, 1986, 113, 113–118 CrossRef.
- C. Rolando, B. Monties and C. Lapierre, Res. Chem. Intermed., 1995, 21, 397–412 CrossRef.
- A. R. Robinson and S. D. Mansfield, Plant J., 2009, 58, 706–714 CrossRef CAS PubMed.
- M. Yamamura, T. Hattori, S. Suzuki, D. Shibata and T. Umezawa, Plant Biotechnol., 2012, 29, 419–423 CrossRef CAS.
- A. E. Harman-Ware, C. Foster, R. M. Happs, C. Doeppke, K. Meunier, J. Gehan, F. Yue, F. Lu and M. F. Davis, Biotechnol. J., 2016, 11, 1268–1273 CrossRef CAS PubMed.
- Q. Qi, J. Hu, L. Qu, X. Jiang, Y. Gai, S. A. Valenzuela and L. Qi, MethodsX, 2019, 6, 2592–2600 CrossRef CAS PubMed.
- F. Chen, C. Zhuo, X. Xiao, T. H. Pendergast and K. M. Devos, Biotechnol. Biofuels, 2021, 14, 1–9 CrossRef PubMed.
- L. Yang, J. Wang, C. Wang, F. Yue and F. Lu, Holzforschung, 2022, 76, 604–610 CrossRef CAS.
- F. Yue, F. Lu, R. C. Sun and J. Ralph, J. Agric. Food Chem., 2012, 60, 922–928 CrossRef CAS.
- T. Capoun and J. Krykorkova, J. Anal. Methods Chem., 2020,(1) DOI:10.1155/2020/8857210.
- A. Korban, R. Čabala, V. Egorov, Z. Bosáková and S. Charapitsa, Talanta, 2022, 246, 123518 CrossRef CAS PubMed.
- C. W. Lahive, P. C. J. Kamer, C. S. Lancefield and P. J. Deuss, ChemSusChem, 2020, 13(17), 4169–4770 CrossRef PubMed.
- J. Piia, T. T. Ho, U. Kallavus, A. Konist, K. Leiman, O. Salm, M. Kulp, M. Koel and T. Lukk, Materials, 2022, 15(8), 2861 CrossRef.
- In Eurachem Guide: The Fitness for Purpose of Analytical Methods: A Laboratory Guide to Method Validation and Related Topics, ed. B. Magnusson and U. Örnemark, 2nd edn, 2014 Search PubMed.
- European Commission, Off. J. Eur. Communities, 2002 Search PubMed.
- M. Christiernin, A. B. Ohlsson, T. Berglund and G. Henriksson, Plant Physiol. Biochem., 2005, 43, 777–785 CrossRef CAS PubMed.
- J. Bergrath, J. Rumpf, R. Burger, X. T. Do, M. Wirtz and M. Schulze, Macromol. Mater. Eng., 2023, 308, 2300093 CrossRef CAS.
Footnote |
| † Electronic supplementary information (ESI) available. See DOI: https://doi.org/10.1039/d5ay00073d |
| This journal is © The Royal Society of Chemistry 2025 |