
 Open Access Article
 This Open Access Article is licensed under a Creative Commons Attribution-Non Commercial 3.0 Unported Licence
Functional regression for SERS spectrum transformation across diverse instruments†
Tao
Wang‡
 a,
Yanjun
Yang‡
b,
Haoran
Lu
a,
Jiaheng
Cui
c,
Xianyan
Chen
d,
Ping
Ma
*a,
Wenxuan
Zhong
*a and
Yiping
Zhao
*b
a,
Yanjun
Yang‡
b,
Haoran
Lu
a,
Jiaheng
Cui
c,
Xianyan
Chen
d,
Ping
Ma
*a,
Wenxuan
Zhong
*a and
Yiping
Zhao
*b
aDepartment of Statistics, Franklin College of Arts and Sciences, University of Georgia, Athens, Georgia 30602, USA. E-mail: pingma@uga.edu; wenxuan@uga.edu
bDepartment of Physics and Astronomy, Franklin College of Arts and Sciences, University of Georgia, Athens, Georgia 30602, USA. E-mail: zhaoy@uga.edu
cSchool of Electrical and Computer Engineering, College of Engineering, The University of Georgia, Athens, GA 30602, USA
dDepartment of Epidemiology & Biostatistics, College of Public Health, The University of Georgia, Athens, GA 30602, USA
First published on 4th December 2024
Abstract
Surface-enhanced Raman spectroscopy (SERS) holds remarkable potential for the rapid and portable detection of trace molecules. However, the analysis and comparison of SERS spectra are challenging due to the diverse range of instruments used for data acquisition. In this paper, a spectra instrument transformation framework based on the penalized functional regression model (SpectraFRM) is introduced for cross-instrument mapping with subsequent machine learning classification to compare transformed spectra with standard spectra. In particular, the nonparametric forms of the functional response, predictors, and coefficients employed in SepctraFRM allow for efficient modeling of the nonlinear relationship between target spectra and standard spectra. In the leave-one-out training and test of 20 analytes across four instruments, the results demonstrate that SpectraFRM can provide interpretable corrections to peaks and baseline spectra, leading to approximately 11% error reduction, compared with original spectra. With an additional feature extraction step, the transformed spectra outperform the original spectra by 10% in analytes identification tasks. Overall, the proposed method is shown to be flexible, robust, accurate, and interpretable despite varieties of analytes and instruments, making it a potentially powerful tool for the standardization of SERS spectra from various instruments.
Introduction
Surface-Enhanced Raman Spectroscopy (SERS) has emerged as a powerful tool for sensing and imaging, offering exceptional sensitivity for the detection of molecules at low concentrations.1 The enhancement is achieved through the interaction of molecules with nanostructured metal surfaces, providing exquisite sensitivity, and allowing the detection of trace amounts of substances.2–7 The field of SERS has witnessed significant advancements since the 1990s, facilitating various applications such as biomedical diagnostics, environmental monitoring, security & defense, drug analysis, and many others.8–12 However, the diversity in instrumentation and substrates used for measuring SERS spectra across different laboratories poses substantial challenges in spectral comparison and analysis. Instruments vary in their response functions, resolutions, and step sizes, introducing discrepancies in acquired spectra. On the other hand, SERS spectra measured by similar instruments across different locations vary which highlights the need for proper benchmarking.13,14 These variations hinder the establishment of a standardized spectral database and complicate the comparison of SERS data obtained from different sources. Addressing these challenges is crucial for achieving consistent and reliable SERS measurements. In addition, the integration of machine learning techniques into SERS spectra analysis introduces a novel dimension to the field,15–17 but it raises critical challenges in cross-instrument applicability. As researchers increasingly leverage machine learning algorithms for classification and quantification, the challenge emerges in adapting SERS spectra databases obtained from one instrument for use with other instruments. This requires careful consideration of the inherent variations between instruments to ensure accurate and transferable machine learning models.So far, there are a few reports on instrument spectral mapping, and in general, two different strategies have been employed. One strategy focuses on Raman spectra transformation via spectral standardization across different instruments. Weatherall et al. performed spectral location correction and amplitude scaling via linear regression to convert high-resolution laboratory Raman spectra to be compatible with the spectral library of a portable spectrometer.18 Rodriguez et al. proposed a method that integrated established Raman shift correction and intensity normalization procedures with an additional step for aligning spectral resolution.19 These methods either impose potentially underfitting linear relationship between wavenumbers and the shift in location and amplitude, which may not be realistic under all circumstances, or heavily rely on previously established Raman shift provided by spectrometers vendors. The other strategy of instrument spectral mapping is based on the classification of SERS spectra from one instrument aided by knowledge learned from the spectra of another. Mishra et al. introduced deep calibration that transferred a deep learning model made on one instrument to a new instrument.20 Ju et al. reported a machine learning-based method capable of identifying chemicals by calculating characteristic peak similarity that measured the similarity between characteristics peaks of SERS spectra and standard Raman spectra.21 Nevertheless, none of these papers provide spectra transformation, which makes the models difficult to interpret.
Nevertheless, the aforementioned works reflect the current challenges associated with instrument-dependent variations in SERS spectra and the need for standardized approaches for cross-instrument identification. Standardizing measurement protocols and creating a universal spectral database would enhance the comparability of SERS data, yet the ability to map SERS spectra from one instrument to another can take advantage of a known spectral library, significantly saving time and effort. Opportunities lie in the development of robust cross-instrument standards, optimization of instrumentation parameters, and the integration of machine learning algorithms tailored to accommodate instrument-specific variations.
In this paper, we leverage the power of penalized functional regression22,23 to develop a novel framework, Spectra instrument transformation via Functional Regression Model (SpectraFRM), for cross-instrument mapping. SpectraFRM enables robust and flexible spectra transformation that accounts for the complicated nonlinear relationship between spectra from a standard instrument and a target instrument.24 Functional regression is designed to conduct regression analysis between continuous curves (functional data) where response, predictors, and coefficients are all represented by functions.22 Moreover, the forms of functional coefficients that depend on the choice of basis functions are flexible, allowing functional regression to model the nonlinear transformation between functional response and functional independent variables. Furthermore, the smoothness penalty enables the regularization of coefficient functions to avoid overfitting.25
SpectraFRM transforms the spectra of target instruments to pseudo-spectra of a standard instrument via penalized functional regression with subsequent curve smoothing. The method is validated by comparing pseudo-spectra with standard spectra via machine learning classification models. It is shown that this transformation procedure can make corrections in shifts of peak magnitude and locations in baseline and fingerprint spectrum between two different instruments which lead to about 11% decrease in MAE, compared with original spectra. After applying the smoothening technique and feature extraction on transformed spectra, compared with the original spectra, around a 10% increase in classification accuracy of analytes is achieved.
Experimental methods
SERS spectra collection
Silver nanorod (AgNR) arrays were prepared by the oblique angle deposition, and the detailed preparation procedure can be found in previous reports,26–29 see Section S1 in ESI.† The SERS spectra were taken from bacterial biomarkers, endotoxins, and references for the SERS spectra collection. The sources of above samples and corresponding abbreviations can be found in Table S1 of ESI.† These samples were diluted into 100 mg mL−1 using pure water (Sigma-Aldrich). 2 mL of the diluted sample was dispensed onto the AgNR substrate and air dried at 20 °C. SERS spectra were collected from 4 different Raman instruments: one laboratory-based system, Renishaw, and three portable systems, Tec5, First Defender, and Rapid ID (RID). The specifications of the 4 Raman systems are outlined in Table S2 of ESI.† For the same analyte and the same Raman instrument, 450 to 500 SERS spectra were collected from multiple randomly selected locations from the AgNR substrates. The detailed SERS measurement conditions are listed in Table 1.| Raman instrument | Laser wavelength (nm) | Laser power (mW) | Beam diameter (μm) | Acquisition time (s) | Lens | Spectral step (cm−1) |
|---|---|---|---|---|---|---|
| Renishaw | 785 | 9.0 | 75 × 25 μm2 | 10 | 5× | Ununiform interval |
| Tec5 | 785 | 32.3 | 100 | 2 | Default | 1 |
| First defender | 785 | 15.2 | 100 | 5 | Default | Ununiform interval |
| Rapid ID (RID) | 785 | 9.1 | 100 | 3 | Default | Ununiform interval |
SERS preprocessing
Considering the variability in SERS spectra obtained from different Raman instruments, SERS spectra preprocessing is implemented. A typical preprocessing procedure includes spectra despiking for cosmic rays and baseline correction using airPLS.30 In addition, the SERS spectra from different spectra wavenumber ranges and steps are cropped from 400 to 1800 cm−1 and interpreted with a 1 cm−1 step. Finally, area normalization is applied for each spectrum for further analysis.Functional regression method (FRM)
In order to map and compare the SERS spectra from two different instruments, a functional regression model plus subsequent machine learning classification is proposed. The entire procedure is shown in Fig. 1. The process begins by selecting a set of training spectra from both a standard instrument and a target instrument, measured on the same analytes with known label information (total analytes: N). This dataset is used to fit a functional regression model that maps spectra from the target instrument to the standard instrument (Step 1). Using this model, test spectra of unknown analytes from the target instrument (target testing spectra) are transformed into pseudo-spectra as if measured by the standard instrument (Step 2). Classification models, trained on normalized and feature-extracted standard spectra (Step 3) as shown in Fig. 1, are then used to compare the feature-extracted pseudo-spectra from the target instrument against the standard instrument's spectral database to identify the analytes (Step 4). Notably, label information for the test target spectra is only required for comparing classification results in Step 4, not during spectra transformation in Step 2. | ||
| Fig. 1 Workflow of spectra transformation and classification procedure. Step 1: functional regression training. Step 2: pseudo-spectra transformation. Step 3: classification models training in a standard spectral database. Step 4: comparison between standard and transformed spectra. | ||
In each cross-validation iteration, Steps 1 and 2 are repeated to fit the functional regression model and generate pseudo-spectra based on the current training and testing target spectra. Since the standard spectra are always available, Step 3 (classification model training) remains unchanged regardless of the training/testing split of the target spectra. Conceptually, if the transformed spectra more closely resemble the standard spectra than the original spectra do, the classification models should achieve higher accuracy on the transformed spectra. Therefore, in Step 4, the transformed spectra from each cross-validation iteration are evaluated against the standard spectra using the classification models from Step 3 to identify the analyte type.
The above process is based on the general SERS measurement principle. The SERS spectrum of any analyte from a particular instrument j can be written as31
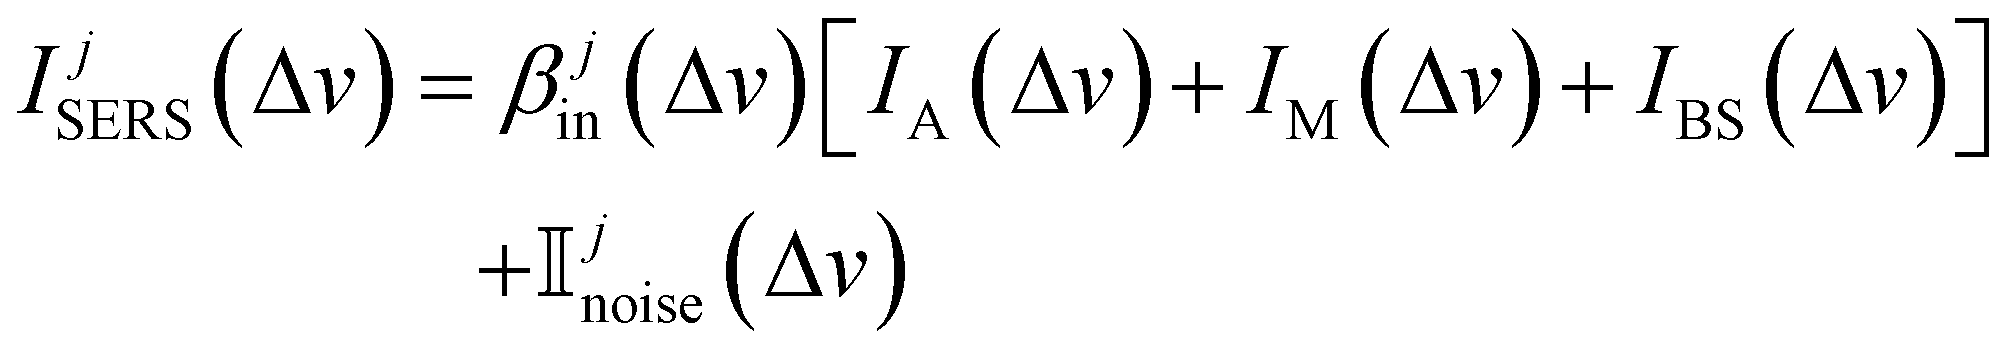 | (1) |
In this study, we propose remove the instrument effects via functional regression. Instead of directly estimating βjin(Δv) and Ijnoise(Δv) for a specific instrument j, we focus on estimating the difference of electronic noise between two instruments and ratio of two instruments’ response functions. Let's consider the SERS spectra measured by Renishaw to be the standard. We aim to map the SERS spectra from other target instruments, i.e., RID, First Defender, and Tec5, to the spectra of Renishaw, and then carry out spectral/analyte identification. Let IRSi(Δv) represents the average SERS spectrum of analyte i measured by Renishaw, and Iji(Δv) is the average SERS spectrum of analyte i measured by a target instrument j, with j ∈ {RID, First Defender, Tec5}. Let βj1(Δv) = IRSnoise(Δv) − Ijnoise(Δv)βRSin(Δv)/βjin(Δv) and βj2(Δv) = βRSin(Δv)/βjin(Δv) which represent the difference between adjusted instrument-dependent electronic noise and ratio between standard and target instruments response functions respectively, based on eqn (1), we propose the functional regression model
| IRSi(Δv) = βj1(Δv) + βj2(Δv)Iji(Δv) + ei(Δv), for i = 1, 2, …, N | (2) |
 and
and  , one can estimate βj1(Δv) and βj2(Δv) by minimization of the following penalized least-square functional33
 | (3) |
Once both βj1(Δv) and βj2(Δv) are estimated, they will be used to transform any spectrum Iji(Δv) of analyte i measured by an instrument j to a pseudo-spectrum ĨRSi(Δv) for Renishaw,
 | (4) |
After transformation, many ĨRSi(Δv) were still found to be noisy and thus were further smoothened by fitting a cubic smoothing spline. After normalization, ĨRSi(Δv) can be directly compared to IRSi(Δv).
Machine learning (ML) models for validation
One way to validate SpectraFRM is to classify the pseudo-spectra using the classification models trained with a standard spectral database in Renishaw. If SpectraFRM correctly maps spectra from a target instrument to the standard instrument, the classification models trained by the standard spectral database can easily predict the label of the pseudo-spectra. Here, we employed both convolutional neural network (CNN)34 and support vector machine (SVM).35,36 The CNN model architecture used for all three instruments is illustrated in Fig. 2 and includes the following components: an input layer, a residual block with four 1-D convolutional layers, four additional 1-D convolutional layers, a flatten layer, and a fully connected layer. To allow a single CNN model, trained on the standard instrument (Renishaw), to be applied across all three target instruments, the CNN model structure is kept uniform. Specifically, each convolutional layer in the residual block has a kernel size of 3 and a filter size of 64, with a Rectified Linear Unit (ReLU) activation function. The first convolutional layer following the residual block has a kernel size of 7 and a filter size of 64, while subsequent convolutional layers have a kernel size of 3 and a filter size of 64. Additionally, each convolutional layer after the residual block is followed by a batch normalization layer. The fully connected layer contains 100 nodes, followed by a dropout layer with a rate of 0.5. | ||
| Fig. 2 The CNN architecture with one residual block. | ||
As for the SVM model, a radial basis function (RBF) kernel was chosen. The cost parameter was selected via a 10-fold cross-validation to optimize the classification performance, while the gamma parameter was set as default, which is the reciprocal of the length of the input spectra.
Feature extraction and training of ML models
To shorten the processing time, capture the main spectra signatures, and build a more reliable algorithm, before processing the spectral data with ML, we first extracted the spectral features Δvf from the experimental spectra. In SERS spectra, only the peak locations represent the fingerprint information of the target analyte. Therefore, for limited analytes, we only need the intensity information from the characteristic peaks presented in the spectra. The following procedure was used to determine the threshold values to select the characteristic wavenumber features: based on the statistics, the mean of the average normalized Renishaw spectra of 20 analytes equals to 0.2, and the corresponding standard deviation is also 0.2. Therefore, the threshold value is determined as 0.4, i.e., the mean of the average normal spectrum plus 1 standard deviation. An intensity that is above the threshold value will be detected as a peak if it is preceded by three ascending intensities and followed by three descending intensities.37Fig. 3a–c shows selected peaks on the normalized spectra of LTA, E. coli, and P. aeruginosa, respectively. For spectra of LTA shown in Fig. 3a, only the peaks at Δvf = 1335 and 1611 cm−1 are larger than the threshold value (≈0.4). Therefore, these two peak locations are characterized as Δvf. For E. coli (Fig. 3b), four peaks at Δv = 1238, 1359, 1470, and 1611 cm−1 are identified as Δvf; and for P. aeruginosa (Fig. 3c), Δvf = 418, 548, 1357, 1606, and 1621 cm−1. Fig. S5† summarizes all the featured peaks from the SERS spectra of 20 analytes measured by Renishaw. After going through all 20 spectra, a total of 77 feature peaks/wavenumbers are identified. A featured spectrum based on the 77 featured wavenumbers can be obtained by extracting the corresponding spectral intensities on a normalized spectrum, as shown in Fig. 3d for the average β-carotene spectrum. These featured-extracted spectra are fed into the classification model (Fig. 1 Step 2 and Step 3). | ||
| Fig. 3 (a)–(d). The feature peak location extraction from Renishaw spectra of (a) LTA, (b) E. coli, and (c) P. aeruginosa, and (d) union of selected peaks on spectra of β-carotene. The dashed lines in (a)–(c) indicate the threshold value and red dots represent Δvf locations. | ||
ML models were then trained on featured extracted normalized spectra from the standard instrument. Due to variations in sample sizes among analytes, models trained with all the spectra of each analyte may find it more difficult to classify analytes with smaller sample sizes compared to those with larger samples. Thus, to avoid using an imbalanced training dataset, 144 spectra from the Renishaw instrument were randomly selected for each analyte, matching the number of the least represented analyte in the dataset. This approach yielded a training set comprising 20 distinct classes, each with 144 feature-extracted spectra of length 77, and a total of 2880 spectra. The CNN and SVM models were then trained with this pre-processed spectral training set.
For the CNN models, an exponential decay learning rate schedule was adopted, starting with an initial rate of 0.005, and including a decay factor of 0.96 applied every 1500 training steps. The Adamax optimizer38 was chosen for its adaptive learning rate properties. Training employed the sparse categorical cross-entropy loss function, which is suitable for multi-class classification tasks. The training strategy involved strategically adjusting the learning rate to guide optimization while utilizing an adaptive optimizer and an appropriate categorical loss function, ultimately contributing to the model's convergence and performance in classification tasks.
Results and discussion
Spectral comparison for different instruments
By comparing the spectra of the same analytes measured by four instruments, we observe that while there is a relatively consistent global pattern among spectra of the same analyte measured by different instruments, variations in the locations and magnitudes of peaks are commonly observed in local regions. In moderate cases, a few peaks significantly differ among measurements by various instruments. The variations of SERS spectra can be attributed to two main factors. First, different instruments may vary in their setup, including the gratings, detectors, and optical components they use, all of which influence the quality and characteristics of the collected spectral data. Variations in grating types (e.g., groove density) impact spectral dispersion and intensity, with higher-density gratings typically enhancing spectral resolution. This increased resolution allows for better separation of closely spaced Raman peaks, which may be less distinguishable in instruments with lower resolution. Detectors, such as CCDs, also vary in sensitivity, affecting how efficiently signals are captured and the associated noise levels. High-quantum-efficiency detectors are more effective at specific wavelengths, enhancing detection at those points. Additionally, differences in lenses, mirrors, and optical path designs impact the efficiency of scattered light collection, where misalignments can lead to signal loss and distortions in spectral profiles. Second, the measurement conditions may vary for different instruments. Variations in laser power, for instance, can alter the intensity of the Raman signal and slightly affect the spectral shape. Similarly, differences in laser spot size and focus impact the number of molecules excited, which in turn influences signal strength and can potentially modify the spectral profile. Choices in data acquisition, such as integration time, also impact signal quality. While longer integration times boost signal intensity, they can also amplify noise, affecting the final spectra. For instance, the E. coli O128B12 spectra of all four instruments shown in Fig. 4a present multiple peaks between Δv = 400–1800 cm−1, and the overall spectral patterns for all instruments are quite similar. Yet some detailed patterns of these peaks vary: the First Defender and Tec5 each show only one peak around the Δv = 1600 cm−1, whereas the other two instruments display two, resulting in a total mismatch of peak locations and magnitude (indicated with dashed lines). In more severe cases, many peaks of the same analyte display notable deviations in both location and magnitude when measured by four different instruments. For instance, take the Δv ≈ 1400 cm−1 peak of the analyte M. catarrhalis shown in Fig. 4b as an example. This peak is presented in all the spectra; however, the normalized intensity of the peak measured by the RID, Tec5, and First Defender is much smaller than that of the peaks recorded by Renishaw. Furthermore, this peak of Tec5 and First Defender appears at a slightly lower wavenumber, thereby indicating a disparity in the position of the spectral peaks. Many other peaks also show both the amplitude change and the shifts of the peak wavenumbers, as shown in Fig. 4b when measured by different instruments. | ||
| Fig. 4 (a) and (b). Baseline-removed, normalized, and average spectra of (a) E. coli O128B12 and (b) M. catarrhalis measured by Renishaw (black), RID (red), Tec5 (blue), and First Defender (green) after baseline removal. The dashed lines indicate the representative difference among the spectra. | ||
Coefficient functions and transformed spectra
In general, according to eqn (2), the coefficient function β1(Δv) moves the spectral intensity up or down based on whether its value is positive or negative, so it affects the amplitude and baseline of the transformed spectrum; and β2(Δv) is the slope of a linear correction, it mainly changes the spectral peak location, as well as the amplitude. β2(Δv) can move the spectral data points to larger or smaller Δv when it has a positive or negative value. The average estimated coefficient functions ,
,  and associated error bars from various target instruments (RID, Tec5 and First Defender) to the standard instrument (Renishaw) are shown in Fig. 5 based on 20 replications of leave-one-out training and testing. Both
  and
and  contribute to the global and local transformation of spectra. For example, we can observe that most
  values are above 0, while most
  are below 1, which indicates that the effects of
  and
and  on spectral mean may cancel out so that the transformation does not affect the global spectral mean. In local regions, the amplitude of a peak is reduced if
  and
and  are smaller than 0 and 1, respectively, or one of the values is significantly small. A peak's location is likely to be shifted if the nearby peaks of
  and
and  mismatch near the corresponding peak of the original spectra. Overall, we can observe from Fig. 5 that the spectra of First Defender and Tec5 received comparable levels of corrections in peak amplitude and locations, as evidenced by the similarity in their respective
  and
and  . The narrow error bars of
  and
and  of the three instruments further demonstrate the robustness of SpectraFRM.
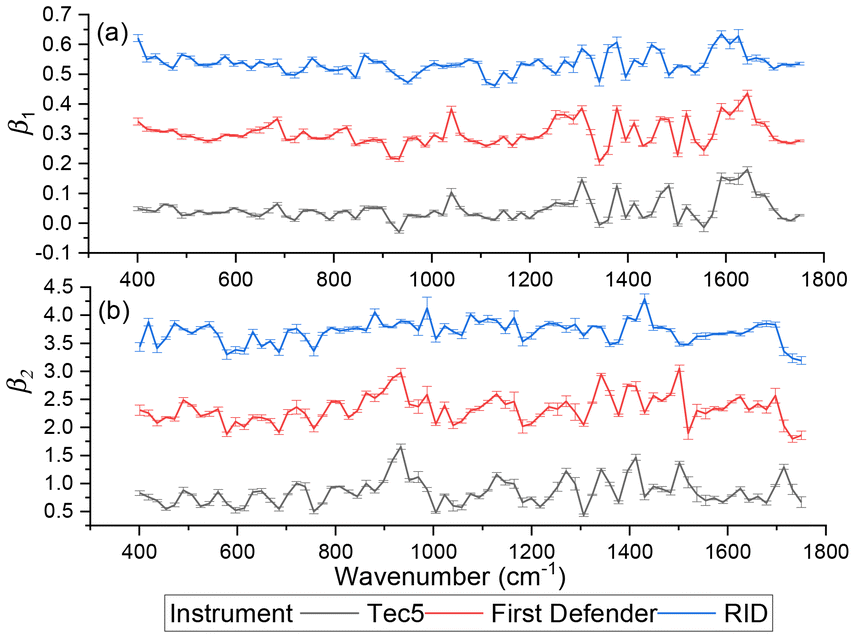 | ||
Fig. 5 The stacked average  and and  for RID, Tec5, and First Defender. For clarity, the curves of for RID, Tec5, and First Defender. For clarity, the curves of  of First Defender and RID are stacked with offsets 0.24 and 0.52 while the curves of of First Defender and RID are stacked with offsets 0.24 and 0.52 while the curves of  of First Defender and RID are stacked with offsets 1.6 and 2.8. Thirty spectral points of each curve are plotted. The error bars show the one standard deviation range of of First Defender and RID are stacked with offsets 1.6 and 2.8. Thirty spectral points of each curve are plotted. The error bars show the one standard deviation range of  and and  . . | ||
Fig. 6 illustrates the efficiency of SpectraFRM with the comparison of the transformed spectra Ĩ0i(Δv) of E. coli O128B12 and M. Catarrhalis for the three target instruments and the standard spectra I0i(Δv) for Renishaw. The spectra before transformation (original average) Iji(Δv) are also plotted to see the differences. After transformation, the average mean absolute error (MAE) of the transformed spectra from three instruments against standard spectra for E. coli O128B12 and M. Catarrhalis dropped 18% compared with original spectra. One can observe from Fig. 6 that the overall trend of the original spectra was mostly kept in transformed spectra, while some local peaks were modified to align with Renishaw's spectra. Specifically, for Tec5, the peaks of E. coli O128B12 and M. catarrhalis around Δv ≈ 1000 cm−1 (marked with dashed lines) were reduced to match the intensity of Renishaw spectra. The aforementioned corrections lead to a reduction in MAE by 22% of transformed spectra, compared with original spectra of the two analytes of Tec5. Similarly, the three over-shooting peaks of First Defender around Δv ≈ 750 and 1000 cm−1 of E. coli O128B12 and M. catarrhalis were corrected to have intensity closer to the spectra of Renishaw. The corrections reduce the MAE of transformed spectra of First Defender by 21% compared with original spectra of the two analytes. The transformed RID's spectra of E. coli O128B12 and M. catarrhalis, maintain the overall trend but exhibit a smoother profile with less noise compared to the original spectra which results in a 11% decrease in MAE. Besides corrections of peak magnitude made by SpectraFRM, the spectra of Tec 5 and First Defender were shifted a little bit to the right, as we can observe from Fig. 6 that the transformed spectra (blue curve) are slightly ahead of the original spectra. This reduces the disparity between peak locations mentioned in the previous section regarding Fig. 4b that the peaks of Tec5's and First Defender's spectra tend to appear at smaller wavenumbers. Additionally, Table 2 shows that in the leave-one-out tests of 20 analytes, the transformed spectra of RID, Tec5, and First Defender reduced the MAE by 13%, 11%, and 11%, respectively, compared to the original spectra without any transformation. We also compare SpectraFRM with Weatherall's method which mainly utilizes amplitude scaling to perform spectra transformation. Weatherall's method fits the ratio between spectra intensities from two instruments as an order-3 polynomial of wavenumbers.18 This method can be seen as a simplified version of SpectraFRM which not only takes the ratio of two instrument response functions into account via βj2(Δv) but also considers shifts of instrumental electronic noise through βj1(Δv). For a fair comparison, we replaced SpectraFRM with Weatherall's method while keeping all other steps fixed. As shown in Table 2, SpectraFRM significantly outperforms Weatherall's method in terms of MAE, suggesting that Weatherall's method may suffer from underfitting due to insufficient model complexity, whereas SpectraFRM provides a more accurate fit. Overall, we demonstrate that SpectraFRM was able to achieve significant and interpretable corrections when mapping spectra from one instrument to another.
 | ||
| Fig. 6 Stacked average original spectra (blue) and transformed average spectra (red) of RID, Tec 5, and First Defender of E. coli O128B12 and M. catarrhalis in testing sets. Average standard spectra (Renishaw spectra) are shown in black. The MAE is computed by averaging the absolute error of transformed and original spectra against standard spectra. | ||
| Instrument | Mean absolute error | ||
|---|---|---|---|
| Original spectra | Transformed spectra | Weatherall's method | |
| RID | 0.060 | 0.052 | 0.349 |
| Tec5 | 0.066 | 0.059 | 0.352 |
| First defender | 0.091 | 0.081 | 0.355 |
Cross-instrument spectra classification
Fig. 7 compares the average testing classification accuracies of CNN and SVM for mapping spectra of RID, Tec5, and First Defender to those of Renishaw. The CNN and SVM models are trained using preprocessed Renishaw spectra and tested on original individual spectra without feature extraction (OIS), original individual spectra with feature extraction (OISFE), transformed individual spectra with feature extraction (TIS), and transformed individual spectra without feature extraction (TISNFE) in a leave-one-out training and testing scheme. The original spectra are fed into classification models after normalization, serving as the benchmark standard. Since the training accuracies and validation accuracies of both CNN and SVM models are all close to 1, either with original Renishaw spectra or feature-extracted Renishaw spectra as training data, both models are optimally tuned. As displayed in Fig. 7, the accuracies of CNN models on original individual spectra are boosted from about 87% to 92% on average, compared with transformed individual spectra across three target instruments, illustrating the effectiveness of SpectraFRM. The feature extraction method further increases the accuracy of CNN models on transformed individual spectra to an average accuracy of 98%. Specifically, for the CNN model, comparing original and feature-extracted transformed spectra, the accuracy increases from 0.872 to 0.979 for RID, from 0.957 to 0.994 for Tec 5, and from 0.803 to 0.975 for First Defender. Similarly, for the SVM model, SpectraFRM and feature extraction method together improve the accuracy from 0.888 to 0.976 for RID, from 0.95 to 0.988 for Tec 5, and from 0.862 to 0.954 for First Defender. The combination of spectral transformation and feature extraction enhances spectral distinctions, making them more interpretable and peak distinctions more recognizable. Rather than any single method dominating, it is this synergy that drives improved classification accuracy, as transformed spectra with feature extraction consistently outperform spectra with only feature extraction or only transformation. In addition, based on the confusion matrix of transformed spectra of Tec5 shown in Fig. 8, one can observe that the prediction results for 15 out of 20 analytes is nearly perfect, with a score of 1 while the prediction accuracies of the rest analytes are all above 0.94. The spectra of different analytes measured by the same instrument can be highly different or similar. We calculated the Pearson correlation coefficients (PCC) of the average SERS spectra of different analytes obtained from the same instrument as shown in Fig. S2–S4.† The PCCs vary from 0 to 0.95. The small PCC value indicates high difference between two spectra while the near unity PCC refers to high similarity. For instance, the spectra of LTA measured on the Tec5 instrument have correlation coefficients greater than 0.95 with those of H. pylori GU2 and F. tularensis from the same instrument. Despite these high similarities, the CNN model has successfully distinguished the transformed spectra of LTA from those of the other two analytes. This phenomenon is observed across other pairs of similar analytes as well, suggesting that SpectraFRM enhances the differentiability of distinct analytes with closely similar spectra. The classification results also demonstrate the robustness of the proposed transformation procedure since, for most analytes, high accuracies of transformed individual spectra were achieved by the CNN model even though different analytes were tested in each iteration of leave-one-out training and test. In addition, the CNN confusion matrices of transformed individual spectra from RID and First Defender presented in Fig. S6 and S7 of ESI† show that for both instruments, more than 12 analytes exhibit almost perfect prediction scores of 1 with a few analytes having small proportions of misclassified spectra. The corresponding spectra number of the confusion matrices are shown in Fig. S8–S10.† Also, as presented in Tables S6–S8 of ESI,† the precision, sensitivity, specificity and F1 score for CNN models of individual transformed spectra of the three target instruments in the 20 iterations of leave-one-out training and test approach 1 for most analytes. These results demonstrate the significant impact of SpectraFRM model on machine learning model performance, with featured extracted transformed spectra achieving consistently higher classification accuracies than the original spectra for both the CNN and SVM classifiers. | ||
| Fig. 7 The comparison of average classification accuracies resulted from CNN and SVM models for spectral mapping from RID, Tec 5, and First Defender to Renishaw based on original individual spectra without feature extraction (OIS), individual spectra with feature extraction (OISFE), transformed individual spectra with feature extraction (TIS) and transformed individual spectra without feature extraction (TISNFE). The values are averaged from 20 repetitions of leave-one-out training and testing. The training accuracies of individual Renishaw spectra with and without feature extraction are displayed in the last two bars. | ||
 | ||
| Fig. 8 The CNN confusion matrix of transformed spectra from Tec5 over 20 repetitions of leave-one-out testing. | ||
Conclusions
To make spectra from diverse instruments comparable, we proposed a transformation method, i.e., SpectraFRM, based on penalized functional regression, to transform spectra from the target instrument to the pseudo-spectra of the standard instrument. To align the spectra of the target instrument to that of the standard instrument, both the shifts in peak magnitude and locations of original spectra were corrected by the proposed SpectraFRM. We further compared the transformed spectra with the original spectra across three target instruments using machine learning classification algorithms. In the leave-one-out training and testing across 3 instruments, compared with original spectra, the method achieves about 11% error reduction in the MAE between transformed spectra and standard spectra and roughly 10% increase in the classification accuracy for cross-instrument classification. The results demonstrate that SpectraFRM provides consistently accurate, flexible, robust, and interpretable transformations despite of wide varieties of target instruments and analytes. In the burgeoning field of instrument spectral mapping, traditional approaches have predominantly hinged on linear spectral standardization techniques or Raman shift correction with instrument-specific domain knowledge, such as those employed by Weatherall et al.18 and Rodriguez et al.15,39 On the other hand, classification strategies that often transfer deep learning models from one instrument to another, such as those proposed by Mishra et al.20 and Ju et al.,21 become popular recently. While the former approaches are feasible for their simplicity and direct application, they often impose a simplistic linear model that may fail to encapsulate the intrinsic nonlinear variances present in spectral data. This could lead to underfitting, diminishing the model's utility in diverse analytical scenarios. The classification-based strategies, despite their innovative use of deep learning paradigms, do not facilitate a transformation of spectra, thereby curtailing the interpretability of the results and potentially confounding the identification process in complex matrices.On the other hand, SpectraFRM stands out as a robust solution by addressing these limitations through penalized functional regression. As shown in the Results section, SpectraFRM has not only achieved superior classification accuracy, which is indispensable for downstream analytical tasks, but also retained the interpretability of transformed spectra without the aid of prior domain knowledge. Furthermore, SpectraFRM can be applied to spectra from various instruments and various analytes, as the model has no instrument-specific or analyte-specific parameters. The ability of SpectraFRM to provide a coherent and comprehensive transformation of spectral data, respecting the nonlinear intricacies therein, marks a significant advancement over its predecessors. It offers two advantages: enhanced adaptability to spectral data from various instruments and an augmented interpretability that facilitates scientific insight. The model's proficiency is expected to escalate concomitantly with the richness of the dataset it is trained on; hence, the addition of a broader spectrum of training data could further refine its accuracy and robustness.
Author contributions
Tao Wang: methodology investigation, spectral analysis, machine learning, writing – original draft, writing – review & editing. Yanjun Yang: experimental investigation, spectrum measurements, spectrum analysis, writing – review & editing. Haoran Lu: methodology investigation, spectral analysis, machine learning, writing – original draft, writing – review & editing. Jiaheng Cui: spectral pretreatment, machine learning, writing – review & editing. Xianyan Chen: funding acquisition. Ping Ma: funding acquisition, methodology, A.I. methodology, supervision, writing – review & editing. Wenxuan Zhong: funding acquisition, methodology, A.I. methodology, supervision, writing – review & editing. Yiping Zhao: conceptualization, funding acquisition, supervision, project administration, writing – original draft, writing – review & editing.Data availability
For completeness, the codes are deposited in the Harvard dataverse repository, https://doi.org/10.7910/DVN/ZRGPNV. The datasets analyzed during the current study are available upon request. All analyses, including the generation of all figures, were performed with the R statistical software, version 4.3.1.Conflicts of interest
There are no conflicts to declare.Acknowledgements
J. C., X. C., and Y. Z. are funded by USDA NIFA Grant number 2023-67015-39237. T. W., H. L., P. M., and W. Z. are partially supported by National Science Foundation grants DMS-1925066, DMS-1903226, DMS-2124493, DMS-2311297, DMS-2319279, DMS-2318809, and National Institutes of Health grants R01GM152814.References
- J. Langer, D. Jimenez de Aberasturi, J. Aizpurua, R. A. Alvarez-Puebla, B. Auguié, J. J. Baumberg, G. C. Bazan, S. E. J. Bell, A. Boisen, A. G. Brolo, J. Choo, D. Cialla-May, V. Deckert, L. Fabris, K. Faulds, F. J. García de Abajo, R. Goodacre, D. Graham, A. J. Haes, C. L. Haynes, C. Huck, T. Itoh, M. Käll, J. Kneipp, N. A. Kotov, H. Kuang, E. C. Le Ru, H. K. Lee, J.-F. Li, X. Y. Ling, S. A. Maier, T. Mayerhöfer, M. Moskovits, K. Murakoshi, J.-M. Nam, S. Nie, Y. Ozaki, I. Pastoriza-Santos, J. Perez-Juste, J. Popp, A. Pucci, S. Reich, B. Ren, G. C. Schatz, T. Shegai, S. Schlücker, L.-L. Tay, K. G. Thomas, Z.-Q. Tian, R. P. Van Duyne, T. Vo-Dinh, Y. Wang, K. A. Willets, C. Xu, H. Xu, Y. Xu, Y. S. Yamamoto, B. Zhao and L. M. Liz-Marzán, ACS Nano, 2020, 14, 28–117 CrossRef PubMed
.
- H. Li, S. A. Haruna, W. Sheng, Q. Bei, W. Ahmad, M. Zareef, Q. Chen and Z. Ding, TrAC, Trends Anal. Chem., 2023, 169, 117365 CrossRef
- M. Zhang, J. Pan, X. Xu, G. Fu, L. Zhang, P. Sun, X. Yan, F. Liu, C. Wang and X. Liu, Anal. Chem., 2022, 94, 4850–4858 CrossRef PubMed
- Z. Gong, H. Du, F. Cheng, C. Wang, C. Wang and M. Fan, ACS Appl. Mater. Interfaces, 2014, 6, 21931–21937 CrossRef PubMed
- S.-C. Luo, K. Sivashanmugan, J.-D. Liao, C.-K. Yao and H.-C. Peng, Biosens. Bioelectron., 2014, 61, 232–240 CrossRef CAS PubMed
- T. Itoh, M. Procházka, Z.-C. Dong, W. Ji, Y. S. Yamamoto, Y. Zhang and Y. Ozaki, Chem. Rev., 2023, 123, 1552–1634 CrossRef CAS PubMed
- W. J. Cho, Y. Kim and J. K. Kim, ACS Nano, 2012, 6, 249–255 CrossRef CAS PubMed
- H. Liu, X. Gao, C. Xu and D. Liu, Theranostics, 2022, 12, 1870 CrossRef CAS PubMed
- L. Wang, X. Wang, L. Cheng, S. Ding, G. Wang, J. Choo and L. Chen, Biosens. Bioelectron., 2021, 189, 113360 CrossRef CAS PubMed
- S. Yue, J. Fang and Z. Xu, Biosens. Bioelectron., 2022, 198, 113822 CrossRef CAS PubMed
- X. Zhou, Z. Hu, D. Yang, S. Xie, Z. Jiang, R. Niessner, C. Haisch, H. Zhou and P. Sun, Adv. Sci., 2020, 7, 2001739 CrossRef CAS PubMed
- Y. Zhao, A. Kumar and Y. Yang, Chem. Soc. Rev., 2023, 53, 1004–1057 RSC
- S. Fornasaro, F. Alsamad, M. Baia, L. A. E. Batista de Carvalho, C. Beleites, H. J. Byrne, A. Chiadò, M. Chis, M. Chisanga, A. Daniel, J. Dybas, G. Eppe, G. Falgayrac, K. Faulds, H. Gebavi, F. Giorgis, R. Goodacre, D. Graham, P. La Manna, S. Laing, L. Litti, F. M. Lyng, K. Malek, C. Malherbe, M. P. M. Marques, M. Meneghetti, E. Mitri, V. Mohaček-Grošev, C. Morasso, H. Muhamadali, P. Musto, C. Novara, M. Pannico, G. Penel, O. Piot, T. Rindzevicius, E. A. Rusu, M. S. Schmidt, V. Sergo, G. D. Sockalingum, V. Untereiner, R. Vanna, E. Wiercigroch and A. Bonifacio, Anal. Chem., 2020, 92, 4053–4064 CrossRef CAS PubMed
- J.-F. Masson, ACS Sens., 2021, 6, 3822–3823 CrossRef CAS PubMed
- N. M. Ralbovsky and I. K. Lednev, Chem. Soc. Rev., 2020, 49, 7428–7453 RSC
- F. Lussier, V. Thibault, B. Charron, G. Q. Wallace and J.-F. Masson, TrAC, Trends Anal. Chem., 2020, 124, 115796 CrossRef CAS
- R. Beeram, K. R. Vepa and V. R. Soma, Biosensors, 2023, 13, 328 CrossRef CAS PubMed
- J. C. Weatherall, J. Barber, C. S. Brauer, T. J. Johnson, Y. F. Su, C. D. Ball, B. T. Smith, R. Cox, R. Steinke, P. McDaniel and L. Wasserzug, Appl. Spectrosc., 2013, 67, 149–157 CrossRef CAS PubMed
- X. X. Han, R. S. Rodriguez, C. L. Haynes, Y. Ozaki and B. Zhao, Nat. Rev. Methods Primers, 2022, 1, 87 CrossRef
- P. Mishra and D. Passos, Infrared Phys. Technol., 2021, 117, 103863 CrossRef CAS
- Y. Ju, O. Neumann, M. Bajomo, Y. Zhao, P. Nordlander, N. J. Halas and A. Patel, ACS Nano, 2023, 17, 21251–21261 CrossRef PubMed
- L. Bian, Z. Wang, D. L. White and A. Star, Biosens. Bioelectron., 2021, 180, 113085 CrossRef CAS PubMed
-
C. Gu, Smoothing spline ANOVA models, Springer, 2013 Search PubMed
- J. S. Morris, Annu. Rev. Stat. Appl., 2015, 2, 321–359 CrossRef
-
J. Zhang, H. Jin, Y. Wang, X. Sun, P. Ma and W. Zhong, Smoothing spline ANOVA models and their applications in complex and massive datasets, 2018 Search PubMed
- Y. J. Liu and Y. P. Zhao, Phys. Rev. B: Condens. Matter Mater. Phys., 2008, 78, 075436 CrossRef
- J. D. Driskell, S. Shanmukh, Y. Liu, S. B. Chaney, X. J. Tang, Y. P. Zhao and R. A. Dluhy, J. Phys. Chem. C, 2008, 112, 895–901 CrossRef CAS
- Y. J. Liu, H. Y. Chu and Y. P. Zhao, J. Phys. Chem. C, 2010, 114, 8176–8183 CrossRef CAS
- Y. J. Liu, Z. Y. Zhang, Q. Zhao, R. A. Dluhy and Y. P. Zhao, J. Phys. Chem. C, 2009, 113, 9664–9669 CrossRef CAS
- Z.-M. Zhang, S. Chen and Y.-Z. Liang, Analyst, 2010, 135, 1138–1146 RSC
- Y. Zhao, Nanomaterials, 2023, 13, 2998 CrossRef CAS PubMed
- C. De Boor, J. Approx. Theory, 1972, 6, 50–62 CrossRef
- X. Sun, P. Du, X. Wang and P. Ma, J. Am. Stat. Assoc., 2018, 113, 1601–1611 CrossRef CAS PubMed
-
I. Goodfellow, Y. Bengio and A. Courville, Deep learning, MIT Press, 2016 Search PubMed
-
V. Vapnik, The nature of statistical learning theory, Springer Science & Business Media, 2013 Search PubMed
- O. Chapelle, P. Haffner and V. N. Vapnik, IEEE Trans. Neural Netw., 1999, 10, 1055–1064 CrossRef CAS PubMed
- H. W. Borchers, pracma: Practical Numerical Math Functions [R studio], Vienna, Austria: The Comprehensive R Archive Network, version 2.4.4, 2023, Accessed 1 Jan 2025.
- D. P. Kingma and J. Ba, arXiv, 2014, preprint, arXiv:1412.6980, DOI:10.48550/arXiv.1412.6980.
- J. D. Rodriguez, B. J. Westenberger, L. F. Buhse and J. F. Kauffman, Analyst, 2011, 136, 4232–4240 RSC
Footnotes |
| † Electronic supplementary information (ESI) available. See DOI: https://doi.org/10.1039/d4an01177e |
| ‡ These authors contribute equally to this work |
| This journal is © The Royal Society of Chemistry 2025 |