
 Open Access Article
 This Open Access Article is licensed under a Creative Commons Attribution-Non Commercial 3.0 Unported Licence
In situ investigation of moisture sorption mechanism in fuel cell catalyst layers†
Emilie
Planes
 *a,
Joseph
Peet
b,
Jean-Blaise
Brubach
c,
Lionel
Porcar
d,
Gilles
De Moor
a,
Cristina
Iojoiu
*a and
Sandrine
Lyonnard
*b
*a,
Joseph
Peet
b,
Jean-Blaise
Brubach
c,
Lionel
Porcar
d,
Gilles
De Moor
a,
Cristina
Iojoiu
*a and
Sandrine
Lyonnard
*b
aUniversité Grenoble Alpes, Université Savoie Mont-Blanc, CNRS, Grenoble INP, LEPMI, 38000 Grenoble, France. E-mail: emilie.planes@univ-smb.fr; cristina.iojoiu@grenoble-inp.fr
bUniv. Grenoble Alpes, CEA, CNRS, Grenoble INP, IRIG, SyMMES, 38000 Grenoble, France. E-mail: sandrine.lyonnard@cea.fr
cSynchrotron SOLEIL, L’Orme des Merisiers Saint-Aubin, BP 48, 91192 Gif-sur-Yvette, France
dLarge Scale Structures Group, Institut Laue-Langevin, 71 Avenue des Martyrs, 38042 Grenoble Cedex 9, France
First published on 13th June 2024
Abstract
Research focusing on catalyst layers is critical for enhancing the performance and durability of proton exchange membrane fuel cells. In particular, the role of the ionomer is pivotal but remains poorly explored due to the difficulty to access complex electrode structures. Moreover, perfluorosulfonic acid (PFSA) polymers are usually employed in catalyst layers but their drawbacks have spurred interest in aromatic compounds, which promise improved conductivity and performance. Here we investigated the structure-to-function relationship and interactions in novel catalyst layers using non-perfluorinated sulfonic acid ionomers, e.g. multiblock poly(arylene ether sulfones) bearing perfluorosulfonic acid side chains. By combining dynamic vapor sorption, small-angle neutron scattering and synchrotron humidity-controlled infrared spectroscopy, we accessed the water uptake, nanostructures, and molecular structures in a series of catalyst layers prepared with different loadings of aromatic polymer, as well as reference compounds, e.g. pure membrane and polymer–carbon systems. Our measurements show that the water sorption mechanism in catalyst layers differs from pure ionomers due to catalyst-induced structural changes. We observed that most of the formed ionic species interact primarily with the platinum catalyst and probably locate at the particle–ionomer interface. These results emphasize the need for continued research to advance aromatic-type ionomers in fuel cell technology under realistic conditions.
Introduction
Proton exchange membrane fuel cells (PEMFCs) represent an emerging technology of significant interest for current and future applications in clean, highly efficient power generation with low emissions. At the core of a PEMFC lies the membrane electrode assembly (MEA), which comprises a proton exchange membrane (PEM) sandwiched between two catalyst layers (CLs). These CLs, in turn, consist of three essential components:1 (i) a nano Pt catalyst with an exceptionally high specific surface area, aimed at accelerating the electrochemical reactions that drive the cell's power generation, (ii) a Pt carbon support that provides a porous structure facilitating the diffusion of gases and ensuring effective conductivity within the cell, and (iii) an ionomer, which serves the dual purpose of conducting protons and establishing a critical interface between the catalyst and the proton exchange membrane.Traditional CLs for proton exchange membrane (PEM) fuel cells typically consisted of Pt catalyst supported on carbon black and the Nafion ionomer. The effectiveness of electrochemical reactions in the CL hinges on the surface area of Pt that interacts with the reactant gas and the proton-conducting phase. A high surface area of the carbon support is essential to effectively disperse Pt nanoparticles, while support porosity is crucial for ionomer integration and facilitating gas access to reaction sites.2 Accordingly, significant progress in the development of catalyst layers (CLs) for PEMFC has been made by replacing Pt black with Pt supported on high-surface-area carbon. Improvements have been further enhanced by introducing the proton-conducting ionomer directly into the catalyst ink, extending the reaction zone, and increasing catalyst utilization. Comprehensive reviews of these advancements can be found in existing literature.1,3–5
The nature, content and organization of the ionomer plays a key role in the CLs properties. It is widely acknowledged that the ionomer content within the catalyst layer significantly influences gas transport properties,6 with high ionomer loadings reducing available pore space for gas transport. An optimal value of approximately 30 wt% ionomer content is often employed to provide an adequate ionomer network for proton conduction while maintaining sufficient pore space for effective gas transport. The distribution of ionomer depends on factors such as pore size distribution (PSD), surface area, specific carbon support used and processing methods.
Currently, perfluorosulfonic acid (PFSA) polymers, such as Nafion, dominate as the most widely used ionomer in PEMFCs as both the membrane and in catalyst layers,7–9 primarily due to their high proton conductivity, as well as their thermal and chemical stability. However, these PFSA polymers come with several drawbacks, including their high cost and the relatively negative environmental impact associated with their high fluorine content. Consequently, there is growing interest in developing alternative ionomers to address these issues. Aromatic compounds are promising candidates in this direction. Multiblock structures comprising hydrophilic polyethersulfone (PES) and hydrophobic fluoropolyethersulfone (FPES) blocks, along with perfluorosulfonic side chains,10,11 have demonstrated superior conductivity compared to state-of-the-art PFSA membranes. Their tailored chemical architecture (see Fig. 1 showing the archetypal high-performance In1515 material, where the molecular weight of both blocks is 15![[thin space (1/6-em)]](https://www.rsc.org/images/entities/char_2009.gif) 000 kg mol−1) favors a well-connected hierarchical phase-separated morphology, as revealed by small-angle neutron scattering (SANS) measurements.11 Nanosized ionic domains composed of PES backbone layers are separated by clusters of perfluorosulfonic side chains, while block domains comprising FPES blocks separate from the PES blocks regions, yielding alternated percolating structures that expand upon water absorption, leading to increased membrane conductivity. Some MEA with In1515 were fabricated and their tests in fuel cell exhibited relatively good performances.12
000 kg mol−1) favors a well-connected hierarchical phase-separated morphology, as revealed by small-angle neutron scattering (SANS) measurements.11 Nanosized ionic domains composed of PES backbone layers are separated by clusters of perfluorosulfonic side chains, while block domains comprising FPES blocks separate from the PES blocks regions, yielding alternated percolating structures that expand upon water absorption, leading to increased membrane conductivity. Some MEA with In1515 were fabricated and their tests in fuel cell exhibited relatively good performances.12
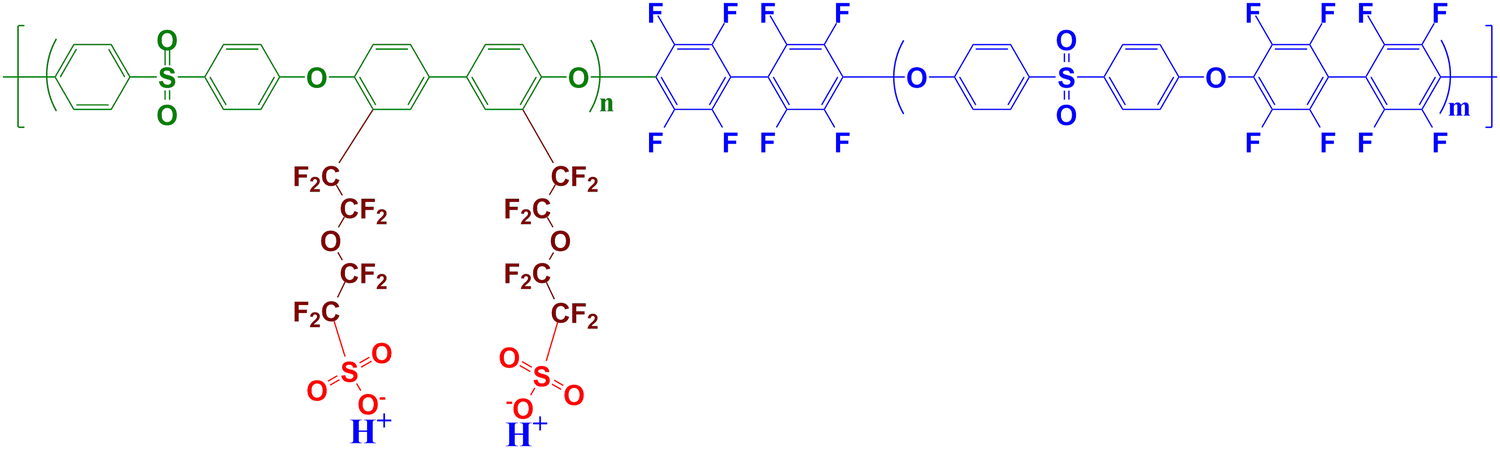 | ||
| Fig. 1 Chemical formula of the multiblock aromatic ionomer composed of ps-PES and FPES blocks. The material investigated in this study, labeled as In1515, corresponds to n and m equal to 15. | ||
Herein, we extend these investigations to evaluate the behavior of an aromatic ionomer within a catalyst layer. Unlike PFSA-based MEAs, the development of hydrocarbon-based catalyst layers and MEAs has not benefited from decades of optimization, and little is known on the complex interactions driving materials performance. To fill this gap, we have conducted a comprehensive study of the structure-to-function relationship in In1515-based catalyst layers. We focused on understanding the mechanism of water vapor sorption and local interactions between catalysts, carbon and ionomer, by applying a combination of complementary techniques. Dynamic vapor sorption measurements and SANS analyses were used to resolve the intricate multicomponent bulk structure of the catalyst layers and separate the different water uptake regimes behaviors. Using synchrotron infrared spectroscopy, we also probed the atomic-scale behavior of the polymer during hydration, to elucidate the ionization mechanisms of sulfonic acid groups and track the formation of protonated species, such as hydronium and Zundel ions. To discriminate the contribution of the various components, we compared normal catalyst layers, Li+ catalyst layers, and catalyst layers without platinum.
Experimental
Materials
The aromatic block ionomer labeled IN1515 was synthesized as described elsewhere.10 The chemical formulas of the hydrophilic ps-PES blocks (molar mass of PES backbone 15 kg mol−1) and hydrophobic FPES blocks (molar mass 15 kg mol−1) of IN1515 are presented in Fig. 1. Nafion D520 suspension were purchased from Dupont and Vulcan XC-72 carbon were received from Cabot Corp. Catalyst powders with 46 wt% Pt on Vulcan XC-72 (TEC1050E) were received fromTanaka Kikinzoku Kogyo.:1) at a ratio of 0.70 g Pt/C per 100 g of the water/methanol solution. During the dispersion process, ultrasonication was applied for 30 minutes while gradually adding a 1 wt% IN1515 or D520 solution to achieve ionomer loadings of 20 wt%, 50 wt%, and 70 wt%, respectively. The final mixture was further sonicated at room temperature for 2 hours.
The inks were cast onto silicon or quartz substrates for specific characterization methods, resulting in catalyst layers denoted as CL20, CL50, and CL70. To ensure adequate thickness for signal detection, a deposition was repeated 10 times for dynamical vapor sorption (DVS) and small angle neutron scattering (SANS) measurements, and 3 times for mid infra-red (MIR) synchrotron spectroscopy. Subsequently, these casts were dried at 60 °C in ambient air to remove the solvent before further processing.
For comparison purposes, a similar type of ink was created using an IN1515-based ionomer solution exchanged with lithium to evaluate the differences in behavior between H+ and Li+. These two inks led to the formation of catalyst layers referred to as CL50Li and CL70Li. To investigate the role of platinum in the water transport mechanism, analogous inks were developed with a focus on carbon alone, resulting in composite layers designated as CL50NoPt and CL70NoPt. The proportions of carbon, platinum, and ionomer in each of these catalyst and composite layers are presented in Table 1.
| Proportion (wt%) | CL20 | CL50 | CL70 | CL50Li | CL70Li | CL50NoPt | CL70NoPt |
|---|---|---|---|---|---|---|---|
| Ionomer | 20 | 50 | 70 | 50 | 70 | 50 | 70 |
| Carbon | 42.9 | 26.4 | 16.4 | 26.4 | 16.4 | 50 | 30 |
| Platinum | 37.1 | 23.6 | 13.6 | 23.6 | 16.6 | 0 | 0 |
Water vapor sorption measurements
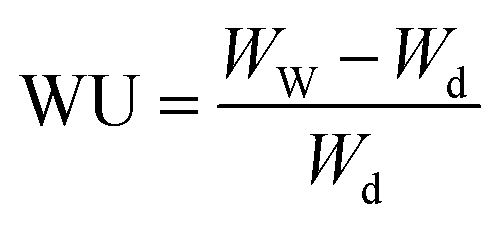
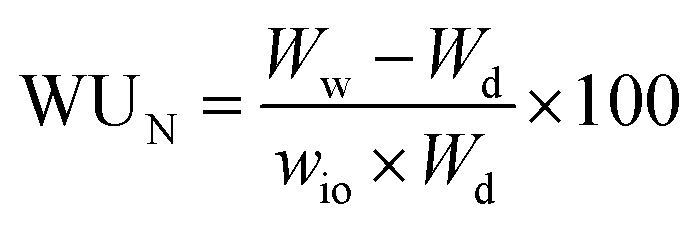
Water vapor sorption measurements were conducted using a dynamical vapor sorption (DVS) instrument provided by Hidden Isochema. As the catalyst layers were applied to silicon substrates, the layer thickness was initially measured through profilometry to determine the dry mass of the studied catalyst layer accurately. The sorption measurements were carried out at 25 °C, covering a range from 0% to 90% relative humidity (RH). Before the measurements, the samples underwent a drying process of 10 hours at 80 °C under 0% humidity conditions. Each moisture step involved a 5-hour equilibration period. For comparison, the ionomer-based membrane IN1515 and the catalyst (TEC1050E) in powder form, along with Vulcan XC-72 carbon in powder form, underwent the same measurement procedure. Due to their nature, these materials were simply placed in a basket for analysis. The water uptake (WU, gwater/gsample) is determined by the following equation:14,15With Ww and Wd the masses of wet and dry samples. Water uptake (WUN, %) can be normalized to the amount of ionomer in the sample based on the following relationship:
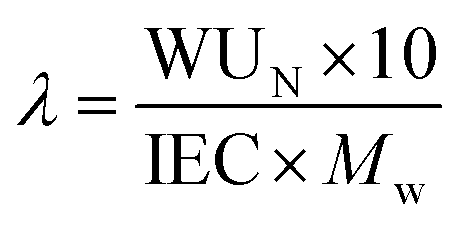
With wio the mass proportion in ionomer (see Table 1). One can also establish the hydration number, denoted as λ, which represents the ratio of water molecules to acid groups. This parameter was assessed for catalyst layers to gain deeper insights into how carbon or the catalyst influences the water transport mechanism. The determination of this parameter is carried out as follows:14,15
where IEC (meq H+ g−1) is the ion-exchange capacity of the IN1515 ionomer (1.34 meq H+ g−1) determined by analyzing NMR spectra and Mw is the molecular weight of water (18.01 g mol−1). The measurements were performed on ionomer dissolved in solution immediately after synthesis.
Synchrotron infrared spectroscopy
Measurements were performed at the SOLEIL synchrotron16 on the AILES beamline.17 FIR and MIR spectra were obtained by averaging 200 and 400 scans respectively. All measurements were done at 23 °C. A specific homemade cell was used to measure hydration/dehydration processes in situ.18 The catalyst layer deposited on Si wafers were dried in air at 60 °C to remove solvent before mounting perpendicularly to the incident beam with the surface exposed to the humidified air/pumping allowing the hydration/dehydration processes. Samples were first dried at 80 °C under vacuum. Sample temperature is controlled by a cryostat (precision 0.05 K) while the water vapor pressure (p) in the cell is monitored by a thermostatic gauge (0–100 mbar with a precision of 0.02 mbar). The relative humidity (RH) of the membrane can be set to the value (p/p0) × 100, with p0 the water vapor pressure equal to 28.1 mbar at 23 °C. All spectra are displayed in absorbance units as −log(I/I0), where I and I0 are respectively the sample and empty cell transmissions. To compensate for the varying amounts of polymer in each sample the MIR spectra are normalized to the ionomer backbone peak at ∼1570 cm−1. This allows the intensities of each peak to be compared across samples and hydration levels.Small angle neutron scattering
SANS measurements were conducted using the D22 spectrometer at the Institut Laue–Langevin (ILL) in Grenoble, France. The measurement procedure closely followed the approach outlined in previous works.11,19 Three different configurations were employed to cover a broad Q-range, spanning from 2 × 10⁻³ to 0.6 Å−1. The isotropic 2D patterns recorded in these configurations were subjected to radial averaging to derive the 1D scattered intensities, denoted as I(Q). Subsequently, these intensities underwent standard corrections, including adjustments for detector efficiency, background noise, and subtraction of empty cell signal. To create an unified profile for each sample, the I(Q) plots obtained from data acquired in the three different configurations were merged. IN1515 membranes and catalyst layers deposited on Si wafers were prepared with different contents of water by exposing the samples to atmospheres with relative humidity (RH) levels of 52% and 98% as well as by immersing the samples in water at temperatures of 20 °C and 60 °C. RH-equilibrated samples were prepared in sealed mobile glove boxes that contained saturated salt solutions. After 4 days the samples equilibrated at the desired vapor pressures were carefully inserted into round neutron cells within the glovebox to prevent any contamination from exposure to the air. These cells were sealed hermetically and only removed from the mobile glovebox shortly before the SANS measurements. High λ values samples were obtained by direct immersion in water (at 20 and 60 °C) for 24 h and then extracted from water and placed into quartz Helma cells, with a few drops of water added. The measurements were performed at room temperature. The scattering intensities obtained were absolute; however, for clarity in presentation, the data points were occasionally shifted, and therefore, the resulting plots are shown in arbitrary units. Each membrane and catalyst layer underwent four measurements with varying water content.Generally, the 1D I(Q) profiles present two correlation peaks, respectively related to the block and ionic domains organization in the ionomer. To extract some pertinent parameters related to the microstructure, the data were fitted using a polynomial background and Gaussian functions. Initially, the background was fitted with a single power law expression; however, due to difficulties in analyzing the entire Q-range with a single function, the profiles were then split into two sectors, with each part fitted using different background functions. In every case the block and ionomer peaks were each fitted with a single Gaussian function. The Q values for each peak derived from these two fitting methods were then averaged and the characteristic length scales of each domain, dblock and dionomer, calculated.
Results & discussion
All catalyst layers and their individual components, including the membrane-based ionomer, carbon, and Pt/C, underwent DVS measurements. Analyzing sorption isotherms for these diverse catalyst layer constituents yields critical insights into their interactions with water vapor across varying relative humidity (RH) levels. Additionally, drawing from existing literature, sorption isotherm data can reveal any potential conflicts or synergistic interactions among the various catalyst layer components, including the ionomer, Pt/C particles, and carbon support materials. Such insights are pivotal when designing catalyst layers to enhance both stability and performance. In Fig. 2(a), we present the raw data of all sorption isotherms, with water uptake (WU) calculated relative to the dry sample mass. Notably, due to the ionic functions within IN1515 ionomer, a considerable water uptake is observed during the sorption process. Furthermore, the shape of the sorption isotherm curve provides valuable clues about the material's water transport mechanisms, shedding light on how moisture is absorbed, stored, and released within the catalyst layers.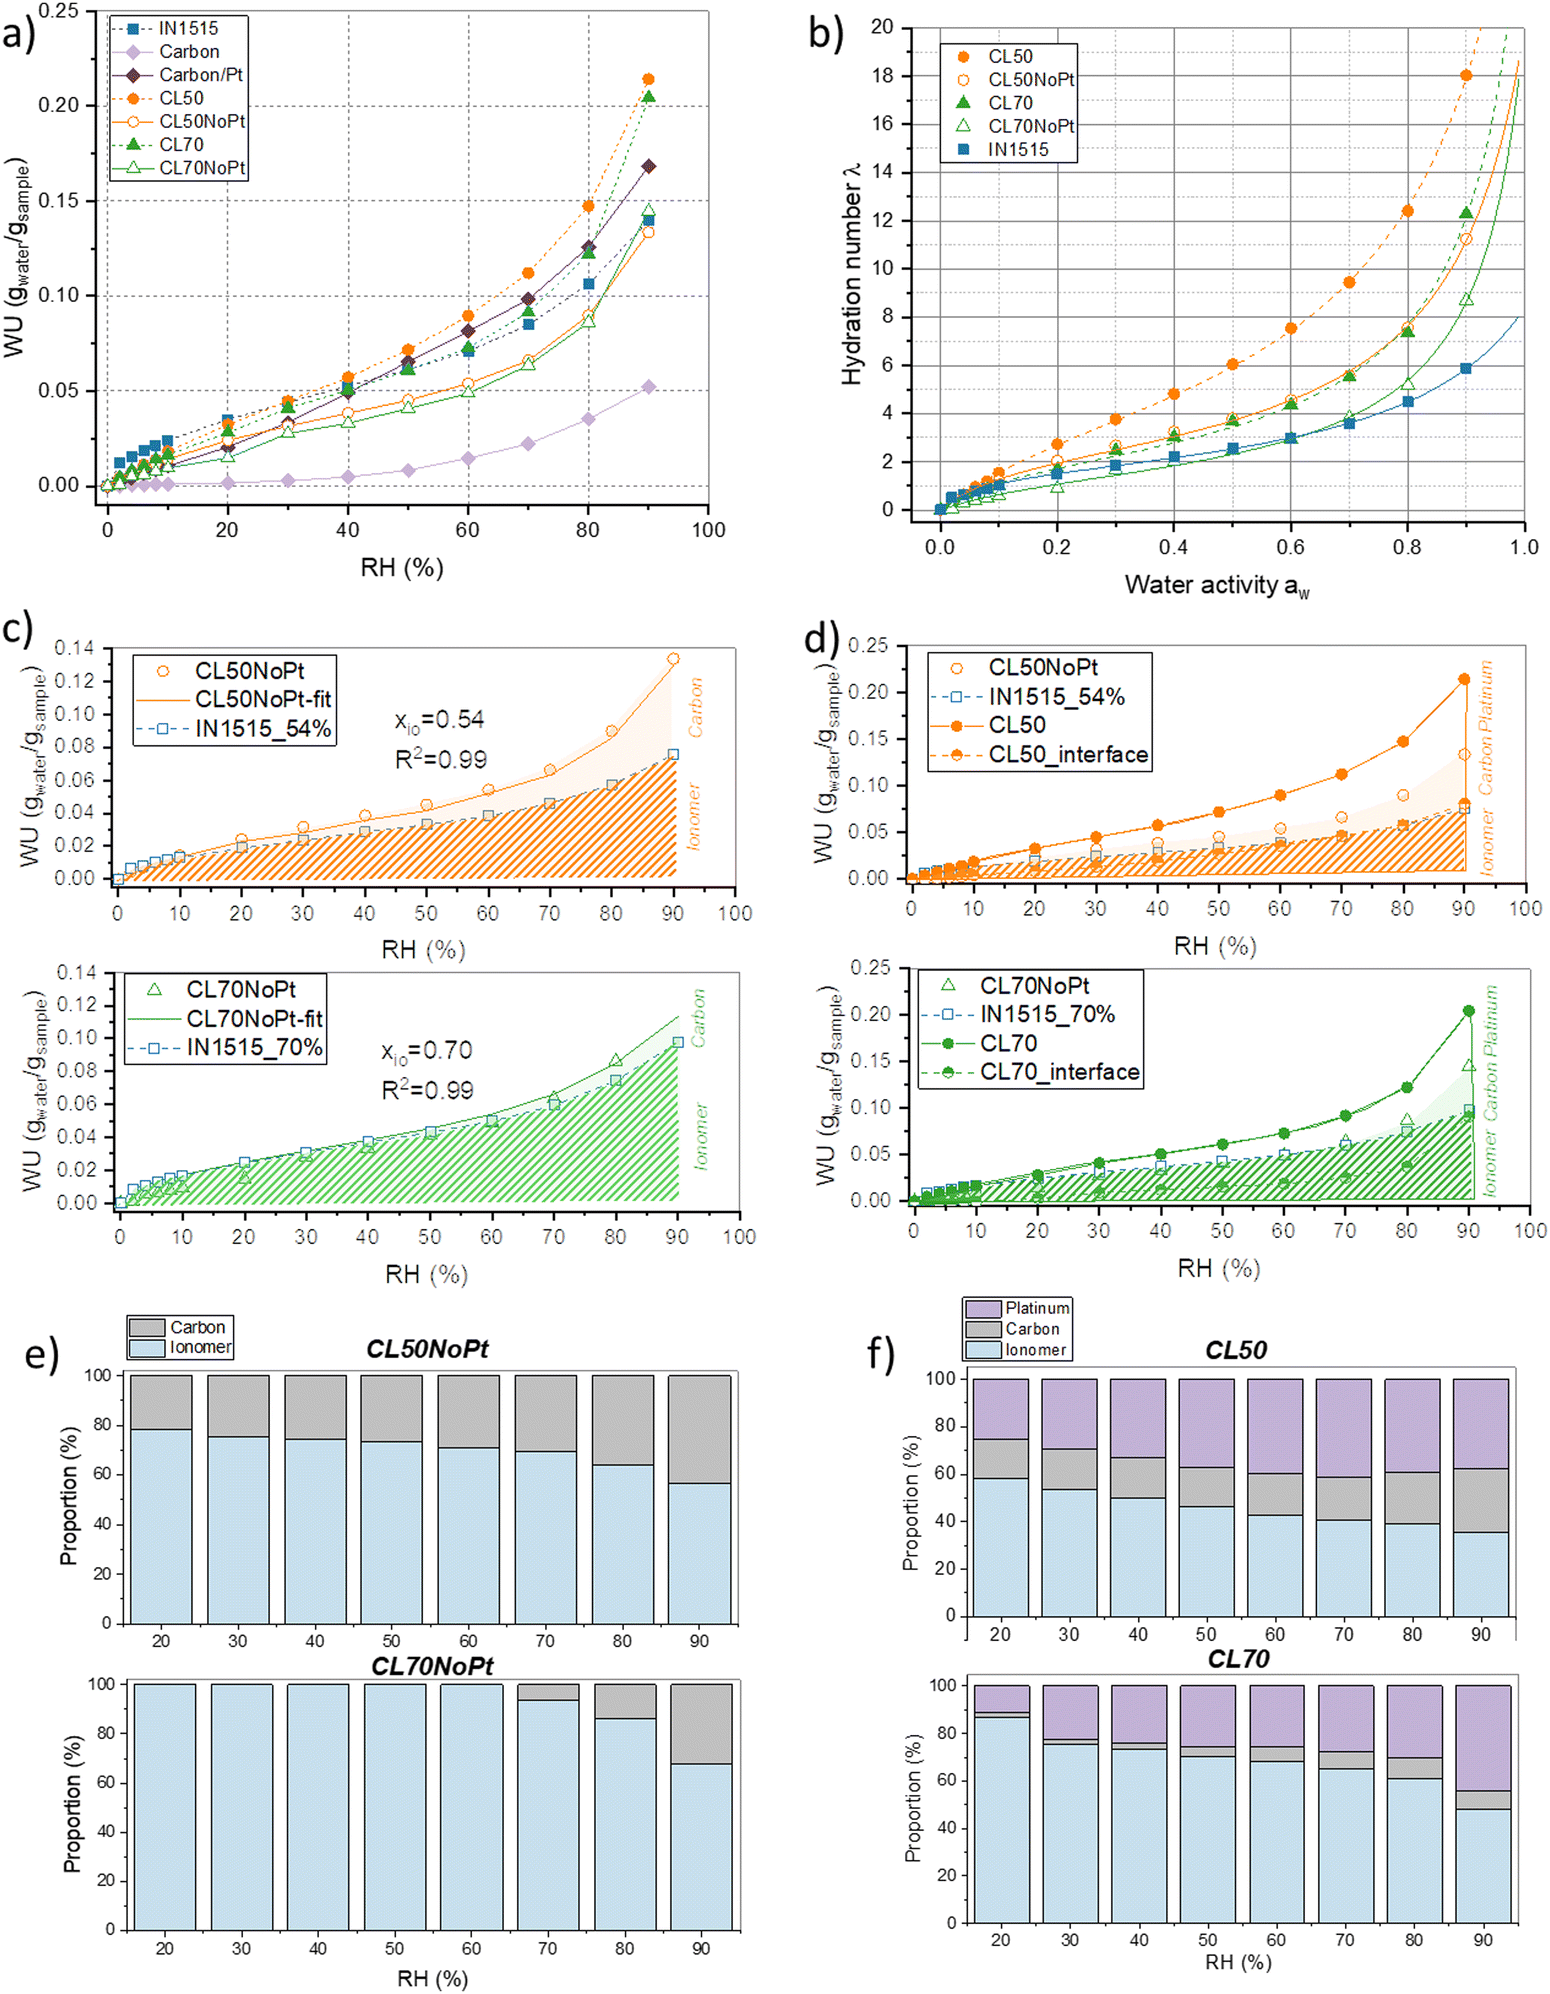 | ||
| Fig. 2 Water vapor sorption mechanisms analyzed by DVS. (a) Water vapor sorption isotherms: water uptake WU as a function of relative humidity (RH%) at 25 °C; (b) representation of the same water vapor sorption isotherms using the hydration number λ relative to the number of water molecules per acid group of the ionomer as a function of water activity aw – the experimental data are represented as closed symbols, while the lines represent the approximations obtained with the New Dual Sorption (NDMS) model; (c) analytical simulation of WU as a function of RH for CL50NoPt and CL70NoPt (“Ionomer” and “Carbon” indicate the WU respectively by Ionomer and Carbon in catalyst or composite layer); (d) analytical simulation of WU as a function of RH for CL50 and CL70 (“Ionomer”, “Carbon” and “Platinum” indicate the WU respectively by ionomer, carbon and Pt/C in catalyst or composite layer); representation of the water uptake by ionomer, Pt/C and platinum in (e) CL50NoPt and CL70NoPt and (f) CL50 and in CL70. | ||
Regarding the carbon components, it is evident that the Pt/C exhibits significantly greater water uptake compared to carbon alone (WU = 0.17 at 90% RH, ∼3–4 times higher than carbon). Carbon powders inherently possess hydrophobic characteristics, whereas the Pt/C mix displays considerably greater hydrophilicity due to the wetting properties of platinum (Pt). Existing literature demonstrates that carbon (C) and Pt/C isotherms exhibit minimal sorption at low relative humidity (RH) levels, followed by an exponentially increasing sorption at higher RH ranges.20 This behavior can be attributed to a multi-stage process: at low RH conditions, water molecules are primarily adsorbed onto hydrophilic sites like Pt particles, as well as oxygen-containing functional groups on carbon and the edges of carbon crystallites.21 In the intermediate RH range, multiple layers of water form around hydrophilic sites through hydrogen bonding. At elevated RH conditions, water clusters form, and capillary condensation occurs.22 Literature also indicates that the fraction and size of mesopores capable of undergoing capillary condensation significantly affect the sorption mechanism.23
The results obtained for catalyst layers CL50 and CL70 confirm this mechanism, as they exhibit higher water uptake than the ionomer alone at various humidity levels (Fig. 2(a); +30% and +12% for CL50 and CL70 at Rh = 70%). It suggests that the Pt/C contributes to water retention and transport mechanisms. This phenomenon is confirmed by the trend of samples without Pt (CL50NoPt and CL70NoPt) presenting lower water uptakes than the ionomer alone.
To gain a deeper insight into how the Pt/C and carbon affect the water transport mechanism within the catalyst layer, we employed relatively straightforward models, initially drawing upon existing literature models and subsequently employing analytical models. Typically, when examining sorption isotherms, a standard representation is used, which is independent of ion exchange capacity (IEC). For instance, we observe variations in the local hydration parameter (λ), defined as the quantity of water molecules absorbed per sulfonic acid group, in relation to the water activity (aw), as depicted in Fig. 2(b). In the context of catalyst layers, we calculated λ based on the ionomer content present within the catalyst layer (as described in the Experimental section). While we acknowledge that both carbon and the Pt/C influence the overall sorption mechanism, this simplified approach enables us to better comprehend their respective impacts.
Examining the component ratios and their sorption characteristics in their pure states, it appears that the curve obtained for CL70NoPt aligns with that of the standard ionomer below 70% RH. In this case, the high ionomer content likely diminishes the role of carbon. However, beyond 70% RH, an increased λ is observed, possibly due to the carbon's influence.
Conversely, the CL50NoPt sample exhibits greater λ than the 50% standardized ionomer, indicating that in this composition, carbon may enhance the CL's water-absorption capacity. These observations underscore the influence of the carbon network structure on the water uptake of the ionomer/carbon mixture. With a higher proportion of carbon in CL50NoPt than in CL70NoPt, it is likely that carbon aggregation and percolation are more pronounced, potentially enhancing water absorption or impacting the hydrophilicity of the ionomer. In CL50NoPt, the presence of a well-defined carbon network contributes to the formation of an optimal ionomer structure, leading to greater water sorption. Conversely, in the CL70NoPt blend, the excessive amount of ionomer may prevent such structuring, potentially resulting in the observed limited water sorption. Note that ionomer structuring phenomena have been extensively studied in existing literature.15,24,25 It has been shown, for instance, that enhancing ionomer structuring through variations in chemical composition or annealing procedures can facilitate increased water sorption. This often involves a clustering phenomenon that enhances ionic conductivity while preserving mechanical properties.
Ionomers employed in catalyst and composite layers exhibit a sigmoidal isotherm pattern, resembling a Brunauer–Emmett–Teller (BET) type II isotherm. As discussed in the literature for ionomers, this curve can be divided into three segments: the initial section at low aw corresponds to the formation of the primary hydration sphere of acid groups (Langmuir sites), the second section is a linear portion associated with Henry's sorption, and the final one is a partially convex segment corresponding to the formation of water clusters.26 To compare the transport mechanisms in the material, we can fit the experimental data with various established analytical models found in the literature.27 It appears that the New Dual Mode Sorption (NDMS) model proposed by Li et al.27 is better suited for this particular type of polymer, considering the presence of distinct phases or sites that can interact with water. The model is grounded in a multilayer sorption theory and essentially characterizes sorption as the combination of two distinct modes: one associated with the polymer matrix, denoted as λ1, and the other occurring within micro voids, denoted as λ2. The overall hydration number λ within the polymer is simply the sum of λ1 and λ2 and is defined according to eqn (1):
 | (1) |
For the IN1515 ionomer, Table 2 illustrates that the C parameter is approximately 2. This parameter is predominantly influenced by the ionic functionalities and the nature of the polymer backbone. In the case of IN1515, which boasts an aromatic structure, this value is lower than that of Nafion, which is a polymer with a more flexible backbone conducive to enhanced water vapor sorption.15 When IN1515 is combined with carbon or Pt/C, we observe an increase in this parameter, except for CL70NoPt, which exhibits a behavior like the pristine ionomer. Consequently, it appears that the addition of these compounds substantially enhances the material's sorption capabilities. Notably, this property experiences more significant improvement with the inclusion of Pt/C, underscoring the pivotal role of platinum. Indeed, for a 30% addition (CL70), we observe a 43% increase in C related in sorption capacity, while a 50% addition (CL50) increases by 92% the sorption capacity, indicating a synergistic effect of the two compounds, likely attributable to interface effects.
| Materials | k | C | A |
|---|---|---|---|
| IN1515 | 0.81 ± 0.006 | 1.64 ± 0.03 | 17.3 ± 1.3 |
| CL50 | 0.86 ± 0.004 | 4.20 ± 0.07 | 5.4 ± 0.3 |
| CL50NoPt | 0.88 ± 0.007 | 2.32 ± 0.06 | 10.3 ± 1.2 |
| CL70 | 0.92 ± 0.008 | 2.09 ± 0.08 | 9.0 ± 1.7 |
| CL70NoPt | 0.93 ± 0.009 | 1.46 ± 0.07 | 6.5 ± 1.3 |
Turning to the interactions between the polymer and water vapor, the k parameter appears to be higher for catalyst layers. As reported in the literature for various ionomers,15,27 this parameter is typically close to 0.8 and primarily relies on the ionic functionalities within the ionomer. Here, the presence of carbon appears to enhance these interactions compared to the ionomer, and they appear to be stronger in the absence of Pt (0.88 for CL50NoPt instead of 0.86 for CL50). As noted by Li et al.,27 the A parameter serves to quantify the interactions between the polymer microvoids and water vapor. The value determined for ionomer IN1515 aligns with existing literature and is generally elevated.15 For example, in our previous work, this parameter was close to 11 for Nafion.15 Consequently, A parameter is slightly higher in IN1515. As elucidated by Li et al., the curvature of the sorption isotherm at high values of aw is linked to the clustering phenomenon of water molecules in multiple layers around the ionic sites, thus contributing to matrix inflation, and can directly be correlated with the A value. Therefore, larger A values correspond to more pronounced swelling/clustering phenomena. However, it is noteworthy that this parameter decreases for catalyst layers, both with and without Pt. This decrease is more pronounced for the Pt/C-IN1515 mixture (respectively 5.4 and 9 for CL50 and CL70 compared to 17.3 for IN1515). Hence, in these materials, the processes of clustering and swelling appear to be less prominent.
Drawing insights from the literature,28,29 it is evident that this clustering mechanism is crucial for ion conduction within ionomers. By extrapolating this, it seems plausible that the conduction mechanism within the ionomer is likely not optimal in the catalyst layers. Yet, once combined in the mixture with carbon and platinum, it appears to become substantially more effective. This reaffirms that the transport mechanism of water molecules differs from what is observed in the ionomer alone.
It is now widely acknowledged that carbon and Pt/C play a key role in the water transport mechanism within catalyst layers. In our quest for a deeper understanding of this phenomenon, we employed an alternative model-based approach. Initially, we employed an additive model, presuming that the water uptake by the catalyst layer can be expressed as the cumulative effect of the contributions from the ionomer, the carbon and/or the Pt/C, scaled to their respective component proportions. This concept is encapsulated in the following equation:
| WUCL = xio × WUio + (1 − xio)WUCorC/Pt | (2) |
By employing the least squares method, the ionomer mass proportion can be accurately estimated, denoted as xio. This model was applied to all four samples under investigation. However, it appears to be better suited for carbon-based materials, as visually demonstrated in Fig. 2(c). Notably, for CL50NoPt and CL70NoPt, we obtained proportions of 54% and 70%, respectively, along with excellent regression coefficients. It is worth noting a slight deviation between the model and the high humidity experimental results for both these samples. This discrepancy indicates that the mechanisms involved in low and medium relative humidity (RH) sorption, such as water molecule adsorption onto hydrophilic sites and the creation of water layers around these sites, are essentially additive processes. Furthermore, it appears that the clustering, swelling, and capillary mechanisms, typically observed in carbon materials, are somewhat enhanced when carbon is present within the mixture. With the help of this analytical model, it is possible to decouple and estimate the proportions of water absorbed by the ionomer and the carbon, respectively (see Fig. 2(e)). It can be observed that very little water is absorbed by the carbon in CL70NoPt. With a significant proportion of ionomer, this material tends to behave like the ionomer membrane.
Interestingly, this cumulative model does not align well with Pt/C-IN1515 blends. As alluded earlier, there appears to be an interface phenomenon that leads to additional water absorption in these materials. Since the primary distinction between these mixtures and the ones studied previously is the inclusion of Pt/C, it is reasonable to suppose that this phenomenon is partially linked to the presence of platinum. To quantify it, we employed another additive model. In this case, we postulated that the water uptake within the catalyst layer containing Pt was equivalent to the water uptake within the layer without Pt corresponding to water uptake by ionomer and carbon, augmented by the contribution from the interface mainly induced by the presence of platinum. This concept is encapsulated in the following equations:
| WUCL50 = WUCL50NoPt + WUCL50_Interface = xio × WUio + (1 − xio)WUC + WUCL50_Interface | (3) |
With xio = 0.54
| WUCL70 = WUCL70NoPt + WUCL70_Interface = xio × WUio + (1 − xio)WUC + WUCL70_Interface | (4) |
With xio = 0.70.
The outcomes of this estimation are depicted in Fig. 2(d). Notably, the water absorption within the interface becomes more prominent under high humidity conditions. At lower and moderate humidity levels, the interface's contribution to the water transport mechanism appears to be minimal. It is worth noting that the water absorbed by the interface in CL50 surpasses that of CL70, likely due to a more pronounced interface effect in CL50. Considering that application-designed catalyst layers are typically constructed with even lower levels of ionomers (between 20 and 30%), we can anticipate that the interface effects will be even more pronounced in realistic formulations. The respective proportions of water taken up by the ionomer, carbon, and platinum were estimated and are presented in Fig. 2(f). For the two catalyst layers studied, there is a decrease in the proportion of water up-taken by the ionomer as a function of humidity, in favor of water being absorbed by the platinum, while the proportion taken up by the carbon remains fairly stable, confirming the significant role of platinum at high humidity levels. It is also observable that, again, the proportion of water absorbed by platinum is much higher in CL50, indicating the decisive role of the catalyst/ionomer interface. Note that the enhanced water sorption in the three-phase samples carbon–platinum–ionomer may also relate to additional sorption sites introduced during synthesis, as the surface of carbon particles in the full catalyst layer may be modified with respect to Pt-free samples.
The preliminary findings from macroscopic analyses suggest that the water sorption mechanism of the aromatic ionomer when it is part of a catalyst layer differs from its typical behavior in a membrane composed solely of the same ionomer. As shown by the NDMS model, it seems that the presence of the Pt/C appears to induce structural changes such as a reduction of the swelling/clustering phenomenon of the ionomer in the catalyst layer, likely due to both steric hindrance and interface effects. To gain a more comprehensive understanding of these structural changes and water uptake, detailed measurements at lower scales are imperative. Accordingly, we conducted complementary characterizations on the different samples by (i) small-angle neutron scattering (SANS) which allow to probe the microstructure of the ionomer within the catalyst layer, and (ii) humidity-controlled infrared (IR) spectroscopy to investigate the interface effects and the structural arrangement of water molecules during the sorption process at the molecular level. The analysed samples consist of the same catalyst layers (CL50 and CL70) as previously examined, compared alongside the IN1515 membrane used as a reference compound, as well as standard catalyst layers containing Nafion ionomer. This comparison aimed to assess the impact of variation in ionomer moisture behavior between the membrane and the catalyst layer.
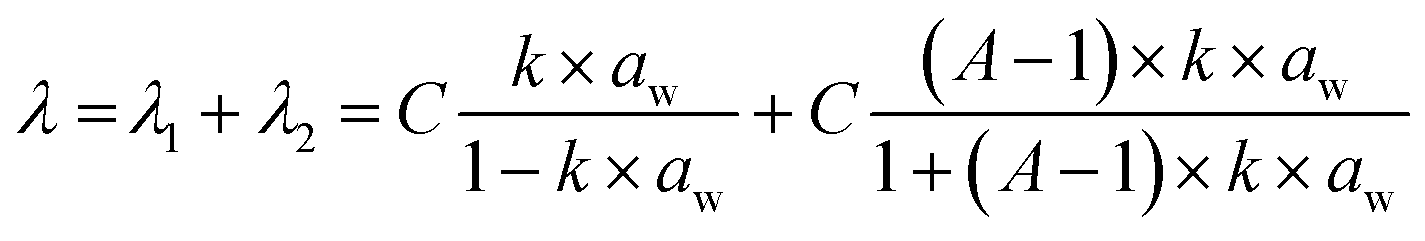
The 1D SANS profiles of membrane based on the IN1515 and extracted from an MEA are shown in Fig. 3(a) at varying hydration levels, while those for catalyst layers are shown in Fig. 3(b). In each case the high-Q incoherent background arising mostly from structural protons has been subtracted. Each of the I(Q) profile shows two scattering peaks indicating long-range structural ordering at two distinct length scales. The low Q maximum, (the block peak), has been previously identified as representing the mean separation between the self-assembled hydrophobic FPES block domains, while the high Q peak, (the ionomer peak), is caused by well-defined ionic clusters formed by the perfluorosulfonic side chains in the hydrophilic (ps-PES) blocks.
 | ||
| Fig. 3 Hydration-dependent nanostructures analyzed by SANS. (a) 1D SANS profiles of MEAs containing IN1515 at varying hydration levels at room temperature and immersed in water at 20 °C and 60 °C; (b) 1D SANS profiles of CL20 and CL70 catalyst layers at varying hydration levels at room temperature and immersed in water at 20 °C and 60 °C; mean separation distances d of hydrophobic block domains (c) and ionomer domains (d) derived from block peak and ionomer peak positions respectively, as a function of the hydration number. Expansion (d − d0) of the hydrophobic block domains (e) and ionomer domains (f), respectively, with d0 values extrapolated to λ = 0, as a function of the hydration number for IN1515 membrane, PEM (IN1515 membrane extracted from an MEA) and CL70 catalyst layers. The data for “pure” IN1515 samples are taken from works of Nguyen et al.13 | ||
In the data shown in Fig. 3(a) the two peaks are less well defined as compared to the SANS data for pure ionomers reported by Nguyen et al.13 This is likely due to some presence of carbon nanoparticles from the MEA catalyst layers, which could not be completely removed during sample preparation, leading to a higher background. In the case of the CL20 and CL70 catalyst layer, the peaks are further diminished with respect to the background as would be expected from the much larger amount of carbon.
In general, the positions (qmax) of SANS scattering maxima can be related to the average mean separation distance (d) between scattering objects by the formula d = 2π/qmax. It can clearly be seen in Fig. 3(a) that the two peaks shift to lower Q values as the hydration level of the membranes increases, giving an increase in d and indicating swelling of the polymer domains due to water uptake. In Fig. 3(b) the same trend can be seen for the ionomer peak; however, the block peak does not appear to shift as the hydration level increases, meaning that the superstructure due to hydrophobic blocks domains repetition remains mostly unchanged. This observation could indicate that blending the ionomer with carbon induces novel interactions of the polymer chains with the large amount of carbon particles in the catalyst layer samples, potentially favoring water uptake at the hydrophilic interfaces.30 We can hypothesize that the hydrophobic carbon nanoparticles cluster in and around the hydrophobic FPES blocks, thereby preventing their expansion as in the pure compound, where the superstructure can swell by block chains reorganisations.
As shown in Fig. 3(a) and (b), the hydrophilic domains in the IN1515 membranes undergo swelling when the hydration level increases from λ = 4 to 40. To further investigate this behavior, the spectra were fitted to precisely determine the size of the domains allowing the swelling laws to be extracted. Due to their low intensity, the peaks for the 20% IN1515 catalyst layer casts could not be fitted.
The values of dblock and dionomer derived from the fits are plotted against λ in Fig. 3(c) and (d) respectively. Also shown are the respective values for the pure IN1515 membrane reported by Nguyen et al.13 As the low λ points lie close to a straight line, by extrapolating by to λ = 0 a theoretical value for the initial (dry) size of the domains d0 can be found for each case. By subtracting these values from the original dblock and dionomer it is possible to plot the swelling solely due to increasing λ, independent of the d0 values, as represented in Fig. 3(e) and (f). The figures clearly show that, in most cases, increased hydration levels lead to an increase in both dblock and dionomer indicating both extension of PES hydrophilic backbone and the swelling of the ionic channels containing the side chains.
In comparison to the pure ionomer IN1515, these PEM have a relatively low dblock and high dionomer (Fig. 3(c) and (d)); however, when the initial domain size is considered (Fig. 3(e) and (f)) the expansion behavior is largely consistent, with a matching slope of ≈1 indicating similar 1-dimensional swelling but from varying initial d0 values. These differences in the d0 values are perhaps due to the presence of some carbon nanoparticles in the samples that limit the movement of the FPES block domains which form around them thereby restricting expansion of the PES chains on solvent evaporation leading to lower d0_block in the dry state. This may then require an increase in d0_ionomer to preserve the overall volume of the PES chains.
In contrast to the above, the catalyst layer sample exhibits significantly different behavior. As can be seen in Fig. 3(c), dblock is much lower in the catalyst layer than the other samples (≈225 Å). This is likely due to the much higher proportion of carbon than in the other samples. Additionally, dblock does not increase with hydration, rather remaining constant over the entire range studied. This means that the large numbers of carbon particles changes the FPES block domains organisation. All these results appear to confirm that the presence of Pt/C, even in small quantities within the catalyst layer, alters the interactions between the ionomer and water, with the carbon particles inducing new interactions, and/or inducing morphological changes at the local scale, undetectable with the present bulk-averaged nanoscale data. Further investigations would be needed to disentangle these possible effects and probe the localization of water sorbed at the level of carbon particles, as reported in Chabot et al.30 using advanced contrast variation techniques, which is beyond the s cope of this study.
SANS results partially confirm the findings of the DVS. Nevertheless, we need a better understanding of the mechanisms of water sorption and transport at molecular level to access the details of local interactions, which can be obtained using infrared (IR) synchrotron spectroscopy. The IR analyses were performed on the IN1515 membrane in acidic form as well as and various catalyst and composite layers.
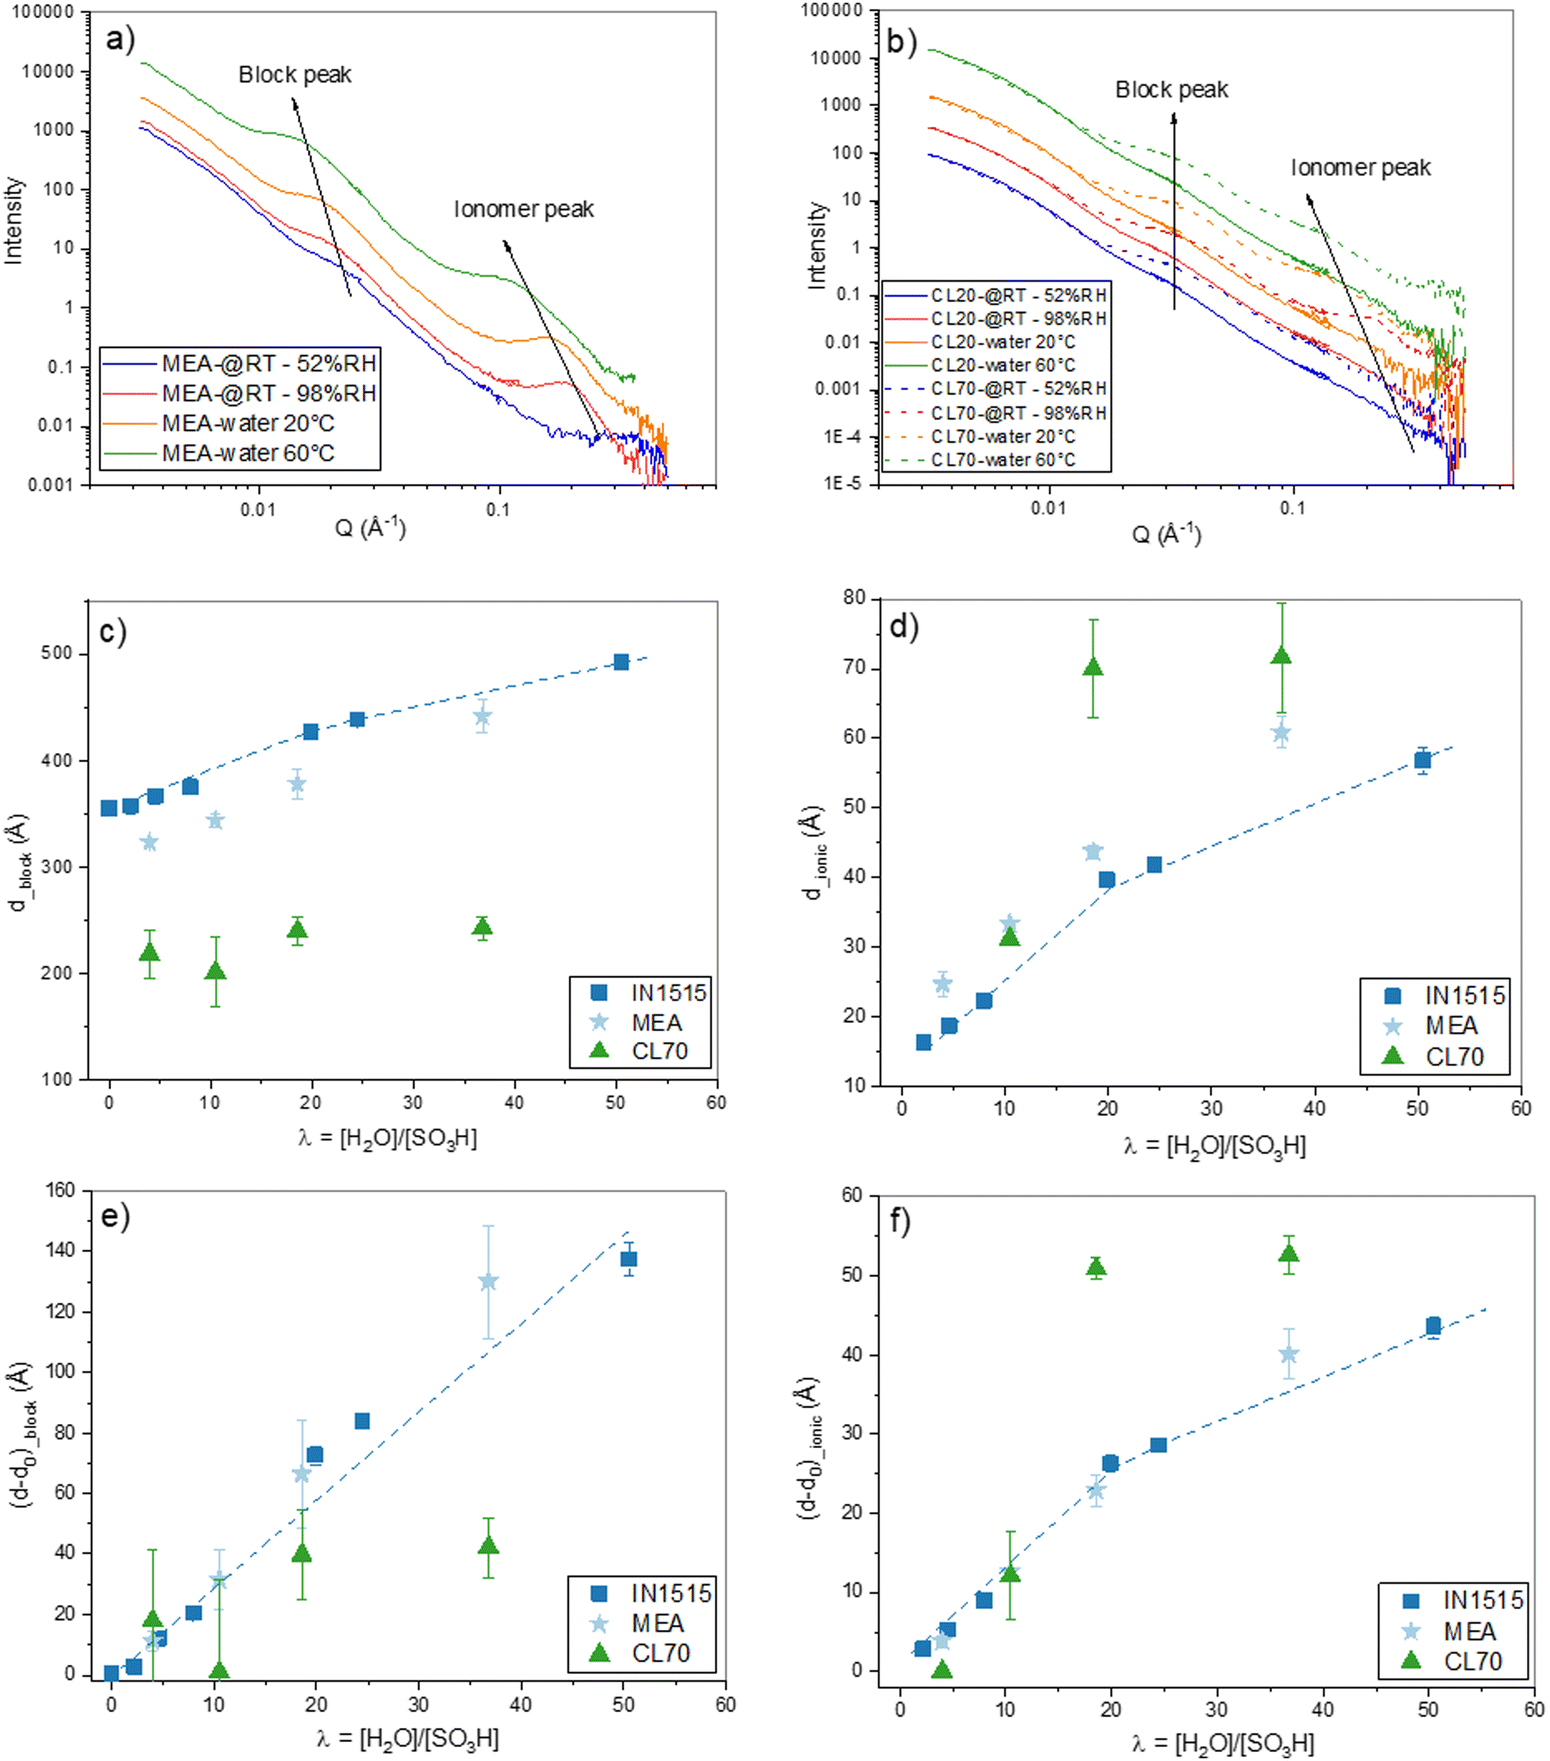
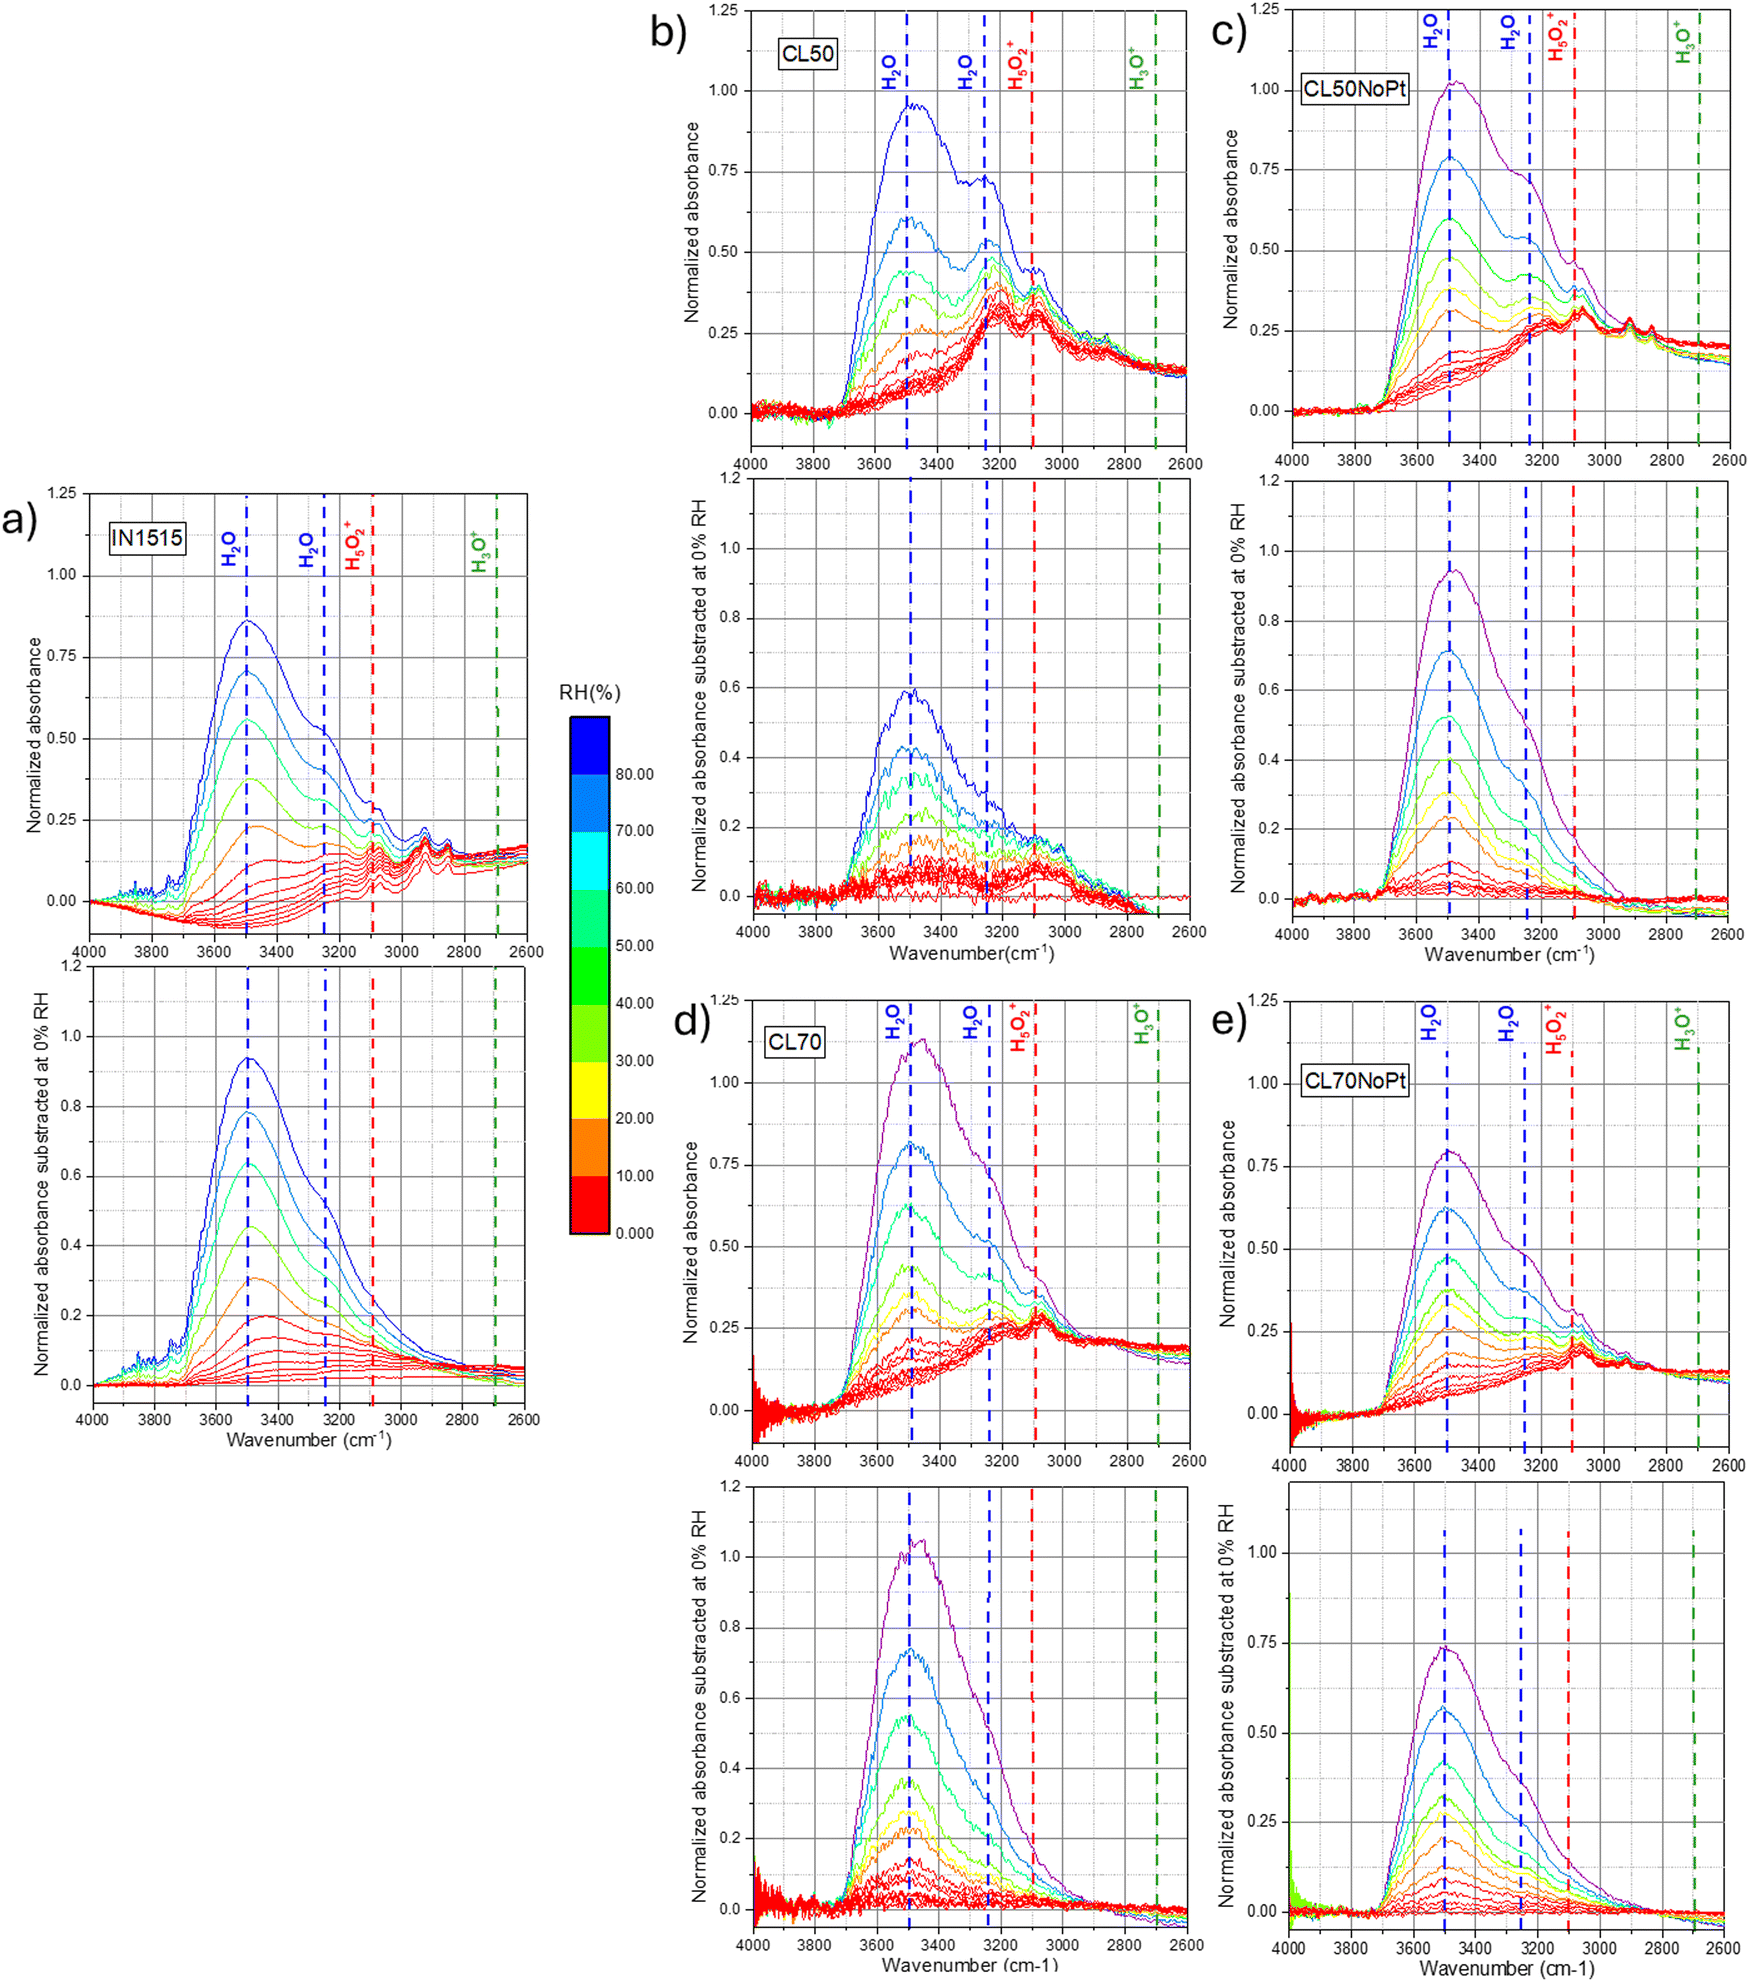
Several IN1515-based composite (ionomer/carbon) materials and catalyst layers (ionomer/C/Pt) deposited as thin films on a wafer substrate. We used different ratios of acidic IN1515 ionomers at 50 and 70 wt% with Pt/C and (labeled CL50 and CL70), and their analogues prepared with IN1515 in lithiated form (CL70Li and CL50Li). Composites with acidic IN1515 and carbon black were measured as Pt-free references (CL50NoPt CL70NoPt). The synchrotron IR spectra were recorded in the range of 600–4000 cm−1, where it is possible to scrutinize the intermolecular and intramolecular vibrational modes. We examined the influence of hydration through an in situ investigation employing a custom-designed vapor pressure control cell.31 For all samples, each experiment begins with a meticulously prepared dry state, achieved by subjecting the sample to 12 hours of vacuum treatment (10−5 mbar) at 60 °C. The in situ data, shown in Fig. 4 and 6, correspond to various relative humidity (RH) levels imposed by the vapor pressure, ranging from dry conditions (defined as 0% RH) to full hydration (100% RH).
 | ||
| Fig. 4 Hydration-dependent molecular structure probed by IR. In situ MIR spectra of (a) IN1515, (b) CL50, (c) CL50NoPt, (d) CL70, (e) CL70NoPt in the range 2800–3800 cm−1 (top) spectra normalized to ionomer backbone band at 1588 cm−1, (bottom) subtracted spectra from its value at 0% RH): the characteristic bands of specific species (H2O, H3O+, H5O2+ and SO3H) relative to the exposition of materials to humidity are indicated by dotted lines. | ||
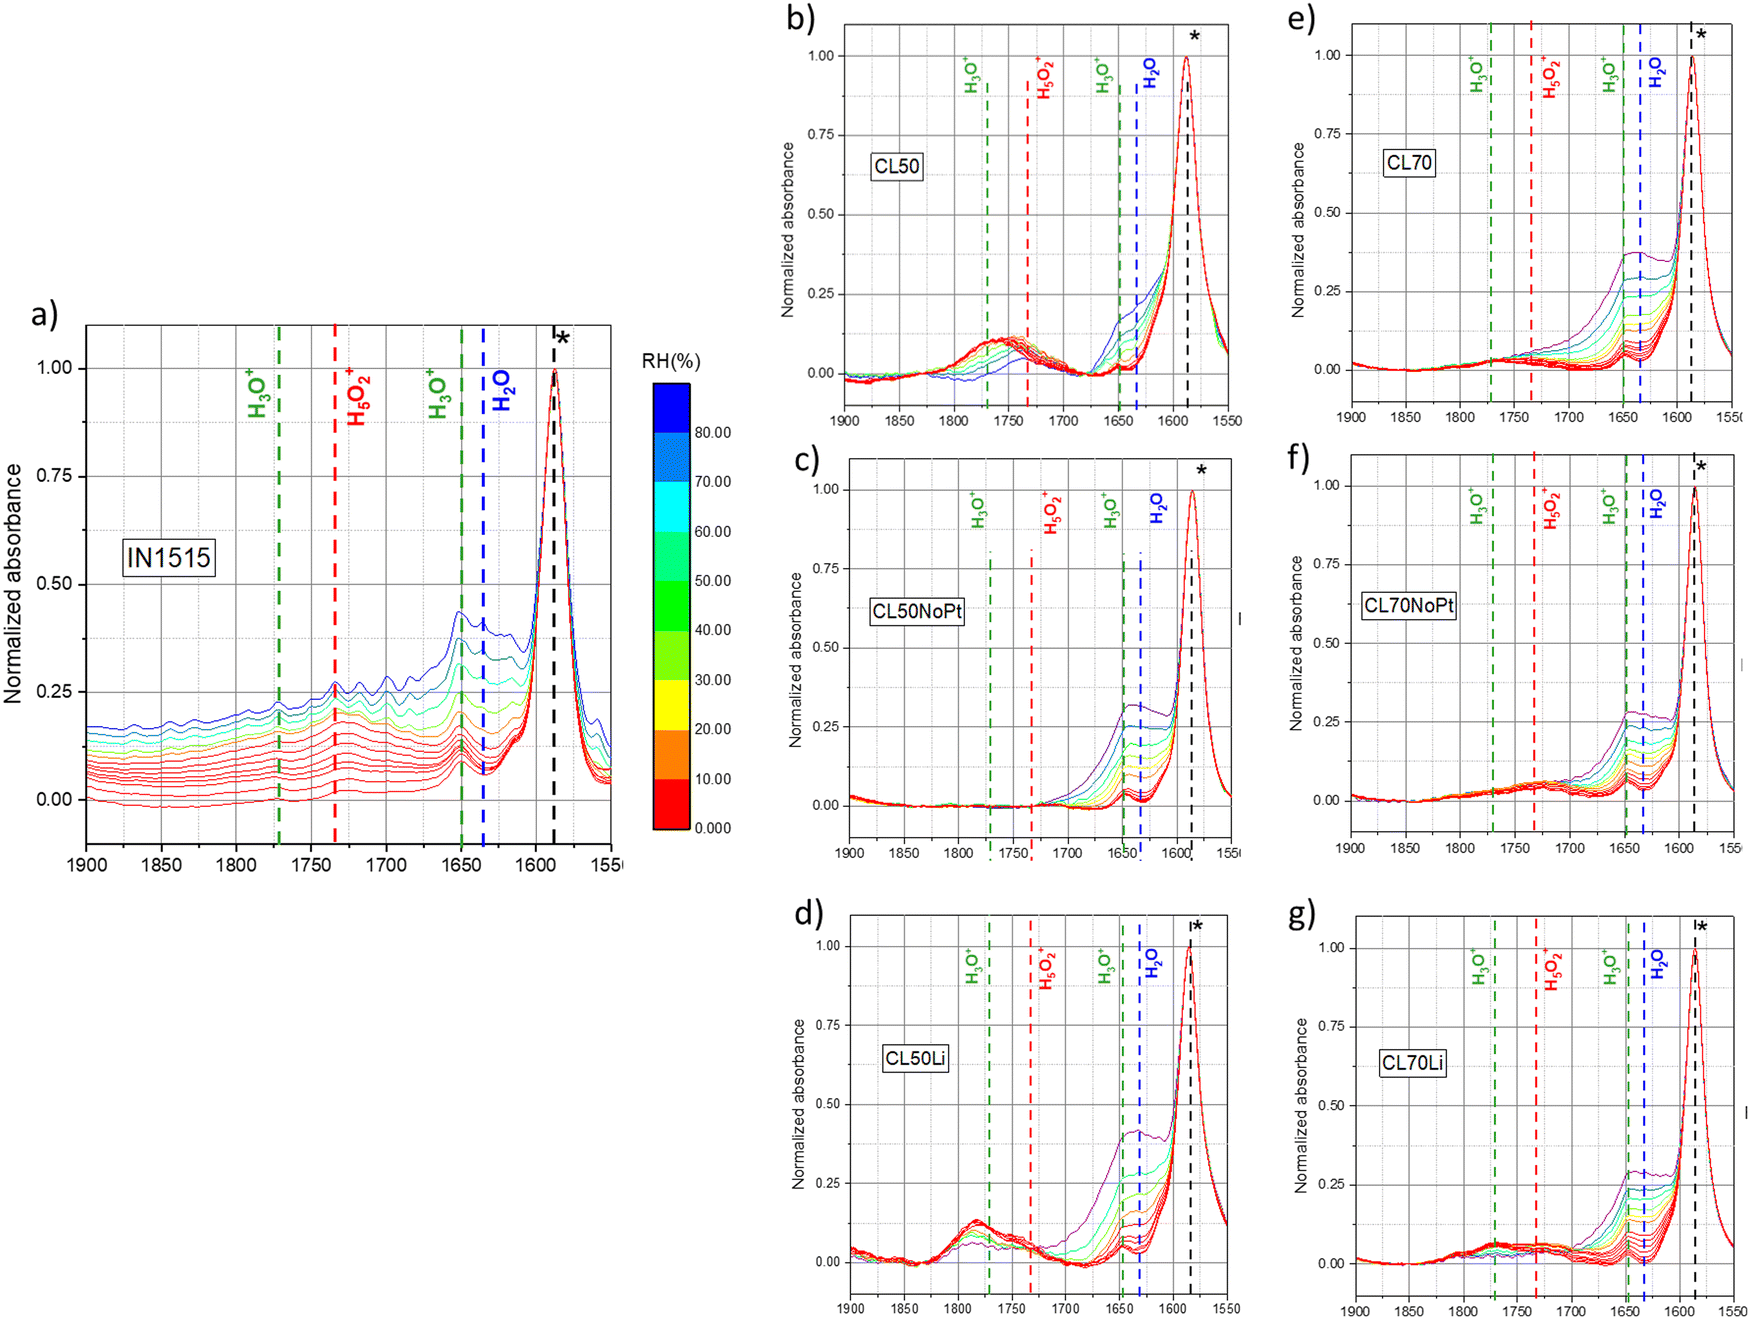
In these figures, we have presented absorbance spectra and difference spectra, which were obtained by subtracting the spectra at specific hydration states by the reference dry spectrum. To provide a quantitative description of the initial stages of the hydration process, it was essential to assign the main vibrational modes. Our analysis of the mid-infrared (MIR) data was supplemented by leveraging the knowledge gained from a prior in situ investigation of the IN1515 membrane using the same protocol and experimental techniques.14,31 Given our primary objective of exploring proton dissociation mechanisms, the formation of protonic species, and the role and state of water molecules, particularly in the early stages of hydration, our focus was primarily directed toward the vibrational bands associated with H2O: bending at 1740 cm−1; stretching at 3250 and 3500 cm−1, protonic species: stretching of OH bond in H3O+ between 2600–2800 cm−1, in H5O2+ at 3100 cm−1, inter-molecular signature for SO3−·H3O+/H2O interactions at 1057 cm−1; Zundel, ion (H5O2+) bands at 1740 cm−1.31–34 An assignment of the various observable bands in the MIR spectrum of the IN1515 membrane is provided in Fig. S1 and S2 (ESI†), as well as in Table S1 (ESI†).
Fig. 4 displays the in situ absorbance spectra of the IN1515 ionomer alongside various catalyst layers within the 3800–2800 cm−1 range. In this spectral range, it is possible to track the characteristic stretching bands of H2O at 3500 and 3250 cm−1, as well as the OH band in H3O+ and Zundel ions respectively between 2600–2800 and at, 2930 cm−1 as a function of humidity (see attribution of FTIR bands in IN1515 in ESI†). Regarding the water bands, since the spectra have been normalized to a characteristic ionomer band, it allows for a comparison of the quantities of water formed. It becomes evident that the water bands are much more pronounced and narrower in the case of catalyst layers, particularly in CL50, when compared to the reference IN1515 membrane. Notably, CL50 exhibits a more prominent band at 3500 cm−1 than in CL50NoPt, indicating the significant role of Pt in the water transport mechanism. On the other hand, CL70 and CL70NoPt demonstrate similar behaviors, suggesting a reduced impact of platinum, likely due to the higher proportion of ionomer in the material and, potentially, poor Pt/C percolation. For the additional characteristic bands of H3O+ and Zundel ions, an increase in intensity is observable for Zundel ions with respect to humidity level across all materials, unlike the relatively broad band characteristic of H3O+ functions around 2600–2800 cm−1. This indicates that H3O+ ions are already well formed in the dry state, with minimal evolution observed with changes in humidity level. Further investigation into Zundel ions will be conducted, focusing on a more readily observable band at 1770 cm−1.
For a more quantitative analysis of these data, the integral of the characteristic water band at 3500 cm−1 was calculated and plotted against moisture content for the various materials, as shown in Fig. 5. After adjusting the spectra to account for the quantity of IN1515 present, we included additional data that illustrates the behavior of IN1515 normalized to the ionomer content within the catalyst layer (IN1515_50% and IN1515_70%). The figures reveal that, at most humidity levels, the catalyst layers absorb more water than the relative amount of pure ionomer. This confirms the DVS results, which indicated that the catalyst layers absorb more water due to interface effects induced by the presence of carbon.
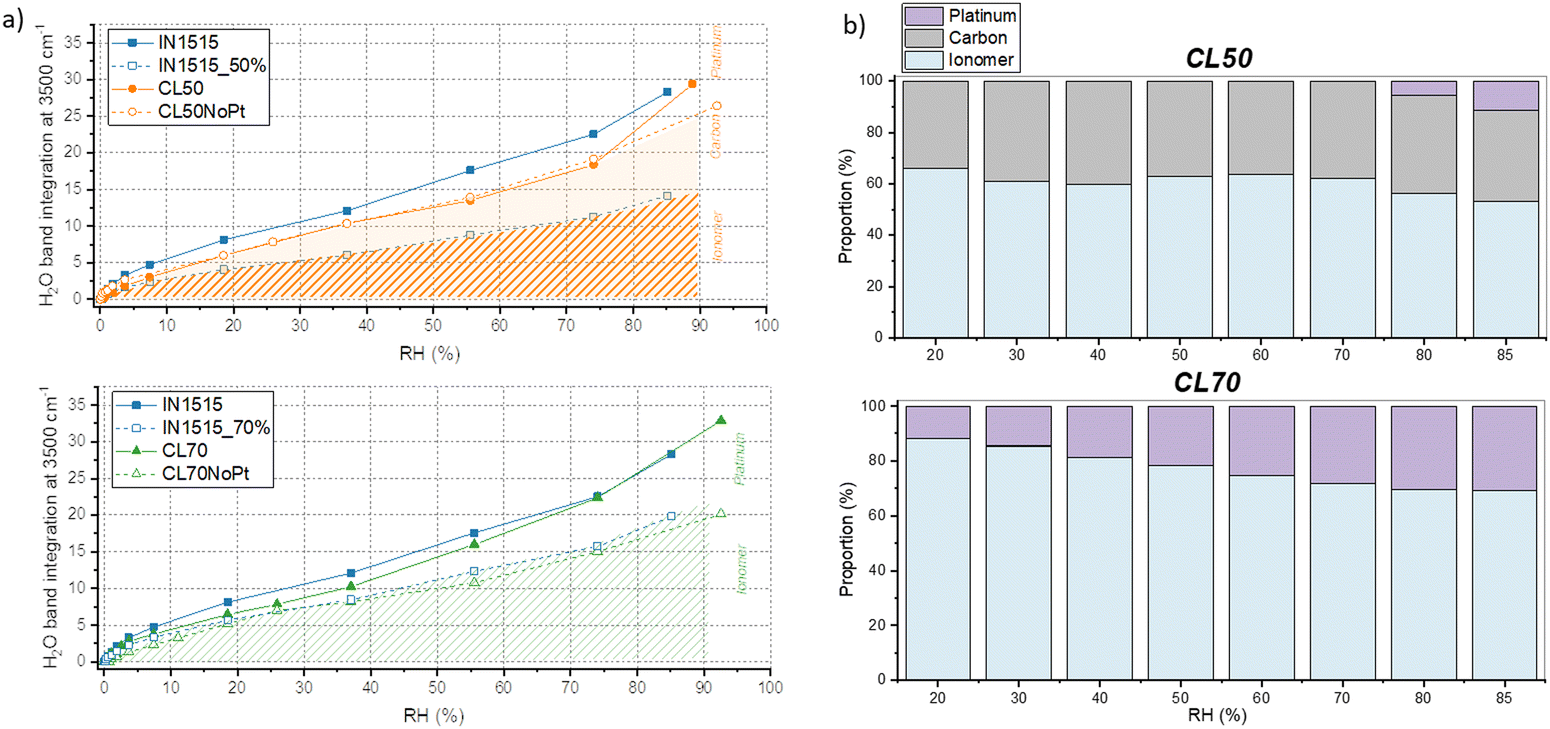 | ||
| Fig. 5 Interactions of water with the ionomer, carbon, and platinum analyzed by IR. (a) Band integration at 3500 cm−1 (band normalized to ionomer backbone band at 1588 cm−1, integration subtracted from its value at 0% RH) versus (humidity for: above) (CL50 and CL50NoPt and below) CL70 and CL70NoPt compared to IN1515 membrane (IN1515_50% and IN1515_70% correspond to 50% and 70% of the integration values within these bands, respectively), (b) analytical simulation of water (corresponding to FTIR band at 3500 cm−1) in interaction with ionomer, carbon and platinum in CL50 and CL70. | ||
At very high humidity levels, within the range associated with water clustering behavior, we observed a significant change in the gradient of the sorption curves for the catalyst layers (CLs) as compared to the pure ionomer, indicating that they begin to uptake additional water. This abrupt shift in the gradient is also consistent with the previous water sorption measurements shown in Fig. 2. Furthermore, CL50 and CL50NoPt exhibit relatively consistent trends along the sorption isotherm, except at high humidity levels where CL50 demonstrates an additional formation of water. This suggests a potential role of platinum in promoting this extra water formation. It can also be observed that the bands at 3500 and 3250 cm−1 are very structured in the materials CL50 compared to those that can be observed for the membrane IN1515, which may indicate that the form of water present in the catalyst layers is probably different from that present in the ionomer. The latter is probably bulk-like while that present in the catalyst layer might rather be linked to an interface. This phenomenon being less marked for platinum-free materials (CL50NoPt), it seems that this interaction is related to the presence of platinum.
In contrast, the behavior of the 70% catalyst layers is slightly different. CL70NoPt closely resembles the ionomer's behavior normalized at 70%, indicating few interface effects. CL70 exhibits significantly higher water molecule formation, especially at high humidity levels, compared to CL70NoPt. This indicates that the water uptake at the catalyst–ionomer interface is again influenced by the presence of platinum in the catalyst. This seems to be confirmed by the work of Iwasita et al.,35 in which the vibrational modes of water on platinum surfaces were studied. Indeed, different characteristics have been demonstrated for the two water bands at 3150 and 3270 cm−1: the first one appears to correspond to water adsorbed on platinum (Pt–H2O), while the second one would correspond to water dissociated on platinum (Pt–OH).
As previously, it is possible to distinguish the various interactions of water: (i) with the ionomer estimated from a ratio of the IN1515 membrane curve (IN1515_50% or IN1515_70%), (ii) with the carbon, corresponding to the difference between this curve and that of the ionomer/carbon mixtures (CL50NoPt and CL70NoPt), and (iii) with the platinum, corresponding to the difference between the latter curve and that of the catalyst layer (CL50 and CL70). A schematic representation is provided in Fig. 5(a), and an estimate of the different proportions of these interactions is shown in Fig. 5(b). The results obtained are somewhat different from those obtained with gravimetric sorption measurements, probably because there are different forms of water: H2O, H3O+, H5O2+… and the advantage of FTIR spectroscopy is to be able to probe these different contributions. For CL50, the DVS and FTIR results are quite similar, with just the absence of water/Pt interactions at low RH in FTIR. For CL70, a similar behavior is also observed, even if no water/carbon interaction is visible in FTIR. These differences can be explained either by the existence of an interaction with another type of water molecules, often ionic, or by the fact that the band probed here corresponds to the stretching vibration of OH in water, often involving a significant number of water molecules with different environment and with various number of hydrogen bond with their neighbor. We will see in the following a different method to probe these different contributions of the O–H stretching.
To delve deeper into the mechanism of water sorption within the materials under investigation, we directed our attention toward the bending motion of water molecules around 1650 cm−1. The spectral range spanning from 1900 to 1500 cm−1 provides insights into the presence of various species, including H2O, H3O+, and H5O2+, all of which are involved in the hydration mechanism. As illustrated in Fig. 6, for the IN1515 membrane and further elucidated in Nguyen et al.'s work,14 the formation of H3O+ species is observed from the initial stages of sorption. With the increase in relative humidity (RH), the bands associated with this isolated entity diminish because of water absorption and the emergence of more complex hydrated protonic species. A noticeable transition can be observed, with the gradual replacement of the hydronium band at 1680 cm−1 by the Zundel band at 1730 cm−1. Consequently, this ionomer's behavior closely resembles that of Nafion, given their shared composition of Nafion-like side chains terminated by the same SO3− groups.
 | ||
| Fig. 6 In situ MIR spectra of (a) IN1515, (b) CL50, (c) CL50NoPt, (d) CL50Li, (e) CL70, (f) CL70NoPt, (g) CL70Li in the range 1500–1900 cm−1 (spectra normalized to ionomer backbone band at 1588 cm−1): the characteristic bands of specific species (H2O, H3O+, H5O2+) relative to the exposition of materials to humidity are indicated by dotted lines. (see Fig. S2 and S3, ESI†). | ||
The spectral region in the catalyst layers exhibits a markedly different profile. In these instances, the peak in the region associated with H3O+ is notably intense even under dry conditions. As the level of hydration increases, this peak undergoes a distinct shift towards lower wavenumbers, converging with the Zundel band, as hydronium ions and additional H2O molecules combine to form more complex species. The presence of H3O+ peaks even in the dry state suggests that the drying process may have been incomplete, a phenomenon previously documented in earlier studies.31 However, an alternative explanation could be that these peaks stem from another species with a similar bond energy. Given these uncertainties and the atypical shape and behavior of these peaks, further confirmation is required to attribute them definitively to H3O+/Zundel species.
Hence, we conducted a comparison of these spectra with catalyst layer samples containing Li+ as the cation. In this scenario, a dual peak is observed within the region where both H3O+ and Zundel bands are anticipated. Interestingly, these two bands exhibit high intensity in the dry state and gradually decrease in intensity as hydration levels rise, but their shape remains consistent, and there is no observable transition from one to the other. Since no protons are present in this sample, we hypothesize that these peaks are associated with the presence of the catalyst. As elucidated in the studies by Maillard et al.,36–38 CO molecules adsorb onto the platinum surface, and during the operation of PEMFCs, platinum can play a pivotal role in the corrosion of carbon, leading to the formation of oxidized species. These oxidized species may include phenol, ether, carboxylic and carbonyl groups on the carbon surface. Therefore, it is plausible to assign these observed bands to carbonyl groups adsorbed onto platinum or possibly onto carbon. While carbonyl species should also be present in the protonated samples, it is likely that they are obscured by the presence of hydronium/Zundel species.
Spectra from the catalyst layer (CL) samples lacking Pt exhibit no discernible peaks within this specific region, Fig. 6 and Fig. S2, S3 (ESI†). This observation serves as confirmation that the observed peaks can be attributed to species adsorbed on Pt, whether they are H3O+/Zundel or carbonyl species. It suggests that Pt creates an environment conducive to water absorption even under low humidity conditions. It is plausible that Pt interacts with certain sulfonic acid groups in IN1515, providing the protons necessary for the formation of hydronium ions. As humidity levels increase, these hydronium ions initially transform into Zundel ions and, potentially, other more complex species. At the highest humidity levels, water molecules begin to adopt a bulk-like behavior within the Pt environment. Spectra for those CL samples without Pt show no peaks of any kind in this region.
To gain deeper insights into the water sorption mechanism, we monitored the integration of bands at 1730 and 1770 cm−1 throughout the sorption process, as depicted in Fig. 7(a)–(d). As shown in Fig. 7(a), initially, at the onset of sorption, the band at 1770 cm−1 is present in CL50 but absent in the membrane, affirming the association of this band in CL50 with carbonyl species found in Pt/C. Subsequently, a consistent decline in the intensity of this band is observed with increasing moisture content. Conversely, the band at 1730 cm−1 exhibits a sudden increase in intensity up to 20% humidity and then remains stable throughout the isotherm (see Fig. 7(b)). For the band at 1730 cm−1, particularly at RH inferior to 70%, CL50 demonstrates behavior similar to that of the membrane, albeit at a lower intensity. In the case of CL50NoPt, the intensity of the Zundel and H3O+ bands is minimal and remains constant. Based on these observations, it can be inferred that very few ionic species (specifically Zundel and H3O+) are formed within the catalyst layers compared to the ionomer in the membrane. Furthermore, the absence of ionic species in catalyst layers without platinum suggests that the few ionic species formed in CL50 likely emerge in the proximity of platinum.
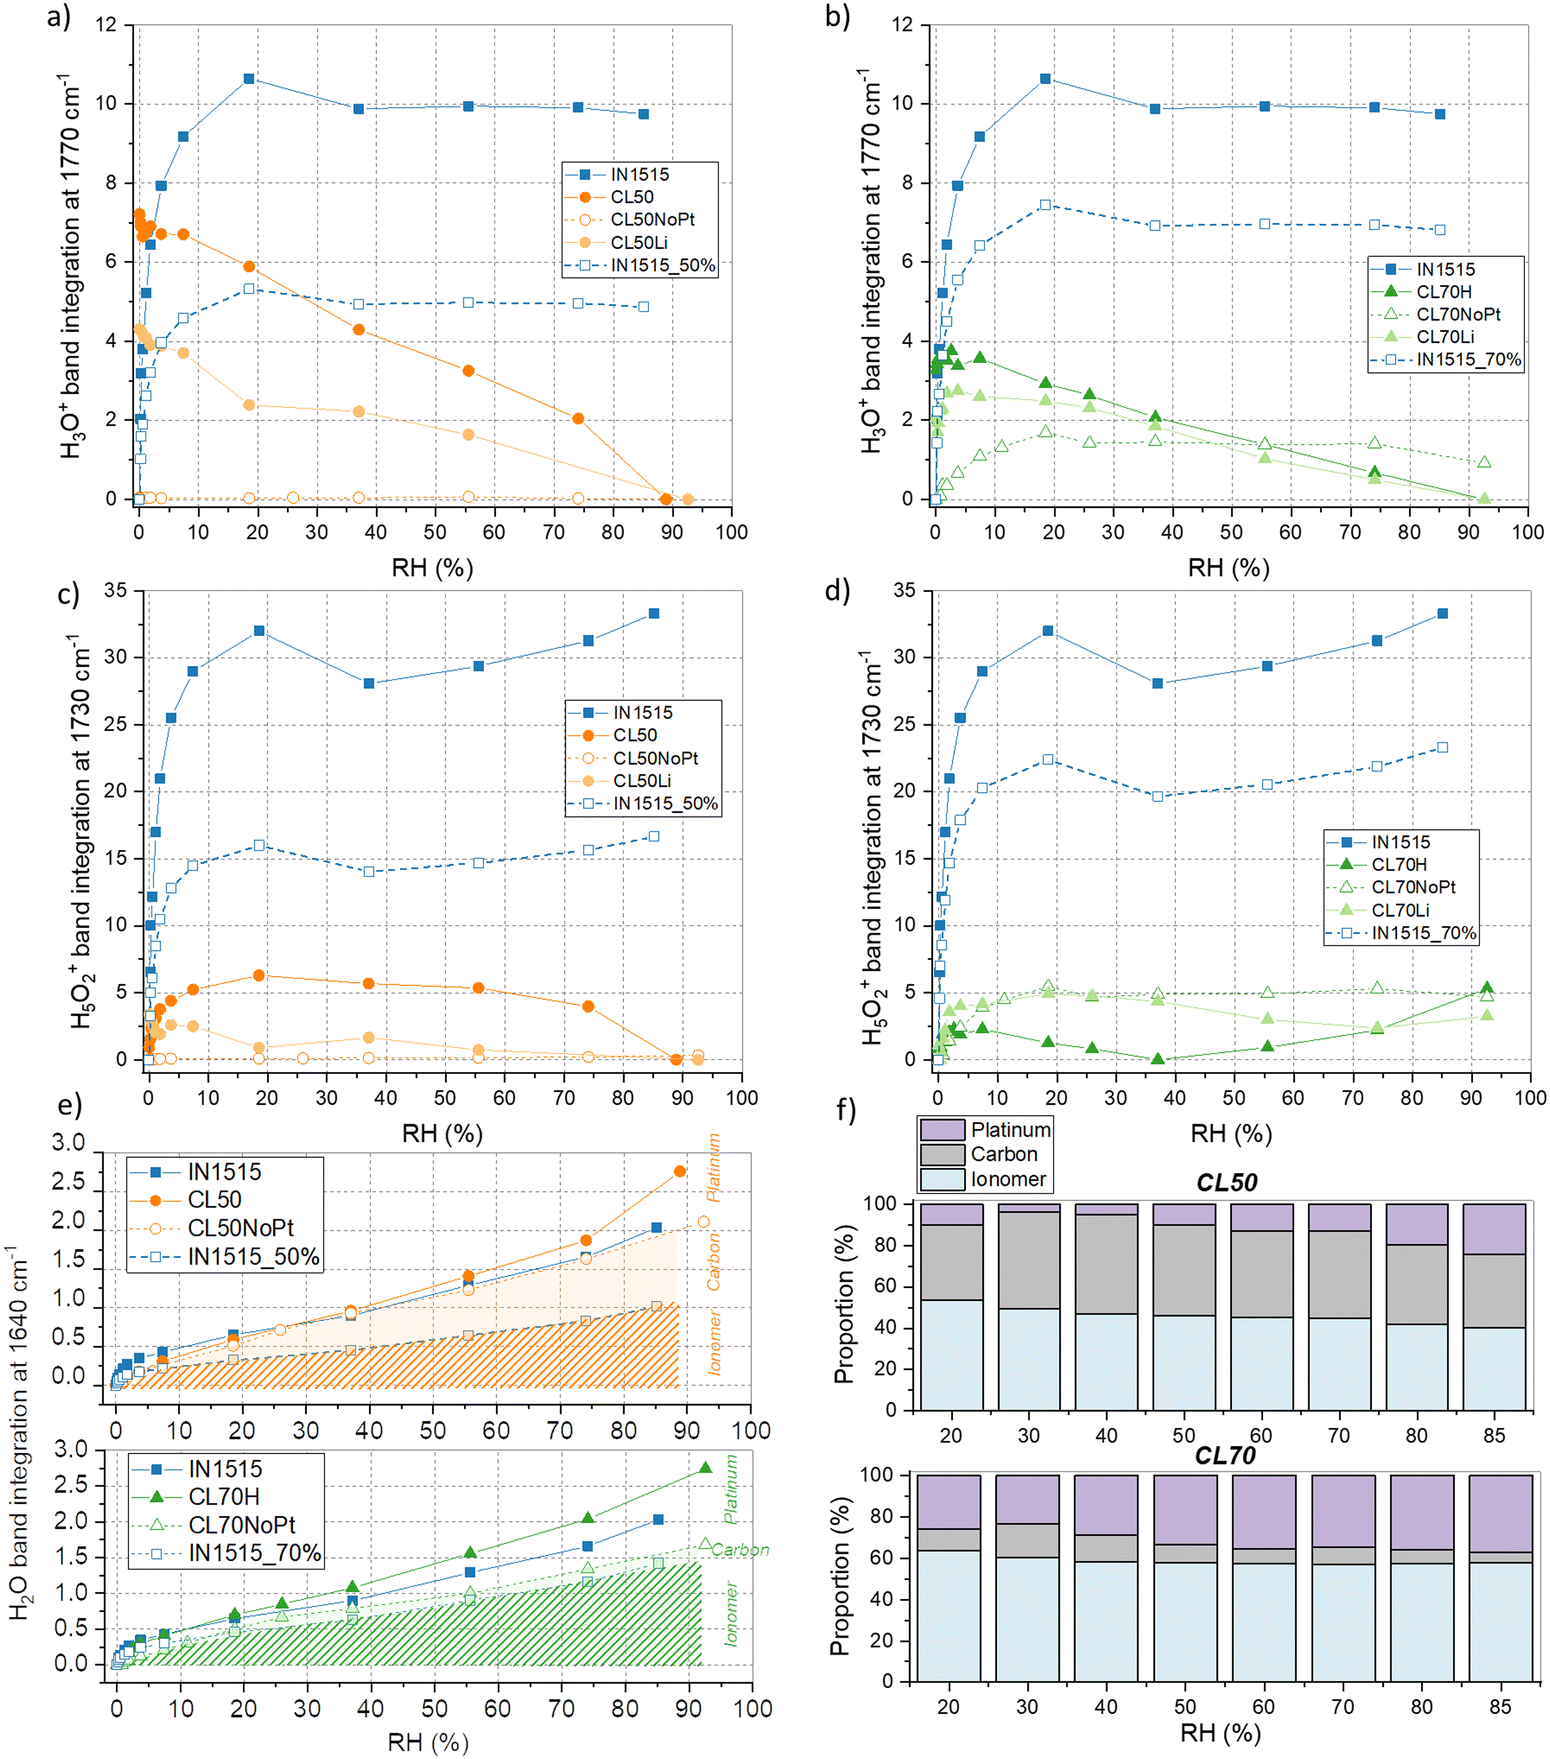 | ||
| Fig. 7 Interactions of water with the ionomer, carbon, and platinum analyzed by IR. Band integration at 1770, 1730 cm−1 (band normalized to ionomer backbone band at 1588 cm−1, integration subtracted from its value at 0% RH) versus humidity for (a), (c) CL50, CL50Li and CL50NoPt and (b), (d) CL70, CL70Li and CL70NoPt compared to the IN1515 membrane (IN1515_50% and IN1515_70% correspond to 50% and 70% of the integration values within these bands, respectively), (e) integration of bands at 1640 cm−1versus humidity for (above) IN1515, CL50, CL50NoPt, and IN1515_50%, and (below) IN1515, CL70, CL70NoPt, and IN1515_70%, with indications of water proportions absorbed by ionomer, carbon, and platinum, (f) analytical simulation of water (corresponding to FTIR band at 1640 cm−1) in interaction with ionomer, carbon and platinum in CL50 and CL70. | ||
In the case of CL70, as illustrated in Fig. 6 and Fig. S3 (ESI†), the band at 1730 cm−1 exhibits relatively stable behavior with changing moisture content. To gain further insights into this pattern, we delve into a more detailed analysis as presented in Fig. 7(b) and (d). Similar to CL50, there is a discernible band at 1770 cm−1 in CL70, in contrast to what is observed in the membrane. This suggests that this band in CL70 is indicative of carbonyl species near platinum. The behavior of CL70 closely parallels that of CL50, while for CL70NoPt, the formation of H3O+ species is observed, a phenomenon not observed in CL50NoPt. As for the band at 1730 cm−1, the trends observed in the catalyst layers are somewhat akin to those in the membrane, although with lower intensity. However, there is a greater formation of H3O+ and Zundel species in CL70NoPt, suggesting a behavior more in line with that of the membrane, due probably to excess of ionomer and the formation of bulky ionomer that is not in interaction with the carbon. The amount of ionic species is smaller in CL70 as compared to the membrane. In conclusion, it appears that the hydration mechanism within the catalyst layers differs significantly from that observed in the membrane. Very few ionic species are formed, likely predominantly at the catalyst–ionomer interface, with the primary product being water molecules. This could be a pivotal factor in understanding the conduction mechanism.
As the hydration mechanism primarily involves the formation of water molecules within the catalyst layers, we conducted a more comprehensive examination of the 1640 cm−1 band, as illustrated in Fig. 7(e) and (f). Our findings reveal that the formation of water molecules in CL50 and CL70 closely resembles that in the ionomer, with a slight upward trend noted at high humidity levels. Furthermore, we observed a reasonably comparable behavior in composite layers without catalysts, albeit partially mirroring the pure ionomer's behavior. However, the integration of the band in CL70NoPt is even lower, indicating that the surplus of water molecules generated at high moisture levels in the CL50 and CL70 layers is bound to the catalyst platinum. As previously and as presented in Fig. 7(e), it is possible to distinguish the different interactions of water with the ionomer, carbon, and platinum. From this, the various proportions can be assessed, as presented in Fig. 7(f). In comparison with the results obtained by DVS, it is noted that for CL50, there are lower proportions of hydronium with platinum and higher proportions, in contrast, with carbon, confirming the previous results indicating a strong interaction of platinum with SO3−/H+. For CL70, the results are quite similar, confirming the low proportion of ionic species formed during the hydration.
To explore this further, we depicted the difference in band integration between layers with and without catalysts and compared it to the water uptake at the simulated interface using sorption data. While this remains a hypothetical analysis, the trends closely align, providing strong evidence for interface effects in the CL50 and CL70 layers, which are in part attributed to the presence of platinum particles on the carbon's surface.
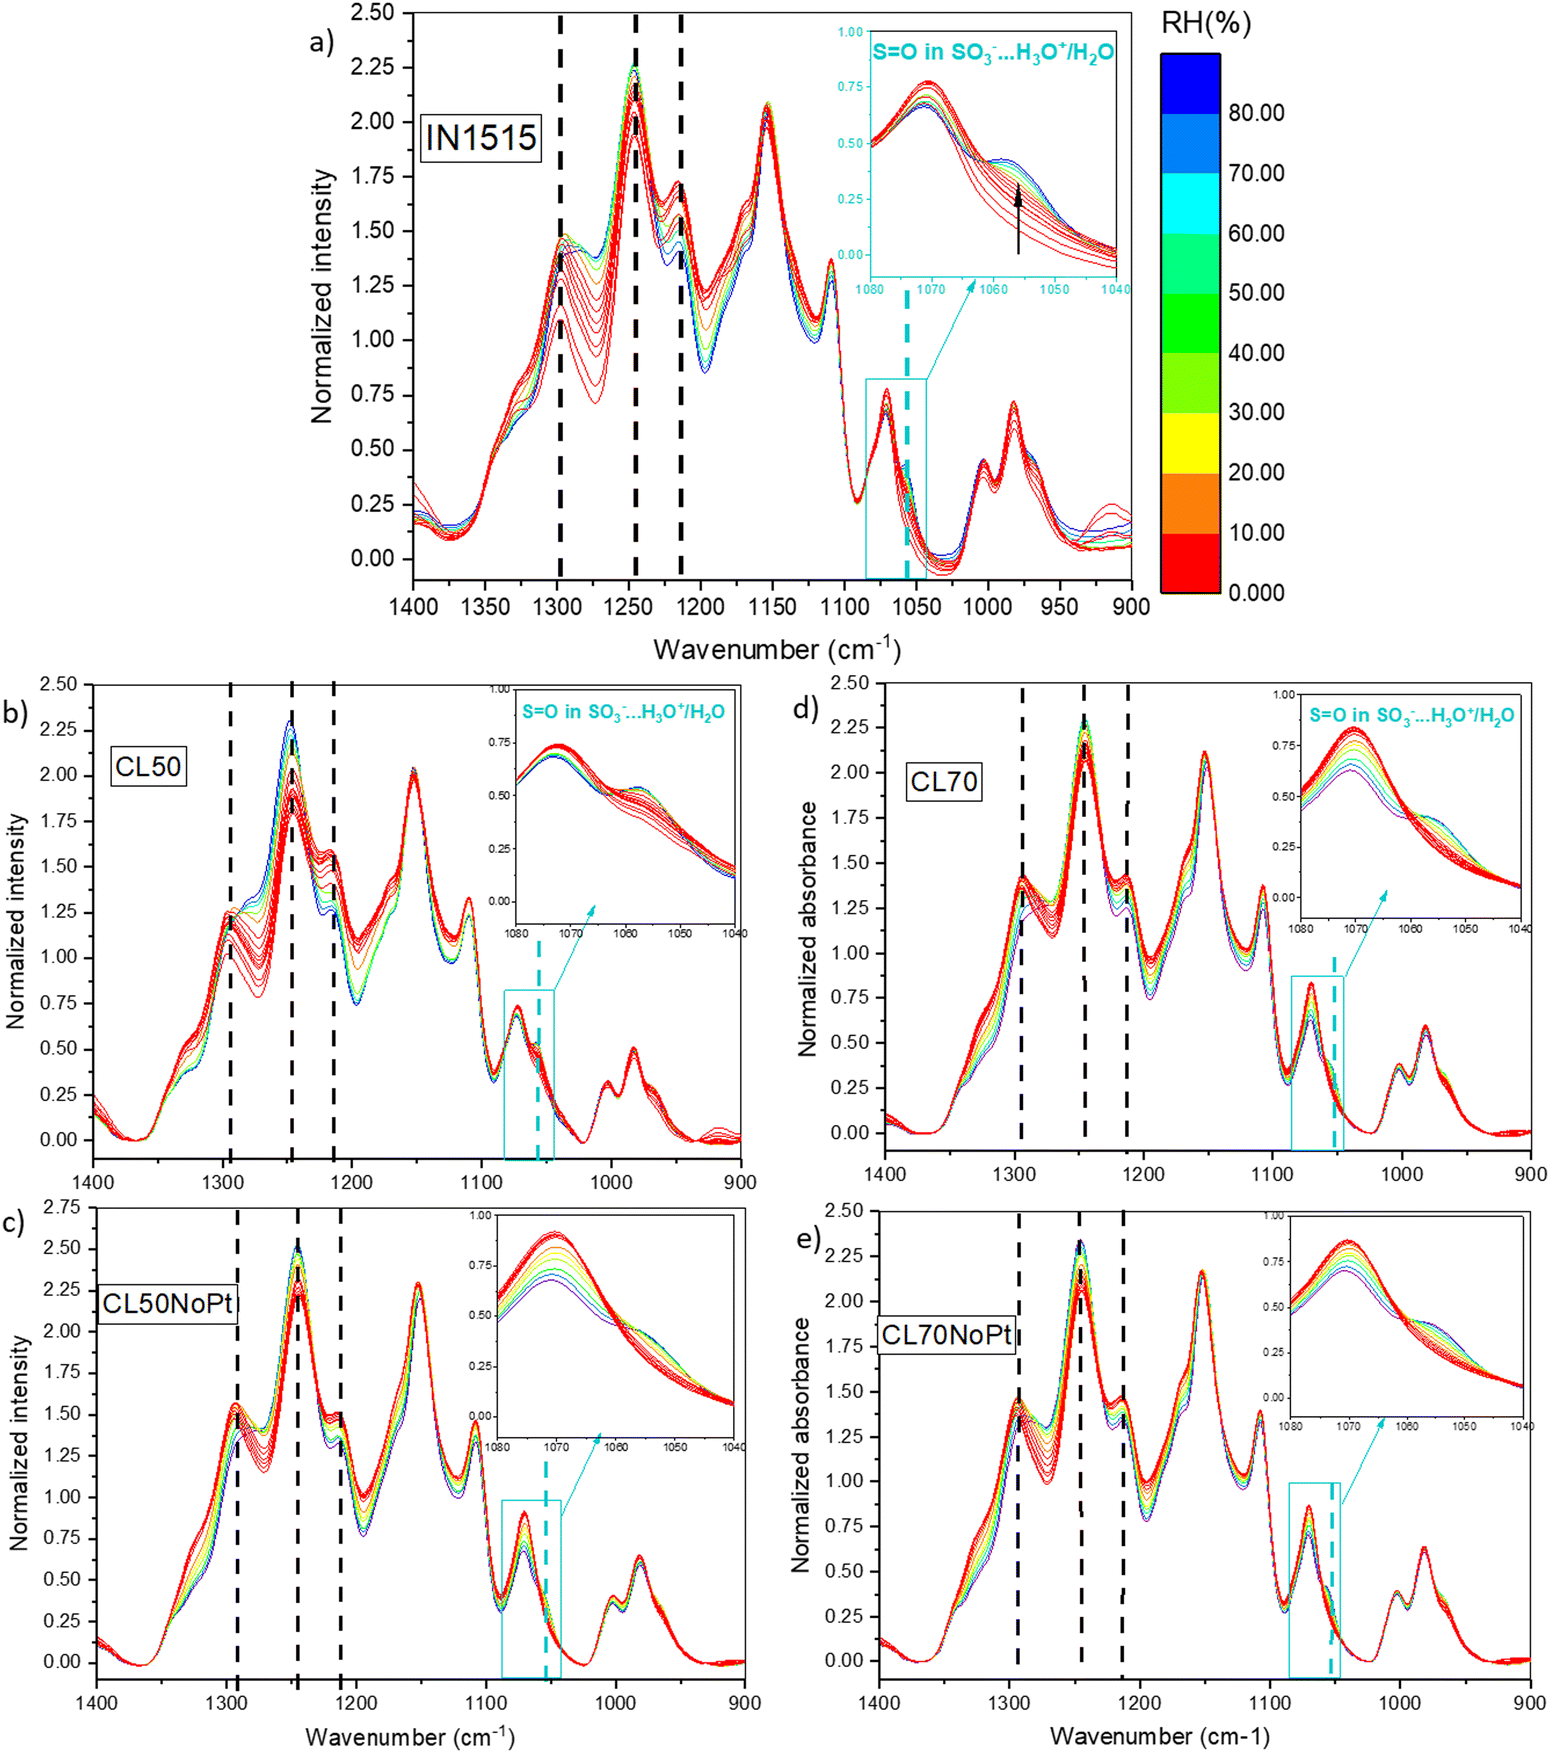
Our investigation have been completed by studying characteristic functions of the ionomer, notably the S![[double bond, length as m-dash]](https://www.rsc.org/images/entities/char_e001.gif) O stretching band at 1057 cm−1 characteristic of SO3− functions in interaction with water and H3O+,31 the SO2 stretching in SO3− at 1215 cm−1,39 the C–C stretching at 1245 cm−140 and the C–C and C–O–C stretching in backbone at 1296 cm−1,41 which appear sensitive to moisture as shown in Fig. 8 for ionomer IN1515 based membrane. The effects of humidity are much less marked for catalyst layers CL50 and CL70 and even less marked for layers without platinum. An effect of the ionomer level can also be observed, since CL50 appears to be more sensitive to moisture effects than CL70. Thus, the presence of carbon in the catalyst layer seems to modify the dissociation mechanism of ionic function at the interface. The singular behavior of CL50 can perhaps be explained by the more pronounced catalyst–ionomer interface effect for this material. To confirm this, the 1057 cm−1 band characteristic of the SO3− function was studied more closely in Fig. 9. For CL50, the dissociation phenomenon with respect to humidity level is much faster than what is observed in the membrane. Since the behavior of CL50NoPt is very similar to that observed for IN1515_50%, it can be assumed that this acceleration is likely induced by the presence of platinum in CL50. As for CL70, the behavior is very similar to that observed for CL70NoPt and IN1515_70%, indicating that the high proportion of ionomer within the catalyst layer leads to behavior similar to what is typically observed in bulk ionomers.
O stretching band at 1057 cm−1 characteristic of SO3− functions in interaction with water and H3O+,31 the SO2 stretching in SO3− at 1215 cm−1,39 the C–C stretching at 1245 cm−140 and the C–C and C–O–C stretching in backbone at 1296 cm−1,41 which appear sensitive to moisture as shown in Fig. 8 for ionomer IN1515 based membrane. The effects of humidity are much less marked for catalyst layers CL50 and CL70 and even less marked for layers without platinum. An effect of the ionomer level can also be observed, since CL50 appears to be more sensitive to moisture effects than CL70. Thus, the presence of carbon in the catalyst layer seems to modify the dissociation mechanism of ionic function at the interface. The singular behavior of CL50 can perhaps be explained by the more pronounced catalyst–ionomer interface effect for this material. To confirm this, the 1057 cm−1 band characteristic of the SO3− function was studied more closely in Fig. 9. For CL50, the dissociation phenomenon with respect to humidity level is much faster than what is observed in the membrane. Since the behavior of CL50NoPt is very similar to that observed for IN1515_50%, it can be assumed that this acceleration is likely induced by the presence of platinum in CL50. As for CL70, the behavior is very similar to that observed for CL70NoPt and IN1515_70%, indicating that the high proportion of ionomer within the catalyst layer leads to behavior similar to what is typically observed in bulk ionomers.
 | ||
| Fig. 8
In situ MIR spectra of (a) IN1515, (b) CL50, (c) CL50NoPt, (d) CL70, (e) CL70NoPt in the range 1400–950 cm−1 (spectra normalized to ionomer backbone band at 1588 cm−1, subtracted spectra from its value at 0% RH): the characteristic bands of specific species (H2O, H3O+, H5O2+) relative to the exposition of materials to humidity are indicated by dotted lines, in inset zoom of the band at 1057 cm−1, characteristic of the SO function in SO3−⋯H3O+/H2O. | ||
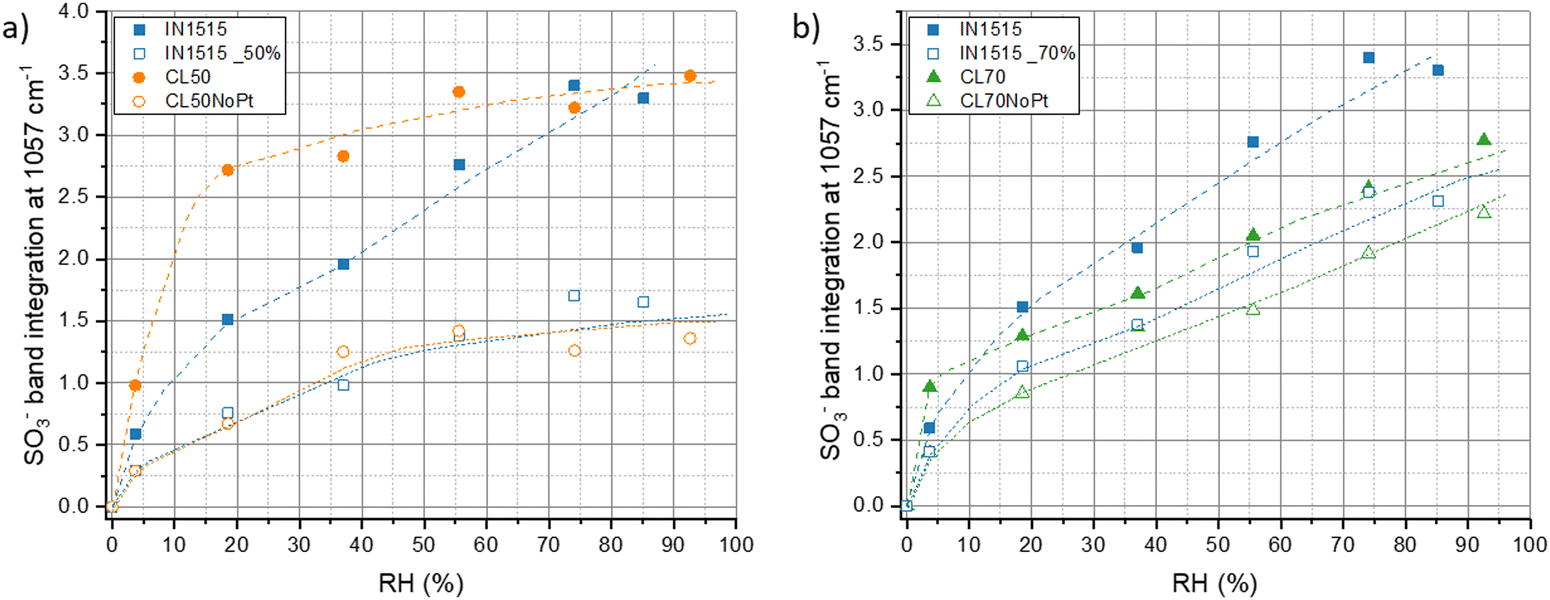 | ||
| Fig. 9 Hydration-dependent characteristic functions of the ionomer. Band integration at 1057 cm−1 (band normalized to ionomer backbone band at 1570 cm−1, integration subtracted from its value at 0% RH) versus humidity for CL50 and CL50NoPt (a), and CL70 and CL70NoPt (b), compared to the IN1515 membrane (IN1515_50% and IN1515_70% correspond to 50% and 70% of the integration values within these bands, respectively). | ||
Conclusions and perspectives
To advance fuel cell development, it is crucial to focus on stability and comprehend the inner working principles of these devices, particularly within the membrane-electrode assembly (MEA). Although significant strides have been made in recent years to enhance the performance and stability of membranes, there has been limited research dedicated to the catalyst layers. However, these layers are integral for facilitating electrochemical reactions, which convert chemical reactions between fuel and oxidant (typically hydrogen and oxygen) into electricity. They do have certain vulnerabilities, such as stability issues, susceptibility to poisoning, and the challenge of effective water management.Novel catalyst layers composed of non-perfluorinated sulfonic acid ionomers are holding promises towards enhanced properties, but little is known on the ionomer–carbon-catalyst interactions and their hydration-dependent properties. Here, we have investigated new catalyst layers made of carbon, platinum, and aromatic ionomers designed to advance electrical and mechanical properties, as well as stability. The mechanism of water vapor sorption and nanostructuration has been studied in a series of pure ionomer, carbon–ionomer composites, and three-phase catalyst layer systems bearing different amounts of ionomer (20% wt to 70% wt), by combining dynamic vapor sorption, small angle neutron scattering and in situ synchrotron infrared spectroscopy.
The dynamic vapor sorption (DVS) results indicate that water sorption within the ionomer in a catalyst layer differs from the typical behavior observed in the pure ionomer membrane. The presence of the catalyst appears to induce structural changes in the ionomer, likely attributable to both steric and interface effects. Three distinct forms of water uptake can be distinguished: one by the ionomer, another by the carbon, and the last one by the platinum. Through analytical simulations, it was possible to assess the proportion of each population during a sorption isotherm. As anticipated, the share taken by the ionomer tends to decrease with increasing relative humidity (RH), in favor of platinum. This underscores the crucial role of interfaces.
The results of microstructural analyses conducted by SANS also appear to align with the findings from macroscopic analyses. Indeed, we found that the ionomer swelling process in catalyst layers deviates from the pure ionomer membrane behavior, as the hydrophobic blocks repeated structure remains unchanged on increasing hydration level. This may indicate that the hydrophobic ionomer regions inside the catalyst layer could be confined in the vicinity of the Pt-free carbon black particles, while the hydrophilic blocks occupy the space surrounding Pt, as represented in the scheme of Fig. 10(a). During water sorption, the presence of carbon could restrict the extension of the hydrophobic blocks, unlike the hydrophilic blocks. Other aspects, however, as the presence of modified surface groups on the carbon surface due to the manufacturing process could also play a role, which would need to be further investigated.
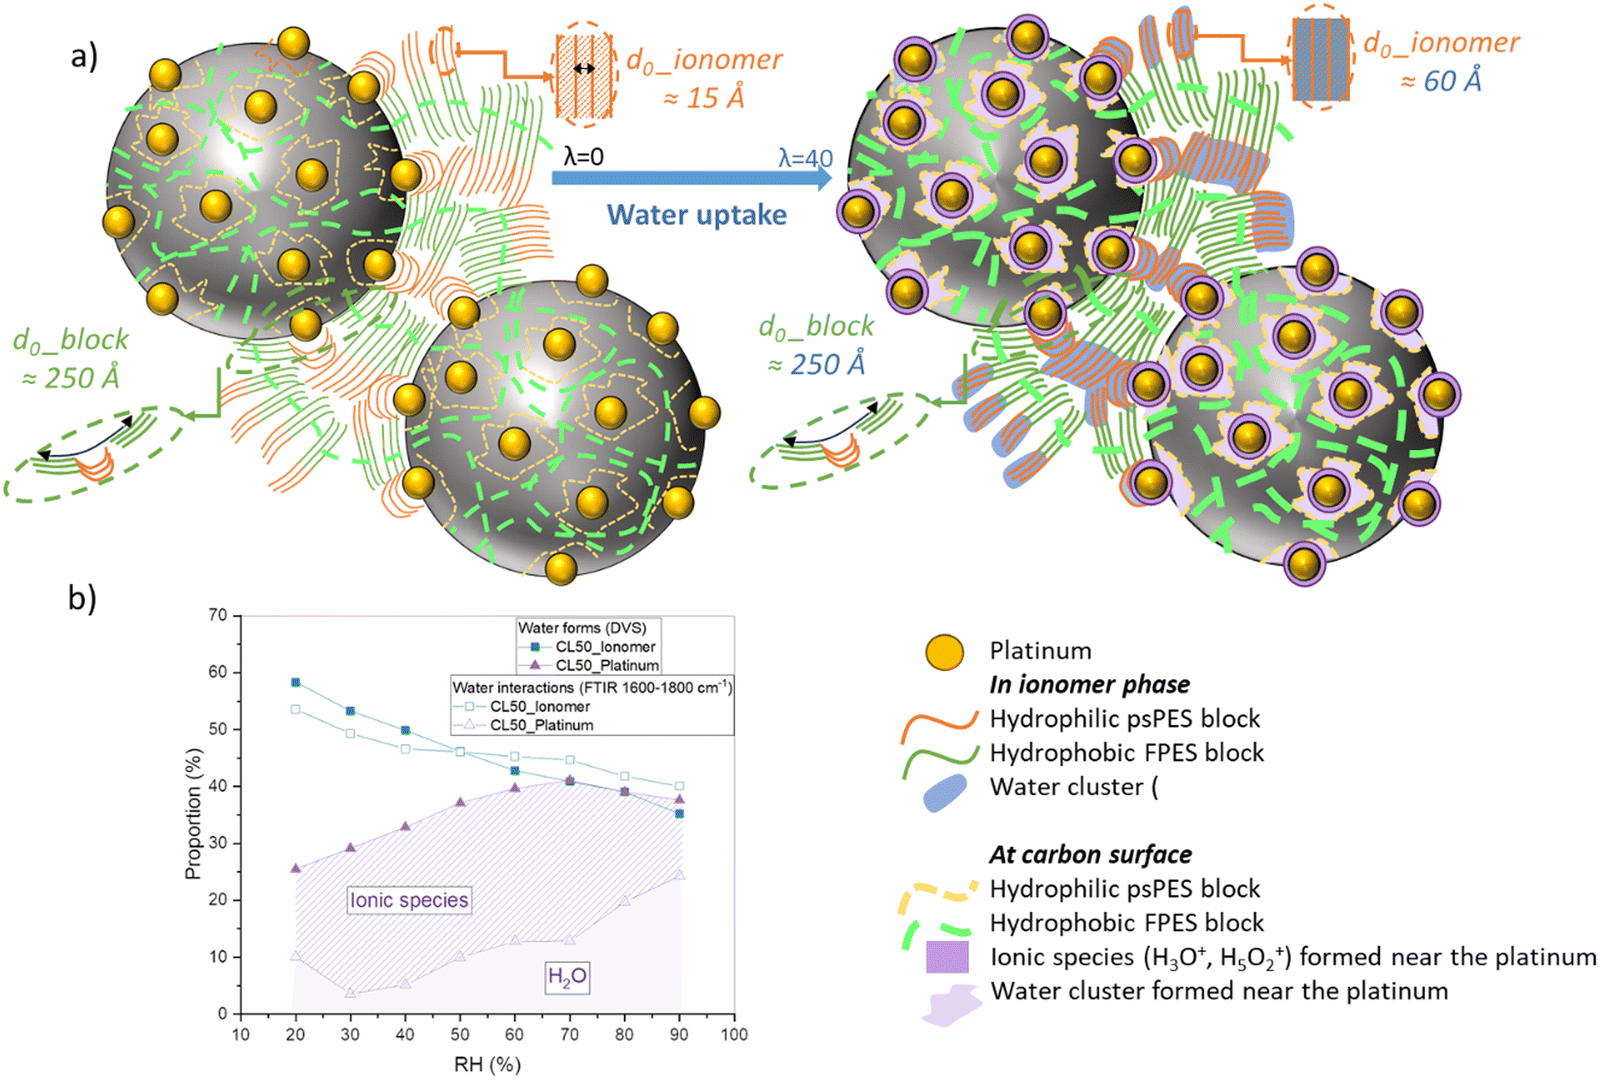 | ||
| Fig. 10 Scheme of the local structure and interactions in aromatic ionomer-based catalyst layers. (a) Representation of the IN1515 catalyst layer material: carbon particles (black), Pt nanoparticles (yellow), hydrophobic FPES chains (green), and hydrophilic PES backbone with ionic functions (orange), illustrating the various interactions between ionomer, carbon and platinum, states of water molecules (isolated or clustered) and formed ionic species. The hydrophobic FPES blocks wrap around the hydrophobic carbon particles while the PES backbones of the hydrophilic blocks occupy the space in between, forming ionic domains containing the perfluorosulfonic side chains. Upon hydration the mass of the carbon may prevent longitudinal extension of the FPES chains while the inner-space ionic domains may swell as in the pure membrane; (b) proportions of different water forms and interactions deduced from DVS and FTIR (1800–1600 cm−1 range) as a function of humidity. | ||
FTIR coupled with humidity measurements allowed to shed light on the molecular structures and their evolutions during controlled water uptake. We have successfully identified all distinctive bands associated with the molecular framework, ionic functionality and water content, within the range of 600–4000 cm−1. By normalizing the spectra using a specific framework-related band, we have been able to infer the quantities of functional groups formed during the sorption process. This involved employing deconvolution calculations and area measurements of the most pertinent bands. The observed sorption kinetics closely resemble those encountered in DVS, bringing information into the various forms of water (molecules/clusters) and ionic species (H3O+/Zundel) in relation to humidity levels. The use of different catalyst layers, including those with and without catalysts, allowed us to extract the changing proportions of interactions between water, the ionomer, carbon, and platinum. In the range between 3000 and 4000 cm−1 a distinct water band was quantified to analyze the amount of water sorbed in the system, while the region spanning 1600–2000 cm−1 enabled us to discriminate various water forms. We discovered that most of the water absorbed by the catalyst layer exists in its liquid form, which is at odds with the membrane where a wealth of ionic species and water clusters are generated. Furthermore, it appears that most of the formed ionic species interact primarily with the platinum catalyst and may locate at the particle–ionomer interface, as sketched in Fig. 10. This could be compatible with the existence of a thin water layer at the interface, as observed in PFSA CLs by contrast-variation SANS. Importantly, we note also that the dissociation of ionic functions occurs notably faster in the catalyst layer than in the membrane.
These findings highlight the peculiar behavior of the ionomer phase within high loaded catalyst layers and the importance of hydration-dependent comprehensive studies to unravel the interplay between chemical architecture, composition, structure and transport in these complex systems. We may expect even larger effects in commercial catalyst layers that use lower ionomer proportions. Recently, stack tests have been conducted using proton exchange membranes (PEMs) and catalyst layers based on 20% wt IN1515.12 These layers exhibit performance levels similar to those achieved with perfluorosulfonic acid materials. Hence, the addition of the aromatic ionomer in the CLs seemed not to significantly enhance the interactions between catalysts and ionomers. However, aromatic polymer-based catalyst layers and MEAs have not been optimized yet. Further evaluation of IN1515-based MEAs under more realistic and demanding fuel cell operating conditions is warranted to sustain the development of solid polymer electrolytes as advantageous alternative ionomers for fuel cell membrane-electrode-assemblies.
Conflicts of interest
There are no conflicts to declare.Acknowledgements
The authors are grateful to the Natural Sciences and Engineering Research Council of Canada and Agency of National Research (ANR,project NSPEM) and Centre of Excellence of Multifunctional Architectured Materials “CEMAM” no. AN-10-LABX-44-01France for financial support of this work. The Institut Laue Langevin (ILL, Grenoble, France) is acknowledged for granting beamtime.References
- D. Banham, J.-Y. Choi, T. Kishimoto and S. Ye, Integrating PGM-Free Catalysts into Catalyst Layers and Proton Exchange Membrane Fuel Cell Devices, Adv. Mater., 2019, 31, 1804846 CrossRef.
- J. Hou, M. Yang, C. Ke, G. Wei and J. Zhang, Optimizing the Structural Design of a Nanocomposite Catalyst Layer for PEM Fuel Cells for Improving Mass-Specific Power Density, Nanoscale, 2020, 12, 13858–13878 RSC.
- D. C. Higgins and Z. Chen, Recent Progress in Non-Precious Metal Catalysts for PEM Fuel Cell Applications, Can. J. Chem. Eng., 2013, 91, 1881–1895 CrossRef CAS.
- M. Chen, C. Zhao, F. Sun, J. Fan, H. Li and H. Wang, Research Progress of Catalyst Layer and Interlayer Interface Structures in Membrane Electrode Assembly (MEA) for Proton Exchange Membrane Fuel Cell (PEMFC) System, eTransportation, 2020, 5, 100075 CrossRef.
- L. Wang, X. Wan, S. Liu, L. Xu and J. Shui, Fe-N-C Catalysts for PEMFC: Progress towards the Commercial Application under DOE Reference, J. Energy Chem., 2019, 39, 77–87 CrossRef.
- Y. V. Yakovlev, Y. V. Lobko, M. Vorokhta, J. Nováková, M. Mazur, I. Matolínová and V. Matolín, Effect on Charge and Gas Transport in the Cathode Catalyst Layer of Proton-Exchange Membrane Fuel Cells, J. Power Sources, 2021, 490, 229531 CrossRef CAS.
- D. Lee and S. Hwang, Effect of Loading and Distributions of Nafion Ionomer in the Catalyst Layer for PEMFCs, Int. J. Hydrogen Energy, 2008, 33, 2790–2794 CrossRef CAS.
- D. K. Paul, A. Fraser and K. Karan, Towards the Understanding of Proton Conduction Mechanism in PEMFC Catalyst Layer: Conductivity of Adsorbed Nafion Films, Electrochem. Commun., 2011, 13, 774–777 CrossRef CAS.
- H. Kang, S. H. Kwon, R. Lawler, J. H. Lee, G. Doo, H.-T. Kim, S.-D. Yim, S. S. Jang and S. G. Lee, Nanostructures of Nafion Film at Platinum/Carbon Surface in Catalyst Layer of PEMFC: Molecular Dynamics Simulation Approach, J. Phys. Chem. C, 2020, 124, 21386–21395 CrossRef CAS.
- L. Assumma, C. Iojoiu, R. Mercier, S. Lyonnard, H. D. Nguyen and E. Planes, Synthesis of Partially Fluorinated Poly(Arylene Ether Sulfone) Multiblock Copolymers Bearing Perfluorosulfonic Functions, J. Polym. Sci., Part A: Polym. Chem., 2015, 53, 1941–1956 CrossRef CAS.
- L. Assumma, H. D. Nguyen, C. Iojoiu, S. Lyonnard, R. Mercier and E. Espuche, Effects of Block Length and Membrane Processing Conditions on the Morphology and Properties of Perfluorosulfonated Poly(Arylene Ether Sulfone) Multiblock Copolymer Membranes for PEMFC, ACS Appl. Mater. Interfaces, 2015, 7, 13808–13820 CrossRef CAS.
- H.-F. Lee, M. Killer, B. Britton, Y. Wu, H.-D. Nguyen, C. Iojoiu and S. Holdcroft, Fuel Cell Catalyst Layers and Membrane-Electrode Assemblies Containing Multiblock Poly(Arylene Ether Sulfones) Bearing Perfluorosulfonic Acid Side Chains, J. Electrochem. Soc., 2018, 165, F891 CrossRef CAS.
- H. D. Nguyen, L. Assumma, P. Judeinstein, R. Mercier, L. Porcar, J. Jestin, C. Iojoiu and S. Lyonnard, Controlling Microstructure–transport Interplay in Highly Phase-Separated Perfluorosulfonated Aromatic Multiblock Ionomers via Molecular Architecture Design, ACS Appl. Mater. Interfaces, 2017, 9(2), 1671–1683 CrossRef CAS.
- H. D. Nguyen, R. Porihel, J. B. Brubach, E. Planes, P. Soudant, P. Judeinstein, L. Porcar, S. Lyonnard and C. Iojoiu, Perfluorosulfonyl Imide versus Perfluorosulfonic Acid Ionomers in Proton-Exchange Membrane Fuel Cells at Low Relative Humidity, ChemSusChem, 2020, 13(3), 590–600 CrossRef CAS.
- E. Planes, H. D. Nguyen, T. K. Ly Nguyen, N. Charvin, L. Flandin, S. Lyonnard and C. Iojoiu, Humidity-Induced Mechanical Behavior and Proton Transport Mechanism in Aromatic Multiblock Ionomer Membrane, ACS Appl. Energy Mater., 2021, 4(6), 5809–5820 CrossRef CAS.
- P. Roy, M. Rouzières, Z. Qi and O. Chubar, The AILES Infrared Beamline on the Third Generation Synchrotron Radiation Facility SOLEIL, Infrared Phys. Technol., 2006, 49, 139–146 CrossRef CAS.
- J. Brubach, L. Manceron, M. Rouzières, O. Pirali, D. Balcon, F. K. Tchana, V. Boudon, M. Tudorie, T. Huet, A. Cuisset and P. Roy, Performance of the AILES THz-Infrared Beamline at SOLEIL for High Resolution Spectroscopy, AIP Conf. Proc., 2010, 1214, 81–84 CrossRef.
- S. Dalla Bernardina, F. Alabarse, A. Kalinko, P. Roy, M. Chapuis, N. Vita, R. Hienerwadel, C. Berthomieu, P. Judeinstein, J.-M. Zanotti, J. L. Bantignies, J. Haines, J. Catafesta, G. Creff, L. Manceron and J.-B. Brubach, Experimental Set-Ups for Studying Nanoconfined Water on the AILES Beamline at SOLEIL, Vib. Spectrosc., 2014, 75, 154–161 CrossRef CAS.
- M. Fumagalli, S. Lyonnard, G. Prajapati, Q. Berrod, L. Porcar, A. Guillermo and G. Gebel, Fast Water Diffusion and Long-Term Polymer Reorganization during Nafion Membrane Hydration Evidenced by Time-Resolved Small-Angle Neutron Scattering, J. Phys. Chem. B, 2015, 119, 7068–7076 CrossRef CAS.
- K. S. W. Sing, Reporting Physisorption Data for Gas/Solid Systems with Special Reference to the Determination of Surface Area and Porosity, Pure Appl. Chem., 1985, 57, 603–619 CrossRef CAS.
- P. L. Walker and J. Janov, Hydrophilic Oxygen Complexes on Activated Graphon, J. Colloid Interface Sci., 1968, 28, 449–458 CrossRef CAS.
- C. Pierce, R. N. Smith, J. W. Wiley and H. Cordes, Adsorption of Water by Carbon, J. Am. Chem. Soc., 1951, 73, 4551–4557 CrossRef CAS.
- T. Soboleva, X. Zhao, K. Malek, Z. Xie, T. Navessin and S. Holdcroft, Meso-, and Macroporous Structures of Polymer Electrolyte Membrane Fuel Cell Catalyst Layers, ACS Appl. Mater. Interfaces, 2010, 2, 375–384 CrossRef CAS.
- M. B. Karimi, F. Mohammadi and K. Hooshyari, Recent Approaches to Improve Nafion Performance for Fuel Cell Applications: A Review, Int. J. Hydrogen Energy, 2019, 44, 28919–28938 CrossRef CAS.
- A. Kusoglu, D. Kushner, D. K. Paul, K. Karan, M. A. Hickner and A. Z. Weber, Impact of Substrate and Processing on Confinement of Nafion Thin Films, Adv. Funct. Mater., 2014, 24, 4763–4774 CrossRef CAS.
- A. Kusoglu and A. Z. Weber, New Insights into Perfluorinated Sulfonic-Acid Ionomers, Chem. Rev., 2017, 117(3), 987–1104 CrossRef CAS.
- Y. Li, Q. T. Nguyen, C. L. Buquet, D. Langevin, M. Legras and S. Marais, Water Sorption in Nafion® Membranes Analyzed with an Improved Dual-Mode Sorption Model-Structure/Property Relationships, J. Membr. Sci., 2013, 439, 1–11 CrossRef CAS.
- W. Y. Hsu and T. D. Gierke, Transport and Clustering in Nafion Perfluorinated Membranes, J. Membr. Sci., 1983, 13, 307–326 CrossRef CAS.
- N. Takimoto, A. Ohira, Y. Takeoka and M. Rikukawa, Surface Morphology and Proton Conduction Imaging of Nafion Membrane, Chem. Lett., 2008, 37, 164–165 CrossRef CAS.
- F. Chabot, J. Lee, F. Vandenberghe, L. Guétaz, G. Gebel, S. Lyonnard, L. Porcar, S. Rosini and A. Morin, Detailed Catalyst Layer Structure of Proton Exchange Membrane Fuel Cells from Contrast Variation Small-Angle Neutron Scattering, ACS Appl. Energy Mater., 2023, 6, 1185–1196 CrossRef CAS.
- S. Dalla Bernardina, J.-B. Brubach, Q. Berrod, A. Guillermo, P. Judeinstein, P. Roy and S. Lyonnard, Mechanism of Ionization, Hydration, and Intermolecular H-Bonding in Proton Conducting Nanostructured Ionomers, J. Phys. Chem. C, 2014, 118, 25468–25479 CrossRef CAS.
- J.-B. Brubach, A. Mermet, A. Filabozzi, A. Gerschel and P. Roy, Signatures of the Hydrogen Bonding in the Infrared Bands of Water, J. Chem. Phys., 2005, 122, 184509 CrossRef.
- L. Puskar, E. Ritter, U. Schade, M. Yandrasits, S. J. Hamrock, M. Schaberg and E. F. Aziz, Infrared Dynamics Study of Thermally Treated Perfluoroimide Acid Proton Exchange Membranes, Phys. Chem. Chem. Phys., 2017, 19, 626–635 RSC.
- E. S. Stoyanov, K.-C. Kim and C. A. Reed, A Strong Acid That Does Not Protonate Water, J. Phys. Chem. A, 2004, 108, 9310–9315 CrossRef CAS.
- T. Iwasita and X. Xia, The Potential of Zero Charge, J. Electroanal. Chem., 1996, 411, 95–102 CrossRef.
- F. Maillard, A. Bonnefont and F. Micoud, An EC-FTIR Study on the Catalytic Role of Pt in Carbon Corrosion, Electrochem. Commun., 2011, 13, 1109–1111 CrossRef CAS.
- L. Castanheira, L. Dubau, M. Mermoux, G. Berthomé, N. Caqué, E. Rossinot, M. Chatenet and F. Maillard, Corrosion in Proton-Exchange Membrane Fuel Cells: From Model Experiments to Real-Life Operation in Membrane Electrode Assemblies, ACS Catal., 2014, 4, 2258–2267 CrossRef CAS.
- F. Maillard, E. R. Savinova, P. A. Simonov, V. I. Zaikovskii and U. Stimming, Infrared Spectroscopic Study of CO Adsorption and Electro-Oxidation on Carbon-Supported Pt Nanoparticles: Interparticle versus Intraparticle Heterogeneity, J. Phys. Chem. B, 2004, 108, 17893–17904 CrossRef CAS.
- E. Moukheiber, Understanding of the Structure of Perfluorinated Sulfonic Membranes for Fuel Cell, Université de Grenoble, 2011.
- K. Nakanishi and P. H. Solomon, Infrared Absorption Spectroscopy, Holden-Day, 1977 Search PubMed.
- N. A. Alenazi, M. A. Hussein, K. A. Alamry and A. M. Asiri, Nanocomposite-Based Aminated Polyethersulfone and Carboxylate Activated Carbon for Environmental Application, C, 2018, 4(2), 30 Search PubMed.
Footnote |
| † Electronic supplementary information (ESI) available. See DOI: https://doi.org/10.1039/d4ya00164h |
| This journal is © The Royal Society of Chemistry 2024 |