
 Open Access Article
 This Open Access Article is licensed under a Creative Commons Attribution-Non Commercial 3.0 Unported Licence
Techno-economic assessment of aluminum as a clean energy carrier to decarbonize remote industries†
Pascal
Boudreau
 *a,
Michael
Johnson
b and
Jeffrey M.
Bergthorson
a
*a,
Michael
Johnson
b and
Jeffrey M.
Bergthorson
a
aAlternative Fuels Laboratory, Department of Mechanical Engineering, McGill University, Rm 270 Macdonald Engineering Building, 817 Sherbrooke Street West, Montréal, H3A 0C3, Canada. E-mail: pascal.boudreau@mail.mcgill.ca
bSiemens Energy Canada Limited, 2200 rue Courval, Lachine, H8T 3H1, Canada
First published on 3rd July 2024
Abstract
The energy sector is transitioning to a low-carbon era requiring the wide use of renewable energy sources, mainly wind and solar. In this context, aluminum could serve as a sustainable energy carrier as it stores energy in a safe and compact way. It could be used to help decarbonize remote communities and industries, trade energy on a global scale, or provide seasonal energy storage. The Hall–Héroult process, reducing aluminum oxides to aluminum, is already a technology deployed at an industrial scale. The maturity of this industry could therefore be leveraged to store electricity. To convert aluminum back to power, it can be fully oxidized with high-temperature liquid water. The hydrogen and high-temperature heat produced can then be converted to power using a combination of heat engines and/or fuel cells. For this concept to be viable, the oxides produced must be collected and reduced in a sustainable way. In this work, aluminum recharging costs were evaluated by reviewing the current reduction process and the literature available on the development of inert anodes, a technology enabling carbon-free smelting. Results show that aluminum can be cost-competitive on a chemical energy basis with most common hydrogen carriers discussed in the literature. To contextualize the findings, a remote mine case study integrates transportation, storage and power generation costs for aluminum, compared to liquefied hydrogen and ammonia. The analysis reveals that aluminum is comparable to other carbon-free solutions, although they all currently remain more expensive than diesel fuel at an input electricity price of $30/MWhe. Aluminum emerges as marginally more expensive than the direct use of ammonia, while avoiding concerns related to toxicity and NOx emissions. This study thus positions aluminum as a promising energy carrier that merits further consideration in various other applications.
1 Introduction
As electrical grids expand and rely more heavily on variable renewable electricity sources to meet a growing demand, some changes in energy management will occur on a global scale. Cheap and efficient storage will be needed on a wide range of sizes and time scales to ensure energy can be dispatched when and where it's needed. Chemical energy carriers are likely to be needed to smooth out seasonal variations in renewable power generation, decarbonize hard to abate sectors and remote communities and industries, or to facilitate the exchange of clean energy on a global scale.1,2 Some countries, such as Germany and Japan, have already recognized their future need to import clean energy in order to reach full decarbonization.3,4As an alternative to widely discussed hydrogen-based energy carriers, some metals have been proposed as promising candidates, since they store energy in a compact and stable form.5–8 These metals, such as iron, aluminum, magnesium, or zinc, are safe and can be easily handled and shipped to end-users. They can be stored inexpensively and, ultimately, can be either combusted in air to produce heat, or reacted with water to generate heat and hydrogen, both of which can be used for power generation.9,10 The other byproducts are solid oxide particles that must be collected, returned to the metal producer, and reduced back into fuel to ensure the sustainable utilization of these resources. Provided that the reduction step is carbon-free, this has the potential to create a clean utilization cycle, facilitating the use of renewable energy in sectors, such as remote industries, in need of a clean fuel to decarbonize.
Among metal fuels candidates, aluminum represents a promising option due to its high energy density, safety, and abundance. However, to challenge other alternatives, the clean aluminum fuel cycle must not only be technically viable but, most importantly, cost competitive and sustainable. Previous work studying aluminum as an energy carrier employed a simplified approach when estimating production costs. These studies considered only the costs associated with oxides and electricity as inputs,11 or omitted capital costs from their analysis.12
This work presents a comprehensive assessment of the cost of the aluminum fuel cycle. An in-depth analysis of the reduction process provides insights on the production cost of current aluminum smelting, and the economic impact of using a novel carbon-free reduction process is estimated. Cost models for storage, transportation, and power generation are formulated to assess the overall cost for each cycle. A similar analysis is then performed for two alternative carbon-free energy carriers, liquefied hydrogen and ammonia, both extensively studied in previous work. This enables aluminum to be compared to two widely discussed energy carriers within the framework of supplying clean electricity to remote industries in need of an alternative to diesel fuel.
2 Aluminum as an energy carrier
As demonstrated by its use in rocket propulsion, aluminum is of particular interest as a fuel because of its high energy content with respect to both mass and volume, storing around 8.6 MWhch/tonne.13 Aluminum is inherently safe due to a thin oxide layer that forms on its surface upon contact with air, making it effectively inert to water at ambient conditions. This contrasts with other metals, such as the alkalis, which are prone to react violently in such conditions. This passivating oxide layer is a few nanometers thick and protects the bulk material from further oxidation at ambient conditions, which simplifies storage requirement and avoids energy losses over time.Aluminum can be oxidized with water to release approximately half of its stored energy in the form of heat and the other half as hydrogen, offering the potential for a wide range of utilization schemes.10,14–16 The complete reaction of coarse aluminum particles has been recently demonstrated with the use of high-temperature liquid water without the need for any catalyst.17 Operating at higher temperatures enables the production of heat that can be recuperated for power generation, thereby increasing the efficiency of the cycle. As storing electricity in any energy carrier leads to significant losses (and costs), it is necessary to maximize the conversion back to electricity to make any cycle viable. Moreover, a high-temperature high-pressure reaction regime enables the use of bigger particles as the fuel, which, in turn, lowers the risk of dust explosions, identified as a safety hazard for fine metal powders.18
3 Aluminum production
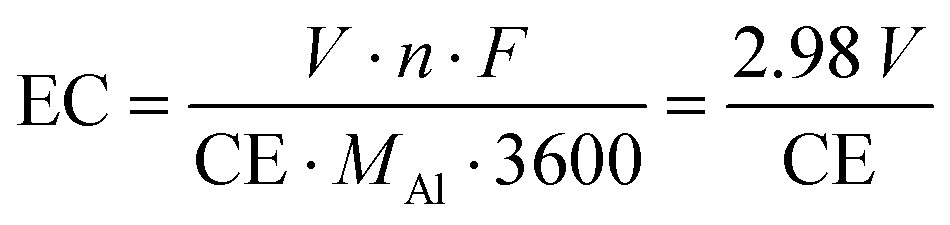
Aluminum reduction, performed industrially using the Hall-Héroult electrowinning process, is a critical step when assessing the cost and sustainability of the aluminum fuel cycle. In this process, smelter grade alumina (SGA) is fed to a molten cryolite (Na3AlF6) electrolytic bath where it dissolves and is reduced using an electric current. In modern pots, up to 600 kA flow from the carbon anodes, through a cryolite bath kept at around 940–970 °C, onto the cathode where aluminum is reduced.19,20 SGA is added to the bath periodically to maintain proper alumina concentration, therefore achieving maximal energy efficiency. Low alumina concentration also induces the occurrence of the so-called “anode effect”, a phenomenon characterized by a sudden surge in pot voltage that results in thermal instability and the emissions of harmful perfluorocarbon (PFC).19,21 Modern smelters use dozens of pre-baked carbon anodes per cell, which are fixed to a rod and attached to the busbar delivering the current. Anodes are consumed during the process, producing CO2, and need to be replaced every 20 to 25 days.19From Faraday's law of electrolysis, the specific electrical energy consumption of the aluminum electrowinning process can be derived to yield eqn (1). The energy consumption EC, in MWhe/t, is calculated from the voltage V, the number of electrons transferred in the reaction n (3 moles of e− per mole of Al), the Faraday constant F, the current efficiency CE, and aluminum molar mass MAl (26.98 g mole−1).
 | (1) |
The energy consumption, or efficiency, of the cell is therefore a function of the voltage requirement and the current efficiency, defined as the mass ratio of the metal reduced to the theoretical value. This efficiency is over 95% in modern smelters and is less than 100% due to the inevitable back reaction of anodic products (CO2) with cathodic products (Al) which reverses the reduction reaction.22
Thermodynamically, the theoretical minimum cell voltage required to drive a reaction can be calculated using the change in standard Gibbs energy G0, as described in eqn (2). For alumina reduction, this amounts to 2.25 V as shown in eqn (3).
 | (2) |
In practice many losses add up, making this voltage significantly higher. The first 1.22 V is required to drive the alumina reduction using a carbon anode, as shown by eqn (3)–(5). Ohmic losses due to gas bubbles, external equipment, the anode, and the cathode are responsible for around 1.10 V.23 The bath resistive loss, dependent on the anode to cathode distance (ACD), represents around 1.33 V.23 These losses contribute to heating the cell to maintain the bath in its liquid state, since thermal losses are inevitable through the sides of the cells. This is crucial to keep a side ledge of frozen cryolite to protect the cell lining from the highly corrosive electrolyte.24 Overpotentials losses, which are required to achieve an increase in the reduction reaction kinetics, account for the remaining voltage required. The total voltage breakdown for carbon-anode reduction can be seen in Fig. 1.
| Al2O3 → 2Al + 1.5O2 E0 = 2.25 V | (3) |
| C + O2 → CO2 E0 = −1.03 V | (4) |
| Al2O3 + 1.5C → 2Al + 1.5CO2 E0 = 1.22 V | (5) |
 | ||
| Fig. 1 Voltage breakdown of current electrolytic cell using carbon anodes (left) compared to an hypothetical inert anode cell benefiting from low overvoltage losses (middle), and to the same inert anode cell with a wettable cathode allowing for a lower ACD (right). Assuming a current efficiency of 95%, these voltages result in an electrical consumption of 13, 15 and 13.3 MWhe/tAl respectively. When comparing to the energy stored in aluminum, this corresponds to efficiencies of 66.2%, 57.4%, and 64.7%, when only considering electricity as the energy input. | ||
4 Aluminum-fuel cycle cost assessment
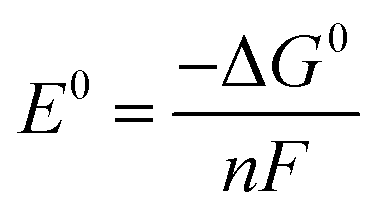
The aluminum-fuel cycle consists of four main components: aluminum production, transportation, storage, and power generation as shown in Fig. 2. Generic cost assessment models for each of component are outlined in Sections 4.1–4.3. These models can be further customized to accommodate various case studies, for example by varying the input electricity cost for specific regions, varying the size of the power generation system, or removing transportation costs to study localised long-duration energy storage use-cases. | ||
| Fig. 2 Aluminum fuel cycle consisting of four main components: aluminum production, transportation, storage, and power generation. | ||
4.1 Aluminum recharging costs: Power-to-Al
The alumina transformed in smelters today shifted from being finer “floury” α-Al2O3 to coarser “sandy” γ-Al2O3 over the years.26,27 This change mainly resulted from the adoption of point-feeders to inject alumina in the cryolite baths, which require better flowability to control the injection and thus the concentration of alumina in the reduction cells. SGA must also exhibit a low attrition index which quantifies its breakdown during handling.26 A high attrition index can lead to a higher concentration of fines (% < 45 μm) and super fines (% < 20 μm) in the alumina, which are linked to low current efficiency and an increase in anode effects.28 Specific surface area is also of particular importance as SGA is used in dry scrubbers to filter toxic hydrogen fluoride (HF) emissions from the pot exhaust gases and help recycle the fluoride back to the cryolite bath.29 HF emissions have been identified to mainly come from the presence of structural hydroxide (–OH) in the alumina, which underlines the importance of the calcination process to reach the desired aluminum oxide form. Loss on Ignition (LOI) is used to quantify the amount of structural –OH present in a sample, as it characterizes the alumina weight loss observed when heated from 300 °C to 1000 °C.30
The direct recyclability of the oxides produced by the aluminum–water reaction will therefore depend on their type and morphology. Reacting aluminum with water close to its critical point (373 °C) showed that boehmite (γ-AlOOH) was formed as the product.17 In that case, calcination would likely be needed prior to each reduction step, to obtain the desired SGA composition. Calcination alone requires around 1.6 MWh of thermal energy per tonne of aluminum produced, which is currently provided using natural gas.31 Alumina processing should eventually be decarbonized, either through direct electrification, the use of clean fuels, or even concentrated solar power.32
Used in a closed cycle, the alumina only needs to be purchased once at a certain market price PAl2O3. Although it can also be eventually be sold back to the market once it's no longer needed, this revenue discounted to present value is negligible compared to the initial purchase cost, and has been neglected in this study. As losses throughout the cycles are inevitable, an oxide collection efficiency ηcoll is defined as the ratio of alumina recuperated from one cycle to the next. This is used to determine the amount of alumina required to be purchased to offset losses. A fixed market price is assumed over the years although the price might change due to alumina market fluctuations. The number of cycles Ncyc performed over a year will also affect the recharging cost, as the initial cost of alumina is amortized annually, using a capital recovery factor CRF defined by eqn (6), where i is the annual interest rate, and n is the period of use, in years.
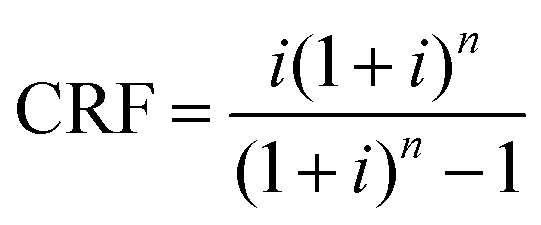 | (6) |
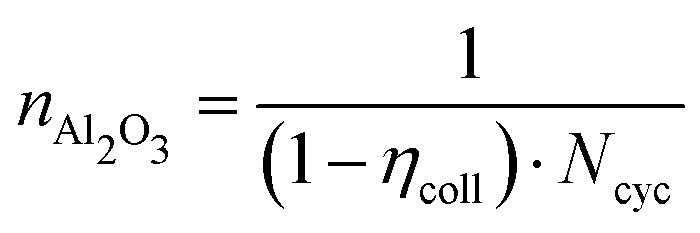
This period, nAl2O3, represents the time required to deplete the initial alumina purchased, and is a function of ηcoll and Ncyc, defined by eqn (7).
 | (7) |
The alumina cost per cycle CAl2O3, in $/tAl, is therefore calculated using eqn (8).
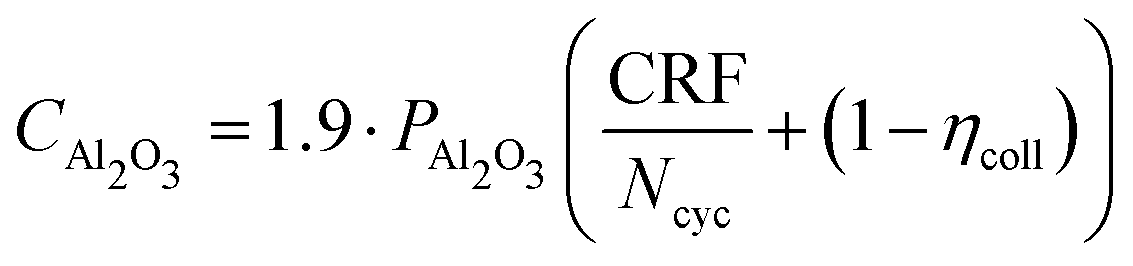 | (8) |
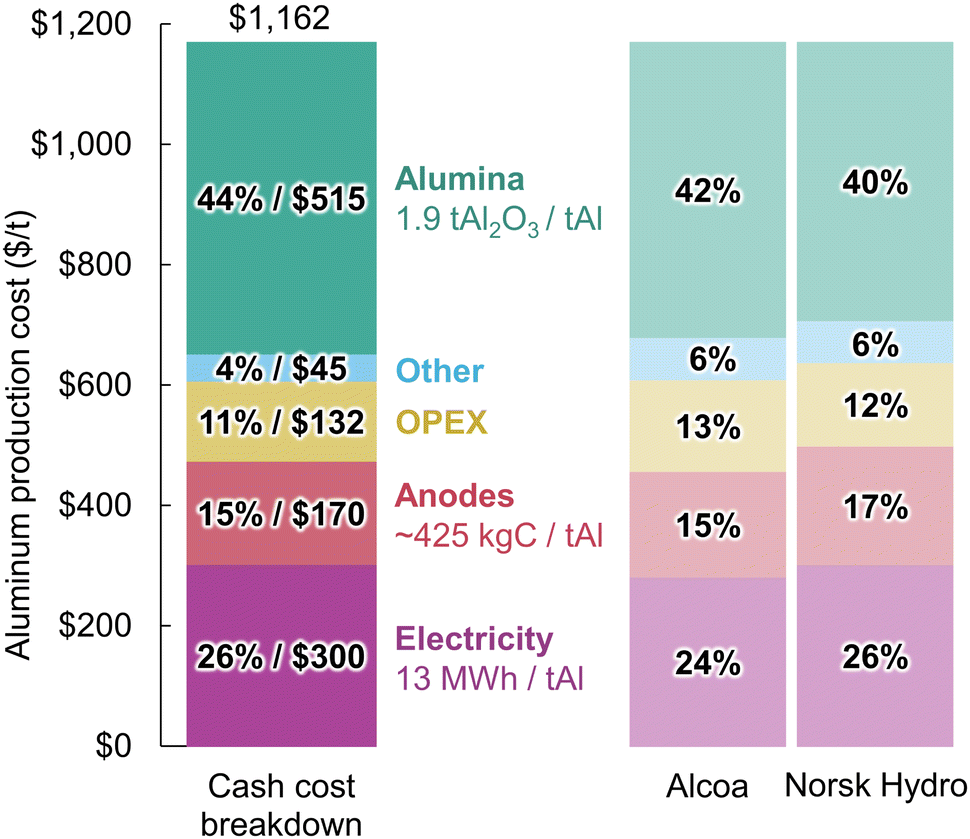 | ||
| Fig. 3 Aluminum production cost breakdown estimated based on Rio Tinto's total production cost for Canadian smelters,35 and cost breakdowns from Alcoa33 and Norsk Hydro.34 All costs are in US dollars. | ||
4.1.2.1 Electricity. The electricity consumption of the most-efficient Hall–Héroult cells can currently reach around 12 MWhe/tAl20,36 but the average modern smelters consume closer to 13 MWhe/tAl, consistent with the voltage drop and current efficiency presented in Fig. 1.37 This energy consumption, at an estimated electricity rate of $23/MWhe, yields $300/tAl and represents 26% of the total production cost. Such an electricity rate is realistic considering Rio Tinto's operations in Canada are powered by privately owned hydropower plants.38,39 Furthermore, this is consistent with electricity rates for large industries in the province of Quebec, mostly supplied by hydropower, that were $26/MWhe in 2022.40
4.1.2.2 Anodes. Approximately 400–450 kg of carbon anodes are consumed per tonne of aluminum produced.19,37 They are made of around 80% of petroleum coke and 20% coal tar pitch,41 having a market price of about $300/t and $620/t respectively.34 The resulting material cost is rounded to $170/tAl to account for baking loss and other conversion costs.42
4.1.2.3 OPEX. The operational expenditure (OPEX) category includes insurance, maintenance, and labour costs. This can vary from one smelter to another depending on location and equipment used. This category also covers additional material costs for cryolite and aluminum fluoride, as around 19 kg of bath material are lost per tonne of aluminum produced.19 Pot relining costs, accounting for an estimated $30–50/tAl for an average lifetime of 1600 to 2500 days and a cost of around $300
![[thin space (1/6-em)]](https://www.rsc.org/images/entities/char_2009.gif) 000 per cell, can also be included in this category.43 Differentiating what falls into the OPEX and Other categories is however difficult, and some overlaps are probable from one source to the other. Costs of $132/tAl and $45/tAl were respectively estimated for these two categories to approximately fit the industry cost breakdowns.
000 per cell, can also be included in this category.43 Differentiating what falls into the OPEX and Other categories is however difficult, and some overlaps are probable from one source to the other. Costs of $132/tAl and $45/tAl were respectively estimated for these two categories to approximately fit the industry cost breakdowns.
4.1.4.1 Inert anodes technology. Using inert anodes would cut all carbon from the electrolytic process, thereby eliminating CO2 and PFC emissions. Research on the topic has gained momentum in the last few decades and such anodes are currently being developed by Elysis. The company hopes to reach commercialization by 2024 and has already built a pilot-scale demonstration cell.46 The challenge in making inert anodes lies in the development of a material enabling stable operation and low wear rate in a high temperature corrosive environment, while avoiding the contamination of the aluminum produced.47 Another technology that could be employed to decarbonize aluminum production involves converting alumina to aluminum chloride before the reduction process, maintaining a closed loop for chlorine and carbon and only emitting oxygen. Norsk Hydro is currently developing this process, aiming to achieve pilot-scale production volume by 2030.48
4.1.4.2 Costs reductions. Apart from reducing carbon emissions, using inert anodes will likely impact aluminum production costs. This technology could have the benefit of increasing cell productivity by 15% while reducing operating costs by 15%.46 This is due to the reduced frequency at which anodes need to be replaced if a low wear rate is achieved, therefore reducing labor requirements.42 The cost of anodes could also be significantly cut down, although this will depend on materials and manufacturing methods used, which remain uncertain. Production cost of anodes on a commercial scale were estimated to range as low as $47–57/tAl.49 The need to build a carbon anode baking plant would also be eliminated for new smelters, which could represent a total CAPEX reduction of up to 30%.37,50 Table S1 in the ESI† provides a summary of various sources regarding the potential impact of inert anodes on aluminum production costs.
4.1.4.3 Wettable cathodes. Removing carbon from the process would, however, increase the energy requirement, as the contribution of eqn (4) to the reduction process would no longer be present. This increase, which could be compensated in part by a reduction in the kinetic overvoltages at the anode, would result in an overall voltage increase of around 0.63 V, as shown in Fig. 1.23 To keep the energy requirement close to the initial level, inert anodes would need to be implemented in combination with a wettable cathode. This consists in the use of an inert ceramic coating on the cathode, such as titanium diboride (TiB2), to ensure better electrical contact with the reduced aluminum pad sitting at the bottom of the cell. This enables the possibility of operating with a thinner metal pad, thereby reducing the height of the waves formed at its surface due to magnetohydrodynamic effects.19 The cell could then operate at a smaller anode to cathode distance while avoiding short circuits, reducing the electrolyte resistive losses and increasing reduction efficiency, as seen in Fig. 1. This change in resistive losses and the elimination of carbon oxidation from the process would, however, present a challenge for the cell's thermal balance. Adding better insulation would likely lead to the melting of the frozen side ledge needed to protect the walls from corrosion.51 New cell designs, such as a vertical anode arrangement, may be required to harness the full potential of both inert anodes and wettable cathodes.24,37,42
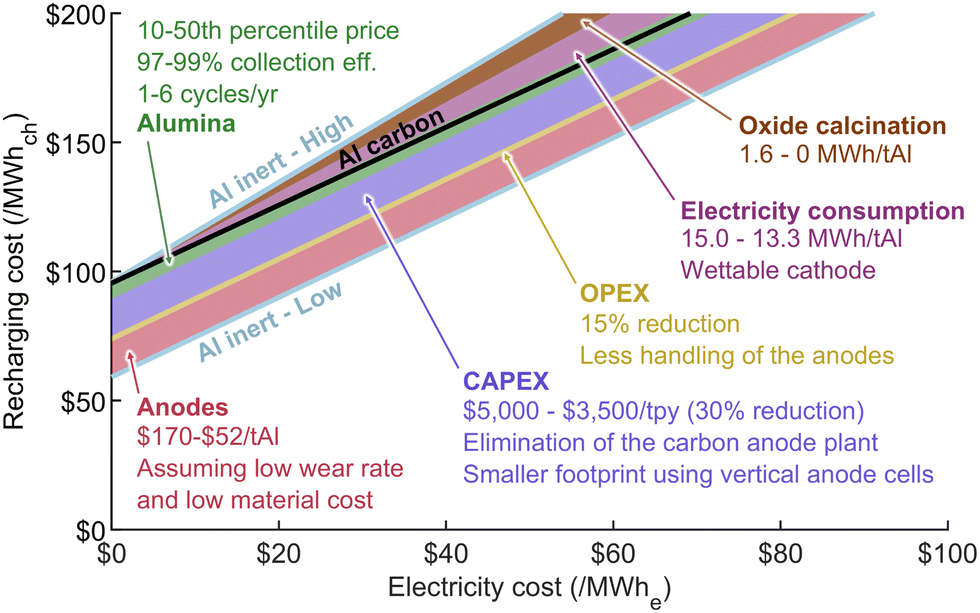 | ||
| Fig. 4 Aluminum recharging cost plotted with respect to input electricity cost. Conventional carbon anode recharging cost corresponds to the black line, and is compared to the range in which inert anode smelting technology could fall. The contribution of each cost category is shown with their respective boundaries. | ||
4.2 Transportation and storage costs
To assess the delivered energy cost of aluminum, the storage and shipping costs must be added to the recharging cost. Aluminum fuel is assumed to be transported using a Panamax dry-bulk carrier having a cargo capacity of 80000 DWT. The cost of such a vessel is estimated around $40m,52,53 amortized using a CRF of 9.4%, corresponding to a 8% interest rate i for an average lifetime n of 25 years, which is reasonable for dry-bulk carriers.54 Daily fuel cost F is calculated assuming a 50% efficient engine running 24 hours per day at a continuous power rating of 10 MW, typically used for Panamax dry-bulk carriers cruising at their design speed of 14.5 knots.54 Heavy fuel oil (HFO) is assumed to provide the energy for powering the carrier, therefore increasing aluminum's carbon footprint. However, the use of clean fuels is expected to contribute to decarbonizing shipping in the future, with the Internatinoal Maritime Organization having pledged to reach net-zero by 2050.55 Although canal fees Ccanal might not be necessary depending on the shipping route, a passage fee of $188000 every 12000 km on average was included as a proxy for this cost in this generic model. This fee corresponds to a 80000 DWT dry-bulk super vessel crossing the Panama canal.56 Around half the cargo capacity Q is used to ship aluminum, to ensure the same vessel can bring back the corresponding amount of oxide to be recycled on the return trip, according to the 1.9 molar mass ratio between alumina and aluminum. The volumetric ratio was not considered, as it was assumed the ship was limited by the weight of the cargo and not by its volume. The shipping duration, ts, is calculated by doubling the shipping distance to account for the return trip, and a total of 4 days of downtime per trip is added for handling cargo at the ports th, necessary to load and unload aluminum and aluminum oxide both at the import and export sites. The shipping cost is normalized using the amount of aluminum fuel transported as described by eqn (9), therefore decoupling the analysis from the size of the carrier used. The parameters used are listed in Table 1 and results are shown later in Fig. 7. | (9) |
| Parameters | Unit | Value |
|---|---|---|
| Vessel CAPEX, CPXV | $m | 40 |
| Vessel lifetime, n | Years | 25 |
| Vessel capacity, Q | DWT | 80000 |
| Vessel speed | Knots | 14.5 |
| Maintenance cost, OPXV | % of CAPEX | 457 |
| Labor cost, L | $ per day | 700057 |
| Fuel consumption | tHFO per day | 40 |
| HFO cost | $ per tHFO | 50057 |
| Load/unload duration, th | Days per trip | 4 |
| Port charges, Cport | $ per trip | 100000 |
| Canal costs, Ccanal | $ per day on average | 10000 |
Regarding storage, aluminum should have minimal requirements if its size is kept over 420 microns,18,58 as it is already protected by its natural oxide layer. Handling and storage of powders below that size should be done with caution due to some fire and explosion hazards. Coarse aluminum particles are however considered safe, and dry bulk storage for grain was deemed to be a reasonable comparable reservoir cost, with grain silos ranging from $1–5 per bushel.59–61 Aluminum can store 10 times more energy per unit volume than cryogenic hydrogen, and over 6 times more than liquid ammonia, as shown in Table 2. However, it is assumed that the same tanks would be used to store both the metal and the oxide powder byproduct. Doing so, the effective storage density of aluminum is significantly reduced to account for the volume of the oxides collected, which are expected to have a bulk density similar to that of SGA, i.e. around 1 g cm−3.26
| Energy carrier | Specific energy (kWh kg−1) | Density (kg m−3) | Energy density (kWh L−1) |
|---|---|---|---|
| LH2 (−253 °C) | 33.3 | 70 | 2.3 |
| NH3 (−33 °C) | 5.2 | 682 | 3.5 |
| Diesel | 11.8 | 850 | 10.0 |
| Aluminum | 8.6 | 2700 | 23.2 |
| Al (SGA bulk density) | 4.5 | 1000 | 4.5 |
With aluminum fuel expected to require around 2 m3/tAl, the storage cost would fall in the range of $58–284/tAl. Operating costs of 4% of the CAPEX are assumed to account for loading and unloading procedures, maintenance, and cleaning, and the equipment is amortized over 25 years at 8% interest rate. With those assumptions, the yearly storage cost would fall in the range of $7.6–38/tAl or $0.9–4.4/MWhch, therefore of the same order of magnitude as shipping costs for a 5000 km round trip.
4.3 Power generation costs: Al-to-Power
Once at destination, aluminum is assumed to be fed to a metal–water reactor to release heat and hydrogen, which can both be used for power generation. This reactor is expected to operate in the range of 450–600 °C and 250 bar, as supercritical water was shown to efficiently oxidize coarse aluminum particles without the need for any catalyst.17 The cost of such a reactor was estimated from economic analyses conducted for supercritical water oxidation (SCWO) sewage treatment plants operating under similar conditions. Few studies provide such numbers, and results can vary significantly from one source to another,62,63 which explains the large uncertainty used in this study. Additionally, to translate these results to a metal–water reactor, many assumptions are needed due to the many differences between the two technologies. The reactor, pumps and separation unit to collect the oxides are therefore estimated to account for $140 ± $110 per kWch, referring to the chemical energy input of the aluminum fuel. Since operating the reactor at supercritical conditions is likely to increase corrosion issues and the use of a solid fuel might induce faster wear rate on many components the OPEX is set as 8% of CAPEX, and the lifetime is set at a maximum of 10 years.In the current analysis, it is assumed that the stoichiometric heat-to-hydrogen ratio produced by the aluminum–water reaction is available to the power generation system, although some hydrogen could be diverted for other uses if needed. A steam turbine (ST) first converts the heat to power, by expanding the hydrogen-steam stream exiting the reactor. Once the steam is condensed and the hydrogen is separated, it is either used in a gas turbine (GT), an internal combustion engine (ICE), a proton-exchange membrane fuel cell (PEMFC) or a solid oxide fuel cell (SOFC). The overall power generation system is illustrated by the block diagram shown in Fig. 5. Data from the literature is used to determine the CAPEX and efficiency for these equipment (see ESI,† Section S6), and different combinations are modeled to find the least-cost electricity generation option. The cheapest system to convert heat and hydrogen to electricity depends on its size and utilisation rate (capacity factor), as both efficiency and CAPEX scale with power rating for most equipment. Combined cycles are not considered, even if some waste heat could potentially be recuperated by the steam turbine to make the plant more efficient. The system is also not constrained by any redundancy requirement, although in a practical application, many pieces of equipment are expected to be needed to enable maintenance while avoiding downtime. Losses related to the reactor pumps or the oxide collection system are neglected.
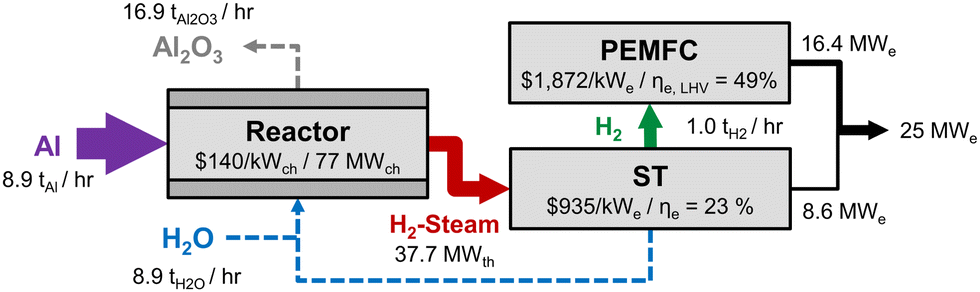 | ||
| Fig. 5 Block diagram of the aluminum fuel 25 MWe power generation system, with an overall efficiency is 32%. The cost and efficiency of each sub-component are shown in the figure. | ||
5 Case study: clean energy for remote industries
Remote industries are heavily reliant on diesel to power their operations, and are in need of solutions to decarbonize their operations. The case of a northern Canada remote mine is investigated to compare aluminum cost-competitiveness to other alternatives. It is assumed that 25 MWe of baseload power generation system is required, as most mines operating off-grid in Canada need around 20–40 MWe.64 The mine's operational lifespan is assumed to be 10 years; therefore, all equipment was amortized over that same period. The energy is supplied from a region rich in renewable energy, where it is stored and transported to the remote location. The mine is assumed to be located at 5000 km from the fuel production site. It is considered to be only accessible by sea when the ice has melted, therefore limiting the optimal number of trips per year to two, i.e. early and late summer.5.1 Liquefied hydrogen and ammonia as alternatives
To offer a broader context to the study, liquefied hydrogen and ammonia were selected as alternative clean energy carriers for comparison with aluminum. Both options were identified as some of the most cost-effective carbon-free energy carriers in various studies.65–70 Although liquid organic hydrogen carriers and methanol are often included in other studies, they were omitted to focus solely on carbon-free alternatives.Similarly to aluminum, the production, shipping, storage and power generation costs were modeled for both LH2 and NH3. An overview of the pathways compared in this study is presented in Fig. 6. Gaseous hydrogen, serving as the feedstock for both, is assumed to be supplied by an electrolyser operating continuously, to keep consistent assumptions with the aluminum case. A liquefaction plant is necessary in the case of LH2, while an air separation unit supplying nitrogen and a Haber–Bosch synthesis loop are needed for the production of NH3. Storage is omitted at the production site, prior to shipping, assuming the same production plant would serve many customers, therefore amortizing this storage facility to a negligible value per shipment. Block diagrams illustrating the processing steps to produce, ship and store LH2 and NH3 are presented in Fig. S3 and S4 of the ESI.†
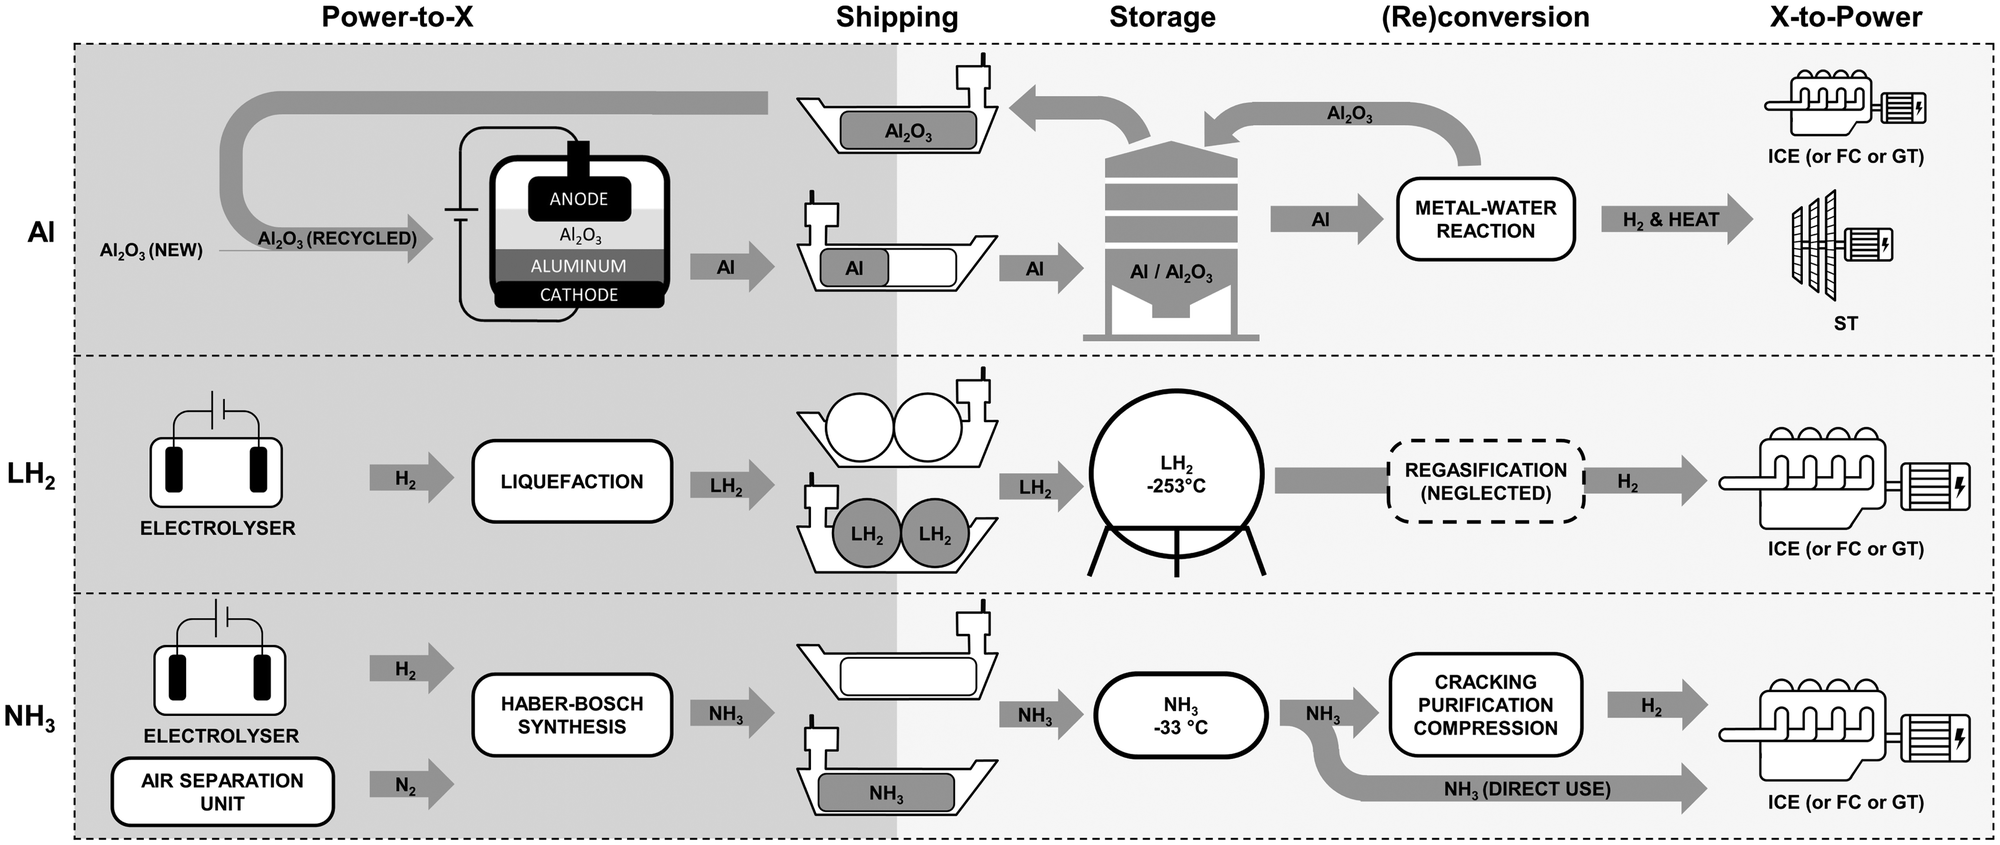 | ||
| Fig. 6 Overview the carbon-free energy carrier pathways studied. The darker grey portion on the left corresponds to the equipment and processes needed at the production site, prior to shipping. The rest is needed at the remote mine site. | ||
Regarding power generation, the optimal utilization of ammonia as an energy carrier remains unclear. Direct combustion is challenging because of its low flame speed and high ignition temperature, not to mention issues associated with high NOx emissions.71 To avoid this, the molecule can be cracked in part, or in full, to either produce a pure hydrogen stream or H2/NH3 blends. Bearing some similarities with steam-methane reforming, this cracking process is endothermic and requires a high-temperature heat input, typically around 550 °C or above depending on the catalysts.67 This high-temperature requirement prevents the use of waste heat in most cases. Additionally, the hydrogen conversion efficiency is highest at low pressure, therefore adding a need for compression prior to being fed to a power generation system or being stored. A purification step might also be needed, depending on the fuel requirements of the power generation equipment used.
In an effort to encompass all possible scenarios for ammonia as fuel, this study assumes two different scenarios as shown in Fig. S4 (ESI†): direct utilization, or ammonia cracking using heat from hydrogen combustion. Direct utilization is the most favorable scenario as it does not require post-processing, but prevents the use of PEMFC which typically operates on pure hydrogen.67 For ammonia cracking, the heat needed is considered to be supplied by hydrogen combustion, at 100% efficiency. In that case, electricity is also needed for the compression and purification stages. It is assumed that this electricity is generated by diverting some of the hydrogen produced to a 50% efficient power generation system, simplifying the analysis by ignoring any capital or operational costs for this step. Both the heat and electricity needed decrease the overall X-to-Power efficiency for this scenario, making it the least favorable.
The various parameters used for modeling production costs of each carrier are outlined in Table 3. A wide range of values are found for most parameters, reflecting differences in technologies considered, their maturity, the anticipated cost and performance improvements according to learning rates, the effect of size and economies of scale, and the impact of inflation on costs. While accounting for all of these effects is outside the scope of this study, some lower and upper bounds were defined for most parameters to capture some of this uncertainty. Unless otherwise stated, the plant life used to amortize the capital investment is assumed to be 25 years, and the OPEX is taken to be 4% of the CAPEX.
| Parameter | Low | High |
|---|---|---|
| a The ammonia cracker depreciation period should match that of the power generation and storage equipment installed at the mine site. | ||
| Hydrogen electrolyser65,66,72,73 | ||
| CAPEX ($ per kWe) | 700 | 1500 |
| OPEX (% of CAPEX) | 1.5 | 4 |
| Electricity consumption (kWh kgH2−1) | 50 | 54 |
| Hydrogen liquefaction67,74,75 | ||
| CAPEX ($ per tH2 per year) | 5100 | 6400 |
| Electricity consumption (kWh kgH2−1) | 9 | 12 |
| Ammonia synthesis65–67,71,72,76 | ||
| CAPEX ($ per tNH3 per year) | 220 | 900 |
| OPEX (% of CAPEX) | 1.5 | 4 |
| Electricity consumption (kWh kgNH3−1) | 0.58 | 1.46 |
| Conversion efficiency | 0.98 | 0.97 |
| Ammonia cracking66,67,77,78 | ||
| CAPEX ($ per tNH3 per year) | 310 | 1000 |
| Plant lifea (years) | 10 | — |
| Heat requirement (kWh kgNH3−1) | 1.58 | 1.71 |
| Electricity requirement (kWh kgNH3−1) | 0.18 | 0.26 |
| Conversion efficiency | 1 | 0.9 |
As for LH2 and NH3 shipping, the assumptions used are consistent with the aluminum case. A similar size carrier, with a cargo volume of 160000 m3, was assumed to be full on the outward trip, and to come back empty. Boil-off losses are assumed to displace some of the fuel consumption on the outward journey, thereby reducing fuel cost, but also lowering the transportation efficiency. Details on the model and the assumptions are presented in Section S5 of the ESI.† Storing hydrogen in its liquid state requires a temperature of −253 °C, which is significantly lower than for liquefied natural gas at −163 °C or ammonia at −33 °C, therefore making it harder to limit boil-off losses while keeping costs low. Unlike ammonia, which is already being transported on a large scale, large hydrogen carrier ships do not exist yet, which explains the wide range of values found in Table 4 and seen in Fig. 7.
| Parameter | LH2 | NH3 |
|---|---|---|
| Vessel CAPEX ($ per kg) | 30–90 | 1.5–2.0 |
| Storage CAPEX ($ per kg) | 30–90 | 0.8–1.7 |
| Boil-off rate (% per day) | 0.1– 0.3 | 0.04 |
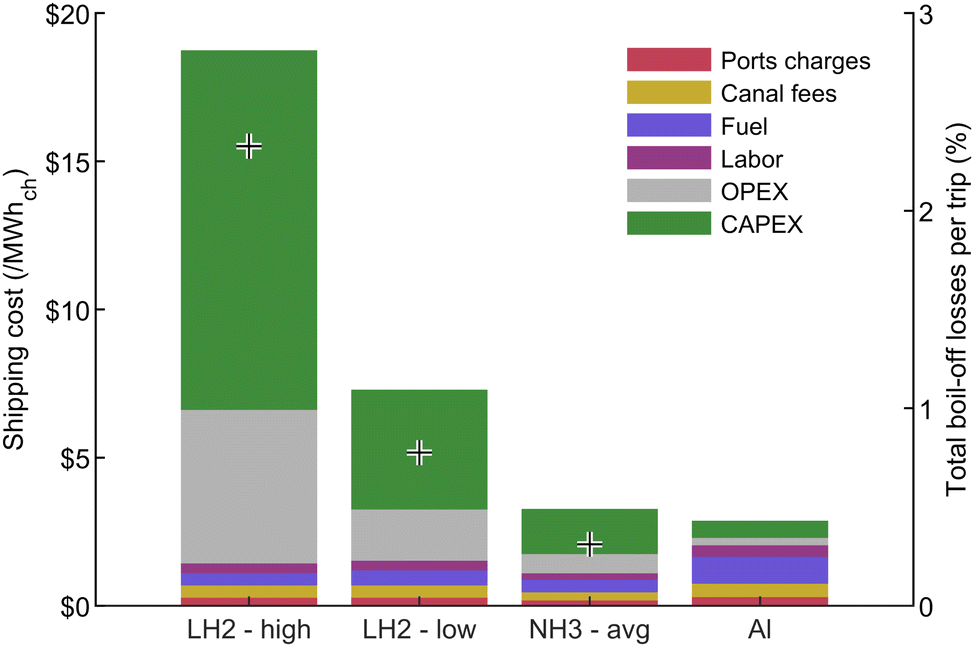 | ||
| Fig. 7 Shipping cost breakdown for a 5000 km trip. Both the low and high assumptions of Table 4 are considered for LH2, while an average case is used for NH3. Crosses show the total boil-off losses per trip, providing insights into the overall transportation efficiency for each pathway. | ||
5.2 Recharging costs: Power-to-X
Based on the analysis presented above, the costs of producing aluminum, ammonia and liquefied hydrogen are presented in Fig. 8 as a function of input electricity price. From this figure, information on fixed costs can be obtained from the y-intercepts, when electricity is free, while the slopes provide insights into the energy storage efficiency of each carrier. It can be observed that LH2 and NH3 have similar production cost, while aluminum has higher fixed cost while being the most efficient Power-to-X (PtX) option at 57.6% for the average case. It can also be seen that cracking ammonia significantly reduces its efficiency as an energy carrier.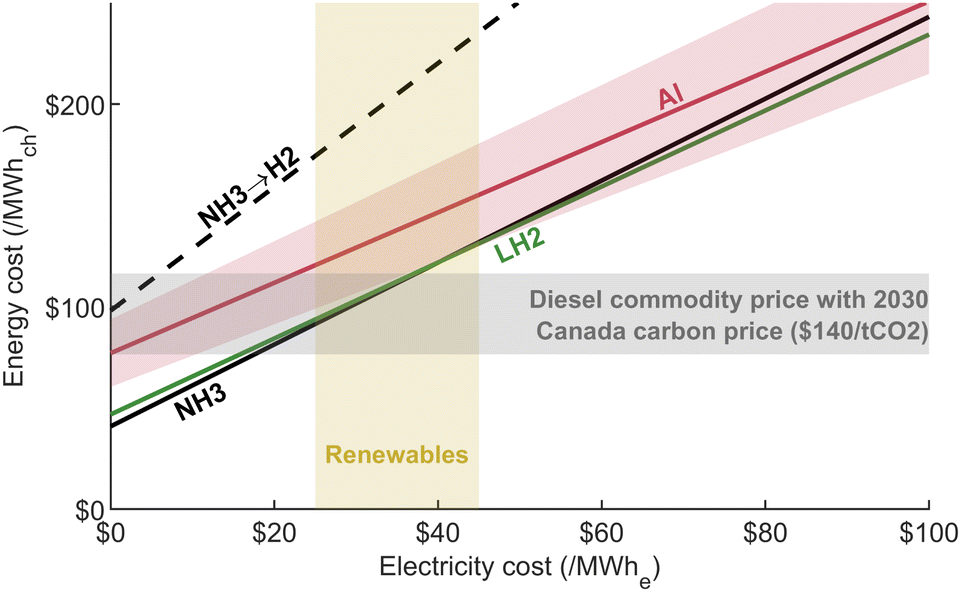 | ||
| Fig. 8 PtX cost for all carriers versus electricity cost. The input parameters are set as the average value within their respective range from Table 3. The shaded area for aluminum illustrates the effect of varying the input parameters from the low to high scenario (see Fig. 4), with the number of cycles per year set at 2. Diesel commodity price in the range of $50–100 per bbl11 is shown as an indication for the energy cost. | ||
To visualize the effect of each parameter on the PtX cost, a stacked bar chart is presented in Fig. 9. In this figure, and for the remaining analysis, the input electricity price is set at $30/MWhe at the production plant, which is in the range of the industrial rate in Quebec mostly supplied by hydropower.40 It shows that the heat necessary to crack the ammonia molecule is the main factor increasing the cost compared to direct ammonia utilization. The higher overall efficiency of the aluminum process is illustrated by its lower electricity cost share, compared to the hydrogen carriers. Aluminum, however, has higher fixed costs, which are mainly driven by high CAPEX.
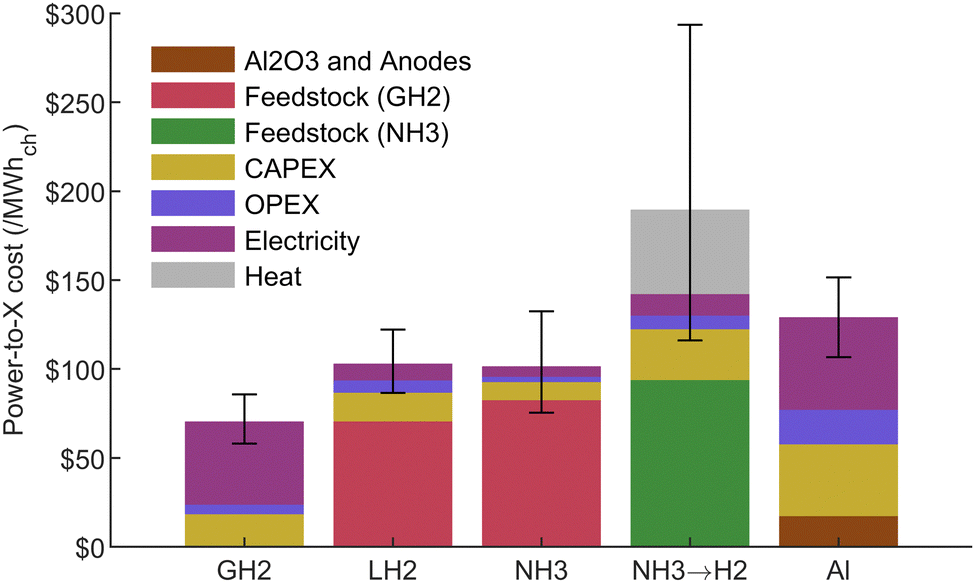 | ||
| Fig. 9 PtX cost distribution for all carriers at $30/MWhe electricity cost. Error bars reflect the uncertainty from all PtX input parameters (see Table 3). The gaseous hydrogen (GH2) stack refers to the hydrogen production cost from the electrolyser then used as a feedstock for LH2 and NH3, which totals $70.5/MWhch or $2.35/kgH2. | ||
5.3 Transportation and storage costs
The effect of shipping and storing the different energy carriers can be observed in Fig. 10. The results illustrate that shipping costs represent a small portion of the delivered energy cost for all options. This cost would increase with distance but should stay fairly negligible in all cases except for LH2. On the other hand, storage cost is significant for all hydrogen carriers because, assuming only two trips per year, half of the energy consumed yearly must be stored at the remote location. This effect is significant for LH2 and NH3 since their storage cost is expensive compared to aluminum. This storage cost is inversely proportional to the number of trips per year and would lead to maximizing the fuel shipment frequency for LH2 and NH3 in order to minimize cost. It should also be noted that boil-off losses at the final location are neglected since, for the six-months long storage scenario, the amount consumed for power generation would be of 0.5% per day, which is higher than the maximum boil-off value considered in this study.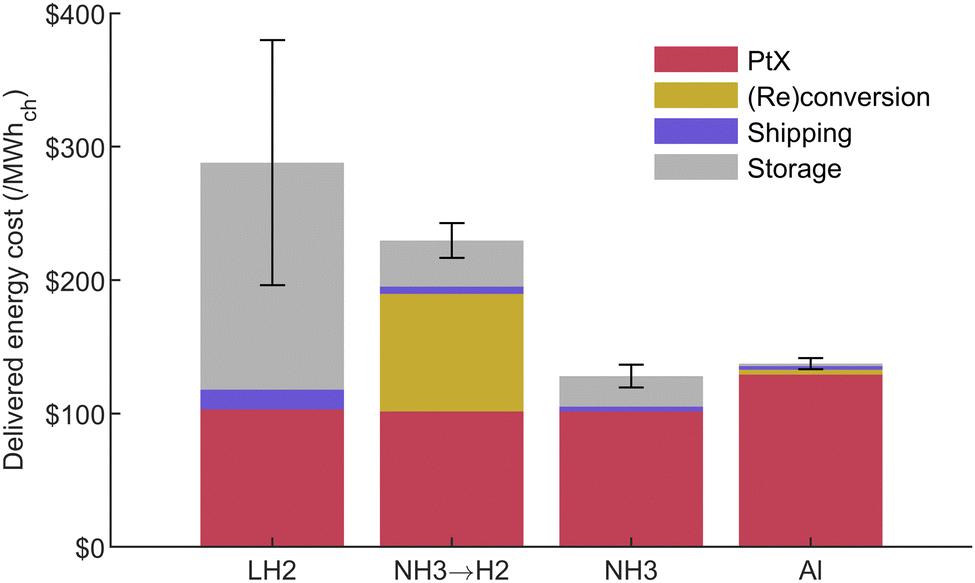 | ||
| Fig. 10 Delivered energy cost at 5000 km for 2 trips a year assuming the storage equipment is amortized over the mine's operational lifespan. Error bars reflect the uncertainty from all shipping and storage input parameters (see Table 4). | ||
5.4 Power generation costs: X-to-Power
For the hydrogen carriers, the power generation system was selected as the least-cost power generation option among the different equipment considered: GT, ICE, PEMFC and SOFC. Details on the assumptions used in for CAPEX, OPEX and efficiency can be found in the ESI,† Section S6. For aluminum, a combination of a ST and a PEMFC was found to minimize the power generation cost in this specific case, as presented in Fig. 5. The results for all scenarios are presented in Fig. 11, where they are compared with the diesel fuel case, which represents the current situation. Diesel commodity price is used as the fuel cost for comparison to the current system, since no profit margin is assumed for the clean energy carriers. This cost, including shipping and storage, is set at $83/MWhch, which roughly leaves a $0.2/L margin for profits assuming a purchasing price of $1/L.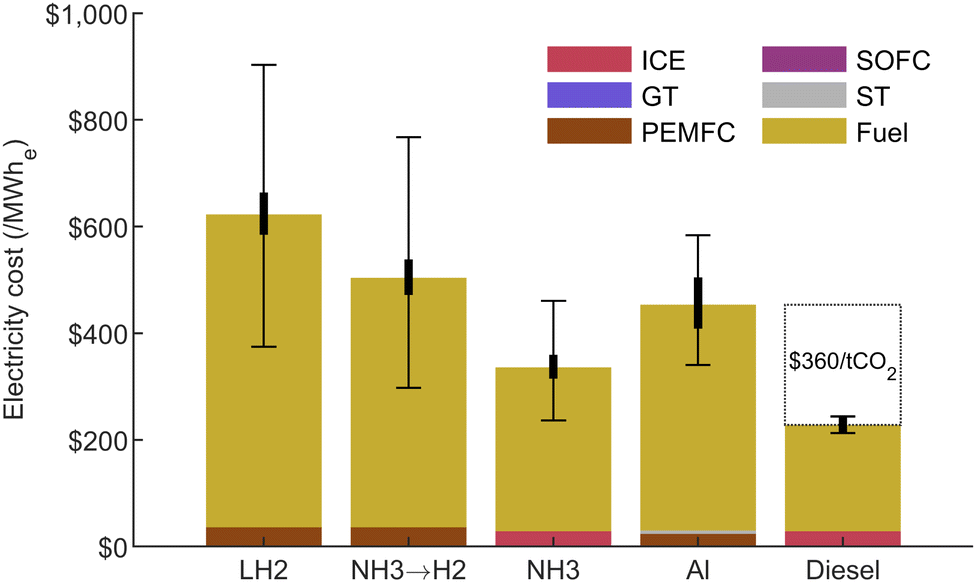 | ||
| Fig. 11 Electricity generation cost for each options compared to the baseline diesel case. Excluding transportation energy, the overall round-trip efficiencies for all carbon-free pathways are 25.4%, 13.5%, 24.1% and 18.7% respectively from left to right. In the same order, the electricity cost is $623/MWhe, $504/MWhe, $336/MWhe, $453/MWhe and $228/MWhe for diesel fuel. The thick error bands refer to the power generation equipment uncertainty on CAPEX and efficiency, while the main error bars show the effect of the total uncertainty (PtX, storage, shipping) on power generation cost. The aluminum case is compared to the diesel case to get the break-even CO2 price. This price was calculated based solely on the emissions from the diesel combustion process. | ||
These results show that aluminum is cost-competitive with hydrogen carriers in this application. The only cheaper scenario is the direct utilization of NH3, which benefits from the use of a high-efficiency ICE. In practice, a dual-fuel strategy might be required to reach suitable performances for ammonia combustion,79 and an aftertreatment system would be needed to reduce NOx emissions. A SOFC could be used instead, but it is unclear at what efficiency. In all cases, safety measures would need to be implemented to mitigate toxicity hazards for NH3. Nevertheless, for aluminum to break-even with current diesel fuel cost, a CO2 price of $360/tCO2 would be required. This is high compared to the current carbon pricing policies implemented in certain countries. To close the gap and rival with diesel in this application, aluminum's power generating cost, shown in Fig. 11, would need to fall within the lower end of its uncertainty range.
The LH2 and the NH3 → H2 cracking scenarios both employ a PEMFC at 49.1% efficiency, while the direct NH3 and the diesel scenarios use a 41.7% efficient ICE. These equipment are significantly more efficient than the 32% efficient aluminum–water power generation system, which suffers from a low-efficiency ST. This explains the higher fuel cost for aluminum seen in Fig. 11, although its delivered energy cost is similar to that of NH3 (seen in Fig. 10). The main factors influencing the final electricity cost in this study are the delivered energy cost and the power generation efficiency, which drive the fuel cost shown in Fig. 11. The power generation system is assumed to run as a baseload with a 100% capacity factor therefore spreading the CAPEX over a large number of operating hours and keeping its proportion low in the total electricity cost. Lowering the capacity factor, for example by integrating some wind turbines at the mine site, would affect the results by increasing the CAPEX share of the electricity cost.
The mass, volume and total CAPEX needed at the mine are presented for each option in Fig. S8 in the ESI.† All carbon-free scenarios require a similar storage size, approximately 3 to 4 times bigger than for diesel. The CAPEX at the mine, including the power generation equipment and storage, is significantly more important for the LH2 and the NH3 → H2 cracking cases, totalling $76m and $140m respectively. Expensive storage tanks are responsible for the difference in the LH2 case, while the cost of the cracker needed to release hydrogen from NH3 makes up the majority of the initial investment for this scenario. Direct NH3 utilization, the aluminum, and the diesel cases all have similar total CAPEX in the range of $38–$50m.
6 Conclusions
This study presents a comprehensive techno-economic assessment of aluminum as a sustainable energy carrier. The aluminum fuel recharging cost analysis relied on publicly available data compiled from investors’ presentations of aluminum producers, complemented by insights from the modern aluminum smelting process. Since the smelting process must be decarbonized to enable a sustainable use of aluminum fuel, the potential impact of inert anode technology was also reviewed to project its effects on costs. Transportation, storage and power generation costs were also evaluated to assess the entire energy cycle. Similar cost estimates were conducted for LH2 and NH3 in an effort to compare aluminum to other alternative often discussed as potential energy carriers. A case study was finally used to contextualize this comparison in the context of a remote mine requiring a continuous power supply of 25 MWe.Results indicate that aluminum has the potential to be cost competitive with diesel fuel on a chemical energy basis. To do so, aluminum must benefit from low electricity prices while a carbon pricing system needs be implemented to account for the cost of emissions. Aluminum could also reach similar costs as both LH2 and NH3 if inert smelting can help to reduce fixed costs, as PtX efficiencies are similar for all three pathways. The remote mine case study, integrating the costs of the entire cycle, demonstrates that aluminum can provide electricity at a cost comparable to these more widely discussed hydrogen carriers. Direct use of ammonia is shown to be marginally cheaper, but would require mitigating the high NOx emissions from combustion, and dealing with the corrosion and toxicity hazards. This positions aluminum as a promising and viable option for consideration in various other applications.
This study also shows that limited access to a location, which increases the storage size requirement, is particularly detrimental to LH2 and NH3 which need specialized storage tanks. Shipping costs are generally not a significant cost driver. The prohibitive storage cost of LH2, and the necessity for a cracking unit for NH3, incurring significant cost and complexity, are the main factors making these options more expensive.
The 25 MWe aluminum power generation system, despite being comparable to the diesel case in terms of total installed CAPEX at the mine, is facing a drawback due to its lower efficiency, estimated to be approximately 10 percentage points lower than that of other scenarios. Higher efficiencies could be achieved in applications in need of more power which could benefit from a higher steam turbine efficiency, or the use of a combined cycle to recuperate some waste heat. The development of a reactor capable of converting aluminum to hydrogen while efficiently converting heat to power is essential for the viability of this metal-fuel cycle.
Finally, the commercialization of inert anode smelting is key to make the aluminum fuel viable and should help gain more certainty on the recharging cost in the coming years. Future studies should focus on evaluating the potential of the aluminum fuel cycle for seasonal energy storage and its ability to facilitate global trade of clean energy. This should help in assessing the economic viability of integrating smelters as energy storage facilities and metal–water power generation in renewable-heavy electricity grids.
Author contributions
P. Boudreau: conceptualization, methodology, formal analysis, investigation, visualization, writing – original draft, writing – review & editing. M. Johnson: conceptualization, methodology, writing – review & editing. J. M. Bergthorson: conceptualization, methodology, resources, writing – review & editing, supervision, funding acquisition.Conflicts of interest
There are no conflicts to declare.Acknowledgements
The authors acknowledge the support of the Natural Sciences and Engineering Research Council of Canada (NSERC), PRIMA Québec, Siemens Energy, Hydro-Québec, Rio Tinto, Agnico Eagle and Teck. We thank the members, past and present, of the Alternative Fuels Lab at McGill University, for their support and discussions which served to strengthen this work.References
- P. Denholm, D. J. Arent, S. F. Baldwin, D. E. Bilello, G. L. Brinkman, J. M. Cochran, W. J. Cole, B. Frew, V. Gevorgian, J. Heeter, B.-M. S. Hodge, B. Kroposki, T. Mai, M. J. O’Malley, B. Palmintier, D. Steinberg and Y. Zhang, Joule, 2021, 5, 1331–1352 CrossRef.
- IRENA, Geopolitics of the Energy Transformation: The Hydrogen Factor, International renewable energy agency technical report, 2022.
- Federal Ministry for Economic Affairs and Energy, The National Hydrogen Strategy, 2020.
- IRENA, Global hydrogen trade to meet the 1.5 °C climate goal: Part – Trade outlook for 2050 and way forward, 2022, https://www.irena.org/publications/2022/Jul/Global-Hydrogen-Trade-Outlook.
- J. M. Bergthorson, Prog. Energy Combust. Sci., 2018, 68, 169–196 CrossRef.
- P. Julien and J. M. Bergthorson, Sustainable Energy Fuels, 2017, 1, 615–625 RSC.
- J. Neumann, R. C. da Rocha, P. Debiagi, A. Scholtissek, F. Dammel, P. Stephan and C. Hasse, Appl. Energy Combust. Sci., 2023, 14, 100128 Search PubMed.
- M. Baumann, L. Barelli and S. Passerini, Adv. Energy Mater., 2020, 10, 2001002 CrossRef CAS.
- J. Bergthorson, S. Goroshin, M. Soo, P. Julien, J. Palecka, D. Frost and D. Jarvis, Appl. Energy, 2015, 160, 368–382 CrossRef CAS.
- J. M. Bergthorson, Y. Yavor, J. Palecka, W. Georges, M. Soo, J. Vickery, S. Goroshin, D. L. Frost and A. J. Higgins, Appl. Energy, 2017, 186, 13–27 CrossRef CAS.
- K. A. Trowell, S. Goroshin, D. Frost and J. Bergthorson, Appl. Energy, 2020, 275, 115112 CrossRef CAS.
- H. Ersoy, M. Baumann, L. Barelli, A. Ottaviano, L. Trombetti, M. Weil and S. Passerini, Adv. Mater. Technol., 2022, 2101400 CrossRef CAS.
- J. Petrovic and G. Thomas, Reaction of Aluminum with Water to Produce Hydrogen, U.S. department of energy technical report, 2008.
- M. Y. Haller, D. Amstad, M. Dudita, A. Englert and A. Häberle, Renewable Energy, 2021, 174, 879–893 CrossRef CAS.
- L. Barelli, M. Baumann, G. Bidini, P. A. Ottaviano, R. V. Schneider, S. Passerini and L. Trombetti, Energy Technol., 2020, 8, 2000233 CrossRef CAS.
- M. Vlaskin, A. Dudoladov, O. Buryakovskaya and G. Ambaryan, Int. J. Hydrogen Energy, 2018, 43, 4623–4631 CrossRef CAS.
- K. A. Trowell, S. Goroshin, D. L. Frost and J. M. Bergthorson, Sustainable Energy Fuels, 2020, 4, 5628–5635 RSC.
- L. Dirven, N. G. Deen and M. Golombok, Sustain. Energy Technol. Assessments, 2018, 30, 52–58 CrossRef.
- Aluminum recycling and processing for energy conservation and sustainability, ed. J. A. S. Green, ASM International, Materials Park, Ohio, 2007 Search PubMed.
- M. Forté, M. Robitaille, N. Gros, R. Gariepy, I. Mantha, L. Lefrançois and J.-P. Figue, Light Metals 2015, Springer, 2015, pp. 495–498 Search PubMed.
- J. Thonstad, T. A. Utigard and H. Vogt, in Essential Readings in Light Metals, Aluminum Reduction Technology, ed. G. Bearne, M. Dupuis and G. Tarcy, Springer, Cham, 2016, vol. 2, pp. 131–138 Search PubMed.
- A. Solheim, Light Metals 2014, Springer, 2014, pp. 753–758 Search PubMed.
- W. Haupin, H. Kvande and L. Burrell, Light Metals 2000, 2000, vol. 6 Search PubMed.
- A. Gupta and B. Basu, Trans. Indian Inst. Met., 2019, 72, 2135–2150 CrossRef CAS.
- M. Authier-Martin, G. Forte, S. Ostap and J. See, JOM, 2001, 53, 36–40 CrossRef CAS.
- B. E. Raahauge, in Light Metals 2015, Springer, 2015, pp. 73–78 Search PubMed.
- S. J. Lindsay and P. Lavoie, in Smelter Grade Alumina from Bauxite: History, Best Practices, and Future Challenges, ed. B. E. Raahauge and F. S. Williams, Springer International Publishing, Cham, 2022, pp. 577–648 Search PubMed.
- S. J. Lindsay, in Light Metals 2014, ed. J. Grandfield, Springer International Publishing, Cham, 2016, pp. 597–601 Search PubMed.
- G. J. McIntosh, J. B. Metson, T. Niesenhaus, T. Reek and L. Perander, JOM, 2014, 66, 2272–2281 CrossRef CAS.
- J. Metson, M. Hyland and T. Groutso, TMS Light Metals, 2005 Search PubMed.
- L. M. Perander, J. B. Metson and C. Klett, in Light Metals 2011, ed. S. J. Lindsay, Springer, Cham, 2016, pp. 151–155 Search PubMed.
- D. Davis, F. Müller, W. L. Saw, A. Steinfeld and G. J. Nathan, Green Chem., 2017, 19, 2992–3005 RSC.
- Alcoa Corporation, Investor Presentation, 2018, https://investors.alcoa.com/events-and-presentations/presentations/2018/default.aspx.
- Hydro, Second quarter 2020 Investor presentation, 2020.
- R. Tinto, Fact Book, 2021 Search PubMed.
- B. Gao, Z. Wang, Z. Shi and X. Hu, Proceedings of 35th International ICSOBA Conference, 2017, pp. 53–68.
- H. Kvande and P. A. Drabløs, J. Occup. Environ. Med., 2014, 56, S23 CrossRef CAS PubMed.
- R. Tinto, Saguenay – Lac-Saint-Jean, https://www.riotinto.com/operations/canada/saguenay.
- R. Tinto, Investor seminar, 2021, https://cdn-rio.dataweavers.io/-/media/content/documents/invest/presentations/2021/rt-investor-seminar-2021-slides.pdf?rev=79cfcc69970d493e8cd62aa4b5877b06.
- H. Quebec, Rate L – Business, https://www.hydroquebec.com/business/customer-space/rates/rate-l-industrial-rate-large-power-customers-billing.html.
- G. Djukanovic, Why Are Anode Production Costs Rising? 2018, https://aluminiuminsider.com/why-are-anode-production-costs-rising/.
- J. Keniry, JOM, 2001, 53, 43–47 CrossRef CAS.
- P. Lavoie, Adv. Mater. Res., 2011, 275, 93–96 CAS.
- Lazard, Levelized Cost of Energy Analysis—Version 15.0, 2021.
- RioTinto, BC Works, https://www.riotinto.com/en/operations/canada/bc-works.
- A. Svendsen, Light Metal Age, 2022, 2 Search PubMed.
- D. R. Sadoway, JOM, 2001, 53, 34–35 CrossRef CAS.
- Hydro, HalZero – pioneering zero-emission aluminium, 2024, https://www.hydro.com/en/media/on-the-agenda/hydros-roadmap-to-zero-emission-aluminium-production/halzero-zero-emission-electrolysis-from-hydro/.
- R. von Kaenel, Light Met., 2006, 397–402 CAS.
- I. T. Garós Villar, MSc thesis, Massachusetts Institute of Technology, 2010.
- H. Kvande and W. Haupin, JOM, 2001, 53, 29–33 CrossRef CAS.
- F. H. Saadi, N. S. Lewis and E. W. McFarland, Energy Environ. Sci., 2018, 11, 469–475 RSC.
- A. M. Goulielmos, Mod. Econ., 2021, 12, 1537–1562 CrossRef.
- MAN Energy Solutions, Propulsion trends in bulk carriers, 2022, https://www.man-es.com/docs/default-source/marine/tools/propulsion-trends-in-bulk-carriers.pdf?sfvrsn=d851b1c6_14.
- IMO, IMO's work to cut GHG emissions from ships, 2024, https://www.imo.org/en/MediaCentre/HotTopics/Pages/Cutting-GHG-emissions.aspx.
- Panama Canal Authority, Maritime Tariff – Tolls, 2023, https://pancanal.com/en/maritime-services/maritime-tariff/.
- C. Johnston, M. H. Ali Khan, R. Amal, R. Daiyan and I. MacGill, Int. J. Hydrogen Energy, 2022, 47, 20362–20377 CrossRef CAS.
- The Aluminum Association, Recommendations for storage and handling of aluminum powders and paste, 2006, https://www.aluminum.org/sites/default/files/2021-11/Safe_Storage.pdf.
- K. B. Anderson and R. T. Noyes, Grain Storage Costs in Oklahoma, 2010.
- P. Kenkel, in Storage of Cereal Grains and Their Products, ed. K. A. Rosentrater, Woodhead Publishing, 5th edn, 2022, pp. 687–696 Search PubMed.
- Department of Agricultural and Resource Economics, Grain Bag and Bin Storage Calculator, 2022, https://arec.tennessee.edu/grain-bag-and-bin-storage/.
- G. B. M. De Souza, M. B. Pereira, L. C. Mourão, M. P. Dos Santos, J. A. De Oliveira, I. A. A. Garde, C. G. Alonso, V. Jegatheesan and L. Cardozo-Filho, Rev. Environ. Sci. Bio/Technol., 2022, 21, 75–104 CrossRef CAS.
- V. Vadillo, J. Sánchez-Oneto, J. R. Portela and E. J. Martínez De La Ossa, Supercritical Fluid Technology for Energy and Environmental Applications, Elsevier, 2014, pp. 181–190 Search PubMed.
- D. T. Wojtaszek, CNL Nucl. Rev., 2019, 8, 87–96 CrossRef.
- C. Hank, A. Sternberg, N. K. öppel, M. Holst, T. Smolinka, A. Schaadt, C. Hebling and H.-M. Henning, Sustainable Energy Fuels, 2020, 4, 2256–2273 RSC.
- IEA, The Future of Hydrogen, 2019, https://www.iea.org/reports/the-future-of-hydrogen.
- IRENA, Global hydrogen trade to meet the 1.5 °C climate goal: Part II – Technology review of hydrogen carriers, 2022, https://www.irena.org/publications/2022/Apr/Global-hydrogen-trade-Part-II.
- R. Ortiz Cebolla, F. Dolci and E. Weidner, Assessment of Hydrogen Delivery Options: Feasibility of Transport of Green Hydrogen within Europe, 2022, https://publications.jrc.ec.europa.eu/repository/handle/JRC130442.
- J. Hampp, M. Düren and T. Brown, PLoS One, 2023, 18, e0262340 CrossRef CAS PubMed.
- L. Genge, F. Scheller and F. Müsgens, Int. J. Hydrogen Energy, 2023, 48, 38766–38781 CrossRef CAS.
- A. Valera-Medina and R. Banares-Alcantara, Techno-economic challenges of green ammonia as an energy vector, Academic Press, 2020 Search PubMed.
- The Royal Society, Large-scale electricity storage, The royal society technical report, 2023.
- DNV, Hydrogen Forecast to 2050, 2022.
- US DOE Hydrogen and Fuel Cell Technologies Office, DOE Technical Targets for Hydrogen Delivery, https://www.energy.gov/eere/fuelcells/doe-technical-targets-hydrogen-delivery.
- E. Connelly, M. Penev, A. Elgowainy and C. Hunter, Current Status of Hydrogen Liquefaction Costs, DOE Hydrogen and Fuel Cells Program Record Technical Report 19001, 2019.
- J. Benner, M. Van Lieshout and H. Croezen, Identifying breakthrough technologies for the production of basic chemicals, CE Delft technical report, 2012 Search PubMed.
- C. Makhloufi and N. Kezibri, Int. J. Hydrogen Energy, 2021, 46, 34777–34787 CrossRef CAS.
- S. Chatterjee, R. K. Parsapur and K.-W. Huang, ACS Energy Lett., 2021, 6, 4390–4394 CrossRef CAS.
- A. Valera-Medina, H. Xiao, M. Owen-Jones, W. David and P. Bowen, Prog. Energy Combust. Sci., 2018, 69, 63–102 CrossRef.
Footnote |
| † Electronic supplementary information (ESI) available. See DOI: https://doi.org/10.1039/d4ya00151f |
| This journal is © The Royal Society of Chemistry 2024 |