 Open Access Article
Performance and failure mechanisms of alkaline zinc anodes with addition of calcium zincate (Ca[Zn(OH)3]2·2H2O) under industrially relevant conditions†
Patrick K.
Yang
 abc,
Damon E.
Turney
 *c,
Michael
Nyce
c,
Bryan R.
Wygant
 e,
Timothy N.
Lambert
 ef,
Stephen
O'Brien
 abc,
Gautam G.
Yadav
 g,
Meir
Weiner
g,
Shinju
Yang
g,
Brendan E.
Hawkins
g,
Meir
Weiner
g,
Shinju
Yang
g,
Brendan E.
Hawkins
 g and
Sanjoy
Banerjee
cdg
aPh.D. Program in Chemistry, The Graduate Center of the City University of New York, 365 Fifth Avenue, New York, New York 10016, USA
bDepartment of Chemistry and Biochemistry, The City College of New York, Marshak Science Building, Room 1024, 160 Convent Avenue, New York, NY 10031, USA
cThe CUNY Energy Institute, The City College of New York, City University of New York, Steinman Hall, 160 Convent Avenue, New York, NY 10031, USA. E-mail: dturney@ccny.cuny.edu; Tel: +1 (212) 650-5470
dDepartment of Chemical Engineering, The City College of New York, Steinman Hall, 160 Convent Avenue, New York, NY 10031, USA
eDepartment of Photovoltaics and Materials Technology, Sandia National Laboratories, Albuquerque, NM 87185, USA
fCenter for Integrated Nanotechnologies, Sandia National Laboratories, Albuquerque, NM 87185, USA
gUrban Electric Power Inc., Pearl River, NY 10965, USA
First published on 28th May 2024
Abstract
Additions of calcium zincate (CaZn2(OH)6·2H2O, CaZn) to zinc (Zn) anodes in alkaline batteries have been investigated and were found to remarkably increase cycle life at high 50% Zn utilization of the anode's theoretical capacity, thereby significantly reducing anode costs. A spectrum of anode formulations with increasing CaZn (0%, 30%, 70%, 100%) in mixtures with metallic Zn is investigated along with minor additions of Bi2O3, acetylene carbon black, and CTAB. The total molar zinc content is normalized; thus, electrode capacity is kept comparable, resulting in electrodes relevant to real world use cases. We report details of the cell design, electrolyte composition, electrode design, and cycle testing procedure, all of which are kept close to industrially relevant values. A pure CaZn anode with acetylene carbon was shown to achieve 1062 cycles at 20% Zn utilization in ZnO saturated 20 wt% KOH whereas traditional Zn anodes only utilize 10% for similar cycle life. At high 50% Zn utilization, CaZn anodes achieved ∼280 cycles while Zn anodes achieved ∼50 cycles, resulting in a five-fold improvement in cycle life resulting in approximately ∼25% reduction in cost per cycle. Scanning electron microscopy analysis of cycled electrodes shows that adding CaZn reduces electrode failure by slowing down formation of a passivating zinc oxide layer at the surface of the electrode as well as decreases shape change. This appears to occur because zinc and calcium remain intimately mixed forming CaZn, which reduces dissolution and reprecipitation, but slowly will segregate as inactive materials are pushed to the surface where conductivity is lower.
1. Introduction
The transition from non-renewable fossil fuels to green renewable energy requires grid scale energy storage systems to help balance out the intermittency of energy generation with customer usage. Demand for low cost and safe energy storage is paramount to facilitating the transition but commonly used lithium and/or sodium ion batteries use dangerously flammable electrolytes. Zinc (Zn) chemistry provides a high theoretical capacity (820 mA h g−1), is geographically abundant, non-toxic, and non-flammable, all of which make it ideal for grid storage. Metallic Zn has been investigated extensively1 for anodes in primary and rechargeable Zn batteries such as Zn/Ni,2,3 Zn/Air,4,5 Ag/Zn,6 and Zn/MnO2.7–10 Zn has shown technological difficulties via poor cycle reversibility when utilized at high capacities. Failure mechanisms have been well documented including passivation, shape change/redistribution, dendrite formation, hydrogen evolution, and the crossover of zincate (Zn(OH)42−) into the cathode.2,9During discharge, conductive Zn goes through a dissolution precipitation reaction from Zn to an aqueous zincate ion (Zn(OH)42−) intermediary (eqn (1)). Zincate ions may (a) remain local and participate in subsequent charge step(s), (b) locally saturate and precipitate as Zinc Oxide (ZnO) solid (eqn (2)), (c) migrate or “shape change” to distant irreversible locations, (d) convert to irreversible Zn compounds, or (e) cross over to react with the cathode in detrimental reactions.11 Zinc passivation occurs on the surface due to ZnO deposited films and typically those are known to exist in two forms. “Type 1” a white relatively porous and loose homogeneous precipitate formed from a saturation of zincate due to the lack of convection on the anode surface and “Type 2” a light to dark grey densely packed passivation layer that prevents electrolyte penetration.12,13 Recently it has also been observed during ZnO cycling, within a certain overpotential, there is a highly electroactive blue ZnO layer that is formed on the anode surface.14
| Discharge/Charge reaction: Zn + 4OH− ⇌ Zn(OH)42− + 2e− | (1) |
| Precipitation/Dissolution reaction: Zn(OH)42− ⇌ ZnO + H2O + 2OH− | (2) |
Different methods have been employed to increase the cyclability of Zn anodes such as electrolyte engineering, anode interface modification, ZnO formulations, and 3D structures.15,16 It is widely understood that the addition of calcium hydroxide Ca(OH)2 into ZnO anodes helps boost battery cycling performance from the in situ formation of calcium zincate (CaZn2(OH)6·2H2O, CaZn)17,18 (eqn (3)). Ca(OH)2 complexes with the oxidized zincate ions locally, forming solid CaZn, trapping the zincate ions, and preventing redistribution which eventually leads to shape change.19 D’Ambrose et al.10 have shown using in situ X-ray diffraction (XRD) that CaZn is formed when cycling ZnO with Ca(OH)2 as an additive in KOH electrolyte. CaZn has a lower solubility in alkaline KOH electrolytes compared to ZnO, in 20% KOH there is more than 2× reduction from ∼25 g L−1 of ZnO dissolved to just ∼9 g L−1 CaZn.20,21 The lower solubility helps reduce the dissolution of zinc, thereby reduces the formation of zincate ions, which are susceptible to the losses mentioned above.5
| 2Zn(OH)42− + Ca(OH)2 + 2H2O ⇌ CaZn2(OH)6·2H2O + 4OH− | (3) |
CaZn powders have also been synthesized ex situ, using ZnO and Ca(OH)2 through various methods such as chemical precipitation,20,22,23 ball milling,17,18 hydrothermal,24 and alcohol thermal25etc. These result in different nano-morphologies with varying particle shape, size, and distributions while showing the same crystal pattern. Three major crystal morphologies reported are the classical tetragonal,20 hexagonal,26 and 3D flower-like CaZn.27 Each publication in the literature uses different parameters to test their anodes, making it difficult to compare results to elucidate what are the most important factors improving cyclability. Most try to achieve 100% utilization (depth of discharge, DOD) of the theoretical Zn, leading to poor cycle life typically less than 150 cycles, which is not realistic since industrial Zn batteries for grid storage typically require ≥1000 cycles2.
Many have synthesized and cycled various morphologies of CaZn using different additives in both the anode and electrolyte at different C-rates and voltage ranges, making it difficult to compare, all which has been summarized in Table 1.18,21,22,25,27–35 Caldeira et al.32 compared equal capacities of ex situ CaZn vs. in situ CaZn (ZnO + Ca(OH)2) anodes, utilizing 40% of theoretical capacity at C/3 for 157 cycles and continued at 1C until 313. The charging protocol involved overcharging the cells to 120% of the nominal capacity every 50 cycles and used 7 M KOH saturated with ZnO, which is known to provide additional overall capacity although it often goes unaccounted for in the literature.36 Shangguan et al.27 compared cycling performance of tetragonal, hexagonal, and novel 3D flower-like CaZn showing improving performance with changing morphology, achieving 297.5, 312.2, and 249.5 mA h g−1 respectively. The 3D flower-like CaZn showed the best performance, showing low-capacity loss after 800 cycles, although they used ZnO saturated 5 M KOH mixed with 0.5 M LiOH.
| Calcium zincate synthesis method | Calcium zincate morphology | Anode composition (wt%) | Electrolyte composition | Current collector composition and size | Anode thickness (mm) | Cathode | Rate performance charge/discharge (mA cm−2) | Average Zn utilization (% DoD) | Average discharge capacity mA h ganode−1 | Highest discharge capacity mA h ganode−1 | Voltage range (V) | # Cycle life (remaining capacity %) | Ref. # (year published) |
|---|---|---|---|---|---|---|---|---|---|---|---|---|---|
| Co-precipitation | Tetragonal | 90 CaZn, 8 PTFE, 2 PbO | 4 mol L−1 KOH saturated with ZnO | Screened copper mesh | 0.4 | Oversized sintered NiOOH sheet | 70 mA g−1 for 240 min | 0.195 | 67.50 | 83.00 | 1.0–2 | 550 (88%) | 22 (2001) |
| Co-precipitation | Hexagonal (Ca/Zn 0.49 mol) | 88 CaZn, 10 metallic bismuth powder, ≤2 PVA | 3.52 M KOH | Tin-electroplated porous nickel substrate (2 cm × 2 cm) | 0.8 | Sintered nickel hydroxide | 16 mA for 5 h/32 mA down to −1.13 V cut-off | 0.432 | 150.00 | 266.00 | 1.13–1.4 | 100 (20%) | 18 (2001) |
| Hexagonal (Ca/Zn 0.58 mol) | 0.865 | 300.00 | 325.00 | 100 (80%) | |||||||||
| Ball milling | Amorphous | 85 CaZn, 1 cellulose, 2 PbO, 10 acetylene black and 2 PTFE | 20 wt% KOH with 15 g L−1 LiOH | Expanded copper net | 0.1 | Large nickel sheet | — | 0.591 | 205.00 | 210.00 | 1.6–2.05 | 80 (100) | 21 (2003) |
| Ball milling | Amorphous | 97 CaZn, 3 graphite powder, 0.1 PTFE | 3.8 mol L−1 KOH + 0.2 mol L−1 LiOH | Pasted into brass foam at 30 MPa | — | Commercial sintered NiOOH/Ni(OH)2 plates | 0.1C/0.1C | — | — | 311.10 | 0.75–1.4 (vs. HgO/Hg) | 50 (89.7%) | 33 (2004) |
| 0.2C/0.2C | — | — | 307.50 | 50 (88.6%) | |||||||||
| 0.5C/0.5C | — | — | 304.60 | 50 (87.8%) | |||||||||
| 0.3C (105 mA g−1) for 3.5 h, discharged at 0.5C (175 mA g−1) | 0.839 | 291.00 | 347.00 | 200 (68%) | |||||||||
| Co-precipitation | Tetragonal | 0.790 | 274.00 | 345.00 | 200 (58%) | ||||||||
| 0.1C/0.1C | — | — | 289.90 | 50 (83.5%) | |||||||||
| 0.2C/0.2C | — | — | 284.20 | 50 (81.9%) | |||||||||
| 0.5C/0.5C | — | — | 279.70 | 50 (80.6%) | |||||||||
| Co-precipitation | Tetragonal | 95 CaZn, 1 graphite, 4 PTFE | 6 M KOH saturated with ZnO | Screened copper mesh (2 cm × 2 cm) | 0.3 | Nickel sheet | 10 mA cm−2 for 180 min/same current to cutoff voltage | 0.519 | 180.00 | 195.80 | 1.3–1.9 | 80 (81%) | 34 (2008) |
| Co-precipitation | Tetragonal | 70 CaZn, 2 nano-Cu (100 nm), 8 micro-sized Zn, 2 PbO, 3 Bi2O3, 15 PTFE | 4 M KOH | Ni-foam matrix (1 × 1 cm2) | — | 4 × 4 cm2 nickel foam −75 Ni(OH)2, 10 graphite, 10 CoO, 5 PTFE | charged 5 h at C/5, kept at OCV for 30 min, discharged at C/5 | 0.720 | 250.00 | 264.00 | 1–2.17 | 200 (71%) | 28 (2009) |
| Ball milling | Amorphous | — | — | — | 227.00 | ||||||||
| Co-precipitation | Tetragonal | 90 CaZn, 5 sodium carboxymethyl cellulose (Na-CMC), 5 PTFE | 8 M KOH saturated with ZnO | Copper mesh (1.5 × 1.0 cm) | 0.3 | Ni(OH)2 electrode | 8.5 mA cm−2 (3.5 h)/8.5 mA cm−2 down to 1.3 V | 0.784 | 272.00 | 280.00 | 1.3-N/A | 50 (98.9%) | 29 (2009) |
| 87.5 CaZn, 2.5 In(OH)3, 5 Na-CMC, and 5 PTFE | 0.677 | 235.00 | 278.00 | 50 (79.4%) | |||||||||
| 90 CaZn coated with 2.5 In(OH)3, 5 Na-CMC, and 5 PTFE | 0.634 | 220.00 | 278.00 | 50 (63.1%) | |||||||||
| Microwave | — | 85 CaZn, 5 SnO, 2.53 carboxymethylcellulose (CMC), 2.5 spherical graphite, and 5 PTFE | 3.8 M KOH and 0.2 M LiOH | — | — | Nickel electrode | 0.2C/0.2C | 0.749 | 260.00 | 315.00 | 1.3–1.92 | 120 (70%) | 30 (2011) |
| Co-precipitation | Tetragonal | 90 CaZn, 8 graphite, 1 carboxymethyl cellulose sodium (CMC), 1 PTFE | 4 mol L−1 KOH + 1 mol L−1 Na2CO3 sat. w/ZnO | Copper foam | 0.5 | Nickel foil | First cycle 10 mA g−1 (5 h), 40 mA g−1 to 2.15 V, rest 15 min, discharge 40 mA g−1 to 1.2 V. Then 40 mA g−1 (7 h), rest 15 min, discharge 40 mA g−1 and 100 mA g−1 to 1.2 V and 1.1 V respectively | 0.611 | 211.90 | 235.00 | 1.2–2.15 | 28 (90%) | 35 (2014) |
| Alcohol thermal-eth-CaZn | Hexagonal prism | 80 CaZn, 5 Zn powder, 10 acetylene black, and 5 PTFE | 6 M KOH saturated with ZnO | Copper mesh (1.0 cm × 1.0 cm) | 0.2 | Commercial sintered Nickel Ni(OH)2 electrode | Pre-activated 5–8 cycles: charge at constant current 0.1C for 600 min, discharge at constant current 0.2C to cut-off voltage then 2 C/2C | 0.951 | 330.00 | 341.20 | 1.2–1.86 | 250 (100%) | 25 (2014) |
| Alcohol thermal-iso-CaZn | Lamellar | 0.937 | 325.00 | 336.00 | 1.2–1.87 | 250 (100%) | |||||||
| Alcohol thermal-but-CaZn | Hexagonal prism and lamellar | 0.821 | 285.00 | 285.00 | 1.2–1.9 | 250 (100%) | |||||||
| Hydro-micromechanical | Tetragonal | 73 CaZn, 12 titanium nitride, 5 bismuth oxide, 10 polyvinyl alcohol (72![[thin space (1/6-em)]](https://www.rsc.org/images/entities/char_2009.gif) 000 Mw) 000 Mw) |
7 M KOH + 10 g L−1 LiOH saturated with ZnO | Copper foam | 2 | Nickel-based | Activate C/10 (12 h)/C/5 (to 1.2 V); C/3 (157 cycles) continue 1 C (313 cycles). Reactivate every 50 cycles, rest 30 min, deep discharge C/20 | 0.384 | 133.33 | 150.00 | 1.2–1.97 | 313 | 32 (2017) |
| Hydro-micromechanical | Tetragonal | 73 CaZn, 12 titanium nitride, 5 bismuth oxide, 10 polyvinyl alcohol (72![[thin space (1/6-em)]](https://www.rsc.org/images/entities/char_2009.gif) 000 Mw) 000 Mw) |
7 M KOH + 10 g L−1 LiOH saturated with ZnO | 1 Copper foam (300 g m−2) | — | Pasted NiOOH/Ni(OH)2 on nickel foam | 3 cycles at C/10 / C/5 then C/3 /C/3 | 0.125 | 43.33 | 130.00 | 1.4–1.93 | 50 (20%) | 31 (2020) |
| 2 copper mesh (100 g m−2, wire diameter = 70 μm) | 0.202 | 70.00 | 116.67 | 50 (60%) | |||||||||
| 3 copper mesh (100 g m−2, wire diameter = 70 μm) | 0.336 | 116.67 | 133.33 | 50 (90%) | |||||||||
| Co-precipitation | Tetragonal | 86 CaZn, 10 acetylene black, 4 PTFE | 6 M KOH + 0.5 M LiOH saturated with ZnO | Tin-plated copper mesh 1.5 cm × 1.5 cm pressed under 30 MPa | — | Sintered nickel electrode | 1 C/1 C | 0.620 | 215.00 | 280.00 | 1.2–1.85 | 400 (54.7%) | 27 (2021) |
| Co-precipitation | Hexagonal | 1 C/1 C | 0.735 | 255.00 | 300.00 | 400 (70.2%) | |||||||
| Micro-emulsion | 3D Flower-Like | 1 C/1 C, 1 C/2 C, 1 C/1 C | 0.893 | 310.00 | 340.00 | 400 (90.8%) | |||||||
| 800 (89%) | |||||||||||||
| Co-precipitation | Tetragonal | 86 CaZn, 10 acetylene carbon black, 4 PTFE | 20 wt% KOH saturated ZnO | Copper mesh (2 by 3 in or 5.08 cm × 7.62 cm) pressed to 30 psia | — | Commercial sintered nickel Ni(OH)2 | 0.4 C/0.4 C | 0.413 | 67.71 | 69.59 | 1.2–1.98 | 1062 (74%) | * Current work |
| 60 Zinc, 26 CaZn, 10 bismuth oxide, 4 PTFE | 20 wt% KOH | 0.41 | EMD-MnO2 | C/9 / C/18 | 280.29 | 330.29 | 31 (69%) | ||||||
| Commercial sintered nickel Ni(OH)2 electrode | C/3 / C/3 | 0.404 | 273.72 | 337.88 | 62 (70%) | ||||||||
| 26 Zinc, 60 CaZn, 10 bismuth oxide, 4 PTFE | 0.68 | 0.481 | 235.23 | 240.26 | 123 (67.8%) | ||||||||
| 86 CaZn, 10 bismuth oxide, 4 PTFE | 0.84 | 0.424 | 147.13 | 169.26 | 283 (69.1%) | ||||||||
| 86 CaZn, 10 acetylene carbon black, 4 PTFE | 1.06 | 0.427 | 148.29 | 171.04 | 267 (69%) | ||||||||
| 86 CaZn, 9 acetylene black, 2 CTAB, 4 PTFE | 1.14 | 0.424 | 146.98 | 171.79 | 172 (67.8%) |
Common conductive additives to CaZn electrodes include tin (Sn), carbon, bismuth(III) oxide, etc. Bismuth(III) oxide as an additive to the Zn anode has been shown to provide improved cycling performance and is thought to get reduced to Bi metal before ZnO is reduced to Zn. This leads to the formation of conductive channels of Bi metal throughout the anode, which enhances the cycling performance of Zn anodes by providing increased electronic conductivity and help to reduce H2 gassing caused by the hydrogen evolution reaction.18,37–40 This simplifies the number of variables, since some papers use expensive electroplating methods onto the current collectors, while the addition of powder bismuth oxide is easy and cheap to incorporate into the manufacturing process.
Despite CaZn showing improvement in cyclability at higher utilization,34,35 studies only cycle CaZn against nickel Ni(OH)2 counter electrodes because they are at the same state-of-charge. In order to drive costs of grid scale energy storage down from $300 kW h−1 to $100 kW h−1 or less,41 CaZn anodes need to be paired with MnO2 electrodes because nickel cost ten times more than MnO2. CaZn anodes either need to be formed up to Zn with MnO2 or separately before being paired with MnO2, both which will cost additional time and money, or as in our approach, we attempt to add Zn powder directly to reduce additional processing steps. The addition of Zn powder into the anode helps to increase the volumetric energy capacity as well, due to the lower capacity density of CaZn (347 mA h g−1, d = 2.59 g cm−3)34,35 compared to Zn (820 mA h g−1, d = 7.133 g cm−3) and ZnO (978 mA h g−1, d = 5.61 g cm−3). Our industrial partner, Urban Electric Power, Inc. (UEP), has commercialized proton-insertion Zn∣MnO2 batteries made via roll-to-roll manufacturing in both jelly rolled cylindrical and prismatic form factors. The addition of CaZn into Zn anodes will help increase cycle life of Zn anodes at higher Zn utilization, thereby further driving down the cost of rechargeable alkaline Zn∣MnO2 batteries for grid storage.
Here, we cycle different Zn anodes with increasing amounts of CaZn as an additive, all with the same total molar amount of zinc, at high commercial Zn utilization from 20% to 50%. Small amounts of metallic Zn have been used as an additive to CaZn anodes previously25 to improve the specific capacity, but all CaZn papers focus on nickel cathodes instead of MnO2. By focusing our efforts on high Zn mixtures with CaZn, these anode formulations can be paired with MnO2 and quickly incorporated into industrial production without having additional processing steps. Anode capacity was levelized across all formulations to better compare cycling performance and understand the tradeoff between cycle life, energy density, and anode cost as the amount of CaZn increases. Deeper understanding of CaZn performance both as an additive to metallic Zn and as a pure anode will provide insight into how industrial formulations can achieve higher utilization of the theoretical capacity of the Zn in rechargeable secondary zinc batteries.
2. Experimental
2.1 Synthesis of calcium zincate
Calcium zincate was synthesized at room temperature via a co-precipitation method based on the Sharma's20 recipe. In a standard batch, 1 g (0.012 mol) of ZnO (99%, <1 μm diameter, Umicore) was added into 100 mL of 20 wt% v−1. potassium hydroxide (85% KOH pellets, Fisher Sci.) in a beaker and stirred constantly at room temperature until fully dissolved and clear. After the powder was fully dissolved, 10 g (0.135 mol) of calcium hydroxide (Ca(OH)2, 99%, Fisher Sci.) was added slowly and stirred. 14.6 mL of deionized water (DI water) was added before a final 22 g (0.27 mol) of ZnO was added slowly. The top of the beaker was wrapped with parafilm and stirred for 24 hours before being left to settle another 24 hours where the solution separates into two layers, a top liquid and a bottom white powder. The top liquid is carefully decanted off and the remaining powders are washed with deionized water until the pH of the wash water is around a pH of 7. The powders are then placed into an oven to dry overnight at 50 °C before being removed and crushed with a mortar and pestle into a fine powder for use.2.2. Electrode fabrication
Most of the cells tested were based off a possible commercial Zn anode (areal loading: ∼0.24 g cm−2) approximately 96 wt% Zn with additives and binder.2 In order to ensure failure of cells were caused by the Zn anode, the cycled capacity of the Zn anodes was kept to less than ½ of the capacity of the cathodes. 2 × 3 in (5.08 × 7.62 cm) cells were fabricated with two commercially purchased sintered nickel (SiNi, Ni(OH)2, Highstar) cathodes and one hand cast Zn anode. Industrial zinc anodes typically utilize ≤10% of the theoretical Zn to achieve high ≥1000 cycle life2 but here Zn anodes were cycled at 50% utilization whose capacity would have been higher than the SiNi cathodes. The areal loading of Zn is scaled down by a factor of four to keep it in line with 2 SiNi without needing to increase cathode thickness/capacity. MnO2 electrodes (80 wt% electrolytic manganese dioxide (EMD), 16 wt% graphite and 4 wt% Teflon, UEP) were also cycled as received.Various metallic Zn (99.9+%, ∼75 μm diameter, 100 ppm bismuth, 200 ppm indium, Umicore) mixtures with increasing CaZn based off the standard Zn anode are shown in Table 2 and cycled. The total molar Zn content was kept the same in each composition, providing the same anode capacity to each cell and making it easier to compare cell performance. Different additives were also tested such as bismuth(III) oxide (Bi2O3, 10 μm powder, 99.9% with trace metals basis, Sigma Aldrich), cetyltrimethylammonium Bromide (CTAB, ≥98%, Fisher Sci.), and 50% compressed acetylene carbon black (Sigma Aldrich).
Name (Zn wt%![[thin space (1/6-em)]](https://www.rsc.org/images/entities/char_2009.gif) : :![[thin space (1/6-em)]](https://www.rsc.org/images/entities/char_2009.gif) CaZn wt% CaZn wt%![[thin space (1/6-em)]](https://www.rsc.org/images/entities/char_2009.gif) : :![[thin space (1/6-em)]](https://www.rsc.org/images/entities/char_2009.gif) additives) additives) |
Total mass (g) | Zn metal (g) | CaZn (g) | Anode composition (remaining balance PTFE binder) (wt%) | Theoretical capacity (A h) | Theoretical specific capacity (mA h g−1) | Experimental anode pressed thickness ±10% (mm) | Theoretical anode mass loading (g cm−2) | Theoretical areal capacity (mA h cm−2) | Theoretical volumetric capacity (mA h cm−3) | Theoretical anode material slurry cost ($ kg−1) |
|---|---|---|---|---|---|---|---|---|---|---|---|
96![[thin space (1/6-em)]](https://www.rsc.org/images/entities/char_2009.gif) : :![[thin space (1/6-em)]](https://www.rsc.org/images/entities/char_2009.gif) 0 0![[thin space (1/6-em)]](https://www.rsc.org/images/entities/char_2009.gif) : :![[thin space (1/6-em)]](https://www.rsc.org/images/entities/char_2009.gif) none none |
2.35 | 2.26 | 0 | 96% Zn | 1.85 | 787.2 | — | 0.06 | 47.8 | — | 10.1 |
86![[thin space (1/6-em)]](https://www.rsc.org/images/entities/char_2009.gif) : :![[thin space (1/6-em)]](https://www.rsc.org/images/entities/char_2009.gif) 0 0![[thin space (1/6-em)]](https://www.rsc.org/images/entities/char_2009.gif) : :![[thin space (1/6-em)]](https://www.rsc.org/images/entities/char_2009.gif) Bi Bi |
2.63 | 2.26 | 0 | 86% Zn, 10% Bi2O3 | 1.85 | 703.4 | 0.23 | 0.07 | 47.8 | 2077.9 | 12.3 |
60![[thin space (1/6-em)]](https://www.rsc.org/images/entities/char_2009.gif) : :![[thin space (1/6-em)]](https://www.rsc.org/images/entities/char_2009.gif) 26 26![[thin space (1/6-em)]](https://www.rsc.org/images/entities/char_2009.gif) : :![[thin space (1/6-em)]](https://www.rsc.org/images/entities/char_2009.gif) Bi Bi |
3.18 | 1.91 | 0.8 | 60% Zn, 26% CaZn 10% Bi2O3 | 1.85 | 581.8 | 0.41 | 0.08 | 47.8 | 1165.7 | 12.9 |
26![[thin space (1/6-em)]](https://www.rsc.org/images/entities/char_2009.gif) : :![[thin space (1/6-em)]](https://www.rsc.org/images/entities/char_2009.gif) 60 60![[thin space (1/6-em)]](https://www.rsc.org/images/entities/char_2009.gif) : :![[thin space (1/6-em)]](https://www.rsc.org/images/entities/char_2009.gif) Bi Bi |
4.39 | 1.14 | 2.6 | 26% Zn, 60% CaZn 10% Bi2O3 | 1.85 | 421.4 | 0.68 | 0.11 | 47.8 | 702.8 | 14.3 |
0![[thin space (1/6-em)]](https://www.rsc.org/images/entities/char_2009.gif) : :![[thin space (1/6-em)]](https://www.rsc.org/images/entities/char_2009.gif) 86 86![[thin space (1/6-em)]](https://www.rsc.org/images/entities/char_2009.gif) : :![[thin space (1/6-em)]](https://www.rsc.org/images/entities/char_2009.gif) Bi Bi |
6.20 | 0 | 5.3 | 86% CaZn, 10% Bi2O3 | 1.85 | 298.4 | 0.84 | 0.16 | 47.8 | 568.9 | 16.4 |
0![[thin space (1/6-em)]](https://www.rsc.org/images/entities/char_2009.gif) : :![[thin space (1/6-em)]](https://www.rsc.org/images/entities/char_2009.gif) 86 86![[thin space (1/6-em)]](https://www.rsc.org/images/entities/char_2009.gif) : :![[thin space (1/6-em)]](https://www.rsc.org/images/entities/char_2009.gif) C C |
6.20 | 0 | 5.3 | 86% CaZn, 10% carbon | 1.85 | 298.4 | 1.06 | 0.16 | 47.8 | 450.9 | 13.3 |
0![[thin space (1/6-em)]](https://www.rsc.org/images/entities/char_2009.gif) : :![[thin space (1/6-em)]](https://www.rsc.org/images/entities/char_2009.gif) 86 86![[thin space (1/6-em)]](https://www.rsc.org/images/entities/char_2009.gif) : :![[thin space (1/6-em)]](https://www.rsc.org/images/entities/char_2009.gif) C C![[thin space (1/6-em)]](https://www.rsc.org/images/entities/char_2009.gif) : :![[thin space (1/6-em)]](https://www.rsc.org/images/entities/char_2009.gif) CTAB CTAB |
6.20 | 0 | 5.3 | 86% CaZn, 9% carbon, 2% CTAB | 1.85 | 298.4 | 1.14 | 0.16 | 47.8 | 419.2 | 12.9 |
Single batch anode mixes were made by weighing components, stirring with a spatula to combine, and working it into a hydrated paste using isopropanol (70%, Fisher Sci). The anode paste was then cast evenly with a spatula onto both sides of a 2 × 3 in expanded copper mesh current collector (0.254 μm thick) that had a nickel tab welded on the top left as shown in Fig. S2 (ESI†). The anodes were dried overnight at room temperature before being heat sealed in one layer of Pellon (Freudenberg) to help with anode wetting. The wrapped 2 × 3 in electrodes are then pressed at 30 PSIG (206 kPa). Other anodes were also manufactured by feeding a larger batch of the anode paste mixture through calendaring rollers to form sheets of relatively uniform thickness. These sheets were dried, then cut to 2 × 3 in rectangles, with cooresponding mass loadings, that two sheets were pressed onto each side of the current collector as previously mentioned.
Sintered nickel (SiNi) cathodes were cut to 2 by 3 in (5.08 × 7.62 cm) rectangles with a nickel tab welded on. Some of the tests used SiNi “as received” (in the discharged state) against majority to pure CaZn anodes. Other tests with pure Zn or majority Zn anodes required the SiNi cathodes to be formed up (pre-charged) externally before being used or the charge in balance would prevent good cyclability. For the tests that required formed up SiNi, SiNi was charged up in a symmetric cell with 30 wt% KOH, to 0.65 V vs. Hg∣HgO electrode, then washed and soaked with DI water for a few hours before drying overnight in an oven. When used in cells with a Zn or CaZn anode, two of the SiNi cathodes were used together, wrapped in a U fold by three layers of cellophane, with the anode sandwiched between the two SiNi as in Fig. S3a (ESI†). The SiNi tabs for both nickel cathodes were welded together.
2.3 Cell fabrication
All cells used industrially relevant geometry of a prismatic cell with tightly packed electrode stacks and minimal electrolyte to solids volume ratio. Cell design is shown schematically in Fig. S3a (ESI†), and consisted of two large rectangular plates of poly(methyl methacrylate) (PMMA) that sandwiched a Buna-N rubber gasket (40A Shore, McMaster Carr). The thickness of the rubber gasket was chosen to be slightly thicker than the final average compressed cell pack thickness to provide proper pressure when the PMMA sheets were tightened with screws and washers.An ∼3 in (7.62 cm) epoxy coated Zn wire with only the Zn tip exposed to electrolyte served as a reference electrode, sometimes double-checked with Hg∣HgO electrode. The top of each cell was completely sealed with epoxy around the nickel tabs, zinc reference wire, and a 1 in (2.54 cm) long (14-gauge, 304 stainless steel tip) polypropylene plastic syringe allowing for the addition of electrolyte or venting as shown in Fig. S3b (ESI†). Approximately 6–8 mL of 20 wt% KOH electrolyte without any dissolved ZnO was used to fill the cells, ¼ in (0.635 cm) above the separator, and placed under vacuum 2–3 times to assist in fully soaking and removing air pockets in the porous electrodes.
2.4 Cell cycling
Filled cells were cycled at room temperature using an Arbin BT-2000 48-channel battery tester. There are two ways to calculate the theoretical capacity of CaZn, (1) based on the theoretical capacity of 347 mA h g−1![[thin space (1/6-em)]](https://www.rsc.org/images/entities/char_2009.gif) 34,35 given in the literature and (2) based on the theoretical amount of Zn present and using its theoretical capacity of 820 mA h g−1. In a typical pure CaZn anode there is approximately 6.2 g of anode material pasted onto the copper current collector, 86 wt% or 5.33 g of which is the active material CaZn. Based on the two ways to calculate the theoretical capacity of the anode (1) 5.33 g CaZn * 0.347 A h g−1 = 1.85 A h g−1 or indirectly using the theoretical mols of Zn (2) 5.33 g CaZn/308.91 g mol−1 CaZn * (2 mol Zn/1 mol CaZn) * 65.38 g mol−1 * 0.82 A h g−1 = 1.85 A h g−1.
34,35 given in the literature and (2) based on the theoretical amount of Zn present and using its theoretical capacity of 820 mA h g−1. In a typical pure CaZn anode there is approximately 6.2 g of anode material pasted onto the copper current collector, 86 wt% or 5.33 g of which is the active material CaZn. Based on the two ways to calculate the theoretical capacity of the anode (1) 5.33 g CaZn * 0.347 A h g−1 = 1.85 A h g−1 or indirectly using the theoretical mols of Zn (2) 5.33 g CaZn/308.91 g mol−1 CaZn * (2 mol Zn/1 mol CaZn) * 65.38 g mol−1 * 0.82 A h g−1 = 1.85 A h g−1.
Each cell was slightly pre-charged with a 10-mA constant current charge for 8 hours to allow the cell to soak and equalibriate while preventing self-discharge. During cycling, cells were charged to 50% of the theoretical Zn capacity with a 2.5% overcharge at a constant current within voltage range limits of 1.2 to 1.98 V and continued at constant voltage of 1.98 V until the set capacity is achieved before constant current discharging. Discharge proceeded until 1.2 V limit was hit or 50% of the Zn theoretical capacity was discharged. Over time due to natural evaporation or excessive hydrogen gas evolution, when electrolyte levels dropped in the cells, they would be topped off with ∼1 mL of fresh 20 wt% KOH. Cells were considered failed after they could not discharge more than 70% of the initially set 50% theoretical Zn capacity for more than 20 cycles in a row without recovering. After cycling, cells were taken apart and the anodes were rinsed and soaked in DI water overnight, before being dried at 50 °C overnight to be dissected and characterized.
2.5 SEM cross sectional analysis and SEM-FIB EDS
Scanning electron microscopy (SEM) was acquired on a Zeiss Supra 55-VP field emission SEM at accelerating voltages of 5–10 kV. Samples were mounted onto an aluminum SEM pin stub with conductive carbon tape and sputter coated with gold (Ag) coating, a conductive layer to improve conductivity and reduce charging. SEM cross sectional images were acquired on a FEI Helios Nanolab 660 FIB-SEM equipped with an Oxford EDX detector for Energy dispersive X-ray spectroscopy (EDS) using a cross section aluminum SEM sample holder. SEM focused ion beam (FIB) was performed on a ThermoFisher Helios NanoLab 600. Protective layers of electron beam deposited carbon (∼200 nm) and ion beam deposited carbon (∼1 μm) were applied before FIB milling. EDS data were collected with an Oxford X-Max 80 mm2 EDS detector.2.6 X-ray diffraction
X-ray diffraction (XRD) was obtained using a PANanalytical X’Pert Pro Powder Diffraction machine using a CuKα filter operating at 40 KV and 40 mA. XRD was used to characterize the starting and finishing anode materials to understand what chemical species formed after cycling.3. Results and discussion
3.1 Calcium zincate characterization
SEM imaging and XRD analysis of the as-synthesized calcium zincate (Ca[Zn(OH)3]2·2H2O, CaZn) crystals are shown in Fig. 1a and b, respectively. These tetragonal CaZn crystals, which ranged from 10–40 μm in diameter, matched the same morphology in literature20 and were used throughout all anode compositions. The XRD peaks of CaZn shown in Fig. 1b matches up with other CaZn XRD peaks in the literature and confirms that both the starting reagents ZnO and CaOH2 have been fully reacted and/or washed away.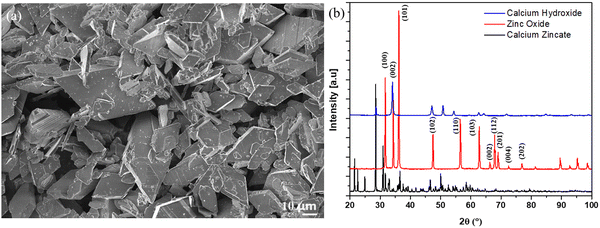 | ||
| Fig. 1 (a) SEM image of as-synthesized tetragonal calcium zincate crystals (b) XRD spectra of as-synthesized CaZn and its starting materials zinc oxide and calcium hydroxide. | ||
3.2 Cycling CaZn at 20% Zn utilization
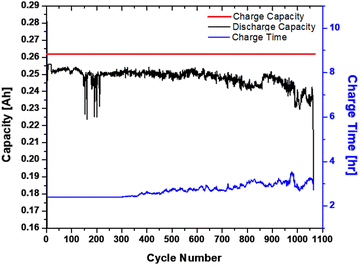
Initial testing was done using a ∼1.28 A h CaZn cell comprising 86 wt% CaZn, 10 wt% acetylene carbon black, and 4 wt% PTFE in ZnO saturated 20 wt% KOH and its performance data is shown in Fig. 2. These results show that pure CaZn can sustain fast C/(2.5 h) charge/discharge rate with a capacity near 70 mA h g−1 for hundreds of cycles which is in line with the 20% of the theoretical capacity of CaZn (347 mA h g−1) that was cycled. Coulombic energy efficiency remained above 95% while energy efficiency was over 85% for 1062 cycles. The cycle life is competitive with industrially produced Zn anodes, while cycling at twice of those anode's theoretical capacity (10% to 20%), leading to a reduction in manufacturing and materials costs by doubling the cycled capacity. The internal charge resistance starts increasing slowly and continuously after ∼350 cycles, and after ∼650 cycles it increases faster until cell failure due to inreasing charging time leading to increased H2 gassing, decreased discharge capacity, decreased coulombic, and energy efficiency. The remarkable cycling success of this anode formulation does not come without challenges for industrial manufacturing. Since CaZn is in a discharged state, there is a state-of-charge mismatch between a CaZn anode and a MnO2 cathode, requiring additional factory processing, however this problem does not exist for a battery made with SiNi cathodes.3.3 Cycling performance of Zn anodes with increasing CaZn
A systematic study was designed to elucidate the effect of CaZn in Zn anodes, where Zn anodes with increasing amounts of CaZn as an additive were fabricated as summarized in Table 2. The total molar amount of Zn was kept the same in each anode composition with varying ratios of Zn to CaZn so that the capacity remained constant. Due to differences in both density and theoretical capacity of Zn vs. CaZn, as you increased the amount of CaZn in the anodes you also increased the overall thickness of the anode. All cells were all cycled at high 50% theoretical Zn utilization with the same SiNi counter electrodes. 50% Compressed acetylene carbon black and cetyltrimethylammonium bromide (CTAB) were also explored as supplementary additives to CaZn to see if they could be more cost effective than bismuth oxide and help with cyclability of the cells.The cost to manufacture tetragonal calcium zincate powders at scale was roughly estimated by scaling up the base recipe and some additional assumptions summarized in Table S1 (ESI†). As you increase the wt% of CaZn in the anodes, the mass loading of the active materials are increased to keep the molar amount of Zn constant. As you increase the amount of CaZn, you decrease the theoretical volumetric capacity by a factor of five less when going from pure Zn to pure CaZn anode both with Bi2O3 while increasing the anode material slurry costs by roughly 30%.
Majority Zn (60![[thin space (1/6-em)]](https://www.rsc.org/images/entities/char_2009.gif) :
:![[thin space (1/6-em)]](https://www.rsc.org/images/entities/char_2009.gif) 26
26![[thin space (1/6-em)]](https://www.rsc.org/images/entities/char_2009.gif) :
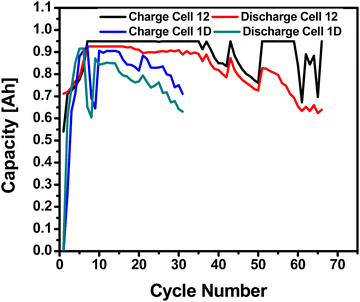
:![[thin space (1/6-em)]](https://www.rsc.org/images/entities/char_2009.gif) Bi) anodes were cycled vs. both SiNi and MnO2 shown in Fig. 3. When cycled at C/3 vs. SiNi, the majority Zn anodes achieved an average of ∼62 cycles over three replicates and vs. MnO2 at C/9 showed 31 cycles due to the slower charge/discharge rate. It has been shown that the charge/discharge capacity of CaZn decreases as you decrease the C rate.27 As expected from extrapolations of Zn metal anode data from D’Ambrose et al.9 to a 50% Zn utilization, the cycle life is much lower than from the 86 wt% CaZn anode cycled at 20% Zn utilization. This anode formulation is easier to “drop in” to common Zn–MnO2 industrial designs because of (a) matched initial state-of-charge between Zn and EMD MnO2, and (b) similar Zn powder anode material compatibility with existing paste calendaring processes. However, a Zn–SiNi battery would have a state-of-charge mismatch with this formulation because sintered nickel cathodes are made of nickel hydroxide (Ni(OH)2) which are initially in a discharged state.
Bi) anodes were cycled vs. both SiNi and MnO2 shown in Fig. 3. When cycled at C/3 vs. SiNi, the majority Zn anodes achieved an average of ∼62 cycles over three replicates and vs. MnO2 at C/9 showed 31 cycles due to the slower charge/discharge rate. It has been shown that the charge/discharge capacity of CaZn decreases as you decrease the C rate.27 As expected from extrapolations of Zn metal anode data from D’Ambrose et al.9 to a 50% Zn utilization, the cycle life is much lower than from the 86 wt% CaZn anode cycled at 20% Zn utilization. This anode formulation is easier to “drop in” to common Zn–MnO2 industrial designs because of (a) matched initial state-of-charge between Zn and EMD MnO2, and (b) similar Zn powder anode material compatibility with existing paste calendaring processes. However, a Zn–SiNi battery would have a state-of-charge mismatch with this formulation because sintered nickel cathodes are made of nickel hydroxide (Ni(OH)2) which are initially in a discharged state.
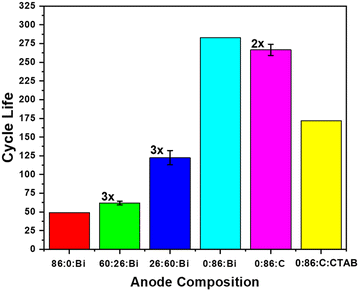
Overall cycle life performance of the anodes with the inclusion of CaZn correlated strongly with amount of CaZn in the anode formulation, as shown in Fig. 4. A linear increase in the amount of CaZn in the anodes results in an exponential increase in the cycle life. The best preforming cells were both pure CaZn anodes, achieving roughly 283 cycles with bismuth oxide (0![[thin space (1/6-em)]](https://www.rsc.org/images/entities/char_2009.gif) :
:![[thin space (1/6-em)]](https://www.rsc.org/images/entities/char_2009.gif) 86
86![[thin space (1/6-em)]](https://www.rsc.org/images/entities/char_2009.gif) :
:![[thin space (1/6-em)]](https://www.rsc.org/images/entities/char_2009.gif) Bi) and average of 267 cycles with acetylene carbon black (0
Bi) and average of 267 cycles with acetylene carbon black (0![[thin space (1/6-em)]](https://www.rsc.org/images/entities/char_2009.gif) :
:![[thin space (1/6-em)]](https://www.rsc.org/images/entities/char_2009.gif) 86
86![[thin space (1/6-em)]](https://www.rsc.org/images/entities/char_2009.gif) :
:![[thin space (1/6-em)]](https://www.rsc.org/images/entities/char_2009.gif) C). The improvement in cycle life between the bismuth oxide (0
C). The improvement in cycle life between the bismuth oxide (0![[thin space (1/6-em)]](https://www.rsc.org/images/entities/char_2009.gif) :
:![[thin space (1/6-em)]](https://www.rsc.org/images/entities/char_2009.gif) 86
86![[thin space (1/6-em)]](https://www.rsc.org/images/entities/char_2009.gif) :
:![[thin space (1/6-em)]](https://www.rsc.org/images/entities/char_2009.gif) Bi) and acetylene carbon black (0
Bi) and acetylene carbon black (0![[thin space (1/6-em)]](https://www.rsc.org/images/entities/char_2009.gif) :
:![[thin space (1/6-em)]](https://www.rsc.org/images/entities/char_2009.gif) 86
86![[thin space (1/6-em)]](https://www.rsc.org/images/entities/char_2009.gif) :
:![[thin space (1/6-em)]](https://www.rsc.org/images/entities/char_2009.gif) C) can be assigned to the conductive pathways formed when bismuth oxide is reduced to bismuth metal and reduced H2 gassing. The addition of CTAB surfactant (0
C) can be assigned to the conductive pathways formed when bismuth oxide is reduced to bismuth metal and reduced H2 gassing. The addition of CTAB surfactant (0![[thin space (1/6-em)]](https://www.rsc.org/images/entities/char_2009.gif) :
:![[thin space (1/6-em)]](https://www.rsc.org/images/entities/char_2009.gif) 86
86![[thin space (1/6-em)]](https://www.rsc.org/images/entities/char_2009.gif) :
:![[thin space (1/6-em)]](https://www.rsc.org/images/entities/char_2009.gif) C
C![[thin space (1/6-em)]](https://www.rsc.org/images/entities/char_2009.gif) :
:![[thin space (1/6-em)]](https://www.rsc.org/images/entities/char_2009.gif) CTAB) when cycled in 20 wt% KOH at 50% Zn utilization showed a decrease in the cycle life of the pure calcium zincate anodes correlating with findings from D’Ambrose et al.10 There, authors cycled ZnO with additives of (1) CTAB, (2) CTAB, Bi2O3, and LAPONITE®, (3) Ca(OH)2, CTAB, Bi2O3, and LAPONITE® at 15% Zn utilization and showed that at lower KOH concentrations, CTAB helped with cycle life and mass retention. This suggests the possibility that with lower ∼10 wt% KOH, we could see improvements in the cycle life of CaZn with CTAB.
CTAB) when cycled in 20 wt% KOH at 50% Zn utilization showed a decrease in the cycle life of the pure calcium zincate anodes correlating with findings from D’Ambrose et al.10 There, authors cycled ZnO with additives of (1) CTAB, (2) CTAB, Bi2O3, and LAPONITE®, (3) Ca(OH)2, CTAB, Bi2O3, and LAPONITE® at 15% Zn utilization and showed that at lower KOH concentrations, CTAB helped with cycle life and mass retention. This suggests the possibility that with lower ∼10 wt% KOH, we could see improvements in the cycle life of CaZn with CTAB.
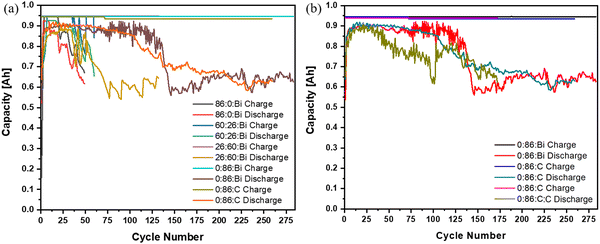
Looking at the charge/discharge capacity of each anode formulation over their cycle life, there is a characteristic capacity drop in discharge capacity from ∼90+% to ∼70% for all anode compositions as seen in (Fig. 5). Anode formulations with Bi2O3 show a drop in coloumbic and energy efficiency over 10–30 cycles while the acetylene carbon black anode shows a more gradual decrease over ∼100 cycles. This could be due to differences in particle size and density of acetylene carbon vs. Bi2O3, where carbon is smaller and less dense, therefore increasing the total volume in comparison as seen in Fig. S1 (ESI†). These differences can lead towards better dispersion of material during mixing and therefore increased number of conductive channels throughout the anode leading to a slower failure when shape change occurs and conductivity is reduced. The different anode compositions need to be compared, not only with their overall cycle life, but also the cost of their anode slurry materials. An important way to compare the overall performance of the cells comes down to the cost per kilowatt hour per cycle life ($ kg−1 kW−1 h−1 per cycle life). It can be seen in Table 3 that even with the increased raw material cost of the CaZn based anode materials, after you consider the cycle life there is a substantial decrease in cost. A pure Zn anode paste material is estimated to costs around $0.016 per kg per discharge energy per cycle while the pure CaZn anode paste materials lowers the cost down to around $0.012 per cycle, around 25% reduction of the cost, showing a decrease in cost per cycle with increasing CaZn. Achieving more cycles out of an anode also helps save on other costs like the cathode, separators, and human labor to build more cells to achieve the same number of cycles needed for a battery installation.
Name (Zn![[thin space (1/6-em)]](https://www.rsc.org/images/entities/char_2009.gif) : :![[thin space (1/6-em)]](https://www.rsc.org/images/entities/char_2009.gif) CaZn wt% CaZn wt%![[thin space (1/6-em)]](https://www.rsc.org/images/entities/char_2009.gif) : :![[thin space (1/6-em)]](https://www.rsc.org/images/entities/char_2009.gif) additives) additives) |
Total mass (g) | Anode composition (remaining balance PTFE binder) (wt%) | 50% Utilized theoretical capacity (A h) | 50% Utilized specific capacity (mA h g−1) | 50% Utilized anode areal capacity (mA h cm−2) | 50% Utilized anode volumetric capacity (mA h cm−3) | 50% Utilized average cycle life (70% capacity retention) | Experimental anode slurry cost of discharge energy ($ kg−1 kW−1 h−1/cycle life) not including current collector |
|---|---|---|---|---|---|---|---|---|
86![[thin space (1/6-em)]](https://www.rsc.org/images/entities/char_2009.gif) : :![[thin space (1/6-em)]](https://www.rsc.org/images/entities/char_2009.gif) 0 0![[thin space (1/6-em)]](https://www.rsc.org/images/entities/char_2009.gif) : :![[thin space (1/6-em)]](https://www.rsc.org/images/entities/char_2009.gif) Bi Bi |
2.63 | 86% Zn, 10% Bi2O3 | 0.925 | 351.7 | 23.9 | 1039.0 | 49 | 0.0164 |
60![[thin space (1/6-em)]](https://www.rsc.org/images/entities/char_2009.gif) : :![[thin space (1/6-em)]](https://www.rsc.org/images/entities/char_2009.gif) 26 26![[thin space (1/6-em)]](https://www.rsc.org/images/entities/char_2009.gif) : :![[thin space (1/6-em)]](https://www.rsc.org/images/entities/char_2009.gif) Bi Bi |
3.18 | 60% Zn, 26% CaZn 10% Bi2O3 | 0.925 | 290.9 | 23.9 | 582.8 | 62 | 0.096 |
26![[thin space (1/6-em)]](https://www.rsc.org/images/entities/char_2009.gif) : :![[thin space (1/6-em)]](https://www.rsc.org/images/entities/char_2009.gif) 60 60![[thin space (1/6-em)]](https://www.rsc.org/images/entities/char_2009.gif) : :![[thin space (1/6-em)]](https://www.rsc.org/images/entities/char_2009.gif) Bi Bi |
4.39 | 26% Zn, 60% CaZn 10% Bi2O3 | 0.925 | 210.7 | 23.9 | 351.4 | 123 | 0.0119 |
0![[thin space (1/6-em)]](https://www.rsc.org/images/entities/char_2009.gif) : :![[thin space (1/6-em)]](https://www.rsc.org/images/entities/char_2009.gif) 86 86![[thin space (1/6-em)]](https://www.rsc.org/images/entities/char_2009.gif) : :![[thin space (1/6-em)]](https://www.rsc.org/images/entities/char_2009.gif) Bi Bi |
6.2 | 86% CaZn, 10% Bi2O3 | 0.925 | 149.2 | 23.9 | 284.5 | 283 | 0.0121 |
0![[thin space (1/6-em)]](https://www.rsc.org/images/entities/char_2009.gif) : :![[thin space (1/6-em)]](https://www.rsc.org/images/entities/char_2009.gif) 86 86![[thin space (1/6-em)]](https://www.rsc.org/images/entities/char_2009.gif) : :![[thin space (1/6-em)]](https://www.rsc.org/images/entities/char_2009.gif) C C |
6.2 | 86% CaZn, 10% carbon | 0.925 | 149.2 | 23.9 | 225.4 | 267 | 0.0149 |
0![[thin space (1/6-em)]](https://www.rsc.org/images/entities/char_2009.gif) : :![[thin space (1/6-em)]](https://www.rsc.org/images/entities/char_2009.gif) 86 86![[thin space (1/6-em)]](https://www.rsc.org/images/entities/char_2009.gif) : :![[thin space (1/6-em)]](https://www.rsc.org/images/entities/char_2009.gif) C C![[thin space (1/6-em)]](https://www.rsc.org/images/entities/char_2009.gif) : :![[thin space (1/6-em)]](https://www.rsc.org/images/entities/char_2009.gif) CTAB CTAB |
6.2 | 86% CaZn, 9% carbon, 2% CTAB | 0.925 | 149.2 | 23.9 | 209.6 | 172 | 0.0109 |
3.4 Majority Zn (60![[thin space (1/6-em)]](https://www.rsc.org/images/entities/h3_char_2009.gif) :
:![[thin space (1/6-em)]](https://www.rsc.org/images/entities/h3_char_2009.gif) 26
26![[thin space (1/6-em)]](https://www.rsc.org/images/entities/h3_char_2009.gif) :
:![[thin space (1/6-em)]](https://www.rsc.org/images/entities/h3_char_2009.gif) Bi) postmortem analysis
Bi) postmortem analysis
Postmortem analysis was done on the majority Zn (60![[thin space (1/6-em)]](https://www.rsc.org/images/entities/char_2009.gif) :
:![[thin space (1/6-em)]](https://www.rsc.org/images/entities/char_2009.gif) 26
26![[thin space (1/6-em)]](https://www.rsc.org/images/entities/char_2009.gif) :
:![[thin space (1/6-em)]](https://www.rsc.org/images/entities/char_2009.gif) Bi) anodes after bring removed anodes after washed, soaked, and dried; optical images of are shown in Fig. 6a. After cycling the anode there is a large and unevenly distributed unknown white layer that has grown on the surface outside of the Pellon, not previously seen before in the fresh anode Fig. S4a (ESI†). Using XRD, the chemical composition of the newly formed white surface layer can be confirmed as ZnO as shown in the XRD patterns in Fig. 7. The white surface layer shows very strong and pure ZnO peaks while the rest of the cycled zinc shows a combination of ZnO and other peaks. The formation of the dense non-electroactive ZnO layer is one explanation why there is a loss in both coulombic and energy efficiency over time leading to discharge capacity loss and eventual battery failure.
Bi) anodes after bring removed anodes after washed, soaked, and dried; optical images of are shown in Fig. 6a. After cycling the anode there is a large and unevenly distributed unknown white layer that has grown on the surface outside of the Pellon, not previously seen before in the fresh anode Fig. S4a (ESI†). Using XRD, the chemical composition of the newly formed white surface layer can be confirmed as ZnO as shown in the XRD patterns in Fig. 7. The white surface layer shows very strong and pure ZnO peaks while the rest of the cycled zinc shows a combination of ZnO and other peaks. The formation of the dense non-electroactive ZnO layer is one explanation why there is a loss in both coulombic and energy efficiency over time leading to discharge capacity loss and eventual battery failure.
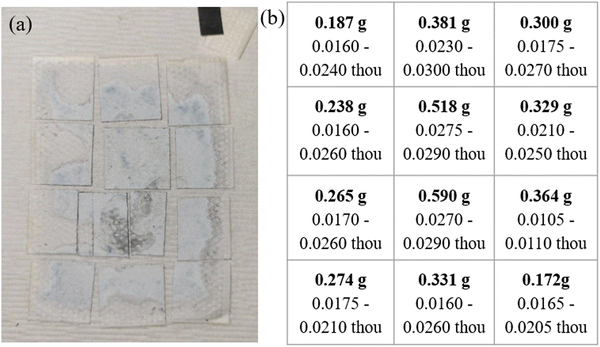 | ||
Fig. 6 (a) Optical image of cycled Cell #12 – majority Zn (60![[thin space (1/6-em)]](https://www.rsc.org/images/entities/char_2009.gif) : :![[thin space (1/6-em)]](https://www.rsc.org/images/entities/char_2009.gif) 26 26![[thin space (1/6-em)]](https://www.rsc.org/images/entities/char_2009.gif) : :![[thin space (1/6-em)]](https://www.rsc.org/images/entities/char_2009.gif) Bi) vs. sintered nickel cathodes (b) table showing the weight and thickness of the sample dissected after cycling. Bi) vs. sintered nickel cathodes (b) table showing the weight and thickness of the sample dissected after cycling. | ||
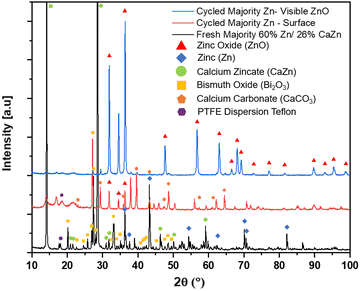 | ||
Fig. 7 XRD patterns of freshly rolled majority Zn anode (60![[thin space (1/6-em)]](https://www.rsc.org/images/entities/char_2009.gif) : :![[thin space (1/6-em)]](https://www.rsc.org/images/entities/char_2009.gif) 26 26![[thin space (1/6-em)]](https://www.rsc.org/images/entities/char_2009.gif) : :![[thin space (1/6-em)]](https://www.rsc.org/images/entities/char_2009.gif) Bi), cycled Cell #12 majority Zn (60 Bi), cycled Cell #12 majority Zn (60![[thin space (1/6-em)]](https://www.rsc.org/images/entities/char_2009.gif) : :![[thin space (1/6-em)]](https://www.rsc.org/images/entities/char_2009.gif) 26 26![[thin space (1/6-em)]](https://www.rsc.org/images/entities/char_2009.gif) : :![[thin space (1/6-em)]](https://www.rsc.org/images/entities/char_2009.gif) Bi) anode surface, and cycled Cell #12 majority Zn (60 Bi) anode surface, and cycled Cell #12 majority Zn (60![[thin space (1/6-em)]](https://www.rsc.org/images/entities/char_2009.gif) : :![[thin space (1/6-em)]](https://www.rsc.org/images/entities/char_2009.gif) 26 26![[thin space (1/6-em)]](https://www.rsc.org/images/entities/char_2009.gif) : :![[thin space (1/6-em)]](https://www.rsc.org/images/entities/char_2009.gif) Bi) anode with visible ZnO. Bi) anode with visible ZnO. | ||
Unlike other traditional Zn based cells, there is very little visible mossy/dendritic zinc that is formed on the outside or bottom of the cell causing lost capacity. Dissecting the anode into 12 equal pieces to be weighed and thickness measured shows shape change occurred, mainly an increase in mass and thickness of the middle and a loss at the edges when comparing the fresh Fig. S4b (ESI†) vs. cycled Fig. 6b anodes. Cross-sectional SEM-EDS was done on a sample from the center of Cell #12 majority Zn (60![[thin space (1/6-em)]](https://www.rsc.org/images/entities/char_2009.gif) :
:![[thin space (1/6-em)]](https://www.rsc.org/images/entities/char_2009.gif) 26
26![[thin space (1/6-em)]](https://www.rsc.org/images/entities/char_2009.gif) :
:![[thin space (1/6-em)]](https://www.rsc.org/images/entities/char_2009.gif) Bi) as shown in Fig. 8 (Fig. S13, ESI†). In EDS there is elemental Zn and Ca segregation occurring throughout the anode, suggesting sections of pure Zn or ZnO, others of Ca, and where the Zn and Ca maps overlap CaZn. The initial large Zn powder used, 50–150 μm diameter Fig. S8 and S9 (ESI†), may be a contributing factor to encourage Zn to remain poorly dispersed in the anode.
Bi) as shown in Fig. 8 (Fig. S13, ESI†). In EDS there is elemental Zn and Ca segregation occurring throughout the anode, suggesting sections of pure Zn or ZnO, others of Ca, and where the Zn and Ca maps overlap CaZn. The initial large Zn powder used, 50–150 μm diameter Fig. S8 and S9 (ESI†), may be a contributing factor to encourage Zn to remain poorly dispersed in the anode.
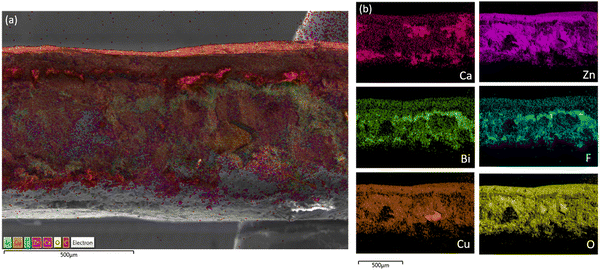 | ||
Fig. 8 (a) Cross-sectional SEM-EDS elemental mapping of cycled Cell #12 – majority Zn (60![[thin space (1/6-em)]](https://www.rsc.org/images/entities/char_2009.gif) : :![[thin space (1/6-em)]](https://www.rsc.org/images/entities/char_2009.gif) 26 26![[thin space (1/6-em)]](https://www.rsc.org/images/entities/char_2009.gif) : :![[thin space (1/6-em)]](https://www.rsc.org/images/entities/char_2009.gif) Bi) vs. sintered nickel cathodes (b) individual SEM-EDS elemental mapping. Bi) vs. sintered nickel cathodes (b) individual SEM-EDS elemental mapping. | ||
The large boulders of metallic Zn are stripped during cell discharge and during re-plating there is migration of the zincate (Zn(OH)4−) to more conductive/favorable places such as the copper current collector and other pockets of conductive Zn. Over time, the initial Zn can not be seen anymore in SEM but EDS shows that the Zn has been localized, suggesting that the initial Zn did not move very far. The local conductivity of a section of the anode depends on the amount of metallic Zn and conductive additives like bismuth or carbon since the discharge products of Ca and CaZn are not conductive. The agglomeration of Zn rich areas and separate Ca rich areas makes it difficult for CaZn to reform on discharged since it will need to scavenge for the Zn leading to incomplete reformation and most likely some formation of ZnO. Calcium can be seen in large noncontinuous clusters while bismuth is still attached to the PTFE binder, and both are being pushed towards the surface to make room for Zn movement.
Looking at the surface using SEM-EDS, there are areas with and without clusters of spiky ZnO balls growing out of the Pellon wrapped anode shown in Fig. 9a and 10a respectively which did not exist in the rolled sample Fig. S5 (ESI†) which was evenly mixed to begin with Fig. S6 (ESI†). With further FIB milling followed by SEM-EDS mapping in Fig. 9b, we can see that this area is densely packed with ZnO without any traces of calcium or bismuth. The densely packed ZnO does not have many pores as seen initially in Fig. S7 (ESI†), reducing the overall active surface area, and making it difficult for electrolyte to penetrate and participate in the anode cycling. The lack of a conductive agent like bismuth oxide also prevents the ZnO layer from being electroactive and prevents electrons from traveling through to charge back up to metallic Zn leading to a loss of capacity.
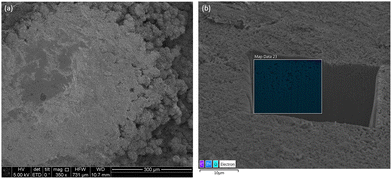 | ||
Fig. 9 (a) Top-down SEM view of cycled Cell #12 – majority Zn (60![[thin space (1/6-em)]](https://www.rsc.org/images/entities/char_2009.gif) : :![[thin space (1/6-em)]](https://www.rsc.org/images/entities/char_2009.gif) 26 26![[thin space (1/6-em)]](https://www.rsc.org/images/entities/char_2009.gif) : :![[thin space (1/6-em)]](https://www.rsc.org/images/entities/char_2009.gif) Bi) vs. sintered nickel cathodes (b) SEM-FIB EDS elemental mapping. Bi) vs. sintered nickel cathodes (b) SEM-FIB EDS elemental mapping. | ||
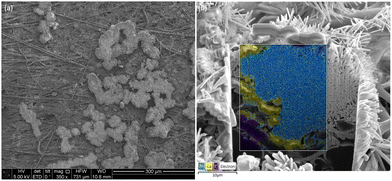 | ||
Fig. 10 (a) Top-down SEM view of cycled Cell #12 majority Zn (60![[thin space (1/6-em)]](https://www.rsc.org/images/entities/char_2009.gif) : :![[thin space (1/6-em)]](https://www.rsc.org/images/entities/char_2009.gif) 26 26![[thin space (1/6-em)]](https://www.rsc.org/images/entities/char_2009.gif) : :![[thin space (1/6-em)]](https://www.rsc.org/images/entities/char_2009.gif) Bi) vs. sintered nickel cathodes (b) SEM-FIB EDS elemental mapping. Bi) vs. sintered nickel cathodes (b) SEM-FIB EDS elemental mapping. | ||
In areas where the ZnO passivation layer is not optically observed, under SEM, in some areas you can still see some small individual spiky ZnO balls on top of the Pellon while in other areas there is nothing visible. Using SEM-EDS mapping of the surface from top down as seen in Fig. 10, you have some spiky ZnO spheres with trace amounts of bismuth and some cubic calcium carbonate (CaCO3) without Zn present which is confirmed by XRD in Fig. 7. With FIB milling of these areas, we can see areas of Zn and Ca segregation during the end of charge which we noticed in the larger cross-sectional EDS mapping of Fig. 8 in contrast to the well mixed initial sample.
3.5 Pure CaZn (0![[thin space (1/6-em)]](https://www.rsc.org/images/entities/h3_char_2009.gif) :
:![[thin space (1/6-em)]](https://www.rsc.org/images/entities/h3_char_2009.gif) 86
86![[thin space (1/6-em)]](https://www.rsc.org/images/entities/h3_char_2009.gif) :
:![[thin space (1/6-em)]](https://www.rsc.org/images/entities/h3_char_2009.gif) Bi) postmortem analysis
Bi) postmortem analysis
Investigating the failure mechanisms of pure CaZn (0![[thin space (1/6-em)]](https://www.rsc.org/images/entities/char_2009.gif) :
:![[thin space (1/6-em)]](https://www.rsc.org/images/entities/char_2009.gif) 86
86![[thin space (1/6-em)]](https://www.rsc.org/images/entities/char_2009.gif) :
:![[thin space (1/6-em)]](https://www.rsc.org/images/entities/char_2009.gif) Bi), visually in Fig. 11a for cycled Cell #7, there is also some white layer that is formed on the outside of the Pellon not seen initially Fig. S10a (ESI†). There is also some shape change that is occurring when you compare a fresh CaZn anode Fig. S10b (ESI†) with the cycled Fig. 11b. There is an increase in anode thickness and mass in the middle of the anode and some loss at the edges, but nowhere near the same amount as the majority zinc cell. Optically this indicates the same kind of failure mechanism as the majority zinc formulation in Fig. 6a, albeit delayed by a few hundred cycles, showing great promise of the reversibility of zinc to CaZn in the early stages of cell cycling.
Bi), visually in Fig. 11a for cycled Cell #7, there is also some white layer that is formed on the outside of the Pellon not seen initially Fig. S10a (ESI†). There is also some shape change that is occurring when you compare a fresh CaZn anode Fig. S10b (ESI†) with the cycled Fig. 11b. There is an increase in anode thickness and mass in the middle of the anode and some loss at the edges, but nowhere near the same amount as the majority zinc cell. Optically this indicates the same kind of failure mechanism as the majority zinc formulation in Fig. 6a, albeit delayed by a few hundred cycles, showing great promise of the reversibility of zinc to CaZn in the early stages of cell cycling.
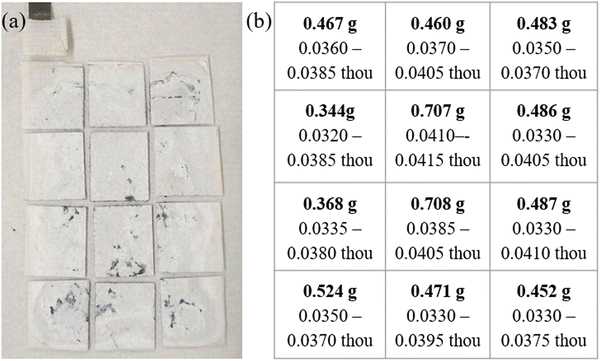 | ||
Fig. 11 (a) Optical image of cycled Cell #7 – pure CaZn anode (0![[thin space (1/6-em)]](https://www.rsc.org/images/entities/char_2009.gif) : :![[thin space (1/6-em)]](https://www.rsc.org/images/entities/char_2009.gif) 86 86![[thin space (1/6-em)]](https://www.rsc.org/images/entities/char_2009.gif) : :![[thin space (1/6-em)]](https://www.rsc.org/images/entities/char_2009.gif) Bi) vs. sintered nickel cathodes (b) table showing the weight and thickness of the samples. Bi) vs. sintered nickel cathodes (b) table showing the weight and thickness of the samples. | ||
Fig. 12 shows the XRD patterns of a fresh CaZn anode CaZn (0![[thin space (1/6-em)]](https://www.rsc.org/images/entities/char_2009.gif) :
:![[thin space (1/6-em)]](https://www.rsc.org/images/entities/char_2009.gif) 86
86![[thin space (1/6-em)]](https://www.rsc.org/images/entities/char_2009.gif) :
:![[thin space (1/6-em)]](https://www.rsc.org/images/entities/char_2009.gif) Bi) compared to Cell #7 after cycling. The XRD confirms once again that the white layer that has formed on the surface of the anode, outside of the Pellon, consists majority of ZnO while the rest of the anode does not show much ZnO at all. Just like the majority zinc cell, the pure CaZn cell does not show much if any mossy zinc falling out into the electrolyte leading to lost Zn or dendrite formation. The anode's edges still lose some thickness and mass which gets replated over time into the center of the electrode as ZnO. The main noticeable difference of the CaZn cell vs. the majority Zn cell is that the overall weight loss from the edges and change in thickness is less drastic in a pure CaZn anode.
Bi) compared to Cell #7 after cycling. The XRD confirms once again that the white layer that has formed on the surface of the anode, outside of the Pellon, consists majority of ZnO while the rest of the anode does not show much ZnO at all. Just like the majority zinc cell, the pure CaZn cell does not show much if any mossy zinc falling out into the electrolyte leading to lost Zn or dendrite formation. The anode's edges still lose some thickness and mass which gets replated over time into the center of the electrode as ZnO. The main noticeable difference of the CaZn cell vs. the majority Zn cell is that the overall weight loss from the edges and change in thickness is less drastic in a pure CaZn anode.
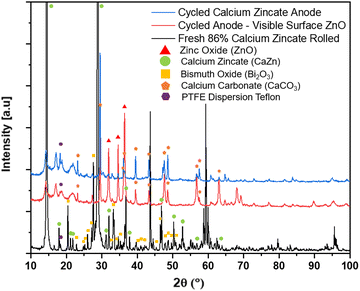 | ||
Fig. 12 XRD patterns of freshly rolled pure CaZn anode (0![[thin space (1/6-em)]](https://www.rsc.org/images/entities/char_2009.gif) : :![[thin space (1/6-em)]](https://www.rsc.org/images/entities/char_2009.gif) 86 86![[thin space (1/6-em)]](https://www.rsc.org/images/entities/char_2009.gif) : :![[thin space (1/6-em)]](https://www.rsc.org/images/entities/char_2009.gif) Bi), cycled Cell #7 CaZn anode (0 Bi), cycled Cell #7 CaZn anode (0![[thin space (1/6-em)]](https://www.rsc.org/images/entities/char_2009.gif) : :![[thin space (1/6-em)]](https://www.rsc.org/images/entities/char_2009.gif) 86 86![[thin space (1/6-em)]](https://www.rsc.org/images/entities/char_2009.gif) : :![[thin space (1/6-em)]](https://www.rsc.org/images/entities/char_2009.gif) Bi) surface, and cycled Cell #12 CaZn anode (0 Bi) surface, and cycled Cell #12 CaZn anode (0![[thin space (1/6-em)]](https://www.rsc.org/images/entities/char_2009.gif) : :![[thin space (1/6-em)]](https://www.rsc.org/images/entities/char_2009.gif) 86 86![[thin space (1/6-em)]](https://www.rsc.org/images/entities/char_2009.gif) : :![[thin space (1/6-em)]](https://www.rsc.org/images/entities/char_2009.gif) Bi) with visible ZnO. Bi) with visible ZnO. | ||
Looking at a cross-sectional SEM-EDS mapping of a piece from the center of Cell #7 as shown in Fig. 13a and b (Fig. S20, ESI†), you can see that there is also segregation beginning to occur between the Ca and Zn. There is a lot more Zn that is agglomerating around the copper current collectors and those areas near the current collector do not have any calcium. Just like in the majority zinc Cell #12, we can see the Zn is getting separated from the Ca by migrating to the current collector and the surface of the anode which will make it harder to reform CaZn during discharge. There is less movement of the bismuth and PTFE binder compared with in the case of majority Zn anode formulation.
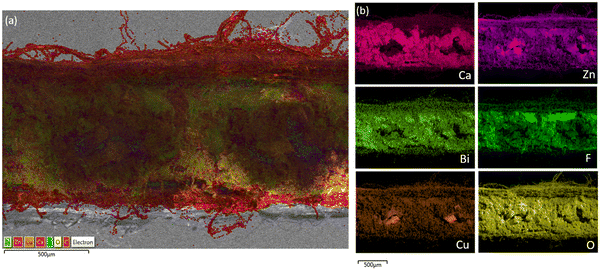 | ||
Fig. 13 (a) Cross-sectional SEM-EDS of cycled Cell #7 – pure CaZn anode (0![[thin space (1/6-em)]](https://www.rsc.org/images/entities/char_2009.gif) : :![[thin space (1/6-em)]](https://www.rsc.org/images/entities/char_2009.gif) 86 86![[thin space (1/6-em)]](https://www.rsc.org/images/entities/char_2009.gif) : :![[thin space (1/6-em)]](https://www.rsc.org/images/entities/char_2009.gif) Bi) vs. sintered nickel cathodes (b) SEM-EDS mapping showing individual elements. Bi) vs. sintered nickel cathodes (b) SEM-EDS mapping showing individual elements. | ||
Looking at the surface with SEM-EDS in Fig. 14a (Fig. S21 and S22, ESI†), there are sections of densely packed Zn in blue and some areas with a large petal flower-like ZnO that show a strong potassium (K) mapping overlapped. This large petal flower-like ZnO is different than the spiky flower-like ZnO that formed on the surface of the majority zinc anode, Cell #12. The dense ZnO areas are also shown to have some amount of bismuth present unlike when we looked at the dense ZnO for the majority zinc Cell #12 which had only ZnO. Further investigating this area under the large petal flower-like ZnO with FIB milling as shown in Fig. 14b (Fig. S23, ESI†), there is segregation of Zn from Ca which could be the reason why more ZnO is forming on the surface since it is more attracted to the Zn than CaZn.
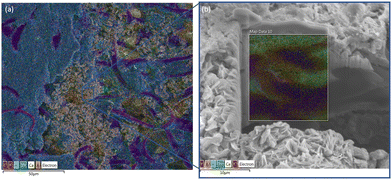 | ||
Fig. 14 (a) Top-down SEM-EDS image of cycled Cell #7– pure CaZn anode (0![[thin space (1/6-em)]](https://www.rsc.org/images/entities/char_2009.gif) : :![[thin space (1/6-em)]](https://www.rsc.org/images/entities/char_2009.gif) 86 86![[thin space (1/6-em)]](https://www.rsc.org/images/entities/char_2009.gif) : :![[thin space (1/6-em)]](https://www.rsc.org/images/entities/char_2009.gif) Bi) vs. sintered nickel cathodes (b) SEM-FIB cutout EDS mapping. Bi) vs. sintered nickel cathodes (b) SEM-FIB cutout EDS mapping. | ||
On some other parts of the surface shown in Fig. 15a (Fig. S24 and S25, ESI†), next to areas of the dense ZnO with bismuth, we can see there are cubic calcium carbonate (CaCO3) clusters at the surface with no zinc present and is confirmed by XRD in Fig. 12. These areas are left behind when metallic Zn is formed during charging, and some should be able to reform CaZn when the anode is discharged although it will compete with the formation of a passivating ZnO layer. SEM-FIB milling of the surface followed by EDS mapping is shown in Fig. 15b (Fig. S26, ESI†), we can see that there is still a good amount of Zn dispersed through Ca which implies areas where CaZn is existing or can easily reform upon discharge due to good atomic mixture of Zn and Ca.
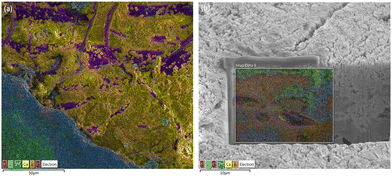 | ||
Fig. 15 (a) Top-down SEM-EDS image of cycled Cell #7 – pure CaZn anode (0![[thin space (1/6-em)]](https://www.rsc.org/images/entities/char_2009.gif) : :![[thin space (1/6-em)]](https://www.rsc.org/images/entities/char_2009.gif) 86 86![[thin space (1/6-em)]](https://www.rsc.org/images/entities/char_2009.gif) : :![[thin space (1/6-em)]](https://www.rsc.org/images/entities/char_2009.gif) Bi) vs. sintered nickel cathodes (b) SEM-FIB cutout with EDS mapping. Bi) vs. sintered nickel cathodes (b) SEM-FIB cutout with EDS mapping. | ||
4. Conclusion
Calcium zincate (CaZn) anode with acetylene carbon black has been shown to provide 1062 cycles at 20% Zn utilization in limited 20 wt% KOH saturated ZnO electrolyte, whose cycle life is comparable to 10% Zn utilization in industrial Zn anodes. Zn anodes were cycled at high 50% utilization in 20 wt% KOH with increasing additions of CaZn (0%, 30%, 70%, 100%), with the same molar amount of Zn. The addition of CaZn into Zn anodes results in a linear increase in thickness and leads up to one fifth reduction in the volumetric energy density, but the cycle life increases exponentially. Comparing Zn anodes with CaZn anodes, both with Bi2O3 under the same conditions, there is approximately 25% increase in the raw materials cost, but a five time increase in cycle life. When considering the cost of the anodes per cycle life, there is a noticeable decrease of cost from ∼$0.016 per kg per discharge kW h per cycle (pure Zn) to ∼$0.012 (pure CaZn) equating to ∼25% reduction in cost per discharge energy per cycle.The addition of CaZn into Zn anodes helps reduce shape change of the anode and delays the growth of the non-electroactive zinc oxide passivation layer, helping to extend the overall cycle life of the cells. Over many cycles, CaZn is unable to reform during discharge and zinc begins to agglomerate and form islands away from the calcium during charge. Discharge capacity is lost when ZnO is formed on the surface as a non-electroactive passivation layer due to the lack of any conductive additives and cannot be reincorporated into the anode during charge/discharge. The addition of CaZn into Zn anodes as an additive allows for higher theoretical Zn utilization, while also decreasing the cost per cycle of the active material showing great promise for industrial applications.
Author contributions
All authors helped with the rough conceptualization for the manuscript. P. K. Y., D. E. T., B. R. W., T. N. L., S. B. all helped design the experiments. P. K. Y. conducted all experiments, synthesized calcium zincate, fabricated anodes and all batteries, cycled batteries, worked on data collection, curation, and formal analysis, wrote the original draft, and reviewed & edited. D. E. T. helped with the cell design, fabrication of cell boxes, supervision of the project, and writing – major review & editing. M. N. helped with initial anode fabrication and forming up sintered nickel cathodes. B. R. W. and T. N. L. helped with investigation to collect the SEM-FIB with EDX mapping data and helped with writing, review & editing. T. N. L., S. O., and S. B. helped with the funding acquisition, reviewing & editing, and supervision of the project.Conflicts of interest
The corresponding author states that authors P. K. Yang, D. E. Turney, M. Nyce, B. R. Wygant, and T. N. Lambert have no conflict of interest. Authors G. G. Yadav, M. Weiner, S. Yang, B. E. Hawkins, and S. Banerjee are employed by Urban Electric Power, Inc. a company developing Zn–MnO2 batteries as a commercial technology.Acknowledgements
This work was supported by the U.S. Department of Energy Office of Electricity. Dr Imre Gyuk, Director of Energy Storage Research at the U.S. Department of Energy Office of Electricity, is thanked for his financial support of this project. This work was performed, in part, at the Center for Integrated Nanotechnologies, an Office of Science User Facility operated for the U.S. Department of Energy (DOE) Office of Science. The views expressed in this article do not necessarily represent the views of the U.S. Department of Energy or the United States Government. This article has been authored by an employee of National Technology & Engineering Solutions of Sandia, LLC under Contract No. DE-NA0003525 with the U.S. Department of Energy (DOE). The National Technology & Engineering Solutions of Sandia, LLC employee owns all right, title and interest to their contribution to the article and is responsible for its contents. The United States Government retains and the publisher, by accepting the article for publication, acknowledges that the United States Government retains a non-exclusive, paid-up, irrevocable, world-wide license to publish or reproduce the published form of this article or allow others to do so, for United States Government purposes. The DOE will provide public access to these results of federally sponsored research in accordance with the DOE Public Access Plan https://www.energy.gov/downloads/doe-public-access-plan. P. K. Y. also gratefully acknowledges additional support from the National Science Foundation (NSF) Centers of Research Excellence in Science and Technology – Phase II Center for Interface Design and Engineered Assembly of Low-dimensional Systems, NSF CREST Center IDEALS II award # HRD-2112550. We would also like to acknowledge the Imaging Facility of CUNY Advanced Science Research Center for instrument use.References
- F. R. McLarnon and E. J. Cairns, The Secondary Alkaline Zinc Electrode, J. Electrochem. Soc., 1991, 138, 645–656, DOI:10.1149/1.2085653.
- D. E. Turney, J. W. Gallaway, G. G. Yadav, R. Ramirez, M. Nyce, S. Banerjee, Y. K. Chen-Wiegart, J. Wang, M. J. D’Ambrose, S. Kolhekar, J. Huang and X. Wei, Rechargeable Zinc Alkaline Anodes for Long-Cycle Energy Storage, Chem. Mater., 2017, 29, 4819–4832, DOI:10.1021/acs.chemmater.7b00754.
- D. E. Turney, M. Shmukler, K. Galloway, M. Klein, Y. Ito, T. Sholklapper, J. W. Gallaway, M. Nyce and S. Banerjee, Development and testing of an economic grid-scale flow-assisted zinc/nickel-hydroxide alkaline battery, J. Power Sources, 2014, 264, 49–58, DOI:10.1016/j.jpowsour.2014.04.067.
- Y. Li and H. Dai, Recent advances in zinc–air batteries, Chem. Soc. Rev., 2014, 43, 5257–5275, 10.1039/C4CS00015C.
- Y.-J. Min, S.-J. Oh, M.-S. Kim, J.-H. Choi and S. Eom, Calcium zincate as an efficient reversible negative electrode material for rechargeable zinc–air batteries, Ionics, 2019, 25, 1707–1713, DOI:10.1007/s11581-018-2619-y.
- S. Le, L. Zhang, X. Song, S. He, Z. Yuan, F. Liu, N. Zhang, K. Sun and Y. Feng, Review—Status of Zinc-Silver Battery, J. Electrochem. Soc., 2019, 166, A2980–A2989, DOI:10.1149/2.1001913jes.
- N. D. Ingale, J. W. Gallaway, M. Nyce, A. Couzis and S. Banerjee, Rechargeability and economic aspects of alkaline zinc–manganese dioxide cells for electrical storage and load leveling, J. Power Sources, 2015, 276, 7–18, DOI:10.1016/j.jpowsour.2014.11.010.
- G. G. Yadav, X. Wei, J. Huang, J. W. Gallaway, D. E. Turney, M. Nyce, J. Secor and S. Banerjee, A conversion-based highly energy dense Cu2+ intercalated Bi-birnessite/Zn alkaline battery, J. Mater. Chem. A, 2017, 5, 15845–15854, 10.1039/C7TA05347A.
- M. J. D’Ambrose, D. E. Turney, G. G. Yadav, M. Nyce and S. Banerjee, Material Failure Mechanisms of Alkaline Zn Rechargeable Conversion Electrodes, ACS Appl. Energy Mater., 2021, 4, 3381–3392, DOI:10.1021/acsaem.0c03144.
- M. J. D’Ambrose, D. E. Turney, M. N. Nyce, T. N. Lambert, G. G. Yadav and S. Banerjee, Performance Advances of Industrial-Design Rechargeable Zinc Alkaline Anodes via Low-Cost Additives, ACS Appl. Energy Mater., 2023, 6, 6091–6103, DOI:10.1021/acsaem.3c00572.
- M. B. Lim, T. N. Lambert and B. R. Chalamala, Rechargeable alkaline zinc–manganese oxide batteries for grid storage: Mechanisms, challenges and developments, Mater. Sci. Eng., R, 2021, 143, 100593, DOI:10.1016/j.mser.2020.100593.
- M. Bockelmann, M. Becker, L. Reining, U. Kunz and T. Turek, Passivation of Zinc Anodes in Alkaline Electrolyte: Part I. Determination of the Starting Point of Passive Film Formation, J. Electrochem. Soc., 2018, 165, A3048–A3055, DOI:10.1149/2.0331813jes.
- I. Arise, S. Kawai, Y. Fukunaka and F. R. McLarnon, Coupling Phenomena between Zinc Surface Morphological Variations and Ionic Mass Transfer Rate in Alkaline Solution, J. Electrochem. Soc., 2013, 160, D66–D74, DOI:10.1149/2.083302jes.
- B. E. Hawkins, D. E. Turney, R. J. Messinger, A. M. Kiss, G. G. Yadav, S. Banerjee and T. N. Lambert, Electroactive ZnO: Mechanisms, Conductivity, and Advances in Zn Alkaline Battery Cycling, Adv. Energy Mater., 2022, 12, 2103294, DOI:10.1002/aenm.202103294.
- C. Zhu, N. B. Schorr, Z. Qi, B. R. Wygant, D. E. Turney, G. G. Yadav, M. A. Worsley, E. B. Duoss, S. Banerjee, E. D. Spoerke, A. V. Buuren and T. N. Lambert, Direct Ink Writing of 3D Zn Structures as High-Capacity Anodes for Rechargeable Alkaline Batteries, Small Struct., 2023, 4, 2200323, DOI:10.1002/sstr.202200323.
- J. S. Ko, A. B. Geltmacher, B. J. Hopkins, D. R. Rolison, J. W. Long and J. F. Parker, Robust 3D Zn Sponges Enable High-Power, Energy-Dense Alkaline Batteries, ACS Appl. Energy Mater., 2019, 2, 212–216, DOI:10.1021/acsaem.8b01946.
- Y. Wang and G. Wainwright, Formation and Decomposition Kinetic Studies of Calcium Zincate in 20 w/o KOH, J. Electrochem. Soc., 1986, 133, 1869–1872, DOI:10.1149/1.2109037.
- C. Zhang, J. M. Wang, L. Zhang, J. Q. Zhang and C. N. Cao, Study of the performance of secondary alkaline pasted zinc electrodes, J. Appl. Electrochem., 2001, 31, 1049–1054, DOI:10.1023/A:1017923924121.
- J. Huang, G. G. Yadav, J. W. Gallaway, X. Wei, M. Nyce and S. Banerjee, A calcium hydroxide interlayer as a selective separator for rechargeable alkaline Zn/MnO2 batteries, Electrochem. Commun., 2017, 81, 136–140, DOI:10.1016/j.elecom.2017.06.020.
- R. A. Sharma, Physico-Chemical Properties of Calcium Zincate, J. Electrochem. Soc., 1986, 133, 2215–2219, DOI:10.1149/1.2108376.
- X.-M. Zhu, H.-X. Yang, X.-P. Ai, J.-X. Yu and Y.-L. Cao, Structural and electrochemical characterization of mechanochemically synthesized calcium zincate as rechargeable anodic materials, J. Appl Electrochem., 2003, 33, 607–612, DOI:10.1023/A:1024999207178.
- J. Yu, H. Yang, X. Ai and X. Zhu, A study of calcium zincate as negative electrode materials for secondary batteries, J. Power Sources, 2001, 103, 93–97, DOI:10.1016/S0378-7753(01)00833-3.
- J. M. Rubio-Caballero, J. Santamaría-González, J. Mérida-Robles, R. Moreno-Tost, A. Jiménez-López and P. Maireles-Torres, Calcium zincate as precursor of active catalysts for biodiesel production under mild conditions, Appl. Catal., B, 2009, 91, 339–346, DOI:10.1016/j.apcatb.2009.05.041.
- V. Caldeira, L. Jouffret, J. Thiel, F. R. Lacoste, S. Obbade, L. Dubau and M. Chatenet, Ultrafast Hydro-Micromechanical Synthesis of Calcium Zincate: Structural and Morphological Characterizations, J. Nanomater., 2017, 2017, e7369397, DOI:10.1155/2017/7369397.
- R. Wang, Z. Yang, B. Yang, X. Fan and T. Wang, A novel alcohol-thermal synthesis method of calcium zincates negative electrode materials for Ni–Zn secondary batteries, J. Power Sources, 2014, 246, 313–321, DOI:10.1016/j.jpowsour.2013.07.097.
- S. Li and Y. Y. Zhou, Preparation of Tetragonal and Hexagonal Calcium Zincate, AMM, 2011, 130–134, 1454–1457, DOI:10.4028/www.scientific.net/AMM.130-134.1454.
- E. Shangguan, L. Li, C. Wu, P. Fu, M. Wang, L. Li, L. Zhao, G. Wang, Q. Li and J. Li, Microemulsion synthesis of 3D flower-like calcium zincate anode materials with superior high-rate and cycling property for advanced zinc-based batteries, J. Alloys Compd., 2021, 853, 156965, DOI:10.1016/j.jallcom.2020.156965.
- C.-C. Yang, W.-C. Chien, P.-W. Chen and C.-Y. Wu, Synthesis and characterization of nano-sized calcium zincate powder and its application to Ni–Zn batteries, J. Appl. Electrochem., 2009, 39, 39–44, DOI:10.1007/s10800-008-9637-9.
- S. Wang, Z. Yang and L. Zeng, Effect of Surface Modification with In(OH)3 on Electrochemical Performance of Calcium Zincate, J. Electrochem. Soc., 2008, 156, A18, DOI:10.1149/1.3006399.
- M. L. Tong and X. Y. Liu, Preparation and Electrochemical Performances of Calcium Zincate Synthesized by Microwave Method, AMR, 2011, 236–238, 868–871, DOI:10.4028/www.scientific.net/AMR.236-238.868.
- V. Caldeira, J. Thiel, F. R. Lacoste, L. Dubau and M. Chatenet, Improving zinc porous electrode for secondary alkaline batteries: Toward a simple design of optimized 3D conductive network current collector, J. Power Sources, 2020, 450, 227668, DOI:10.1016/j.jpowsour.2019.227668.
- V. Caldeira, R. Rouget, F. Fourgeot, J. Thiel, F. Lacoste, L. Dubau and M. Chatenet, Controlling the shape change and dendritic growth in Zn negative electrodes for application in Zn/Ni batteries, J. Power Sources, 2017, 350, 109–116, DOI:10.1016/j.jpowsour.2017.03.069.
- H. Yang, H. Zhang, X. Wang, J. Wang, X. Meng and Z. Zhou, Calcium Zincate Synthesized by Ballmilling as a Negative Material for Secondary Alkaline Batteries, J. Electrochem. Soc., 2004, 151, A2126, DOI:10.1149/1.1815158.
- S. Wang, Z. Yang and L. Zeng, Study of calcium zincate synthesized by solid-phase synthesis method without strong alkali, Mater. Chem. Phys., 2008, 112, 603–606, DOI:10.1016/j.matchemphys.2008.06.007.
- J. Hao, C. Yang and F. Zhao, A Facile Route for the Preparation of Calcium Zincate and its Application in Ni–Zn Batteries, J. Electrochem. Soc., 2014, 161, A704, DOI:10.1149/2.002405jes.
- M. B. Lim, T. N. Lambert and E. I. Ruiz, Effect of ZnO-Saturated Electrolyte on Rechargeable Alkaline Zinc Batteries at Increased Depth-of-Discharge, J. Electrochem. Soc., 2020, 167(6), 060508, DOI:10.1149/1945-7111/ab7e90.
- J. Shin, J.-M. You, J. Z. Lee, R. Kumar, L. Yin, J. Wang and Y. S. Meng, Deposition of ZnO on bismuth species towards a rechargeable Zn-based aqueous battery, Phys. Chem. Chem. Phys., 2016, 18, 26376–26382, 10.1039/C6CP04566A.
- D.-J. Park, E. O. Aremu and K.-S. Ryu, Bismuth oxide as an excellent anode additive for inhibiting dendrite formation in zinc-air secondary batteries, Appl. Surf. Sci., 2018, 456, 507–514, DOI:10.1016/j.apsusc.2018.06.079.
- F. Moser, F. Fourgeot, R. Rouget, O. Crosnier and T. Brousse, In situ X-ray diffraction investigation of zinc based electrode in Ni–Zn secondary batteries, Electrochim. Acta, 2013, 109, 110–116, DOI:10.1016/j.electacta.2013.07.023.
- J. McBreen and E. Gannon, Bismuth oxide as an additive in pasted zinc electrodes, J. Power Sources, 1985, 15, 169–177, DOI:10.1016/0378-7753(85)80070-7.
- E. D. Spoerke, H. Passell, G. Cowles, T. N. Lambert, G. G. Yadav, J. Huang, S. Banerjee and B. Chalamala, Driving Zn-MnO2 grid-scale batteries: A roadmap to cost-effective energy storage, MRS Energy Sustain., 2022, 9, 13–18, DOI:10.1557/s43581-021-00018-4.
Footnote |
| † Electronic supplementary information (ESI) available. See DOI: https://doi.org/10.1039/d4ya00093e |
| This journal is © The Royal Society of Chemistry 2024 |

