 Open Access Article
Creative Commons Attribution 3.0 Unported Licence
Precipitation enhancement of liquid thermoelectric conversion with Fe(ClO4)2/Fe(ClO4)3 dissolved in DMF
Akihiro
Wake
a,
Dai
Inoue
a and
Yutaka
Moritomo
 *abc
*abc
aGraduate School of Pure & Applied Science, University of Tsukuba, Tennodai 1-1-1, Tsukuba, Ibaraki 305-8571, Japan. E-mail: moritomo.yutaka.gf@u.tsukba.ac.jp
bFaculty of Pure & Applied Science, University of Tsukuba, Tennodai 1-1-1, Tsukuba, Ibaraki 305-8571, Japan
cTsukuba Research Center for Energy Materials Science (TREMS), University of Tsukuba, Tsukuba, Ibaraki 305-8571, Japan
First published on 4th March 2024
Abstract
The electrochemical Seebeck coefficient α is one of the parameters that determines the performance of liquid thermoelectric conversion devices (LTEs). We systematically investigated α in N,N-dimethylformamide (DMF) containing both m M Fe(ClO4)2 and m M Fe(ClO4)3 against m. Above 0.35 M, we observed significant enhancement of α due to precipitates containing Fe3+. In addition, the precipitation enhances the maximum power of the LTE at 0.4 M by as much as 32%. The precipitation enhancement of α cannot be explained only by the concentration gradient model. We propose a solution-solid equilibrium of Fe3+ as an additional precipitate effect, which can fill the difference between the concentration gradient model and observed α.
1 Introduction
In recent years, research and development of energy harvesting technologies1–3 have been vigorously carried out to achieve the sustainable development goals (SDGs) and prevent global warming by reducing CO2. Among the energy harvesting technologies, liquid thermoelectric conversion devices (LTEs), which have a simple device structure composed of low-cost materials, are attracting attention. Although the history of LTE research and development is very long,4–22 vigorous research and development continues even now.23–32 The thermoelectromotive force VT of an LTE is expressed as VT = α(TH − TL), where TH and TL are the temperatures at the high and low temperature electrodes, respectively. From a technical point of view, 20 mV is the minimum value to drive a semiconductor device, because a commercially available booster circuit can boost 20 mV to several volts. An LTE can achieve this value with a ΔT (= TH − TL) of about 20 K. The performance of LTEs is governed by the electrochemical Seebeck coefficient α, electric conductivity σ, and thermal conductivity κ, of the electrolyte. In particular, the dimensionless figure of merit ( , where T is temperature) determines the thermal efficiency of the LTE. To increase ZT, it is necessary to increase α and σ and decrease κ. Until now, aqueous electrolytes were actively investigated as an electrolyte for LTEs. Recently, Inoue et al.33 investigated α in organic electrolytes containing Fe2+/Fe3+ and reported that α in several organic electrolytes, e.g., acetone and acetonitrile (AN), surpasses the value (= 1.4 mV K−1) of aqueous electrolytes. In addition, κ (≈ 0.2 W Km−1) of organic solvents is approximately one-third that of water (= 0.6 W Km−1). Therefore, organic electrolytes are promising candidates of electrolytes for high-performance LTEs.25,26
Interestingly, addition of other molecules27–30 or solvents31 to the electrolyte has been reported to significantly increase α. Zhou et al.27 reported that the addition of cyclodextrins (CD) increases α in the I3−/I− system. They interpreted the enhancement of α in terms of the I3− -inclusion by CD and quantitatively explained the observed α based on the Nernst equation including temperature dependence of the association constant. On the other hand, Duan et al.29 reported enhancement of α in aqueous [Fe(CN)6]4−/[Fe(CN)6]3− by introducing strong chaotropic cations (guanidinium) and highly soluble amide derivatives (urea). They interpreted the enhancement of α in terms of the enlarged entropy difference in the redox couple. Yu et al.30 reconsidered this enhancement, and interpreted it in terms of the concentration gradient model originated in the temperature dependence of solubility s(T). They presented a qualitative explanation based on the Nernst equation,
 | (1) |
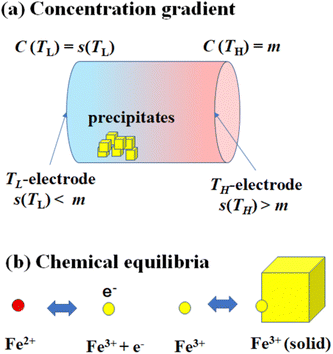
Fig. 1(a) schematically shows the concentration gradient30 in between the TL- and TH-electrodes. When s(TL) is below the solute concentration m, precipitation occurs until the local concentration C(TL) reaches the solubility s(TL). Then, C(TL) [= s(TL).] becomes smaller than C(TH) (= m). The resultant concentration gradient significantly influences  via the second term of the Nernst equation (eqn (1)). Another possible effect of precipitation is additional chemical equilibrium between the solution and solid (precipitate) phases in addition to that between Fe2+ and Fe3+, as schematically shown in Fig. 1(b).
In this paper, we systematically investigated α in N,N-dimethylformamide (DMF) containing both m M Fe(ClO4)2 and m M Fe(ClO4)3. Above m = 0.35 M, we observed significant enhancement of α due to precipitates containing Fe3+. The precipitation enhancement of α cannot be explained only by the concentration gradient model. We propose solution-solid equilibrium of Fe3+ as another precipitate effect. In addition, the precipitation enhances the maximum power of the LTE at 0.4 M by as much as 32%.
2 Experimental methods
2.1 Preparation and properties of the electrolytes
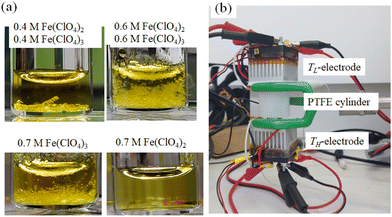
The electrolytes investigated were DMF solution containing both m M Fe(ClO4)2·6H2O and m M Fe(ClO4)3·7.1H2O. The electrolytes contain the redox pair, that is, Fe2+ in a reduced state and Fe3+ in an oxidized state, in equal moles. DMF, Fe(ClO4)2·6H2O, and Fe(ClO4)3·7.1H2O were purchased from FUJIFILM Wako corp. and used as received. Fig. 2(a) shows photographs of the DMF solutions at 25 °C. In the DMF solution containing 0.4 M Fe(ClO4)2 and 0.4 M Fe(ClO4)3 (upper left) and that containing 0.6 M Fe(ClO4)2 and 0.6 M Fe(ClO4)3 (upper right), yellow pale precipitates are observed. We note that similar precipitates are observed in DMF solution (bottom left) containing 0.7 M Fe(ClO4)3 without Fe(ClO4)2. On the other hand, no precipitates are observed in DMF solution (bottom right) without Fe(ClO4)3. This is because the solubility of Fe(ClO4)2 in DMF exceeded 2.0 M at 25 °C.We collected precipitates from DMF solution containing 0.5 M Fe(ClO4)3 and 0.5 M Fe(ClO4)2. The element ratio of N and C was evaluated by CNH elementary analysis using an organic elemental analyzer (UNICUBE, elementar). The ratio (N![[thin space (1/6-em)]](https://www.rsc.org/images/entities/char_2009.gif) :
:![[thin space (1/6-em)]](https://www.rsc.org/images/entities/char_2009.gif) C = 1.0
C = 1.0![[thin space (1/6-em)]](https://www.rsc.org/images/entities/char_2009.gif) :
:![[thin space (1/6-em)]](https://www.rsc.org/images/entities/char_2009.gif) 2.7) is close to the ratio of DMF (C3H7NO), indicating that the precipitate contains DMF molecules. We further evaluated the element ratio of Fe, Cl, O, and N with use of scanning electron microscopy (SEM-EDA: JSM-IT200; JOEL) equipped with an energy-dispersive X-ray analyzer. Table 1 shows the observed element ratio together with the calculated values with assuming Fe(ClO4)x (C3H7NO)y. The optimized composition was Fe(ClO4)2.9 (C3H7NO)9.2. The composition indicates that the precipitate contains Fe3+, but hardly any Fe2+.
2.7) is close to the ratio of DMF (C3H7NO), indicating that the precipitate contains DMF molecules. We further evaluated the element ratio of Fe, Cl, O, and N with use of scanning electron microscopy (SEM-EDA: JSM-IT200; JOEL) equipped with an energy-dispersive X-ray analyzer. Table 1 shows the observed element ratio together with the calculated values with assuming Fe(ClO4)x (C3H7NO)y. The optimized composition was Fe(ClO4)2.9 (C3H7NO)9.2. The composition indicates that the precipitate contains Fe3+, but hardly any Fe2+.
| Fe | Cl | O | N | |
|---|---|---|---|---|
| Observed | 1 | 2.95(8) | 20.89(2.84) | 9.16(1.13) |
| Calculated | 1 | 2.93 | 20.89 | 9.15 |
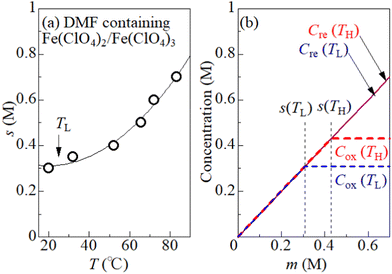
To quantitatively consider the precipitation effect of Fe3+, the solubility s of Fe3+ in DMF solution was investigated. It is important to determine s in the same solution composition as for the measurement of VT. This is because the dissolution of Fe(ClO4)2 can affect s through a change in [ClO4−]. We determine the maximum concentration (s) of equimolar Fe(ClO4)2 and Fe(ClO4)3 dissolved in DMF solution without precipitate containing Fe3+. First, m* M Fe(ClO4)2 and m* M Fe(ClO4)3 were added to DMF. Then, the temperature of the solution was uniformly and slowly raised with stirring the solution. We carefully determined the temperature at which the solute completely melts. At that temperature (T), s becomes equal to m*. We repeated the measurement for the respective m*, and obtained a T–s data set. Open circles in Fig. 3(a) show the T–s data set. The solid curve is a result of least-squares fitting with a quadratic function.
Fig. 3(b) shows oxidant (Cox) and reductant (Cre) concentrations against m at TL = 25 °C and TH = 55 °C. We note that s is the limit value of Cox, that is, Cox = s if s ≤ m. On the other hand, Cre (= m) is independent of s, because Fe2+ remains dissolved even if Fe3+ precipitates. Depending on the region of m, Cox is expressed as Cox(TL) = Cox(TH) = m for m ≤ s(TL), Cox(TL) = s(TL) and Cox(TH) = m for s(TL) ≤ m ≤ s(TH), and Cox(TL) = s(TL) and Cox(TH) = s(TH) for s(TH) ≤ m.
2.2 Thermoelectromotive force
Thermoelectromotive force VT was measured in a specially-designed thermocell34 [Fig. 2(b)]. The electrolyte was filled in a 0.73 mm ϕ polytetrafluoroethylene (PTFE) cylinder. For the solution with m ≥ s(TL) (= 0.32 M), the solution was heated to ∼80 °C to dissolve the solutes before being sealed in the cell. Both ends were sealed with Al pedestals, on which the Pt disks were attached as the TL- and TH-electrodes. TH and TL were controlled with Peltier modules and monitored with T-type thermocouples. The electrode area and distance were 0.42 cm2 and 1.0 cm, respectively.V T was measured against ΔT (= TH − TL) with fixing TL at 25 °C. TH was stepwisely controlled with the Peltier modules. VT at each ΔT was measured under the open circuit condition with the use of a digital multimeter (Keithley 2100; Tektronics). α was evaluated by the slope of the ΔT – VT plot.
2.3 Output characteristics of the LTE
The output characteristics of the LTE were investigated with the same thermocell as described in the previous subsection. In the measurement, ΔT, TL, and TH were fixed at 20 K, 25 °C, and 45 °C, respectively. The output voltage (V) was measured against current density (I). I was controlled by the external resistor (Rex), which was connected in series with the LTE. The Rex values were 10k, 3k, 1k, 240, 120, and 51 Ω. Considering the equivalent circuit, we obtained a relationship V = IRex = VT − IRin, where Rin is the internal resistance of the LTE. V at each Rex was measured with the use of a digital multimeter (Keithley 2100; Tektronics). I at each Rex was evaluated as .
.
3 Results
3.1 Precipitation enhancement of α
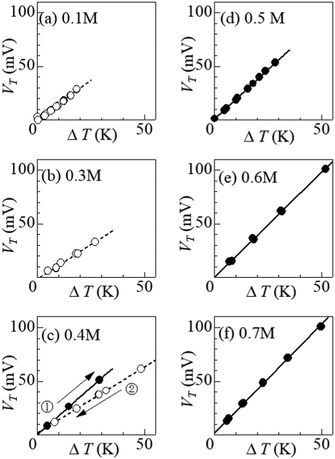
Fig. 4 shows ΔT–VT plots against m. In the low m region below s(TL) (= 0.32 M), i.e., at (a) 0.1 M and (b) 0.3 M, VT increases in proportion to ΔT. The slope of the ΔT–VT plot corresponds to α. The slope decreases with m from 1.43 mV K−1 at 0.1 M to 1.25 m K K−1 at 0.3 M. This is probably due to the overlap of the surrounding DMF molecules around iron ions.26 The overlap of the solvent molecules effectively reduces the number of molecules affected by the redox reaction of the central ion, thereby suppressing ΔS in the reduction process. When m exceeds s(TL), a precipitation effect appears. At (c) 0.4 M, (d) 0.5 M, (e) 0.6 M, and (f) 0.7 M, the slopes of the ΔT–VT plots (closed circles) are much larger than that (= 1.25 mV K−1) at 0.3 M; 1.58 mV K−1 at 0.4 M in the ΔT-increasing run, 1.85 mV K−1 at 0.5 M, 1.96 mV K−1 at 0.6 M, and 2.04 mV K−1 at 0.7 M. Thus, we observed significant enhancement of α due to the precipitate containing Fe3+.Curiously, at (c) 0.4 M, the enhancement of α was significantly suppressed in the ΔT-decreasing run (open circles). We observed similar suppression of the enhancement also at 0.35 M. To investigate the cause of this phenomenon, we disassembled the 0.4 M thermocell immediately after the ΔT-decreasing run and examined the presence or absence of precipitates. We found no precipitates in the cell immediately after the ΔT-decreasing run. In the ΔT-increasing run, all the precipitates in the solution are considered to be dissolved at sufficiently large ΔT if m ≈ s. The disappearance of precipitates at smaller ΔT in the ΔT-decreasing run is probably due to the supercooling effect. The supercooled state was found to be stable and was maintained for a long time in the measurement cell. At 0.4 M, the state was maintained for more than 20 hours at ΔT = 20 K, and for more than 10 hours at 10 K.
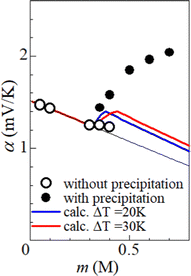
Fig. 5 shows α against m, which was evaluated by the slope of the ΔT–VT plot. Closed and open circles correspond to with and without precipitates, respectively. The thin solid line is the result of least-squares fitting of the data below m ≤ 0.3 M. We note that α (closed circles) with precipitation is much larger than the thin line. In the range of 0.35 ≤ m ≤ 0.40, α (open circles) without precipitation is close to the thin line.
3.2 Output characteristics of the LTE
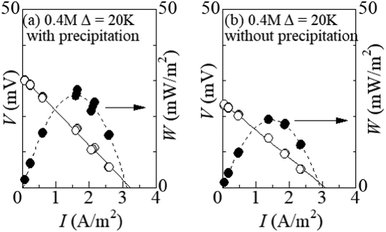
Fig. 6 shows the I–V curve of the LTEs at ΔT = 20 K (a) with and (b) without precipitation. The latter performance was investigated in the LTE whose electrolyte was supercooled from ΔT∼ 50 K. In the (a) LTE with precipitates, the thermoelectromotive force and maximum power were 31.0 mV and 23.8 mW m−2, respectively. In the (b) LTE without precipitation, the thermoelectromotive force and maximum power were 23.9 mV and 18.9 mW m−2, respectively. The precipitates enhance VT and the maximum power by as much as 30% and 32%, respectively.4 Discussion
4.1 Concentration gradient effect
Now, let us discuss the origin of the enhanced α. The most probable origin for the enhancement is the concentration gradient effect.30 Let us quantitatively evaluate the enhancement based on the Nernst equation (eqn (1)) including s(T). By replacing the differential by dT with the difference by ΔT, α is expressed as
 | (2) |
 . We note that Cre(TL) = Cre(TH) = m in the present DMF solution containing m M Fe(ClO4)2 and m M Fe(ClO4)3. The first term α0 corresponds to the normal component, which does not incorporate the effect of precipitation. Experimentally, the thin line in Fig. 5 corresponds to α0. In the present system, α0 is independent of T in the temperature range investigated. The second and third terms represent the concentration gradient effect and can be calculated using the experimentally obtained s(T) of Fe3+. We note that the second term is larger than the third one by a factor of
  .
.
Let us investigate in detail the effect of TH on the calculated α based on eqn (2). TL was fixed at 25 °C in the present experiment. Let us consider an electrolyte with precipitates at the TL-electrode, i.e., s(TL) ≤ m, and gradually increase TH from TL. If TH is low enough so that s(TH) ≤ m is satisfied, precipitates exist at both the TL- and TH-electrodes. In this temperature range, α depends on THvia Cox(TH) [= s(TH)] and  in the second term of eqn (2). With use of the least-squares fitted quadratic curve as s(T) [Fig. 3(b)], we found that α gradually increases with TH. If TH becomes high enough so that s(TH) ≥ m is satisfied, the precipitates melt at the TH -electrodes, i.e., Cox(TH) = m. In this temperature range, α monotonously decreases with THvia
 . Looking at Fig. 4, it is reasonable to compare the observed α with the calculated values at ΔT = 20–30 K.
We calculated α against m at ΔT = 20 and 30 K and plotted it by thick blue and red curves in Fig. 5, respectively. In the calculation, we used the least-squares fitted quadratic curve as s(T), as indicated by the solid curve in Fig. 3(b). The enhancement of α is absent below m ≤ s(TL) (= 0.32 M), because Cox(TL) = Cox(TH) = m. At ΔT = 20 K, the enhancement of α is almost constant above m ≥ s(TH) (= 0.37 M), because Cox(TL) [= s(TL)] and Cox(TH) [= s(TH)] are independent of m. Similarly, the enhancement of α is almost constant above m ≥ s(TH) (= 0.43 M) at ΔT = 30 K. In the region of m ≥ s(TH), the enhancement of α is larger at ΔT = 30 K than that at 20 K. The calculation, however, cannot reproduce the observed α. Firstly, the calculated value is much smaller than the observed value. Secondly, the calculated value becomes constant above m ≥ 0.4, while the observed value monotonously increases with m. To explain the observed α, additional precipitation effects are needed.
4.2 Solution-solid equilibrium of Fe3+
The candidate for the additional precipitation effect is the chemical equilibrium effect of Fe3+ between the solution and solid (precipitate) phases [Fig. 1(b)]. Thermodynamically, α is equivalent to the entropy change ΔS during the reduction process divided by the elementary charge e. In the present Fe2+/Fe3+ system, α without precipitation is positive. Then, the solution-solid equilibrium of Fe3+ further increases α as follows. The reduction reaction (Fe3+ + e− → Fe2+) decreases the number of Fe3+ in solution. To compensate the decrease, Fe3+ in the nearby precipitate should dissolve into solution. The resultant solvation entropy of Fe3 + enlarges ΔS, and hence, α. For this process to occur, there must be active precipitates near the electrode surface where the reduction reaction takes place. Then, the enhancement of α is expected to increase with m, since the number of precipitates increases with m.Now, let us evaluate the solvation entropy ΔSsol in the solvation process of Fe3+ using a thermodynamic relation: TΔSsol = ΔH − ΔG, where ΔH and ΔG are the enthalpy and Gibbs's free energy changes, respectively. ΔG is expressed as ΔG = −kBTlnZsol, where Zsol (≡ [Fe3+][ClO4−]3) is the solubility equilibrium constant. We note that ΔG in this system is strongly temperature dependent around the LTE operating temperature, because Zsol, or s [Fig. 3(b)], changes rapidly with T. With considering ΔSsol and ΔH as constants, T-differential of TΔSsol = ΔH − ΔG gives  . By approximating the T-differential as the difference between 298 K (s = 0.32 M) and 328 K (s = 0.43 M), ΔSsol was estimated to be 1.1 meV K−1. The ΔSsol value can fill the differences between the concentration gradient model at ΔT = 30 K and observed α, which ranges from 0.1 meV K−1 at 0.35 M to 0.9 meV K−1 at 0.7 M.
5 Conclusions
In conclusion, we systematically investigated α in DMF containing m M Fe(ClO4)2 and m M Fe(ClO4)3 against m. Above 0.35 M, we observed significant enhancement of α by precipitates containing Fe3+ and interpreted the enhancement in terms of the concentration gradient and solution-solid equilibrium effects. We further found that the precipitation enhances the LTE power at 0.4 M by as much as 32%.Author contributions
Akihiko Waki: data curation; formal analysis; investigation. Dai Inoue: investigation (supporting). Yutaka Moritomo: conceptualization; supervision; and writing – original draft; writing – review & editing.Conflicts of interest
There are no conflicts to declare.Acknowledgements
This work was supported by the Yazaki Memorial Foundation for Science and Technology.Notes and references
- H. Wu, X.-L. Shi, J. Daun, Q. Liu and Z.-G. Chen, Energy Environ. Sci., 2023, 16, 1870 RSC
.
- H. Wu, X.-I. Shi, Y. Mao, M. L.i, W.-D. Liu, D.-Z. Wang, L.-C. Yin, M. Zhu, Y. Wang, J. Duan, Q. Liu and Z.-G. Chen, Adv. Energy Matter., 2023, 13, 2302551 CrossRef CAS
.
- X.-L. Shi, H. Wu, Q. Liu, W. Zhou, S. Lu, Z. Shao, M. Dargusch and Z.-G. Chen, Nano Energy, 2020, 78, 105195 CrossRef CAS
.
- A. Schiraldi, E. Pezzati and P. Baldini, J. Phys. Chem., 1985, 89, 1528 CrossRef CAS
.
- T. Ikeshoji, Bull. Chem. Soc. Jpn., 1987, 60, 1505 CrossRef CAS
.
- I. Quickenden and Y. Mua, J. Electrochem. Soc., 1995, 142, 3985 CrossRef
.
- Y. Mua and T. I. Quickenden, J. Electrochem. Soc., 1996, 143, 2558 CrossRef CAS
.
- R. Hu, B. A. Cola, N. Haram, J. N. Barisci, S. Lee, S. Stoughton, G. Wallace, C. Too, M. Thomas, A. Gestos, M. Ed Cruz, J. P. Ferraris, A. A. Zakhidov and R. H. Baughman, Nano Lett., 2010, 10, 838 CrossRef CAS PubMed
.
- D. R. MacFarlane, N. Tachikawa, M. Forsyth, J. M. Pringle, P. C. Howlett, G. D. Elliott, J. F. Davis, Jr., M. Watanabe, P. Simon and C. A. Angell, Energy Environ. Sci., 2014, 7, 232 RSC
.
- M. Bonetti, S. Nakamae, M. Roger and P. Guenoun, J. Chem. Phys., 2011, 134, 114513 CrossRef CAS PubMed
.
- T. J. Abraham, D. R. MacFarlane and J. M. Pringle, Chem. Commun., 2011, 47, 6260 RSC
.
- M. Romano, S. Gambhir, J. Razal, A. Gestos, G. Wallace and J. Chen, J. Therm. Anal. Calorim., 2012, 109, 1229 CrossRef CAS
.
- M. S. Romano, N. Li, D. Antiohos, J. M. Razal, A. Nattestad, S. Beirne, S. Fang, Y. Chen, R. Jalili, G. G. Wallace, R. Baughman and J. Chen, Adv. Mater., 2013, 25, 6602 CrossRef CAS PubMed
.
- T. J. Abraham, D. R. MacFarlane and J. M. Pringle, Energy Environ. Sci., 2013, 6, 2639 RSC
.
- A. Gunawan, C.-H. Lin, D. A. Buttry, V. Mujica, R. A. Taylor, R. S. Prasher and P. E. Phelan, Nanoscale Microscale Thermophys. Eng., 2013, 17, 304 CrossRef CAS
.
- N. Jiao, T. J. Abraham, D. R. MacFarlane and J. M. Pringle, J. Electrochem. Soc., 2014, 161, D3061 CrossRef CAS
.
- S. Uhl, E. Laux, T. Journot, L. Jeandupeux, J. Charmet and H. Keppner, J. Electron. Mater., 2014, 43, 3758 CrossRef CAS
.
- A. Gunawan, H. Li, C.-H. Lin, D. A. Buttry, V. Mujica, R. A. Taylor, R. S. Prasher and P. E. Phelan, Int. J. Heat Mass Trans., 2014, 78, 423 CrossRef CAS
.
- M. A. Lazar, D. Al-Masri, D. R. MacFarlane and J. M. Pringle, Phys. Chem. Chem. Phys., 2016, 18, 1404 RSC
.
- H. Im, T. Kim, H. Song, J. Choi, J. S. Park, R. Ovalle-Robles, H. D. Yang, K. D. Kihm, R. H. Baughman, H. H. Lee, T. J. Kang and Y. H. Kim, Nat. Commun., 2016, 7, 10600 CrossRef CAS PubMed
.
- A. H. Kazim and B. A. Cola, J. Electrochem. Soc., 2016, 163, F867 CrossRef CAS
.
- M. Sindhuja, B. Lohith, V. Sudha, G. R. Manjunath and S. Harinipriya, Mater. Res. Express, 2017, 4, 075513 CrossRef
.
- J. H. Kim, J. H. Lee, E. E. Palen, M.-S. Suh, H. H. Lee and R. J. Kang, Sci. Rep., 2019, 9, 8706 CrossRef PubMed
.
- M. A. Buckingham, F. Marken and L. Aldous, Sustainable Energy Fuels, 2018, 2, 20717 RSC
.
- A. Wake, D. Inoue and Y. Moritomo, Appl. Phys. Express, 2022, 15, 054002 CrossRef CAS
.
- A. Wake, D. Inoue and Y. Moritomo, Jpn. J. Appl. Phys., 2023, 62, 014002 CrossRef CAS
.
- H. Zhou, T. Yamada and N. Kimizuka, J. Am. Chem. Soc., 2016, 138, 10502 CrossRef CAS PubMed
.
- Y. Liang, J. K.-H. Hui, M. Morikawa, H. Inoue, T. Yamada and N. Kimizuka, Appl. Energy Matter., 2021, 4, 5326 CrossRef CAS
.
- J. Duan, G. Feng, B. Yu, J. Li, M. Chen, P. Yang, J. Feng, K. Liu and J. Zhou, Nat. Commun., 2018, 9, 5146 CrossRef PubMed
.
- B. Yu, J. Duan, H. Cong, W. Xie, R. Liu, X. Ahuang, H. Wang, B. Qi, M. Xu and L. Wan, Science, 2020, 370, 342 CrossRef CAS PubMed
.
- T. Kim, J. S. Lee, G. Lee, H. Yoon, J. Yoon, T. J. Kangd and Y. H. Kim, Nano Energy, 2017, 31, 160 CrossRef CAS
.
- Y. Xaing, X. Guo, H. Zhu, Q. Zhang and S. Zhu, Chem. Eng. J., 2019, 461, 142013 Search PubMed
.
- D. Inoue, H. Niwa, H. Nitani and Y. Moritomo, J. Phys. Soc. Jpn., 2021, 90, 033602 CrossRef
.
- Y. Fukuzumi, Y. Hinuma and Y. Moritomo, Jpn. J. Appl. Phys., 2019, 58, 065501 CrossRef CAS
.
| This journal is © The Royal Society of Chemistry 2024 |

