DOI:
10.1039/D3YA00436H
(Paper)
Energy Adv., 2024,
3, 131-142
Results from the operation of an efficient and flexible large-scale biogas methanation system
Received
1st September 2023
, Accepted 4th November 2023
First published on 6th November 2023
Abstract
This study reports the design and operation of a power-to-gas system producing 240 kW of synthetic natural gas (SNG) from biogas and PV electricity. The system is composed of a solar field, an electrolyser, a plate-type heat exchanger methanation reactor and the required ancillary units. Biogas is cleaned from undesired components (such as H2S) and the raw gas including methane and CO2 is directly processed in the reactor. The process consumes biogas and renewable electricity to produce SNG and high-pressure steam from the methanation waste heat. The process efficiency in this configuration is 76%. The methanation reactor produces grid compliant SNG in all the load cases tested and in all the biogas composition cases. The reactor shows an excellent flexibility at the start-up, as grid-compliant SNG is produced in less than 10 minutes from feed start in hot-standby. Additionally, the reactor adapts in few minutes to load changes. The reactor is modelled to better understand the origin of the excellent performance in the biogas methanation reaction. It was found that the plate-type heat exchanger operated with boiling water as cooling is an ideal solution for the methanation reaction as it approximates well the optimal reaction pathway in terms of temperature and conversion profile. Large cooling is available where needed, preventing the operation at too high temperature. Isothermal conditions are established at the end of the reactor, allowing reaching the required high conversion.
1. Introduction
The substitution of fossil-based natural gas with renewably produced synthetic methane is gaining progressively the interest of gas suppliers and policy makers due to the need of decreasing the carbon footprint of the energy supply and industry. Additionally, synthetic methane can be produced from local resources, diminishing the dependence from energy import by utilising the existing storage facilities.1 This appears as a highly desirable option to stabilise the energy system against the risk of international political crises. A possible approach to produce synthetic natural gas (SNG) employs the so-called CO2 methanation (or Sabatier) reaction:| | | CO2 + 4H2 ↔ CH4 + 2H2O ΔHR0 = −165 kJ mol−1 | (1) |
The reaction recycles a low-value compound (CO2) and allows the storage of (renewably produced) H2. The process can be used to balance seasonal disparities between the energy production from renewable resources and the energy demand.2
The main hurdle for the introduction of renewable gas in the energy system is its high cost. The cost of renewable H2 depends on the cost of electricity, which makes this raw material available at low cost only for limited time during the year.3 For this reason, the cost of the other reactant (CO2) should be low and preferentially negative.4 In the absence of clear legislation providing an income for the plants recycling CO2, relatively few CO2 sources are sufficiently economical to allow the production of cost competitive SNG.5 One possible cheap CO2 source is biogas. Biogas is a mixture of CO2 and CH4, containing high amounts of CO2 (normally between 30–50%). Currently, one popular biogas valorisation process is biogas upgrading.6 This is operated by removing CO2 from biogas to obtain a gas suitable for injection in the natural gas grid.7 The most used technologies to this scope are scrubbers and membranes.8 A new trend in the biogas use is its direct utilisation in the CO2 methanation reaction. In this way, one can produce SNG without the need of prior CO2 separation from biogas, obtaining low-cost CO2 and receiving an additional income from the sale of the CH4 contained in biogas together with the synthesized fuel.9 As a drawback, the direct biogas methanation brings additional challenges compared to the standard CO2 methanation, mainly connected to the necessity of removing impurities from biogas (such as H2S and organic compounds).10
Several studies showed the techno-economic feasibility of the direct biogas methanation, which can be operated both catalytically over several metallic catalysts and via biological processes.9,11–17 However, just a few plants operated the reaction on site at a reasonable size, while more studies report about the methanation of biogas-derived CO2 (i.e., after upgrading).18–20 Specht et al.21 showed the performance of two tubular fixed bed reactors with intermediate condensation, producing ca. 14 kW of SNG. Dannesboe et al.22 operated a similar system composed of two fixed bed reactors with intermediate condensation, obtaining up to 45 kW of SNG. Witte et al.23 reported the performance of a bubbling fluidised-bed reactor for the biogas methanation reaction, producing up to 9 kW of grid-compliant SNG after upgrading with membranes. Guilera et al.24 showed the feasibility of the biogas methanation in microstructured heat exchanger reactors with intermediate condensation, obtaining ca. 15 kW of SNG. Some examples of biological methanation reactors are also available in literature, reaching larger SNG output values. Heller et al.25 exhibited the production of SNG from biogas in a stirred bubble column operated with mixed micro-organisms, with a total production of 165 kW SNG without need of upgrading after the reactor. Hafenbradl26 reported the production of 550 kW of SNG in a stirred bubble column reactor with specific archaea. Recently, a biological methanation reactor with a total installed productivity of ca. 1 MW SNG was inaugurated in Dietikon (CH).27
In the present study, we report the design and operation of a biogas methanation system with an SNG output of ca. 240 kW. As of today, at the best of our knowledge, this is the largest application of catalytic methanation in this field. The reactor operates the direct biogas methanation with the Hitachi Zosen Inova proprietary plate-type technology. The plate-type heat exchanger methanation reactor is an highly efficient reactor for the CO2 methanation, as demonstrated by several modelling and experimental studies.21,28–30 This excellent performance is due to the large cooling surface area, which ensures an adequate cooling rate, essential to avoid operation in a heat transfer controlled regime.31 Here, we report how the geometry and control logic of the reactor allow producing SNG from biogas, which can be directly injected in the local natural gas grid. Furthermore, we highlight that the reactor can be operated by taking advantage of a natural draft cooling system, which reduces to a minimum the additional utilities requirement (e.g., not needing coolant circulation pumps). We show how these features influence the PtG process efficiency and the dynamics of operation of the reactor. In the last section of the study, we compare the experimental results with an appropriate reactor model, drawing conclusions regarding the potential for further optimisation of the system.
2. Material and methods
2.1. System description
Renewable gas field configuration.
The renewable gas field is located in Gabersdorf, Austria. The main components of the system are summarised in Fig. 1. At the location, a biogas plant processing agricultural waste through a wet anaerobic digestion process is present. From this biogas production, ca. 22 N m3 h−1 of raw biogas are fed into the methanation system. Biogas is available at room temperature and ambient pressure. The typical biogas composition is summarised in Table 1. The CO2![[thin space (1/6-em)]](https://www.rsc.org/images/entities/char_2009.gif) :
:![[thin space (1/6-em)]](https://www.rsc.org/images/entities/char_2009.gif) CH4 ratio is normally approximately 1
CH4 ratio is normally approximately 1![[thin space (1/6-em)]](https://www.rsc.org/images/entities/char_2009.gif) :
:![[thin space (1/6-em)]](https://www.rsc.org/images/entities/char_2009.gif) 1 vol/vol with ±5% oscillations possible. No biogas upgrading is performed in the plant. The raw biogas contains significant amounts of H2S (typically 150 ppm, but with possible spikes up to 300 ppm) and few ppm (normally 5–10 ppm) of volatile organic compounds (VOC). To remove these undesired components and to prevent damages to the methanation catalyst, two gas cleaning units are installed. The first unit is equipped with an activated carbon bed. The second unit is specific for desulfurization, and it is equipped with a sorbent from the Actisorb® series by Clariant (Switzerland), which is mainly composed of CuO. Both units operate in ambient conditions (no prior compression or heating). The cleaned biogas is compressed to 8 bar and mixed with H2 prior to feeding to the methanation reactor. The composition of raw and cleaned biogas is measured by an analysis system delivered by Awite Bioenergie GmbH (Germany). This system consists of a NDIR for CO2 and CH4 measurement, based on an infrared 2-beam sensor. The determination of H2S follows an electrochemical measuring principle. H2 is detected based on the thermal conductivity method.32 The measurement of the above-mentioned components is continuously operated. VOCs are quantified by means of gas chromatography, with an off-line procedure based on periodically sampling the raw and cleaned biogas.
1 vol/vol with ±5% oscillations possible. No biogas upgrading is performed in the plant. The raw biogas contains significant amounts of H2S (typically 150 ppm, but with possible spikes up to 300 ppm) and few ppm (normally 5–10 ppm) of volatile organic compounds (VOC). To remove these undesired components and to prevent damages to the methanation catalyst, two gas cleaning units are installed. The first unit is equipped with an activated carbon bed. The second unit is specific for desulfurization, and it is equipped with a sorbent from the Actisorb® series by Clariant (Switzerland), which is mainly composed of CuO. Both units operate in ambient conditions (no prior compression or heating). The cleaned biogas is compressed to 8 bar and mixed with H2 prior to feeding to the methanation reactor. The composition of raw and cleaned biogas is measured by an analysis system delivered by Awite Bioenergie GmbH (Germany). This system consists of a NDIR for CO2 and CH4 measurement, based on an infrared 2-beam sensor. The determination of H2S follows an electrochemical measuring principle. H2 is detected based on the thermal conductivity method.32 The measurement of the above-mentioned components is continuously operated. VOCs are quantified by means of gas chromatography, with an off-line procedure based on periodically sampling the raw and cleaned biogas.
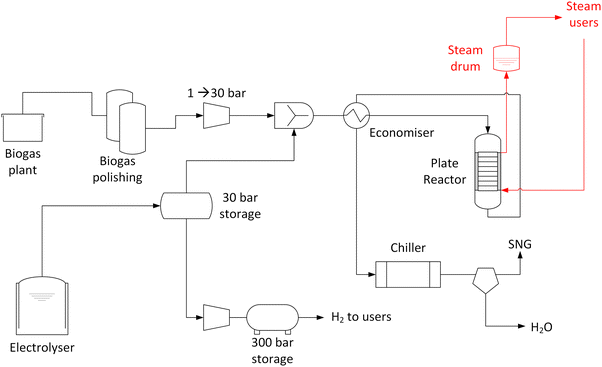 |
| | Fig. 1 Schematic representation of the installed biogas methanation plant. | |
Table 1 Composition of biogas prior and after cleaning (ND = not detected)
| Component |
Raw biogas |
Cleaned biogas |
| CH4 |
45–55% |
As raw biogas |
| CO2 |
45–55% |
As raw biogas |
| H2S |
140–200 ppm |
ND |
| VOC |
5–10 ppm |
ND |
H2 is produced in a 1 MW electrolyser delivered by H-TEC Systems GmbH (Germany). The electrolyser is a proton exchange membrane (PEM) type and produces approximately 450 kg day−1 of H2 at 30 bar.33 Electricity is produced in a 1.5 MW photovoltaic field installed around the PtG plant. The electrolyser produces ca. 1 MW of H2, which is fed to a mid-pressure storage tank, directly connected to the intake section of the methanation plant. As the size of the electrolyser is significantly larger than the methanation throughput, the intermediate storage allows a continuous operation of the methanation plant. The methanation reactor is operated when the H2 pressure in the intermediate tank is above 10 bar. The excess H2 is further compressed to 300 bar and stored in high pressure tanks, from which it is delivered to final users (mainly for automotive customers).
Methanation reactor.
The methanation reactor is a plate type heat exchanger, cooled by boiling water and operating at 8 bar. The reactor is designed to operate with 22 N m3 h−1 of biogas feed (100% load case). The compressed mixture of biogas and hydrogen is first heated in an economiser, which uses the hot product gas to increase the temperature of the feed to approximately 200 °C. The hot feed gas is introduced from the top of the reactor. A gas distribution area is placed on top of the 5 heat exchange plates. The catalyst is placed in the channels formed by the space between two plates. The catalyst is provided by Hitachi Zosen Corporation (Japan) and is based on Ni supported on ZrO2.34 The catalyst is delivered in a reduced and stabilised form. The reactor contains 80 kg of catalyst, with a pellet size of 3 × 3 mm. The pre-reduced catalyst is activated in the reactor in H2 flow at 230 °C for 4 hours. At the inlet and outlet of catalyst bed, an inert layer of α-Al2O3 is placed, to favour the gas distribution. The plate width is 500 mm. A multipoint thermocouple is inserted in the central channel to measure the temperature profile over the reactor axial coordinate. The thermocouple is inserted in a thermowell which is placed in the spacing between the two central plates at 2/3 of the plate width. The cooling system is maintained under pressurised water at 28 bar. The system is designed to withstand the pressure difference between gas and liquid side (28 vs. 8 bar). The product gas rises from the bottom of the reactor to the top in the external section of the reactor. It is then retrieved from the top of the reactor and fed to the post-processing units. The external part of the reactor is insulated and heat traced to avoid heat losses. The vapour produced in the operation is separated in a steam drum placed above the reactor. Cooling water is fed to the bottom of the reactor and the steam is recovered from the top. The system is designed to establish a natural draft circulation. The reactor start-up is operated by a start-up heater, which warms up the water in the steam-water cycle to 230 °C, at the beginning of operations. This allows warming up the reactor to the design temperature. Once the target temperature is reached, first H2 is initiated and then biogas is fed to the reactor, so that the formation of Ni carbonyl species is avoided. Normally, the reactor is initialised at 50% of the nominal load, until stabilisation of the temperature profile. The load is then increased to 70% and stabilised before ramping up to 100% nominal load. The product gas is cooled initially in the economizer and then in a water-cooled heat exchanger. The cool gas (approximately at 5 °C) is fed to a condensation drum to remove the produced water and further dried in a sorbent-based drying unit. The produced SNG is odorised and directly injected in the local gas grid at approximately 5 bar. The product gas is analysed continuously with the same system described in the previous section. Additionally, samples are analysed periodically by means of gas chromatography.
2.2. Reactor model
Model equations.
The plate-type reactor is modelled with a 1D heterogeneous model. This involves a mass and energy balance and two terms for the heat and mass transfer to the catalyst surface. Additionally, the axial heat dispersion is accounted for. The list of used symbols is reported in appendix. The mass and energy balances for the gas phase are expressed as:| |  | (2) |
| |  | (3) |
At the reactor inlet, the boundary conditions according to Dankwerts are used:| |  | (4) |
| |  | (5) |
At the reactor outlet, the second derivative of concentration and temperature is set to zero:| |  | (6) |
| |  | (7) |
The change in flow velocity is accounted for with the continuity equation:| |  | (8) |
To simplify the resolution of the balances, the gradients inside the catalyst pellet are not calculated. This constitutes a strong limitation of the model, because of the high exothermicity of the reaction. However, the limitations in the catalyst utilisation were calculated with the Thiele modulus approach:| |  | (10) |
| |  | (11) |
The solid balance equations are:| |  | (12) |
| |  | (13) |
The cooling medium is considered isothermal, as verified in the experimental results.
Kinetics and correlations.
The kinetic model used for the simulations is derived from Koschany et al.35 Although the model was originally developed for Ni/Al2O3, it was observed that this can satisfactorily describe the performance of the catalyst used in this study. The methanation reaction rate is expressed as:| | 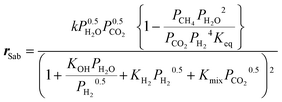 | (14) |
To account for the (limited) CO formation in the hotspot, the model is complemented with the RWGS rate equation by Xu and Froment,36 which correctly incorporates the thermodynamic equilibrium of CO formation:
| | 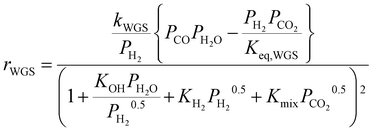 | (15) |
The kinetics of Xu and Froment were used by changing the denominator term with the term of the Koschany kinetics. This was done to account for the same adsorption behaviour in both reactions. As the WGS reaction is practically at equilibrium, this change has minimum influence on the calculated reaction rate. All the kinetic expressions are used without correction factors. The kinetic expressions are relevant only for the data points until the maximum temperature, after which the reactor operates in heat transfer regime. For this reason, an appropriate modelling of the heat transfer is essential for this class of reactors. The heat transfer towards the cooling medium is calculated with the analogy of resistances in series, accounting for the heat transport in the reactive medium, the wall resistance, and the cooling medium:
| |  | (16) |
The heat transfer coefficient in the reactive medium is calculated as:
| |  | (17) |
The Nusselt number is calculated as:
| |  | (18) |
The heat transfer coefficient in the boiling water is set constant to 2000 kW m
−2 K
−1.
The convective transfer between gas and catalyst is calculated as:
| | | HGS = kw + 0.0029·Pe/dp | (19) |
The CO
2 conversion is calculated as:
| |  | (20) |
Methane yield is calculated as:
| |  | (21) |
Efficiency is calculated as:
| |  | (22) |
The model equations are implemented and solved in OpenModelica v1.18.0 (64-bit).
3. Results and discussion
3.1. Results from the reactor operation
In a normal operation procedure, the reactor is first warmed up through the start-up heater. This progressively increases the temperature of the water in the cooling system, so that the reactor is heated by direct exchange from the water/steam cycle. The start-up is operated with the reactor filled by N2. The duration of the start-up phase (i.e., from cold standby to hot standby) depends on the power of the start-up heater. Hence, there is a trade-off between the CAPEX of the installed start-up heater and the time required for the cold start-up. Once the reactor reaches the working temperature, the reactor is flushed in H2 (50% of the nominal load), until the H2 concentration at the reactor outlet is above 90 vol%. At this point, the flow of biogas is started, keeping a setpoint of 50% of the nominal load. This corresponds to the time 0 in Fig. 2. In a normal operation procedure, the CO2![[thin space (1/6-em)]](https://www.rsc.org/images/entities/char_2009.gif) :
:![[thin space (1/6-em)]](https://www.rsc.org/images/entities/char_2009.gif) H2 ratio is kept at a value between 4.10–4.15. This is selected to prevent any possible carbon deposition phenomenon in the reactor (especially in the hotspot region). The operation in excess H2 reduces the risk of forming carbon on the catalyst in all the known forms (amorphous, graphitic and carbide), by preventing the decomposition of methane. This was reported in literature both by thermodynamic calculations and by appropriate experimental investigation.37 The operation in slight excess of H2 is made possible by the specific grid injection regulations of Austria, which allow producing SNG with H2 content up to 10 vol% (Table 2). Fig. 2 shows that the grid compliant SNG is produced shortly after the start of the reaction, as soon as the initial H2 is purged out from the reactor. The produced SNG respects all the limits set by the regulations shown in Table 2. The temperature oscillates initially for approximately 20 minutes, showing a modification in the catalyst structure, which influences the extent of the reaction in the hotspot. This is probably due to the progressive translation from a completely reduced surface to a mixture of reduced and oxidised sites. After this phase, the temperature oscillations are limited in a ±3 °C interval, showing that the system reached steady state. Once this point is reached, the gas flow is increased to 70% and stabilised again. When steady-state conditions are reached, the load is increased to 100% and normal operation is performed. The reactor remained stable in the production of SNG for the entire operation time. The productivity recorded over the first 50 hours of operation is shown in appendix. As shown in Fig. 2, once the grid injection specifications are reached, the product gas remains compliant independently from the changes in the gas flow. The tendency to decrease the H2 content in the SNG, which can be observed in Fig. 2, is due to a progressive increase in the CO2 content in the biogas, which occurred during the day of the operation start-up. The production of SNG is constantly around 22 N m3 h−1, with small oscillations due to a slight variability in the biogas feed volume. During operation, the gas cleaning system successfully removed all the undesired compounds (sulfurated species and VOCs), so that their concentration was below the detection limits (see Table 1).
H2 ratio is kept at a value between 4.10–4.15. This is selected to prevent any possible carbon deposition phenomenon in the reactor (especially in the hotspot region). The operation in excess H2 reduces the risk of forming carbon on the catalyst in all the known forms (amorphous, graphitic and carbide), by preventing the decomposition of methane. This was reported in literature both by thermodynamic calculations and by appropriate experimental investigation.37 The operation in slight excess of H2 is made possible by the specific grid injection regulations of Austria, which allow producing SNG with H2 content up to 10 vol% (Table 2). Fig. 2 shows that the grid compliant SNG is produced shortly after the start of the reaction, as soon as the initial H2 is purged out from the reactor. The produced SNG respects all the limits set by the regulations shown in Table 2. The temperature oscillates initially for approximately 20 minutes, showing a modification in the catalyst structure, which influences the extent of the reaction in the hotspot. This is probably due to the progressive translation from a completely reduced surface to a mixture of reduced and oxidised sites. After this phase, the temperature oscillations are limited in a ±3 °C interval, showing that the system reached steady state. Once this point is reached, the gas flow is increased to 70% and stabilised again. When steady-state conditions are reached, the load is increased to 100% and normal operation is performed. The reactor remained stable in the production of SNG for the entire operation time. The productivity recorded over the first 50 hours of operation is shown in appendix. As shown in Fig. 2, once the grid injection specifications are reached, the product gas remains compliant independently from the changes in the gas flow. The tendency to decrease the H2 content in the SNG, which can be observed in Fig. 2, is due to a progressive increase in the CO2 content in the biogas, which occurred during the day of the operation start-up. The production of SNG is constantly around 22 N m3 h−1, with small oscillations due to a slight variability in the biogas feed volume. During operation, the gas cleaning system successfully removed all the undesired compounds (sulfurated species and VOCs), so that their concentration was below the detection limits (see Table 1).
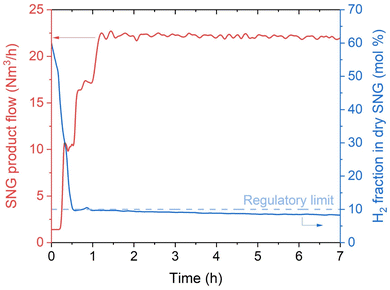 |
| | Fig. 2 Productivity and H2 fraction in SNG at the reactor outlet at the start-up of the biogas methanation plant (experimental conditions: 8 bar, H2![[thin space (1/6-em)]](https://www.rsc.org/images/entities/char_2009.gif) : :![[thin space (1/6-em)]](https://www.rsc.org/images/entities/char_2009.gif) CO2 = 4.15, cooling setpoint = 230 °C). The CO2 conversion is 100% in the entire time interval considered and no other products than methane were observed. CO2 = 4.15, cooling setpoint = 230 °C). The CO2 conversion is 100% in the entire time interval considered and no other products than methane were observed. | |
Table 2 Regulation limits for SNG injection in the natural gas grid in Austria38
| Compound |
Limit value |
| H2 [Vol%] |
<10% |
| CO2 [Vol%] |
<2% |
| N2 [Vol%] |
<5% |
| Wobbe index [kW h N−1 m−3] |
13.3–15.7 |
| Dew point [°C] |
−8 °C at 40 bar |
Fig. 3 shows the evolution of the maximum temperature recorded in the reactor (reduced time scale than in Fig. 2). At 50% load, the hotspot temperature is 545 °C, and it is recorded approximately 250 mm after the reactor inlet. At the beginning of operation, the hotspot is slightly higher due to the larger content of H2 in the reactor (start-up from H2 atmosphere). When the load is increased to 70%, the hotspot temperature increases at a turn to 560 °C. This is due to the larger heat production following the higher flow of reactants. At 100% load, the hotspot temperature is 580 °C and its location is shifted to the next measuring point. The increase in the hotspot and the change in the location of the maximum are due to the modification in the heat production and in the heat transfer properties with increased flow. This phenomenon will be analysed in detail with the appropriate model in the follow. When the load decreases from 100% to 70% and then to 50% the change in the temperature profile is similar to the ramping-up case, with a small hysteresis due to the slower cooling down of the catalytic bed. The hotspot temperature is significantly lower than what commonly reported in fixed bed reactors (min. 100 °C lower),22 showing the excellent heat transfer properties of the plate-type reactor. The hotspot temperature is higher than what reported for micro-structured reactors (hotspot about 450–500 °C).24 However, the reactor here presented shows a significantly simpler construction than these latter.
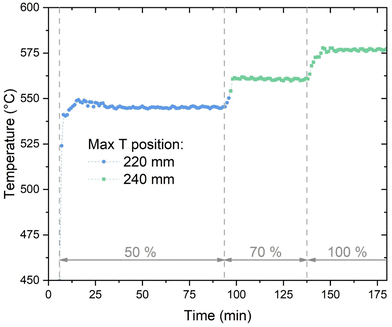 |
| | Fig. 3 The evolution of the maximum temperature in the methanation reactor (experimental conditions: 8 bar, H2![[thin space (1/6-em)]](https://www.rsc.org/images/entities/char_2009.gif) : :![[thin space (1/6-em)]](https://www.rsc.org/images/entities/char_2009.gif) CO2 = 4.15, cooling setpoint = 230 °C). CO2 = 4.15, cooling setpoint = 230 °C). | |
To assess the performance of the reactor beyond the operation point, the H2![[thin space (1/6-em)]](https://www.rsc.org/images/entities/char_2009.gif) :
:![[thin space (1/6-em)]](https://www.rsc.org/images/entities/char_2009.gif) CO2 ratio was varied both at 50% and at 100% load. The results of this variation are shown in Fig. 4. At 50% load, all the points at H2
CO2 ratio was varied both at 50% and at 100% load. The results of this variation are shown in Fig. 4. At 50% load, all the points at H2![[thin space (1/6-em)]](https://www.rsc.org/images/entities/char_2009.gif) :
:![[thin space (1/6-em)]](https://www.rsc.org/images/entities/char_2009.gif) CO2 < 4.2 show full CO2 conversion. The stoichiometric ratio could be pushed down until 4.1, resulting nonetheless in no CO2 in the product gas. This value is the limit to avoid operating in a regime thermodynamically favourable for carbon formation on the catalyst in the hotspot region. The thermodynamic limit for carbon deposition was defined according to the methodology elucidated in ref. 37. It is worth noticing that a reduction in the H2
CO2 < 4.2 show full CO2 conversion. The stoichiometric ratio could be pushed down until 4.1, resulting nonetheless in no CO2 in the product gas. This value is the limit to avoid operating in a regime thermodynamically favourable for carbon formation on the catalyst in the hotspot region. The thermodynamic limit for carbon deposition was defined according to the methodology elucidated in ref. 37. It is worth noticing that a reduction in the H2![[thin space (1/6-em)]](https://www.rsc.org/images/entities/char_2009.gif) :
:![[thin space (1/6-em)]](https://www.rsc.org/images/entities/char_2009.gif) CO2 ratio causes a decrease in the extent of the temperature hotspot, probably because of slower reaction kinetics at the reactor inlet due to the lower H2 partial pressure. At 100% load the trend is similar, but the measured H2 concentration at the reactor outlet is slightly above the stoichiometric limit. However, the unconverted CO2 concentration is small (below 0.3 vol%), resulting most of the times even below the detection limit of the analysis instrument. Note that the complete conversion of CO2 simplifies the eventual further SNG upgrading by membrane processing, in case lower H2 concentration is required by the grid injection limitations.39 The slight decrease in the performance with increasing load is due to the space velocity doubling, which doubles the heat produced in the reaction. However, this only slight degradation of the performance is an indicator of the excellent flexibility of the reactor, which can efficiently remove the reaction heat even with strong variations of the load. The effectiveness of heat removal system is highlighted in Fig. 5, which shows the temperature profile at 50%, 70% and 100% load. Note that an increase of the load causes an extension of the hotspot region in the reactor, which remains in any case limited to less than 300 mm. Furthermore, the decrease in the slope of the cooling curve at increasing space velocity is limited, suggesting that the cooling power remains high even at large space velocity. We observed that, in all the measurement points (on top and bottom of the reactor), the temperature of the coolant remains constant and equal to the boiling temperature at the set point pressure (28 bar). The properties of the temperature profiles will be discussed in larger detail in the following, by comparison with the modelling results.
CO2 ratio causes a decrease in the extent of the temperature hotspot, probably because of slower reaction kinetics at the reactor inlet due to the lower H2 partial pressure. At 100% load the trend is similar, but the measured H2 concentration at the reactor outlet is slightly above the stoichiometric limit. However, the unconverted CO2 concentration is small (below 0.3 vol%), resulting most of the times even below the detection limit of the analysis instrument. Note that the complete conversion of CO2 simplifies the eventual further SNG upgrading by membrane processing, in case lower H2 concentration is required by the grid injection limitations.39 The slight decrease in the performance with increasing load is due to the space velocity doubling, which doubles the heat produced in the reaction. However, this only slight degradation of the performance is an indicator of the excellent flexibility of the reactor, which can efficiently remove the reaction heat even with strong variations of the load. The effectiveness of heat removal system is highlighted in Fig. 5, which shows the temperature profile at 50%, 70% and 100% load. Note that an increase of the load causes an extension of the hotspot region in the reactor, which remains in any case limited to less than 300 mm. Furthermore, the decrease in the slope of the cooling curve at increasing space velocity is limited, suggesting that the cooling power remains high even at large space velocity. We observed that, in all the measurement points (on top and bottom of the reactor), the temperature of the coolant remains constant and equal to the boiling temperature at the set point pressure (28 bar). The properties of the temperature profiles will be discussed in larger detail in the following, by comparison with the modelling results.
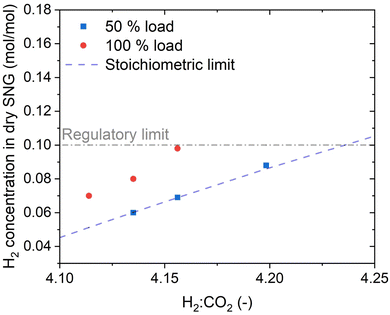 |
| | Fig. 4 The effect of stoichiometric ratio on the H2 concentration in the SNG (experimental conditions: 8 bar, cooling setpoint = 230 °C). | |
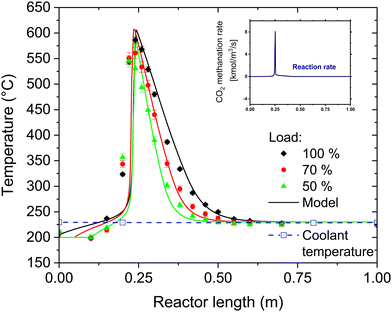 |
| | Fig. 5 Temperature profile at different load cases and modelling results (experimental conditions: 8 bar, H2![[thin space (1/6-em)]](https://www.rsc.org/images/entities/char_2009.gif) : :![[thin space (1/6-em)]](https://www.rsc.org/images/entities/char_2009.gif) CO2 = 4.15, CO2 CO2 = 4.15, CO2![[thin space (1/6-em)]](https://www.rsc.org/images/entities/char_2009.gif) : :![[thin space (1/6-em)]](https://www.rsc.org/images/entities/char_2009.gif) CH4 = 1 CH4 = 1![[thin space (1/6-em)]](https://www.rsc.org/images/entities/char_2009.gif) : :![[thin space (1/6-em)]](https://www.rsc.org/images/entities/char_2009.gif) 1, cooling setpoint = 230 °C, biogas flow = 22 N m3 h−1, 80 kg of catalyst in the reactor). The error bars refer to the variation of the temperature in the various experimental runs. In the insert, the calculated methane formation rate (mol L−1 s−1) is displayed. The temperature of the coolant remained constant over the entire reactor throughout the experimental tests. 1, cooling setpoint = 230 °C, biogas flow = 22 N m3 h−1, 80 kg of catalyst in the reactor). The error bars refer to the variation of the temperature in the various experimental runs. In the insert, the calculated methane formation rate (mol L−1 s−1) is displayed. The temperature of the coolant remained constant over the entire reactor throughout the experimental tests. | |
The operation of the PtG system can be analysed further by observing the energy flows and the overall energy balance. Fig. 6 reports the Sankey diagram of the whole plant. The power input corresponds to 352 kW and is composed of 188 kW of electricity for the operation of the electrolyser (53% of the total input), 130 kW of energy content of the biogas (37%) and 34 kW of utilities (10%, mainly electricity for the biogas compressor and cooling power for the chiller to bring the product gas to 5 °C). The electrolyser operates with ca. 75% efficiency,33 delivering 141 kW of H2 to the methanation reactor. In this way, the total input power to the methanation reactor is 305 kW. The reactor produces 248 kW of SNG as main product. Furthermore, by active reactor cooling, it is possible to produce 19 kW of steam at 30 bar. The remaining heat is contained in the product gas after the economiser. In the current version of the plant, this heat is removed with cooling water and not further used. This design selection was made mainly to minimize the CAPEX of the heating/cooling circuit. However, part of this heat may still be usable, as the outlet temperature from the economiser is ca. 150 °C. In particular, the condensation heat of the product water is not used here, even though this would correspond to approximately 7 kW at a temperature above 100 °C. The Sankey diagram allows calculating the process efficiencies, which are summarised in Table 3. The feed to SNG efficiency is ca. 70%, resulting from the averaging of biogas upgrading and CO2 conversion with H2. When steam is added in the product count, the efficiency increases to ca. 76%. In case an efficient use of the waste heat is envisaged (e.g. coupling with the biogas plant), the efficiency may rise to 79%, which is the target efficiency value of this PtG plant. These values locate the efficiency of renewable gas field in the upper limit of plants for biogas upgrading via PtG.4,39
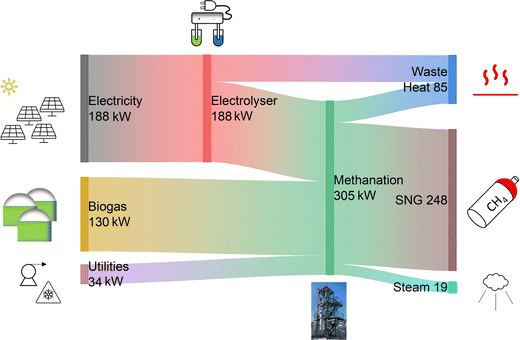 |
| | Fig. 6 Energy balance of the biogas methanation plant. | |
Table 3 The calculated process efficiencies
| Item |
Efficiency [%] |
|
Including complete heat utilization.
|
| Electrolysis33 |
75 |
| Feed to biomethane |
70 |
| Feed to products (incl. steam) |
76 |
| Feed to products (target)a |
79 |
3.2. Dynamics of the reactor
Thanks to the multipoint thermocouple inserted in one channel of the reactor, it is possible to record the temperature profile with high time and space resolution. The thermocouple covers the entire reactor, with 18 measurement points. The measurement points are not equally spaced, to improve the analysis of the reaction hotspot. The minimum spacing between two points is 20 mm, while the maximum spacing (end of the reactor) is 300 mm. The temperature profile during start-up of the reactor with the procedure described above (CO2 feed start in H2 atmosphere, 50% load) is shown in Fig. 7. Initially, the reactor is in hot standby, which means that the entire catalyst bed is kept at 230 °C by steam generated in the start-up heater. The feed gas at the reactor inlet is slightly colder than 200 °C, so that the temperature decreases by convective cooling in the immediate entrance of the reactor, as visible in the second and third point from the left in Fig. 7. At the start of the CO2 feed, the reaction starts almost immediately, but the conversion is low, and a limited hotspot is formed (ca. 70 °C). The gas is quickly cooled down and the reaction proceeds with low reaction rate until the reactor outlet. This low conversion regime continues for approximatively two minutes. After this time, the critical conditions for the sudden increase of the reaction rate are reached (parametric sensitivity40,41). The parametric sensitivity refers to the large change in the response of the reactor (i.e. maximum temperature), when a small change in the input parameters (e.g. feed or catalyst temperature) occurs. It is then observed that the hotspot quickly increases in extent together with the length involved in the reaction. After four minutes the hotspot extent reaches ca. 150 °C and its length is about 300 mm. After eight minutes the hotspot gets closer to the steady state, with a maximum temperature of 550 °C and an extension of ca. 400 mm. The system gets into a steady state, producing grid compliant SNG, in less than 10 minutes. This start-up time is significantly faster than normal fixed-bed reactors.22 This good performance is due to the good heat transfer of the reactor, which allows a quick adaptation of the conditions in the reactor (both in the direction of heating and cooling). These results suggest that the unit can be used for quick adaptation to the electricity availability, as the reactor is ready for production from hot stand-by in less than 10 minutes.
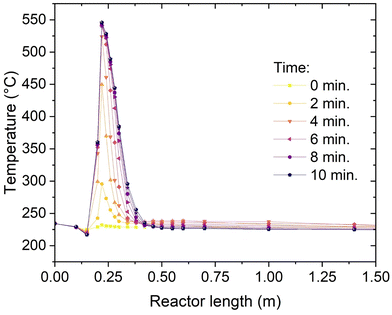 |
| | Fig. 7 Temperature profile at the start-up (experimental conditions: 8 bar, H2![[thin space (1/6-em)]](https://www.rsc.org/images/entities/char_2009.gif) : :![[thin space (1/6-em)]](https://www.rsc.org/images/entities/char_2009.gif) CO2 = 4.15, cooling set point = 230 °C). CO2 = 4.15, cooling set point = 230 °C). | |
An additional element of flexibility requested to the methanation reactor is the adaptation to load changes while in operation. To assess this element, the reactor was subject to step changes in the load from 50% to 70% and from 70% to 100%. The variation in the temperature profile over time is shown in Fig. 8. The adaptation of the temperature profile to the new conditions is fast and steady-state conditions are achieved in ca. 5 minutes. The transient shows two main trends: the maximum temperature increases (from 550 °C to 565 °C and from 565 °C to 580 °C for the 50–70% and 70–100% cases, respectively) and the hotspot length enlarges. In particular, the larger extension of the hotspot is accompanied by a movement of the higher temperature point, which is shifted to the next point of the thermocouple (from 220 mm below the reactor top to 240 mm, see Fig. 3). This shift is probably due to the different influence of convective heat transfer, resulting in a later reach of the equilibrium between thermodynamics and kinetics. This is made evident by the decrease of the temperature measured at the 200 mm point. This temperature decreases because of the larger flow velocity, which delays the reactor activation and increases the heat transfer towards the cooling medium. This trend reflects what shown in modelling studies.42,43
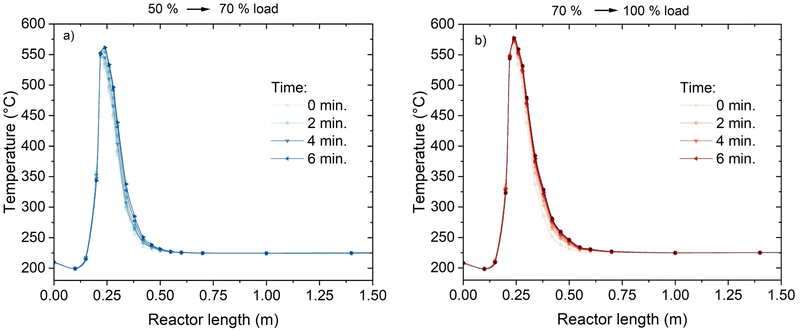 |
| | Fig. 8 Temperature profiles during the load variation: (a) from 50 to 70% load; (b) from 70 to 100% load (experimental conditions: 8 bar, H2![[thin space (1/6-em)]](https://www.rsc.org/images/entities/char_2009.gif) : :![[thin space (1/6-em)]](https://www.rsc.org/images/entities/char_2009.gif) CO2 = 4.15, cooling setpoint = 230 °C). CO2 = 4.15, cooling setpoint = 230 °C). | |
3.3. Reactor modelling
The understanding of the reactor behaviour can be extended by comparison with modelling results. The expected temperature trends and the confrontation with the experimental points are reported in Fig. 5. The experimental data points are obtained from multiple repetitions of the start-up procedure, which resulted in the same temperature profiles. To appropriately describe the experimental dataset, the model must consider the interphase heat and mass transfer limitations and include an axial heat dispersion term. This is in line with the results reported in literature.28,41 The model employed represents well the experimental data over the entire reactor axial coordinate. This is confirmed by the parity plot shown in Fig. 9, where almost all the points lie in the ± 10% interval. The most critical points are at the reaction initiation, where the model underestimates the temperature. This is due to the difficulty in predicting the reaction activation in conditions of strong parametric sensitivity. Furthermore, the kinetic model here utilised is not tailored to the catalyst employed, hence the discrepancy can be ascribed to this factor. The temperature in the hotspot is also slightly overestimated. In this case, the discrepancy may be due to the incertitude in the temperature management, as the temperature of the gas and of the solid is predicted as significantly different (the solid is ca. 20 °C hotter than the gas). The incertitude lies in the unclear temperature measured by the thermocouple, whether it is ascribed to the solid or to the gas phase. Additionally, the conductivity effect of the thermocouple is not considered in the model here employed. The cooling section is instead well interpreted by the model, hinting that the cooling process could follow the proposed mechanism. In this section, the reaction is controlled by cooling, therefore the description of the cooling mechanism is rate determining and the influence of the kinetic model used is less relevant. This is also made evident in the insert of Fig. 5, where the methane formation rate is reported. After the hotspot, the reaction rate drops to low values, coherently with the assumption of equilibrium controlled reaction. The different extent of the hotspot is also well interpreted by the model, suggesting that the reactor operates exactly with the proposed cooling mechanism.
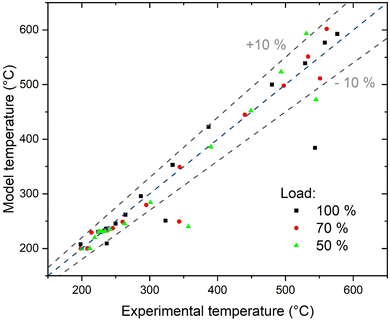 |
| | Fig. 9 Parity plot of the model. | |
Further insights into the reactor properties can be retrieved by analysing the calculated concentration profiles in the reactor. These are shown in Fig. 10. The curves follow typical profiles for the methanation reactor, like reported in literature.31,44,45 Starting from the inlet conditions, one can observe an initial zone where the temperature increases without significant methane production until approximately 350 °C. After this threshold, the reaction rate increases together with the temperature. The temperature increase follows a typical runaway profile, causing the reaction hotspot. The extension of the hotspot is controlled by the reach of thermodynamic equilibrium, which is at ca. 570 °C and 50% CH4 concentration in the dry gas. After the hotspot, the cooling is sufficient to decrease the temperature below the thermodynamic equilibrium line, hence maximising the reaction rate.42,46 This allows minimising the amount of catalyst needed to reach the target conversion, attaining the 90% CH4 content in the dry SNG at 300 °C after approximately 500 mm from the reactor inlet. From these results, one can deduce that the change in the extension of the hotspot is determined by the interplay of convective heat transfer and the heat produced. With increasing flow rate, the slope of the initial curve decreases, because the heat production is higher. Hence, the reach of the thermodynamic equilibrium line occurs at higher temperature and lower conversion. However, the increased heat production is balanced by the higher extent of convective heat transfer, so that the increase in the hotspot temperature is limited. Independently from the gas load at the reactor inlet, isothermal conditions are established in the second half of the reactor, allowing reaching high CO2 conversion. One can therefore conclude that the plate type heat exchanger reactor, cooled with boiling water, is an excellent solution for the methanation reaction, because it ensures the most suitable cooling conditions in a large set of experimental conditions.
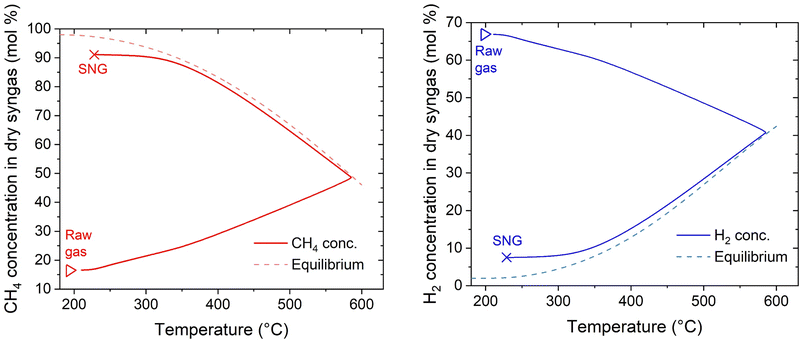 |
| | Fig. 10 Calculated concentration profiles in the reactor as a function of temperature (experimental conditions: 8 bar, H2![[thin space (1/6-em)]](https://www.rsc.org/images/entities/char_2009.gif) : :![[thin space (1/6-em)]](https://www.rsc.org/images/entities/char_2009.gif) CO2 = 4.15, CO2 CO2 = 4.15, CO2![[thin space (1/6-em)]](https://www.rsc.org/images/entities/char_2009.gif) : :![[thin space (1/6-em)]](https://www.rsc.org/images/entities/char_2009.gif) CH4 = 1 CH4 = 1![[thin space (1/6-em)]](https://www.rsc.org/images/entities/char_2009.gif) : :![[thin space (1/6-em)]](https://www.rsc.org/images/entities/char_2009.gif) 1, cooling setpoint = 230 °C, load = 100%). 1, cooling setpoint = 230 °C, load = 100%). | |
4. Conclusions
In this study, we presented selected results from the operation of a large-scale power-to-gas system, composed of a PV field, an electrolyser and a methanation reactor to produce synthetic natural gas from biogas. The system is designed to inject ca. 240 kW of SNG in the natural gas grid. The process produced grid compliant SNG in all the conditions tested and showed an excellent flexibility in terms of load changes. The plate-type methanation reactor could produce ca. 19 kW of high-pressure steam from the cooling system, bringing the inlet to valuable products efficiency to 76%.
It was demonstrated that the system can be directly operated from biogas with a limited amount of gas cleaning, hence showing that this type of system can help increasing the production of renewable gas maximising the utilisation of biogas and operating an effective coupling with other renewable resources (in this case PV electricity). The high efficiency of the system is a promising result envisaging the possibility of retrofitting biogas plant with this technology, to maximise the productivity of the process. The reactor can adapt to oscillations in the availability of the reactants, producing compliant SNG at loads between 50–100%, without decrease in the efficiency or in the quality of the product gas. The hot-standby to steady-state time is approximately 10 minutes, which makes the system highly flexible with respect to possible shortage of H2. The special design of the methanation reactor allows limiting the reaction hotspot below 600 °C, hence limiting the risk of catalyst deactivation by coking or sintering. The modelling results showed that the combination of large cooling surface and use of boiling water as cooling medium is the essential element allowing the maximisation of the reactor performance by optimising the heat exchange. The large cooling avoids operating at too high temperature, preventing damages to the catalyst. the cooling with boiling water allows reaching isothermal conditions in the second half of the reactor, ensuring the required high conversion.
According to the results presented in this study, the existing configuration of the ‘renewable gasfield’ is an ideal solution to ensure a maximal utilisation the renewable resources, allowing a reliable and flexible production of local sustainable gas. The plant could be easily replicated or scaled up according to the need of different biogas sites. An extensive application of the concept here presented could represent a ready to implement solution to substantially increase the production of renewable gas, contributing to the energetic autarchy and to the reduction of the CO2 footprint of natural gas users.
Author contributions
Emanuele Moioli: conceptualization, methodology, investigation, formal analysis, data curation, writing – original draft, writing – review & editing. Patrick Senn: conceptualization, methodology, investigation, writing – review & editing. Simon Østrup: conceptualization, investigation, writing – review & editing. Christoph Hütter: conceptualization, methodology, investigation, validation, supervision, funding acquisition.
Data availability
Data will be made available upon reasonable request.
List of symbols
Small letters
|
a
v
| Specific surface [m−1] |
|
c
i
| Concentration of the species i [mol m−3] |
|
c
p
| Specific heat [J mol−1 K−1] |
|
d
s
| Diameter of the solids [m] |
|
k
ax
| Axial heat transfer coefficient in the catalyst bed [W m−1 K−1] |
|
k
w
| Heat transfer coefficient in the wall [W m−1 K−1] |
|
k
i
| Kinetic constant of the reaction i |
|
n
| Apparent reaction order [−] |
|
r
i
| Radius [m] |
|
t
| Time [s] |
|
v
0
| Initial linear velocity [m s−1] |
|
y
i
| Molar fraction [−] |
Capital letters
|
A
| Reactor external surface [m2] |
|
A
b
| Surface of a bubble [m2] |
|
D
| Diffusion coefficient [m2 s−1] |
|
F
i
| Molar flow rate of the species i [mol s−1] |
|
H
| Reactor length [m] |
|
H
GS
| Heat transfer coefficient from the gas to the solid phase [W K−1 m−2] |
|
K
GS
| Mass transfer coefficient from the gas to the solid phase [mol m−2] |
|
K
eq
| Equilibrium constant [−] |
|
K
i
| Adsorption coefficient |
|
R
| Universal gas constant [J mol−1 K−1] |
|
S
p
| Particle surface area [m2] |
|
T
| Temperature [K] |
|
U
| Heat transfer coefficient [W m−2 K−1] |
|
V
p
| Particle volume [m3] |
|
X
i
| Conversion of the species i [−] |
|
Y
i
| Yield of the species i |
Adimensional numbers
| Nu | Nusselt number [−] |
| Pr | Prandtl number [−] |
| Re | Reynolds number [−] |
Small greek letters
|
ε
bed
| Bed porosity (considers the void volume in the bed) [−] |
|
ε
p
| Particle porosity (considers the void volume inside a particle) [−] |
|
η
| Catalyst effectiveness factor [−] |
|
v
i,j
| Stoichiometric coefficient fort he species i in the reaction j [−] |
|
ρ
i
| Density of the species i [kg m−3] |
|
ϕ
| Thiele modulus [−] |
|
μ
| Dynamic viscosity [Pa s] |
Capital greek letters
| ΔHRj | Reaction enthalpy in the reaction j [J mol−1] |
Conflicts of interest
The authors are employed by Hitachi Zosen Inova AG.
Appendix
Fig. 11 reports the CH4 concentration in the product SNG over the first 50 hours of operation of the reactor. the oscillations in the CH4 concentration are mainly due to the change in the biogas composition.
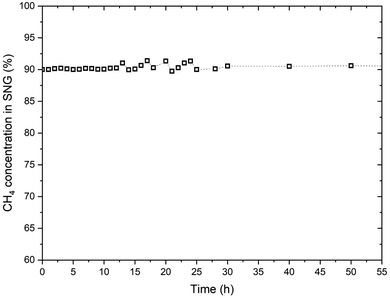 |
| | Fig. 11 The CH4 concentration in SNG over the first 50 hours of operation of the reactor. | |
Acknowledgements
The methanation reactor was installed in the project ‘Renewable Gas Field – a demonstration project as part of the energy model region WIVA P&G’ coordinated by Energie Steiermark AG. The project is funded by the Austrian climate and energy fund and runs within the scope of the program ‘Vorzeigeregion Energie’ (Funding institution: FFG, KPC Project number: 868849). The collaboration from the power-to-gas team of Hitachi Zosen Corporation (Japan) is greatfully acknowledged.
References
- S. Fogel, C. Yeates, S. Unger, G. Rodriguez-Garci, L. Baetcke, M. Dornheim, C. Schmidt-Hattenberge, D. Bruhn and U. Hampel, Energy Adv., 2022, 402–421 RSC.
- E. Panos, T. Kober and A. Wokaun, Appl. Energy, 2019, 252, 113470 CrossRef.
- H. Nazir, N. Muthuswamy, C. Louis, S. Jose, J. Prakash, M. E. Buan, C. Flox, S. Chavan, X. Shi, P. Kauranen, T. Kallio, G. Maia, K. Tammeveski, N. Lymperopoulos, E. Carcadea, E. Veziroglu, A. Iranzo and A. M. Kannan, Int. J. Hydrogen Energy, 2020, 45, 20693–20708 CrossRef CAS.
- J. Gorre, F. Ortloff and C. van Leeuwen, Appl. Energy, 2019, 253, 113594 CrossRef CAS.
- S. Roussanaly, M. Vitvarova, R. Anantharaman, D. Berstad, B. Hagen, J. Jakobsen, V. Novotny and G. Skaugen, Front. Chem. Sci. Eng., 2020, 14, 436–452 CrossRef CAS.
- I. Angelidaki, L. Treu, P. Tsapekos, G. Luo, S. Campanaro, H. Wenzel and P. G. Kougias, Biotechnol. Adv., 2018, 36, 452–466 CrossRef CAS PubMed.
- M. Prussi, M. Padella, M. Conton, E. D. Postma and L. Lonza, J. Cleaner Prod., 2019, 222, 565–572 CrossRef CAS PubMed.
- E. Moioli and T. Schildhauer, Renewable Sustainable Energy Rev., 2022, 158, 112120 CrossRef CAS.
- J. Witte, A. Kunz, S. M. A. Biollaz and T. J. Schildhauer, Energy Convers. Manage, 2018, 178, 26–43 CrossRef CAS.
- A. S. Calbry-Muzyka and T. J. Schildhauer, Front. Energy Res., 2020, 8 Search PubMed.
-
G. Leonzio, Power to Gas Systems Integrated with Anaerobic Digesters and Gasification Systems, Springer, Netherlands, 2019 Search PubMed.
- M. Burkhardt, T. Koschack and G. Busch, Bioresour. Technol., 2015, 178, 330–333 CrossRef CAS PubMed.
- A. Gantenbein, O. Kröcher, S. M. A. Biollaz and T. J. Schildhauer, Front. Energy Res., 2022, 9, 1–16 Search PubMed.
- P. Collet, E. Flottes, A. Favre, L. Raynal, H. Pierre, S. Capela and C. Peregrina, Appl. Energy, 2017, 192, 282–295 CrossRef CAS.
- B. D. Jønson, P. Tsapekos, M. Tahir Ashraf, M. Jeppesen, J. Ejbye Schmidt and J. R. Bastidas-Oyanedel, Bioresour. Technol., 2022, 365, 128160 CrossRef.
- E. Moioli, R. Mutschler, A. Borsay, M. Calizzi and A. Züttel, Chem. Eng. Sci. X, 2020, 8, 100078 CAS.
- E. Moioli, RSC Adv., 2022, 12, 10355–10365 RSC.
- M. Specht and U. Zuberbühler, Elem. Greenh. Gas Neutral Soc., 2013, 46 Search PubMed.
- R. Schlautmann, H. Böhm, A. Zauner, F. Mörs, R. Tichler, F. Graf and T. Kolb, Chem. Ing. Tech., 2021, 93, 568–579 CrossRef CAS.
- M. Zavarkó, A. R. Imre, G. Pörzse and Z. Csedő, Energies, 2021, 14, 1–26 CrossRef.
-
M. Specht, J. Brellochs, V. Frick, B. Stürmer and U. Zuberbühler, in Synthetic Natural Gas: From Coal, Dry Biomass, and Power-to-Gas Applications, ed. T. J. Schildhauer and S. M. A. Biollaz, Wiley-VCH Verlag, 1st edn, 2016, pp. 191–220 Search PubMed.
- C. Dannesboe, J. B. Hansen and I. Johannsen, React. Chem. Eng., 2020, 5, 183–189 RSC.
- J. Witte, A. Calbry-Muzyka, T. Wieseler, P. Hottinger, S. M. A. Biollaz and T. J. Schildhauer, Appl. Energy, 2019, 240, 359–371 CrossRef CAS.
- J. Guilera, T. Andreu, N. Basset, T. Boeltken, F. Timm, I. Mallol and J. R. Morante, Renew. Energy, 2020, 146, 1301–1308 CrossRef CAS.
-
T. Heller, in Presentation at of the Biomass for Swiss Energy Future Conference, Brugg, Switzerland, 2016 Search PubMed.
-
D. Hafenbradl, in Presentation at of the store & go final conference, Karlsruhe, Germany, 2020 Search PubMed.
-
Limeco, Media release Flagship project at Limeco in Dietikon: Inauguration of the first industrial power-to-gas plant in Switzerland, https://www.powertogas.ch/wp-content/uploads/220429_Medienmitteilung_EN_Einweihung_PtG-Anlage.pdf, (accessed 2 April 2023).
- B. Kreitz, G. D. Wehinger and T. Turek, Chem. Eng. Sci., 2019, 541–552 CrossRef CAS.
- J. Riese and M. Grünewald, Chem. Ing. Tech., 2020, 92, 1887–1897 CrossRef CAS.
- F. Herrmann, M. Grünewald, T. Meijer, U. Gardemann, L. Feierabend and J. Riese, Chem. Eng. Sci., 2022, 254, 117632 CrossRef CAS.
- E. Moioli, N. Gallandat and A. Züttel, Chem. Eng. J., 2019, 375, 121954 CrossRef CAS.
- Awite Gas Analysis Systems General Data|AWIFLEX|AWIFLEX XL, https://www.awite.de/wp-content/uploads/technical_data_sheet-awiflex-en-uk-10-rev14-04.pdf, accessed 22 March 2023.
- PEM Electrolyzer ME450_H-TEC Systems products, https://www.h-tec.com/en/products/detail/h-tec-pem-electrolyser-me450/me450/, accessed 24 March 2023.
-
H. Takano, Y. Kirihata, K. Izumiya and Y. Nishida, US2021275994A1, 2019.
- F. Koschany, D. Schlereth and O. Hinrichsen, Appl. Catal., B, 2016, 181, 504–516 CrossRef CAS.
- J. Xu and G. F. Froment, AIChE J., 1989, 35, 88–96 CrossRef CAS.
- C. H. Bartholomew, Catal. Rev., 1982, 24, 67–112 CrossRef CAS.
-
ÖVGW, RICHTLINIE GB210 Gasbeschaffenheit, 2021 Search PubMed.
- A. Gantenbein, J. Witte, S. M. A. Biollaz, O. Kröcher and T. J. Schildhauer, Chem. Eng. Sci., 2021, 229, 116012 CrossRef CAS.
- E. Moioli and A. Züttel, Sustain. Energy Fuels, 2020, 4, 1396–1408 RSC.
- D. Schlereth and O. Hinrichsen, Chem. Eng. Res. Des., 2014, 92, 702–712 CrossRef CAS.
- K. L. Fischer, M. R. Langer and H. Freund, Ind. Eng. Chem. Res., 2019, 58, 19406–19420 CrossRef CAS.
- J. Bremer, K. Rätzer and K. Sundmacher, AIChE J., 2017, 63, 23–31 CrossRef CAS.
- K. L. Fischer and H. Freund, Chem. Eng. J., 2020, 393, 124722 CrossRef CAS.
- D. Sun, F. M. Khan and D. S. A. Simakov, Chem. Eng. J., 2017, 329, 165–177 CrossRef CAS.
- A. El Sibai, L. K. Rihko Struckmann and K. Sundmacher, Energy Technol., 2017, 5, 911–921 CrossRef CAS.
|
| This journal is © The Royal Society of Chemistry 2024 |
Click here to see how this site uses Cookies. View our privacy policy here.  Open Access Article
 *,
Patrick
Senn
,
Simon
Østrup
and
Christoph
Hütter
![[thin space (1/6-em)]](https://www.rsc.org/images/entities/char_2009.gif) :
:![[thin space (1/6-em)]](https://www.rsc.org/images/entities/char_2009.gif) CH4 ratio is normally approximately 1
CH4 ratio is normally approximately 1![[thin space (1/6-em)]](https://www.rsc.org/images/entities/char_2009.gif) :
:![[thin space (1/6-em)]](https://www.rsc.org/images/entities/char_2009.gif) 1 vol/vol with ±5% oscillations possible. No biogas upgrading is performed in the plant. The raw biogas contains significant amounts of H2S (typically 150 ppm, but with possible spikes up to 300 ppm) and few ppm (normally 5–10 ppm) of volatile organic compounds (VOC). To remove these undesired components and to prevent damages to the methanation catalyst, two gas cleaning units are installed. The first unit is equipped with an activated carbon bed. The second unit is specific for desulfurization, and it is equipped with a sorbent from the Actisorb® series by Clariant (Switzerland), which is mainly composed of CuO. Both units operate in ambient conditions (no prior compression or heating). The cleaned biogas is compressed to 8 bar and mixed with H2 prior to feeding to the methanation reactor. The composition of raw and cleaned biogas is measured by an analysis system delivered by Awite Bioenergie GmbH (Germany). This system consists of a NDIR for CO2 and CH4 measurement, based on an infrared 2-beam sensor. The determination of H2S follows an electrochemical measuring principle. H2 is detected based on the thermal conductivity method.32 The measurement of the above-mentioned components is continuously operated. VOCs are quantified by means of gas chromatography, with an off-line procedure based on periodically sampling the raw and cleaned biogas.
1 vol/vol with ±5% oscillations possible. No biogas upgrading is performed in the plant. The raw biogas contains significant amounts of H2S (typically 150 ppm, but with possible spikes up to 300 ppm) and few ppm (normally 5–10 ppm) of volatile organic compounds (VOC). To remove these undesired components and to prevent damages to the methanation catalyst, two gas cleaning units are installed. The first unit is equipped with an activated carbon bed. The second unit is specific for desulfurization, and it is equipped with a sorbent from the Actisorb® series by Clariant (Switzerland), which is mainly composed of CuO. Both units operate in ambient conditions (no prior compression or heating). The cleaned biogas is compressed to 8 bar and mixed with H2 prior to feeding to the methanation reactor. The composition of raw and cleaned biogas is measured by an analysis system delivered by Awite Bioenergie GmbH (Germany). This system consists of a NDIR for CO2 and CH4 measurement, based on an infrared 2-beam sensor. The determination of H2S follows an electrochemical measuring principle. H2 is detected based on the thermal conductivity method.32 The measurement of the above-mentioned components is continuously operated. VOCs are quantified by means of gas chromatography, with an off-line procedure based on periodically sampling the raw and cleaned biogas.


![[thin space (1/6-em)]](https://www.rsc.org/images/entities/char_2009.gif) :
:![[thin space (1/6-em)]](https://www.rsc.org/images/entities/char_2009.gif) H2 ratio is kept at a value between 4.10–4.15. This is selected to prevent any possible carbon deposition phenomenon in the reactor (especially in the hotspot region). The operation in excess H2 reduces the risk of forming carbon on the catalyst in all the known forms (amorphous, graphitic and carbide), by preventing the decomposition of methane. This was reported in literature both by thermodynamic calculations and by appropriate experimental investigation.37 The operation in slight excess of H2 is made possible by the specific grid injection regulations of Austria, which allow producing SNG with H2 content up to 10 vol% (Table 2). Fig. 2 shows that the grid compliant SNG is produced shortly after the start of the reaction, as soon as the initial H2 is purged out from the reactor. The produced SNG respects all the limits set by the regulations shown in Table 2. The temperature oscillates initially for approximately 20 minutes, showing a modification in the catalyst structure, which influences the extent of the reaction in the hotspot. This is probably due to the progressive translation from a completely reduced surface to a mixture of reduced and oxidised sites. After this phase, the temperature oscillations are limited in a ±3 °C interval, showing that the system reached steady state. Once this point is reached, the gas flow is increased to 70% and stabilised again. When steady-state conditions are reached, the load is increased to 100% and normal operation is performed. The reactor remained stable in the production of SNG for the entire operation time. The productivity recorded over the first 50 hours of operation is shown in appendix. As shown in Fig. 2, once the grid injection specifications are reached, the product gas remains compliant independently from the changes in the gas flow. The tendency to decrease the H2 content in the SNG, which can be observed in Fig. 2, is due to a progressive increase in the CO2 content in the biogas, which occurred during the day of the operation start-up. The production of SNG is constantly around 22 N m3 h−1, with small oscillations due to a slight variability in the biogas feed volume. During operation, the gas cleaning system successfully removed all the undesired compounds (sulfurated species and VOCs), so that their concentration was below the detection limits (see Table 1).
H2 ratio is kept at a value between 4.10–4.15. This is selected to prevent any possible carbon deposition phenomenon in the reactor (especially in the hotspot region). The operation in excess H2 reduces the risk of forming carbon on the catalyst in all the known forms (amorphous, graphitic and carbide), by preventing the decomposition of methane. This was reported in literature both by thermodynamic calculations and by appropriate experimental investigation.37 The operation in slight excess of H2 is made possible by the specific grid injection regulations of Austria, which allow producing SNG with H2 content up to 10 vol% (Table 2). Fig. 2 shows that the grid compliant SNG is produced shortly after the start of the reaction, as soon as the initial H2 is purged out from the reactor. The produced SNG respects all the limits set by the regulations shown in Table 2. The temperature oscillates initially for approximately 20 minutes, showing a modification in the catalyst structure, which influences the extent of the reaction in the hotspot. This is probably due to the progressive translation from a completely reduced surface to a mixture of reduced and oxidised sites. After this phase, the temperature oscillations are limited in a ±3 °C interval, showing that the system reached steady state. Once this point is reached, the gas flow is increased to 70% and stabilised again. When steady-state conditions are reached, the load is increased to 100% and normal operation is performed. The reactor remained stable in the production of SNG for the entire operation time. The productivity recorded over the first 50 hours of operation is shown in appendix. As shown in Fig. 2, once the grid injection specifications are reached, the product gas remains compliant independently from the changes in the gas flow. The tendency to decrease the H2 content in the SNG, which can be observed in Fig. 2, is due to a progressive increase in the CO2 content in the biogas, which occurred during the day of the operation start-up. The production of SNG is constantly around 22 N m3 h−1, with small oscillations due to a slight variability in the biogas feed volume. During operation, the gas cleaning system successfully removed all the undesired compounds (sulfurated species and VOCs), so that their concentration was below the detection limits (see Table 1).

![[thin space (1/6-em)]](https://www.rsc.org/images/entities/char_2009.gif) :
:![[thin space (1/6-em)]](https://www.rsc.org/images/entities/char_2009.gif) CO2 = 4.15, cooling setpoint = 230 °C).
CO2 = 4.15, cooling setpoint = 230 °C).![[thin space (1/6-em)]](https://www.rsc.org/images/entities/char_2009.gif) :
:![[thin space (1/6-em)]](https://www.rsc.org/images/entities/char_2009.gif) CO2 ratio was varied both at 50% and at 100% load. The results of this variation are shown in Fig. 4. At 50% load, all the points at H2
CO2 ratio was varied both at 50% and at 100% load. The results of this variation are shown in Fig. 4. At 50% load, all the points at H2![[thin space (1/6-em)]](https://www.rsc.org/images/entities/char_2009.gif) :
:![[thin space (1/6-em)]](https://www.rsc.org/images/entities/char_2009.gif) CO2 < 4.2 show full CO2 conversion. The stoichiometric ratio could be pushed down until 4.1, resulting nonetheless in no CO2 in the product gas. This value is the limit to avoid operating in a regime thermodynamically favourable for carbon formation on the catalyst in the hotspot region. The thermodynamic limit for carbon deposition was defined according to the methodology elucidated in ref. 37. It is worth noticing that a reduction in the H2
CO2 < 4.2 show full CO2 conversion. The stoichiometric ratio could be pushed down until 4.1, resulting nonetheless in no CO2 in the product gas. This value is the limit to avoid operating in a regime thermodynamically favourable for carbon formation on the catalyst in the hotspot region. The thermodynamic limit for carbon deposition was defined according to the methodology elucidated in ref. 37. It is worth noticing that a reduction in the H2![[thin space (1/6-em)]](https://www.rsc.org/images/entities/char_2009.gif) :
:![[thin space (1/6-em)]](https://www.rsc.org/images/entities/char_2009.gif) CO2 ratio causes a decrease in the extent of the temperature hotspot, probably because of slower reaction kinetics at the reactor inlet due to the lower H2 partial pressure. At 100% load the trend is similar, but the measured H2 concentration at the reactor outlet is slightly above the stoichiometric limit. However, the unconverted CO2 concentration is small (below 0.3 vol%), resulting most of the times even below the detection limit of the analysis instrument. Note that the complete conversion of CO2 simplifies the eventual further SNG upgrading by membrane processing, in case lower H2 concentration is required by the grid injection limitations.39 The slight decrease in the performance with increasing load is due to the space velocity doubling, which doubles the heat produced in the reaction. However, this only slight degradation of the performance is an indicator of the excellent flexibility of the reactor, which can efficiently remove the reaction heat even with strong variations of the load. The effectiveness of heat removal system is highlighted in Fig. 5, which shows the temperature profile at 50%, 70% and 100% load. Note that an increase of the load causes an extension of the hotspot region in the reactor, which remains in any case limited to less than 300 mm. Furthermore, the decrease in the slope of the cooling curve at increasing space velocity is limited, suggesting that the cooling power remains high even at large space velocity. We observed that, in all the measurement points (on top and bottom of the reactor), the temperature of the coolant remains constant and equal to the boiling temperature at the set point pressure (28 bar). The properties of the temperature profiles will be discussed in larger detail in the following, by comparison with the modelling results.
CO2 ratio causes a decrease in the extent of the temperature hotspot, probably because of slower reaction kinetics at the reactor inlet due to the lower H2 partial pressure. At 100% load the trend is similar, but the measured H2 concentration at the reactor outlet is slightly above the stoichiometric limit. However, the unconverted CO2 concentration is small (below 0.3 vol%), resulting most of the times even below the detection limit of the analysis instrument. Note that the complete conversion of CO2 simplifies the eventual further SNG upgrading by membrane processing, in case lower H2 concentration is required by the grid injection limitations.39 The slight decrease in the performance with increasing load is due to the space velocity doubling, which doubles the heat produced in the reaction. However, this only slight degradation of the performance is an indicator of the excellent flexibility of the reactor, which can efficiently remove the reaction heat even with strong variations of the load. The effectiveness of heat removal system is highlighted in Fig. 5, which shows the temperature profile at 50%, 70% and 100% load. Note that an increase of the load causes an extension of the hotspot region in the reactor, which remains in any case limited to less than 300 mm. Furthermore, the decrease in the slope of the cooling curve at increasing space velocity is limited, suggesting that the cooling power remains high even at large space velocity. We observed that, in all the measurement points (on top and bottom of the reactor), the temperature of the coolant remains constant and equal to the boiling temperature at the set point pressure (28 bar). The properties of the temperature profiles will be discussed in larger detail in the following, by comparison with the modelling results.

![[thin space (1/6-em)]](https://www.rsc.org/images/entities/char_2009.gif) :
:![[thin space (1/6-em)]](https://www.rsc.org/images/entities/char_2009.gif) CO2 = 4.15, cooling set point = 230 °C).
CO2 = 4.15, cooling set point = 230 °C).
![[thin space (1/6-em)]](https://www.rsc.org/images/entities/char_2009.gif) :
:![[thin space (1/6-em)]](https://www.rsc.org/images/entities/char_2009.gif) CO2 = 4.15, cooling setpoint = 230 °C).
CO2 = 4.15, cooling setpoint = 230 °C).
![[thin space (1/6-em)]](https://www.rsc.org/images/entities/char_2009.gif) :
:![[thin space (1/6-em)]](https://www.rsc.org/images/entities/char_2009.gif) CO2 = 4.15, CO2
CO2 = 4.15, CO2![[thin space (1/6-em)]](https://www.rsc.org/images/entities/char_2009.gif) :
:![[thin space (1/6-em)]](https://www.rsc.org/images/entities/char_2009.gif) CH4 = 1
CH4 = 1![[thin space (1/6-em)]](https://www.rsc.org/images/entities/char_2009.gif) :
:![[thin space (1/6-em)]](https://www.rsc.org/images/entities/char_2009.gif) 1, cooling setpoint = 230 °C, load = 100%).
1, cooling setpoint = 230 °C, load = 100%).


