 Open Access Article
Creative Commons Attribution 3.0 Unported Licence
A rapid lithium-ion cathode discovery pipeline and its exemplary application†
Haoming Howard
Li
 ab,
Jimmy-Xuan
Shen
bc and
Kristin A.
Persson
 *ad
*ad
aDepartment of Materials Science and Engineering, University of California, Berkeley, CA 94720, USA. E-mail: haomingli@berkeley.edu; kapersson@lbl.gov
bMaterials Science Division, Lawrence Berkeley National Laboratory, Berkeley, CA 94720, USA
cMaterials Science Division, Lawrence Livermore National Laboratory, Livermore, CA 94550, USA
dMolecular Foundry, Lawrence Berkeley National Laboratory, Berkeley, CA 94720, USA
First published on 10th November 2023
Abstract
As Li-metal anodes become more readily available, next-gen Li-ion battery cathodes are no longer required to contain Li in their as-synthesized state, vastly expanding the materials search space. In order to identify potential cathode materials that do not necessarily contain Li in their native state, we here develop a computational screening pipeline for rapid cathode discovery. This pipeline operates on any database of inorganic materials without a priori information on Li sites and performs screening based on computed voltage, capacity from sequential insertions of Li ions and most importantly, mobility built upon the graph-based migration network obtained through site connectivity. A preliminary application of the pipeline was carried out on a subset of the materials project database, and one particular polymorph of MnP2O7 is shown here as an example of a new candidate compound which completed the pipeline and was selected for further, detailed analysis. The compound is shown to present a 2D ion migration topology, consisting of two separate intercalation pathways where the corresponding energy landscapes are calculated with the nudged-elastic band formalism. Acceptable energy barriers are found in the dilute (highly charged) limit, however the material is expected to exhibit slower kinetics in the vacancy (highly discharged) limit.
1 Introduction
The commercialization of Li-ion batteries (LIB) has enabled numerous major breakthroughs towards a more sustainable energy society; most notably, it has facilitated the advancement of electric vehicles and large-scale grid storage for electricity. However, as the demands grow for safer, cheaper and higher energy density LIBs, the search for next-gen LIB materials design has become a top priority. Researchers have entertained several directions to improve LIB design, such as Co-free cathodes,1–3 solid-state electrolytes,4–6 and Li-metal anodes.7–9 Among other advantages, Li-metal anodes promise a massive leap in theoretical energy capacity (3860 mA h g−1![[thin space (1/6-em)]](https://www.rsc.org/images/entities/char_2009.gif) 7 compared to 372 mA h g−1
7 compared to 372 mA h g−1![[thin space (1/6-em)]](https://www.rsc.org/images/entities/char_2009.gif) 10 for state-of-the-art graphite anodes), proving to be one of the most promising paths forward.
10 for state-of-the-art graphite anodes), proving to be one of the most promising paths forward.
Although technological challenges still remain, the scientific research community has made major progress towards device-ready Li-metal anodes, and potential improvements are addressed gradually through experimental and computational efforts.7–9,11,12 Importantly, today's Li-ion battery implementation with a graphite anode requires the cathode to supply the working Li-ions in the cell. With the adoption of Li metal anodes, the design space can be expanded to materials that do not contain Li in their native (charged) state, as long as they are able to reversibly intercalate Li ions and remain stable. The consideration of non-Li-containing materials opens up the search space, but also presents a challenge: how do we identify a viable cathode from an unbounded space of structures and chemical variations?
To accelerate the search for new Li-free cathode materials in such a large design space, we present a high-throughput computational screening pipeline capable of handling large datasets, while providing detailed information on compounds that pass the screening. The pipeline couples the materials project software infrastructure13 for high-performance first-principles computations with two recently developed algorithms by Shen et al.14,15 which (1) identify meta-stable working ion sites in any given host structure and (2) use those sites to present a graph-based migration network of working ion sites. The framework can be applied to any database of inorganic materials, greatly accelerating the process of identifying potential Li-free cathode materials in this expanded search space.
It should be acknowledged that recent publications by Zhang et al.16,17 address computational cathode design, as well as in-depth analysis of a particular structure, for sodium-based layered materials for Na-ion batteries. However, while the above previous work performs screening on structures that already contain the working Na-ions, the methodology in this study does not require the presence of any working ions (Li, Na, etc.), and therefore applies to a broader structure and chemistry space, as demonstrated in sections below.
2 Methodology
In the sections below, we show an overview of the procedures used in the rapid cathode discovery pipeline and present procedures of its exemplary application.2.1 Rapid cathode discovery pipeline
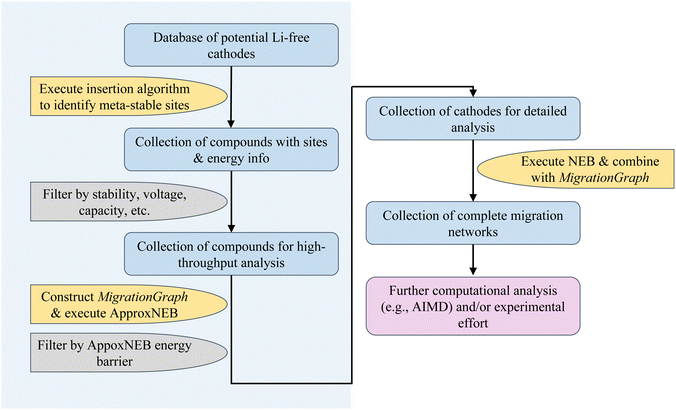
The diagram in Fig. 1 shows the general workflow of the rapid cathode discovery pipeline. It consists of two major components, starting with a set of high-throughput screening procedures, followed by a set of individual analysis procedures specific to the collection of resulting materials from the high-throughput efforts.In the first step, we apply the Shen et al. insertion workflow14 to a database of potential Li-free cathode structures with appropriate redox-active elements. Firstly, host structure relaxation calculations are carried out to obtain charge density information. The workflow then returns meta-stable working ion sites by performing analysis of the charge densities and sequentially calculating partially inserted structures until the resulting intercalated structure either cannot accept more working ions by redox state or no longer can be reasonably matched to the original host structure. The flexibility of this algorithm allows one to find potential working ion sites in any given host structure, yielding maximally lithiated structures where Li-ions occupying all potential meta-stable sites, as well as their calculated energies. All results from the insertion workflow are stored within the database.
Secondly, we screen compounds based on calculated properties obtained from results of the previous step, such as stability, voltage, capacity and energy density. The metric of choice to quantify stability is the energy per atom above the convex hull, which is defined by the most stable phases in the chemical space of interest; the energy above hull for the thermodynamically stable phase at 0 K is 0 meV per atom. The cutoff energy for stability as a function of working ion content can be adjusted by the user, however it is recommended to filter for compounds with <200 meV per atom above the convex hull as more unstable structures are either unlikely to be synthesizable or remain stable during discharge.18,19 Additionally, filters based on voltage and capacity are useful to comply with the thermodynamic stability window of electrolytes and to meet a certain performance standard.
Subsequently, the resulting working ion sites are used to construct a MigrationGraph.15 The framework of the MigrationGraph allows for the construction of intercalation pathways, which connects every working ion site to its periodic neighbor, with a number of “hops” connecting one meta-stable site to another. At this tier, compounds that exhibit no intercalation pathways are dismissed, since Li would not be able to migrate through the entire periodic structure without percolating pathways. In addition, this framework performs symmetry analysis and identifies groups of hops that are symmetrically equivalent, reducing the entire migration network into a smaller number of symmetrically unique hops, which is subsequently used to calculate by first-principles the energy profile of a single ion migration event.
ApproxNEB20 analysis is then carried out on the identified symmetrically unique hops from the previous step. The ApproxNEB energy barriers serve as yet another criterion for screening; structures with exclusively high-barrier intercalation pathways (the definition of which depends on the type of working ion; for Li ions 600 meV is here used as an upper cutoff) are discarded. This step completes the high-throughput part of the pipeline, leading to in-depth analyses of the screened materials.
Once promising materials are identified based on the criteria outlined, diffusion analysis is performed through nudged elastic band (NEB)21 calculations and a complete picture of the migration network, composed of a MigrationGraph and corresponding energy landscapes from NEB results, is constructed. This migration network describes one or more percolating pathways that connect one working ion site to its periodic image, with a calculated corresponding energy landscape. An example of a completed migration network will be shown in a later section. Further ab initio analysis (such as AIMD) can also be performed if desired. The resulting materials can then be transferred into experimental efforts for synthesis and electrochemical analysis, and thus the pipeline concludes.
2.2 Preliminary application of the pipeline
The materials project,13 a database of more than 150![[thin space (1/6-em)]](https://www.rsc.org/images/entities/char_2009.gif) 000 inorganic structures covering a massive chemical space, provides an ideal testing ground for this pipeline. As a proof of concept, a subset of the database was selected for testing. This subset of roughly 40
000 inorganic structures covering a massive chemical space, provides an ideal testing ground for this pipeline. As a proof of concept, a subset of the database was selected for testing. This subset of roughly 40![[thin space (1/6-em)]](https://www.rsc.org/images/entities/char_2009.gif) 000 materials consists of oxides, sulfides and fluorides that contain appropriate redox-active elements (Ti, V, Cr, Mn, Fe, Co, Ni, Cu, Nb, Mo, Ag, Sn, Sb, W, Se and Bi) with <0.2 eV per atom energy above hull. As a first step of screening, only compounds that contain reducible species are selected, and as a result, systems with redox-capable elements at their lowest oxidation state are discarded. After this step, the candidate pool size is reduced to about 26
000 materials consists of oxides, sulfides and fluorides that contain appropriate redox-active elements (Ti, V, Cr, Mn, Fe, Co, Ni, Cu, Nb, Mo, Ag, Sn, Sb, W, Se and Bi) with <0.2 eV per atom energy above hull. As a first step of screening, only compounds that contain reducible species are selected, and as a result, systems with redox-capable elements at their lowest oxidation state are discarded. After this step, the candidate pool size is reduced to about 26![[thin space (1/6-em)]](https://www.rsc.org/images/entities/char_2009.gif) 000. To obtain information on Li sites, voltage profile, capacity, and energy density, the insertion algorithm is performed on the structures in this subset, resulting in around 6000 successful candidates whose inserted structures match their host structures topotactically. No further attempts were initiated on materials discarded at this step. Subsequently, several additional filters are applied in a preliminary application of the presented framework. Here, we choose to restrict the average voltage to within 3 V to 4.5 V, and the stability (as defined by energy above the convex hull) to not exceed 50 meV per atom for the charged structure and 100 meV per atom for the discharged structure, which reduced the dataset to around 500 systems. Furthermore, the gravimetric and volumetric capacities have to be at least 100 mA h g−1 and 200 mA h cm−3, respectively (or, equivalently, 300 W h kg−1 and 600 W h L−1 for gravimetric and volumetric energy densities, given the 3 V voltage threshold). Notably, these limits are selected based on performance criteria and can be easily adjusted to allow for a broader analyses.
000. To obtain information on Li sites, voltage profile, capacity, and energy density, the insertion algorithm is performed on the structures in this subset, resulting in around 6000 successful candidates whose inserted structures match their host structures topotactically. No further attempts were initiated on materials discarded at this step. Subsequently, several additional filters are applied in a preliminary application of the presented framework. Here, we choose to restrict the average voltage to within 3 V to 4.5 V, and the stability (as defined by energy above the convex hull) to not exceed 50 meV per atom for the charged structure and 100 meV per atom for the discharged structure, which reduced the dataset to around 500 systems. Furthermore, the gravimetric and volumetric capacities have to be at least 100 mA h g−1 and 200 mA h cm−3, respectively (or, equivalently, 300 W h kg−1 and 600 W h L−1 for gravimetric and volumetric energy densities, given the 3 V voltage threshold). Notably, these limits are selected based on performance criteria and can be easily adjusted to allow for a broader analyses.
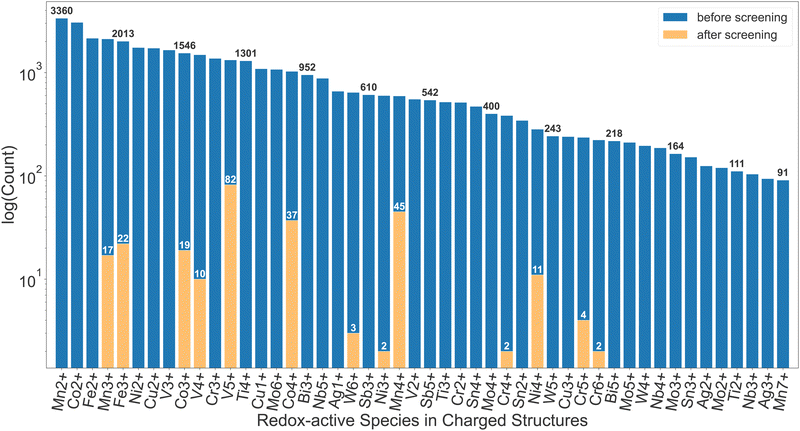
More than 200 promising systems have been identified as a result and are being further explored. Fig. 2 shows a comparison in the distribution of redox-active species before and after the screening. As shown in this comparison, the dataset before the screening contains a large number of ions that cannot be reduced, such as Mn2+, Co2+, Fe2+, etc., which are, as expected, discarded after the first screening tier. Furthermore, ions such as Cu2+, Ti4+, W6+etc. are commonly present until the insertion calculations and subsequent voltage screening. Some commonly seen high-voltage redox species, such as V5+, Co4+ and Mn4+,22 dominate the distribution after screening. Other known high-voltage redox species, such as Bi5+, are not present due to limitation of the dataset as well as the filter on stability, capacity and energy density. Apart from the diverse chemical range, the pipeline is also able to handle various types of structural motifs. In Section I of the ESI,† we provide energy landscapes of migration hops for some representative structure types, calculated with ApproxNEB. These structures contain Mn and V as redox-active elements, chosen for their prevalence in the candidate pool after screening, and include a variety of anions, ranging from oxides to polyanion groups such as BO4 and PO4. Furthermore, they encompass both layered and tunnel topologies, which the pipeline is able to handle well. It has identified in-layer migration hops along both directions in the 2-D layers, as well as in-tunnel and cross-tunnel hops in tunnel structures, and has yielded their ApproxNEB results, some of which are shown as sample plots in the ESI.†
Many of the aforementioned systems are being actively investigated, and as an example, we present one compound of interest MnP2O7 (identifier from the materials project: mp-26982), which completed the entire pipeline and serves as a demonstration case. The pipeline identified the host structure MnP2O7, successfully inserted one Li ion per formula unit – commensurate with the experimentally synthesized but electrochemically untested LiMnP2O723 – and further finds one more Li ion site to reach the fully discharged (to Mn2+) new compound Li2MnP2O7. The meta-stable sites are used to construct the topology of the ion migration network and the Li-ion mobility is evaluated in the charged and discharged states. In general, we emphasize that the framework can be applied to any database of inorganic structures with appropriate redox-active elements. Furthermore, this discovery pipeline can be readily applied to cathode discovery of other working ions, such as Na-ions and K-ions, by simply altering ion species in the insertion algorithm, and tuning parameters such as voltage cutoff and volume change tolerance.
3 Results & discussions
The following sections discuss the study on MnP2O7, the proof-of-concept system, in detail.3.1 Background information about MnP2O7
There are previous investigations24,25 into lithium manganese pyrophosphates as cathode materials, specifically the α-Li2MnP2O724 and the β-Li2MnP2O725 polymorphs have shown activity, albeit with low ion conductivity. However, the here identified MnP2O7 is structurally different such that α- and β-Li2MnP2O7 belong to space group P21/c, whereas the charged (MnP2O7), half-discharged (LiMnP2O7) and discharged (denoted γ-Li2MnP2O7) phases of the system of interest exhibit P21 symmetry, indicating the addition of a glide plane.Notably, the half-discharged LiMnP2O7 was synthesized by Ivashkevich et al.23 Although, to our knowledge, the particular system of LiMnP2O7 has not been evaluated electrochemically, isostructural compounds such as LiFeP2O7, LiFeAs2O7, and LiVP2O7, have shown the ability to cycle electrochemically.26 Rousse et al.27 synthesized VP2O7 by extracting Li from LiVP2O7, and observed an apparent irreversibility of 0.4 Li for VP2O7 at the first cycle. LiFeP2O7 and LiScP2O7 were found to exhibit “low lithium ion conductivity” by Vitins et al.28
In summary, while numerous polymorphs and isostructural pyrophosphate materials have been synthesized and tested electrochemically, the half-discharged LiMnP2O7 has been synthesized but not studied electrochemically, while the charged phase MnP2O7 and the discharged phase γ-Li2MnP2O7 has, to our knowledge, not been synthesized.
The experimental structure of LiMnP2O7 contains one lithium atom per formula unit, occupying what we here denote α sites. Through the insertion workflow, additional β sites are here identified, which provide one more lithium atom per formula unit. A detailed discussion of its crystal structure and migration network including both α and β sites will be shown in the following section.
3.2 Computational data for MnP2O7
The calculated voltage of Li2−xMnP2O7 upon discharge ranges from 4.57 V (MnP2O7–LiMnP2O7) to 3.64 V (LiMnP2O7–γ-Li2MnP2O7). Assuming full lithiation the theoretical capacity of MnP2O7 is 221 mA h g−1, and the theoretical energy density is 907 W h kg−1. The reaction at the cathode during discharge, where Mn4+ is reduced to Mn2+, is shown as follows:| MnP2O7 + 2Li+ + 2e− → Li2MnP2O7 | (1) |
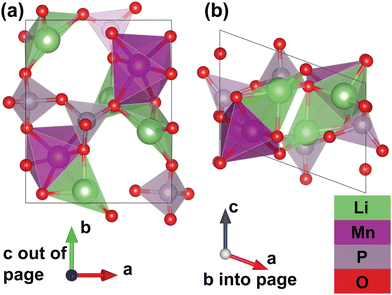
Furthermore, thanks to a set of additional meta-stable Li sites (β sites) identified by the pipeline, the system's migration network is expanded from one-dimensional (with only the experimental α site) to two-dimensional. The calculated structure of the fully discharged γ-Li2MnP2O7 system is shown in Fig. 3. This structure belongs to the P21 spacegroup, and exhibits calculated lattice parameters of a = 7.27 Å, b = 8.55 Å, c = 5.12 Å, and α = 90°, β = 110°, γ = 90°, with a tunnel along the lattice vector c direction. The Mn atoms corner-share with six P atoms from five different P2O7 groups; one P2O7 group “chelates” the Mn atom, meaning that both P atoms in the same group corner-share with the same Mn. Additionally, the Mn atoms edge-share with one Li ion (at the β site), and face-share with a different Li ion (at the α site), but do not share oxygen with another Mn atom. Li ion at α sites face-share with one manganese and corner-share with another, while corner-sharing with neighboring P atoms; Li ions at β sites edge-share with one Mn and corer-shares with another, while corner-sharing with neighboring P atoms. It should be noted that the fully delithiated structure, MnP2O7 shows roughly a 20% change in unit cell volume as compared to the fully lithiated structure but both structures are structure-matched within a tolerance of symprec = 0.01 and angle_tol = 5.0 via Spglib29 and ltol = 0.2 and stol = 0.3 via pymatgen.30
Furthermore, the intermediate half-discharged LiMnP2O7 phase displays Mn3+, a well-known Jahn–Teller active ion. Indeed, careful examination of the calculated structure reveals that the Mn3+ ions demonstrate Jahn–Teller distortion, in agreement with the experimental structure. MnO6 octahedra in the calculated structure exhibits a longer Mn–O bond length along the elongation axis (4.40 Å), by roughly 10%, than the Mn–O bond length perpendicular to the axis (3.95 Å).
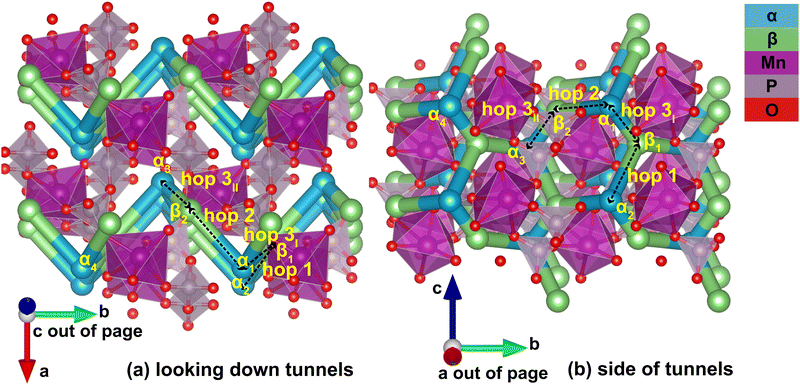
Identification of the meta-stable sites yields a complete picture of the migration network, constructed with the MigrationGraph. In Fig. 4, all meta-stable Li sites are shown as either an α (in-tunnel) site or a β (on tunnel-wall) site. A “hop” represents an event where a Li ion at one meta-stable site migrates to a neighboring meta-stable site, shown as connections between neighboring sites in Fig. 4. In the MigrationGraph of γ-Li2MnP2O7, every hop connects an α site and a β site. There are three symmetrically unique hops in this compound, labeled hops 1, 2 and 3; and all hops within the same symmetry family share the same chemical environments and energy landscapes. For example, in Fig. 4, hop 3I and hop 3II are symmetrically equivalent and thus have the same energy landscape, while hops 1 and 2 each exhibit different energy landscapes.
The resulting migration network generates the connectivity of this structure's 2-D ion migration topology. One pathway, denoted PathwayI, connects the α sites along the tunnel's direction; it is visualized as hop 3I (α1 to β1) and hop 1 (β1 to α2) in Fig. 4. Another pathway, denoted PathwayII, connects α sites in neighboring tunnels via a β site; it is shown as hop 2 (α1 to β2) and hop 3II (β2 to α3). Note that even though PathwayII does not connect one site to its periodic image, it allows for migration from one tunnel to another, enabling two-dimensional mobility in the structure. Moreover, simply repeating this pathway from α3 transports the Li ion to α4, the periodic image of the initial α1 site along the lattice vector b direction. This connectivity is used to initialize ApproxNEB and NEB calculations to add energy profiles to the migration pathways, whose results are shown in the following sections.
3.3 ApproxNEB results
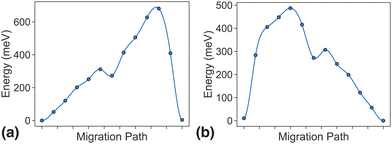
As discussed in the methodology section above, dilute limit ApproxNEB calculations serve as a high-throughput screening criterion based on ion mobility. For the MnP2O7 system, ApproxNEB analysis was performed on both intercalation pathways, the results of which are shown in Fig. 5. The ApproxNEB pathways exhibit energy barriers of 681 meV and 487 eV, one below and one slightly above the screening standard of 600 meV. Since this system has at least one pathway with barrier under the cutoff, it is qualified for further detailed NEB analysis. We show the more accurate energy profiles obtained through NEB, the final component of the migration network description, in the next two sections.3.4 NEB results in the dilute limit
In the dilute limit, only one Li ion is present in the simulation supercell with composition Li0.125MnP2O7, ensuring that periodic Li ions are at least 7 Å apart, to be representative of the dilute limit. Shown in Fig. 6 and 7 are the energy landscapes, calculated by NEB, of PathwayI and PathwayII in the dilute limit, respectively.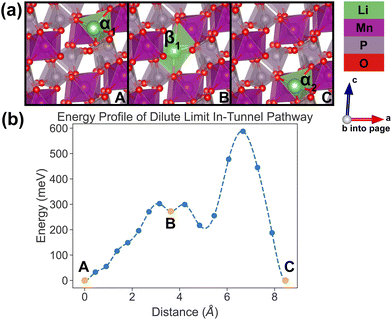 | ||
| Fig. 6 Li-ion evolution of the along-tunnel pathway (PathwayI) in the dilute limit. (a) Shows images along the pathway, and Li positions labeled α1, β1 and α2 have the same positions with identical labels in Fig. 4. (b) Shows calculated energy evolution as a function of Li migration distance, where labels α1, β1 and α2 correspond to the images in (a). | ||
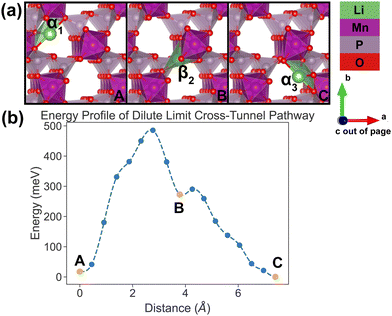 | ||
| Fig. 7 Li-ion evolution of the along-tunnel pathway (PathwayII) in the dilute limit. (a) Shows images along the pathway, and Li positions labeled α1, β2 and α3 have the same positions with identical labels in Fig. 4. (b) Shows calculated energy evolution as a function of Li migration distance, where labels α1, β2 and α3 correspond to the images in (a). | ||
For PathwayI in the dilute Li ion limit as shown in Fig. 6, the migrating Li ion first moves from an in-tunnel site (α1) to the nearest tunnel-wall site β1 (hop 3I in Fig. 4). The pathway then completes with a hop from β1 to α2 (hop 1 in Fig. 4), a periodic image of the initial site. This pathways takes a Li ion from an α site to another α site along the tunnel direction with an overall energy barrier of 588 meV.
For PathwayII in the dilute limit as shown in Fig. 7, the migrating Li ion initially resides in the in-tunnel site α1 as well. However, unlike in PathwayI, the Li ion hops to a tunnel-wall site β2 on the opposite side of the tunnel (hop 2 in Fig. 4). The Li+ then migrates to α3 site, which is in a different tunnel from initial α1 site (hop 3II in Fig. 4). This pathway has an overall energy barrier of 485 meV.
3.5 NEB results in the vacancy limit
In the vacancy limit, all except one Li site are occupied in the simulation supercell with composition Li1.875MnP2O7, ensuring that periodic Li vacancies are at least 7 Å apart, to be representative of the vacancy limit. Shown in Fig. 8 and 9 are the energy landscapes, calculated by NEB, of PathwayI and PathwayII in the vacancy limit, respectively.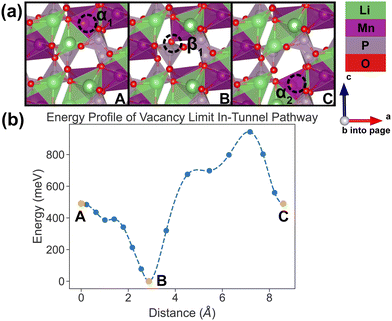 | ||
| Fig. 8 Li vacancy evolution of the along-tunnel pathway (PathwayI) in the vacancy limit. (a) Shows images along the pathway, where dashed circles indicate positions of vacancies; vacancy positions labeled α1, β1 and α2 have the same positions with identical labels in Fig. 4. (b) Shows calculated energy evolution as a function of vacancy migration distance, where labels α1, β1 and α2 correspond to the images in (a). | ||
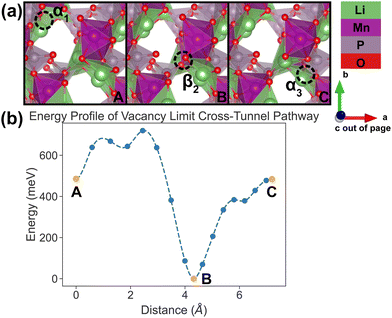 | ||
| Fig. 9 Li vacancy evolution of the cross-tunnel pathway (PathwayII) in the vacancy limit. (a) Shows images along the pathway, where dashed circles indicate positions of vacancies; vacancy positions labeled α1, β2 and α3 have the same positions with identical labels in Fig. 4. (b) Shows calculated energy evolution as a function of vacancy migration distance, where labels α1, β2 and α3 correspond to the images in (a). | ||
As shown in Fig. 8, PathwayI in the vacancy limit involves the vacancy, much like the Li ion in the dilute limit, migrating from α1 to the nearest β1 (hop 3I in Fig. 4) and then to α2 in the same tunnel (hop 1 in Fig. 4). This series of vacancy hopping is equivalent to the Li ion initially at β1 moving to α1, and subsequently the Li ion, which initially resides at α2, moves to β1. The calculated overall energy barrier for this pathway in the vacancy limit is 943 meV. One noteworthy feature of the energy landscape is that the midpoint configuration in the pathway (vacancy at β1) exhibits the lowest energy. This is intuitive since α sites have a lower insertion energy than β sites, and therefore the configuration with a vacant β site is more stable than one with a vacant α site.
In PathwayII, similar to its counterpart in the dilute limit, the vacancy moves from α1, via β2 on the opposite side of the tunnel (hop 2 in Fig. 4), to α3, in a neighboring tunnel (hop 3II in Fig. 4). Equivalently, the Li ion initially at β2 migrates to α1, followed by the Li ion at α3 migrating to β2. As mentioned above, the midpoint energy is the lowest because its configuration has two stable α sites filled and the less stable β site empty. The nudged-elastic-band calculation shows this pathway to exhibit an overall energy barrier of 719 meV.
4 Conclusions
A general and rapid cathode discovery pipeline for non-Li-containing materials is presented and implemented. Notably, the workflow does not need any a priori knowledge of Li sites. The pipeline is here applied to a subset of inorganic structures within the materials project and one particular compound, MnP2O7, emerges as an exemplary application of the pipeline. To our knowledge, this compound has not been explored electrochemically, but has been synthesized in its half-discharged state LiMnP2O7. The framework successfully identifies the correct first Li site according to the experimental results, and then proceeds to suggest another metastable Li site, completing the Mn4+ to Mn2+ redox reaction. The computationally identified Li+ migration network shows the structure to exhibit features of a 2-dimensional topology with two separate intercalation pathways parallel as well as perpendicular to the structure tunnels. In the dilute limit, these pathways show reasonable 588 meV and 485 meV of energy barriers, however in the vacancy limit, the ion migration barriers increase to 943 meV and 719 meV, respectively. Future work will focus on expanding the search space to all classes of Li-free inorganic compounds and combining efforts with experimental efforts to realize innovative cathode materials for LIB.Author contributions
H. H. L. performed the screening procedures and analysis, and contributed to visualizations and preparation of the manuscript; J. X. S. performed the insertion algorithm; K. A. P. provided supervising and funding at all stages and editing of the manuscript.Conflicts of interest
The authors have no conflicts to declare.Acknowledgements
The authors would like to thank Qian Chen for database management for the insertion algorithm calculations. The method development was supported by the Joint Center for Energy Storage Research, an Energy Innovation Hub funded by the US Department of Energy with additional support for software and data infrastructure was provided by the US Department of Energy, Office of Science, Office of Basic Energy Sciences, Materials Sciences and Engineering Division under contract no. DE-AC02-05-CH11231 (Materials Project program KC23MP). This work used computational resources provided by the National Energy Research Scientific Computing Center (NERSC), a U.S. Department of Energy Office of Science User Facility operated under Contract no. DE-AC02-05CH11231.Notes and references
- T. Liu, L. Yu, J. Liu, J. Lu, X. Bi, A. Dai, M. Li, M. Li, Z. Hu, L. Ma, D. Luo, J. Zheng, T. Wu, Y. Ren, J. Wen, F. Pan and K. Amine, Nat. Energy, 2021, 6, 277–286 CrossRef CAS.
- N. Voronina, Y.-K. Sun and S.-T. Myung, ACS Energy Lett., 2020, 5, 1814–1824 CrossRef CAS.
- Y. Kim, W. M. Seong and A. Manthiram, Energy Storage Mater., 2021, 34, 250–259 CrossRef.
- A. Manthiram, X. Yu and S. Wang, Nat. Rev. Mater., 2017, 2, 1–16 CrossRef.
- W. Zhao, J. Yi, P. He and H. Zhou, Electrochem. Energy Rev., 2019, 2, 574–605 CrossRef CAS.
- F. Lv, Z. Wang, L. Shi, J. Zhu, K. Edstroöm, J. Mindemark and S. Yuan, J. Power Sources, 2019, 441, 227175 CrossRef CAS.
- W. Xu, J. Wang, F. Ding, X. Chen, E. Nasybulin, Y. Zhang and J.-G. Zhang, Energy Environ. Sci., 2014, 7, 513–537 RSC.
- X. Zhang, Y. Yang and Z. Zhou, Chem. Soc. Rev., 2020, 49, 3040–3071 RSC.
- Y. Zhang, T.-T. Zuo, J. Popovic, K. Lim, Y.-X. Yin, J. Maier and Y.-G. Guo, Mater. Today, 2020, 33, 56–74 CrossRef CAS.
- J. Asenbauer, T. Eisenmann, M. Kuenzel, A. Kazzazi, Z. Chen and D. Bresser, Sustainable Energy Fuels, 2020, 4, 5387–5416 RSC.
- R. Zhang, N.-W. Li, X.-B. Cheng, Y.-X. Yin, Q. Zhang and Y.-G. Guo, Adv. Sci., 2017, 4, 1600445 CrossRef.
- Y. Zhao, Q. Sun, X. Li, C. Wang, Y. Sun, K. R. Adair, R. Li and X. Sun, Nano Energy, 2018, 43, 368–375 CrossRef CAS.
- A. Jain, S. P. Ong, G. Hautier, W. Chen, W. D. Richards, S. Dacek, S. Cholia, D. Gunter, D. Skinner, G. Ceder and K. A. Persson, APL Mater., 2013, 1, 011002 CrossRef.
- J.-X. Shen, M. Horton and K. A. Persson, npj Comput. Mater., 2020, 6, 1–7 CrossRef.
- J.-X. Shen, H. H. Li, A. Rutt, M. K. Horton and K. A. Persson, npj Comput. Mater., 2023, 9, 1–5 CrossRef.
- X. Zhang, Z. Zhang, S. Yao, A. Chen, X. Zhao and Z. Zhou, npj Comput. Mater., 2018, 4, 1–6 CrossRef.
- Z. Zhang, D. Wu, X. Zhang, X. Zhao, H. Zhang, F. Ding, Z. Xie and Z. Zhou, J. Mater. Chem. A, 2017, 5, 12752–12756 RSC.
- W. Sun, S. T. Dacek, S. P. Ong, G. Hautier, A. Jain, W. D. Richards, A. C. Gamst, K. A. Persson and G. Ceder, Sci. Adv., 2016, 2, e1600225 CrossRef.
- M. Aykol, S. S. Dwaraknath, W. Sun and K. A. Persson, Sci. Adv., 2018, 4, eaaq0148 CrossRef PubMed.
- Z. Rong, D. Kitchaev, P. Canepa, W. Huang and G. Ceder, J. Chem. Phys., 2016, 145, 074112 CrossRef PubMed.
- G. Henkelman, B. P. Uberuaga and H. Joónsson, J. Chem. Phys., 2000, 113, 9901–9904 CrossRef CAS.
- C. Liu, Z. G. Neale and G. Cao, Mater. Today, 2016, 19, 109–123 CrossRef CAS.
- L. Ivashkevich, K. Selevich, A. Lesnikovich, A. Selevich and A. Lyakhov, Z. Kristallogr., 2006, 221, 115–121 CAS.
- L. Adam, A. Guesdon and B. Raveau, J. Solid State Chem., 2008, 181, 3110–3115 CrossRef CAS.
- S.-I. Nishimura, R. Natsui and A. Yamada, Dalton Trans., 2014, 43, 1502–1504 RSC.
- C. Wurm, M. Morcrette, G. Rousse, L. Dupont and C. Masquelier, Chem. Mater., 2002, 14, 2701–2710 CrossRef CAS.
- G. Rousse, C. Wurm, M. Morcrette, J. Rodriguez-Carvajal, J. Gaubicher and C. Masquelier, Int. J. Inorg. Mater., 2001, 3, 881–887 CrossRef CAS.
- G. G. Vtinš, Z. Kanepe, A. Vtinš, J. Ronis, A. Dindūne and A. Lūsis, J. Solid State Electrochem., 2000, 4, 146–152 CrossRef.
- A. Togo and I. Tanaka, arXiv, 2018, arXiv:1808.01590 DOI:10.48550/arXiv.1808.01590.
- S. P. Ong, W. D. Richards, A. Jain, G. Hautier, M. Kocher, S. Cholia, D. Gunter, V. L. Chevrier, K. A. Persson and G. Ceder, Comput. Mater. Sci., 2013, 68, 314–319 CrossRef CAS.
Footnote |
| † Electronic supplementary information (ESI) available. See DOI: https://doi.org/10.1039/d3ya00397c |
| This journal is © The Royal Society of Chemistry 2024 |

