 Open Access Article
Facile synthesis of Z-scheme Fe-nPPy/BiOI nanocomposites for enhanced visible light driven photocatalytic activity†
Rajesh
Kumar
ab,
Rituporn
Gogoi
 a,
Kajal
Sharma
 a,
Astha
Singh
a and
Prem Felix
Siril
 *a
*a
aSchool of Chemical Sciences, Indian Institute of Technology Mandi, Mandi, Himachal Pradesh-175005, India. E-mail: prem@iitmandi.ac.in
bGovt. College Kullu, Himachal Pradesh-175101, India
First published on 14th November 2023
Abstract
Development of heterogeneous catalysts that are active in the visible light region is important for realizing the dream of using sunlight for effecting chemical transformations to achieve sustainability. In this work, conducting polymer (CP) and bismuth oxyiodide (BiOI) based Z-scheme nanocomposites were prepared at room temperature. The nanocomposite formation was confirmed by various analytical techniques. In comparison to pure BiOI and Fe-nPPy, the nanocomposite Fe-nPPy/BiOI-3 showed significantly enhanced activity for the photocatalytic degradation of crystal violet (CV) dye when exposed to visible light. Moreover, the photocatalyst was versatile for photocatalytic environmental remediation as it could also degrade pharmaceutical pollutant tetracycline (TC). The physical as well as optical properties of the prepared materials were thoroughly characterized. Proper alignment of band edge potential and better interfacial contact between Fe-nPPy and BiOI, reduces charge recombination in the nanocomposite and enable their better utilisation for the photocatalytic degradation reaction. Furthermore, the photogenerated electrons were found to be the primary reactive species responsible for the degradation process, as per radical trapping experiments.
Environmental significanceRemediating persistent organic pollutants from polluted water using sustainable processes is one of the most significant environmental challenges today. Heterogeneous photocatalysts that are active in the visible light region could offer a potential solution. Here, we report the development of a Z-scheme photocatalyst by nanocomposite formation between bismuth oxyiodide (BiOI) and polypyrrole using a room temperature procedure. Thus, a nanocomposite having high visible light photocatalytic activity which is versatile in photodegradation of persistent organic pollutants such as dyes and pharmaceutical drugs could be developed. |
1. Introduction
Photocatalysis, especially using freely available solar light, is gaining a lot of attention due to its importance in achieving sustainable development. Such photocatalysts should be active in visible light as it is the major constituent of solar light. Electron–hole pairs (charges) are generated in the photocatalyst when energy of the incident light matches with the band gap of the material. These electrons and holes can participate in various redox reactions on the surface of photocatalysts. However, photogenerated charges have a strong tendency for recombination. Therefore, there should be strategies to minimize the recombination of these photoexcited electron–hole pairs for efficient photocatalysis. Heterojunction nanocomposites are hence typically developed to enhance the range of light absorbance and reduce the recombination of photogenerated charges.1 This is the major theme of the present work.Layered materials such as bismuth oxyhalides (BiOX; X = Cl, Br and I) have received a lot of attention for photocatalytic energy conversion and environmental restoration, owing to their unique electronic and structural properties.2,3 Among BiOX, BiOI has the narrowest band gap (1.7–1.9 eV), making it suitable for harvesting the visible light portion of solar radiation.4 However, real-life applications of pristine BiOI are limited because of its low specific surface area, poor ability to harvest light, and high charge recombination rates.5 Therefore, it is imperative to engineer the pristine material to achieve better photocatalytic efficiencies. Nanostructuring, composition tuning, and heterojunction formation with metals and semiconductors have been attempted to enhance the photocatalytic activities of BiOI.5 Formation of a Z-scheme heterojunction nanocomposite between BiOI and semiconducting polypyrrole (nPPy) and the effect of their composition on photocatalysis are presented here.
In recent years, conducting polymers (CPs) have emerged as the popular class of metal free photocatalysts.1,6 Metal free catalysts are popular due to their low toxicity and cost while being more environmentally friendly than many metal-based catalysts. CPs can absorb visible light, making them potential candidates for photocatalysis using solar radiation.7,8 Nanostructuring and nanocomposite formation were found to be effective strategies to enhance the photocatalytic application of CPs.9–12 Among CPs, the high intrinsic electrical conductivity of nPPy13 renders it useful for the improvement of light absorption and charge separation at the interface in composite photocatalysts.14 The efficiency of semiconductor materials for photocatalysis has increased due to the incorporation of nPPy in PPy-Ag2MoO4,15 PPy-TiO2,16 PPy-BiVO4![[thin space (1/6-em)]](https://www.rsc.org/images/entities/char_2009.gif) 17 and PPy-BiOI nanocomposites.13
17 and PPy-BiOI nanocomposites.13
A limited number of reports on the synthesis of nPPy-BiOI nanocomposites are available in the literature.13,18,19 While most of these studies were related to the photo response of the materials, photocatalytic application of nPPy-BiOI nanocomposites was reported rarely.13 Although, metal free catalysts have many advantages, the residual presence of small amounts of metals/metal oxides in CPs often results in higher catalytic activity.11,20 In principle, metallic salts can be utilized as oxidizing agents for the polymerization of monomers, which themselves get converted to their metal/metal-oxide nanoparticles, resulting in the formation of heterojunction nanocomposites of CPs. For instance, we found that the residual presence of iron oxide in nPPy nanoparticles has a significant effect on photocatalytic dye degradation and photoreforming of plastic.11
In this study, a novel and mediator free Fe-nPPy/BiOI Z-scheme photocatalytic system has been demonstrated via facile two-step precipitation synthesis at room temperature. The Fe-nPPy/BiOI-3 nanocomposite was found to have increased photocatalytic efficiency (84%) than pure BiOI (35%) and Fe-nPPy (34%) for the visible light removal of CV dye.
2. Experimental section
2.1. Chemicals
Pyrrole monomers, anhydrous iron(III) chloride (FeCl3), CV dye, bismuth(III) nitrate pentahydrate (Bi(NO3)3·5H2O) and potassium iodide (KI) were purchased from Sigma-Aldrich. Acetone and absolute grade ethanol were purchased from Merck. All experiments used deionized water (DI water, 18.2 MΩ cm) that was acquired from an ELGA Pure Lab double-stage water purifier. All the chemicals are commercially available and used without any further purification.2.2 Material synthesis
![[thin space (1/6-em)]](https://www.rsc.org/images/entities/char_2009.gif) :
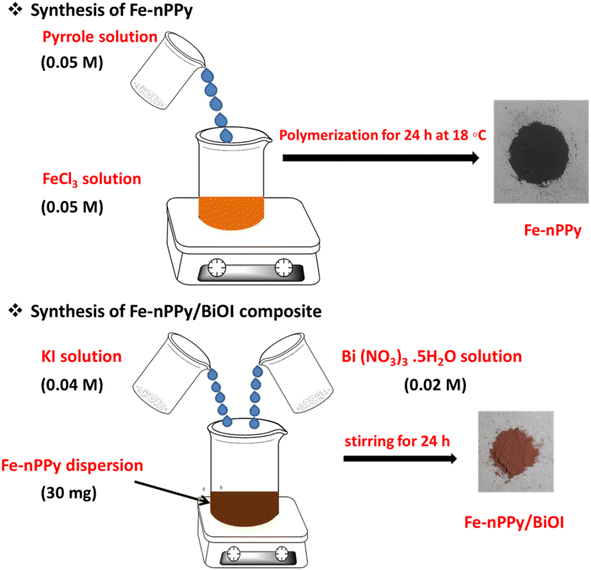
:![[thin space (1/6-em)]](https://www.rsc.org/images/entities/char_2009.gif) 1. Briefly, the solution of anhydrous FeCl3 (41 mg, 0.05 M) was prepared in DI (5 mL) and it was sonicated for 15 min so that complete dissolution was achieved. Pyrrole (17.6 μL, 0.05 M) was dissolved in acetone (10 mL) in a separate beaker. The pyrrole solution was injected into the FeCl3 solution dropwise with the help of a syringe, while this solution was magnetically stirred at 500 rpm. Precipitated Fe-nPPy particles were collected and washed several times using DI water followed by ethanol and finally dried in a vacuum oven at 60 °C.
1. Briefly, the solution of anhydrous FeCl3 (41 mg, 0.05 M) was prepared in DI (5 mL) and it was sonicated for 15 min so that complete dissolution was achieved. Pyrrole (17.6 μL, 0.05 M) was dissolved in acetone (10 mL) in a separate beaker. The pyrrole solution was injected into the FeCl3 solution dropwise with the help of a syringe, while this solution was magnetically stirred at 500 rpm. Precipitated Fe-nPPy particles were collected and washed several times using DI water followed by ethanol and finally dried in a vacuum oven at 60 °C.
2.3. Material characterization
An X-ray diffractometer (XRD, Rigaku SmartLab 9 kW rotating anode) with Ni-filtered Cu–K irradiation (λ = 0.1542 nm) and operating at 45 kV with a 200 mA source was used to investigate the crystal structure of the synthesized material. Using a 2° min−1 scan rate, the XRD analysis of all the materials was carried out in the 2θ range of 5–90°. For the purpose of assessing the morphology and elemental compositions, a field emission scanning electron microscope (FESEM, FEI Nova Nano SEM-450) with EDS (EDAX Ametek) was used. A FEI Tecnai G2 20 S-twin electron microscope fitted with a selective area electron diffractometer (SAED) operating at 200 keV was used to perform transmission electron microscopy (TEM) with high-resolution (HRTEM) imaging. Fourier transmission infrared (FTIR) spectra were obtained using an Agilent Technologies Cary 600 series instrument. The samples were digested in nitric acid before being analyzed using an Agilent 7850 apparatus for inductively coupled plasma-mass spectrometry (ICP-MS). Absorbance spectra in the wavelength range of 200 and 800 nm were recorded using a UV-Vis spectrophotometer (UV 2600 SHIMADZU). A PerkinElmer UV/Vis/NIR Lambda 750 spectrophotometer was used for recording the diffuse reflectance spectra (DRS) of the composites. Using aqueous samples of each material, photoluminescence (PL) spectra were acquired using the Fluorolog HORIBA scientific instrument. The scientific modular fluorescence lifetime system DeltaFlexTM HORIBA was utilized to conduct the time-resolved photoluminescence (TRPL) analysis. The X-ray photoelectron spectra (XPS) were recorded using a NEXSA photo-emission spectrometer from Thermo Scientific utilizing Al-Kα (1486.6 eV) X-ray energy. The narrow scan XPS spectra were deconvoluted using the Avantage software from Thermoscientific. The Perkin Elmer Pyris 1 instrument was utilized to conduct thermogravimetric analysis (TGA) in the temperature range of 25–800°. BET analysis was performed to find out surface area and pore size of nanocomposites using Autosorb-iQ-MP/XR (Quantachrome instruments) by obtaining the N2 gas adsorption–desorption isotherm at 77 K. A home-made photoreactor with white LEDs (4 × 48 W) was used to study the photocatalytic pollutant degradation. Two exhaust fans were used to dissipate the generated heat. In addition, an external air conditioner was also used to maintain the room temperature.2.4. Photocatalytic activity test
The prepared materials were employed as catalysts for the photodegradation of CV dye. The photocatalyst (0.5 mg mL−1) was magnetically stirred under dark conditions with aqueous solution of CV (10 mg L−1) for 30 min to establish the adsorption–desorption equilibrium. The pollutant concentration at 30 min was considered to be the initial concentration (C0). The solution was then irradiated using the photoreactor under constant magnetic stirring for 120 min. Aliquots (1 mL) were withdrawn at fixed time intervals (30 min) and centrifuged at 10![[thin space (1/6-em)]](https://www.rsc.org/images/entities/char_2009.gif) 000 rpm for 5 min to remove the heterogeneous catalyst and UV-Vis absorbance spectra were recorded. The best photocatalyst (Fe-nPPy/BiOI-3) was additionally employed for the degradation of a colorless pollutant, tetracycline (TC), to confirm its versatility. The percentage degradation of CV and TC was calculated using the following formula:
000 rpm for 5 min to remove the heterogeneous catalyst and UV-Vis absorbance spectra were recorded. The best photocatalyst (Fe-nPPy/BiOI-3) was additionally employed for the degradation of a colorless pollutant, tetracycline (TC), to confirm its versatility. The percentage degradation of CV and TC was calculated using the following formula:| Degradation efficiency (%) = (1 − At/A0) × 100 |
3. Results and discussion
3.1. Synthesis and structural analysis
Fe-nPPy was used as one of the precursors for preparing Fe-nPPy/BiOI nanocomposites. Fe-nPPy was prepared by one pot COP as shown in Fig. 1.11 Fe-nPPy was found to be a valuable visible light active photocatalyst for the removal of pollutants and photoreforming plastic waste.11 Hence, the Fe-nPPy/BiOI nanocomposites were synthesized via in situ growth of BiOI in the presence of Fe-nPPy under ambient reaction conditions, as presented in Fig. 1. In addition, BiOI was also prepared as a control. BiOI was red and Fe-nPPy was black in color while the Fe-nPPy/BiOI nanocomposites were reddish brown in color.XRD analysis of the nanocomposites was performed to compare their solid-state characteristics with those of Fe-nPPy and BiOI as shown in Fig. 2a and Fig. S1a (ESI†). Fe-nPPy was amorphous in nature. Moreover, the characteristic diffraction peaks for α-Fe2O3 in Fe-nPPy were absent due to its meagre presence.11 The diffraction pattern matched well with the standard tetragonal BiOI (JCPDS 10-0445). The presence of crystalline BiOI was seen predominantly in the XRD pattern of the nanocomposites. Moreover, intensity of the BiOI peaks (ESI Fig. S1(a)†) increased in the nanocomposites with the increase in the concentration of BiOI.
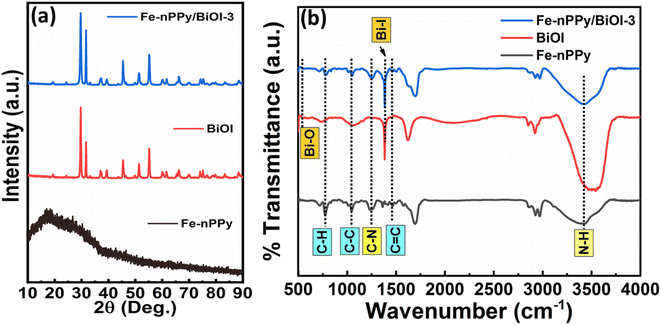 | ||
| Fig. 2 (a) XRD patterns of Fe-nPPy, BiOI and Fe-nPPy/BiOI-3 and (b) FTIR spectra of Fe-nPPy, BiOI and Fe-nPPy/BiOI-3. | ||
FTIR spectra were recorded to investigate and compare the functional groups present in Fe-nPPy, BiOI and the Fe-nPPy/BiOI-3 nanocomposite as shown in Fig. 2b. A broad band in the region from 3484–3180 cm−1 corresponds to N–H stretching vibration in nPPy rings,21 which is also evident in the nanocomposite. Peaks at 1460 cm−1 correspond to C![[double bond, length as m-dash]](https://www.rsc.org/images/entities/char_e001.gif) C backbone stretching vibration in the nPPy ring. These peaks were present in the nanocomposite at a slightly higher wavenumber. This may be due to intermolecular interactions between nPPy and BiOI at the interfaces. C–C ring stretching and C–N out of plane deformation vibrations in the nPPy ring are present at 1043 and 1251 cm−1, respectively. Peaks at 778 cm−1 are assigned to C–H out of plane deformation vibration mode of the nPPy ring. The peak at 1378 cm−1 for BiOI and the nanocomposite is due to Bi–I asymmetric and symmetric stretching vibration.22 The characteristic Bi–O vibrational stretching frequency for BiOI was observed at around 528 cm−1.23 Furthermore, FTIR spectra of all the nanocomposites (Fe-nPPy/BiOI-1, Fe-nPPy/BiOI-2, Fe-nPPy/BiOI-3, and Fe-nPPy/BiOI-4) were recorded and are shown in the ESI (Fig. S1(b)†). It was evident from the FTIR analysis that the peak positions were slightly shifted towards a higher wavenumber in the nanocomposites, due to the interaction between BiOI and Fe-nPPy.
C backbone stretching vibration in the nPPy ring. These peaks were present in the nanocomposite at a slightly higher wavenumber. This may be due to intermolecular interactions between nPPy and BiOI at the interfaces. C–C ring stretching and C–N out of plane deformation vibrations in the nPPy ring are present at 1043 and 1251 cm−1, respectively. Peaks at 778 cm−1 are assigned to C–H out of plane deformation vibration mode of the nPPy ring. The peak at 1378 cm−1 for BiOI and the nanocomposite is due to Bi–I asymmetric and symmetric stretching vibration.22 The characteristic Bi–O vibrational stretching frequency for BiOI was observed at around 528 cm−1.23 Furthermore, FTIR spectra of all the nanocomposites (Fe-nPPy/BiOI-1, Fe-nPPy/BiOI-2, Fe-nPPy/BiOI-3, and Fe-nPPy/BiOI-4) were recorded and are shown in the ESI (Fig. S1(b)†). It was evident from the FTIR analysis that the peak positions were slightly shifted towards a higher wavenumber in the nanocomposites, due to the interaction between BiOI and Fe-nPPy.
TGA was performed to understand the relative thermal stability and chemical composition of Fe-nPPy/BiOI-3 when compared to Fe-nPPy and BiOI (Fig. 3). Minor mass loss at low temperature (<130 °C) was observed for Fe-nPPy, which could be due to the elimination of low boiling solvents including water and the oligomeric fragments. The polymer chain in Fe-nPPy was completely decomposed at higher temperature (>600 °C).24 A small amount of the residual mass indicates the meager presence of α-Fe2O3 in Fe-nPPy. Fe-content was confirmed by ICP-MS to be about 0.92% (by weight). BiOI started to lose mass at around 400 °C and lost around 30% of its mass by 800 °C to form Bi2O3.25 However, Fe-nPPy/BiOI-3 started to lose its mass at around 350 °C due to the degradation of nPPy in it. Moreover, the additional mass loss of about 10% in Fe-nPPy/BiOI-3 when compared to BiOI is due to the depolymerization of nPPy. Thus, Fe-nPPy/BiOI-3 contained about 10% (by mass) of Fe-nPPy. This is close to the theoretically expected value (12.4% by weight), according to the composition of reactants.
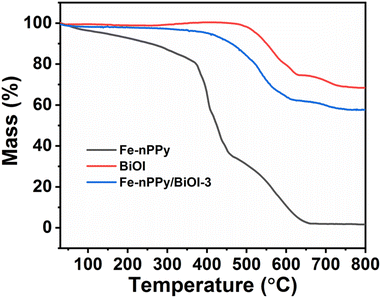 | ||
| Fig. 3 TGA thermal curves of Fe-nPPy, BiOI and the Fe-nPPy/BiOI-3 nanocomposite under a nitrogen atmosphere. | ||
Furthermore, XPS analysis was performed to know the surface elemental composition of the synthesized samples. The survey spectrum in the ESI (Fig. S2†) shows that the elements, C, O, N, I and Bi are present in the nanocomposite. The narrow scan XPS spectra of C 1s, O 1s, I 3d, Bi 4f and N 1s of Fe-nPPy/BiOI-3 are shown in Fig. 4(b–e). Furthermore, C 1s XPS peaks were fitted with three deconvoluted peaks (Fig. 4b). The peaks at 284.7 and 285.8 eV are due to β and α-carbon in pyrrole rings respectively.13 The C–N bond in the pyrrolic chain is responsible for the peak at 287.9 eV.26 The narrow scan spectrum for O 1s shows two peaks at 532.2 and 529.9 eV in Fig. 4c, which correspond to the binding energies of oxygen in the lattice and the surface, respectively.27 Two significant peaks can be seen in the narrow scan XPS spectrum for I 3d, one at 630.3 and another at 618.8 eV, respectively (Fig. 4d). They are attributed to I 3d3/2 and I3d5/2 of I−, respectively.23 Moreover, our analysis revealed the presence of a doublet peak at lower binding energies for Bi 4 f5/2 and 4 f7/2 at 163.1 and 157.7 eV, respectively (Fig. 4e). This is indicative of the existence of the lower oxidation state of Bi following the formation of the nanocomposite. Furthermore, the N 1s peak exhibited a shift towards higher binding energy (Fig. 4f), providing evidence of an interaction between Bi (from BiOI) and N (from PPy). These findings demonstrate the successful formation of a nanocomposite. The existence of a small amount of residual Fe was found in the XPS peak profile of the nanocomposite Fe-nPPy/BiOI-3 (ESI Table S1†). However, the peak corresponding to Fe could not be deconvoluted in the narrow scan XPS spectra due to its trace level presence (ESI Fig. S3†).
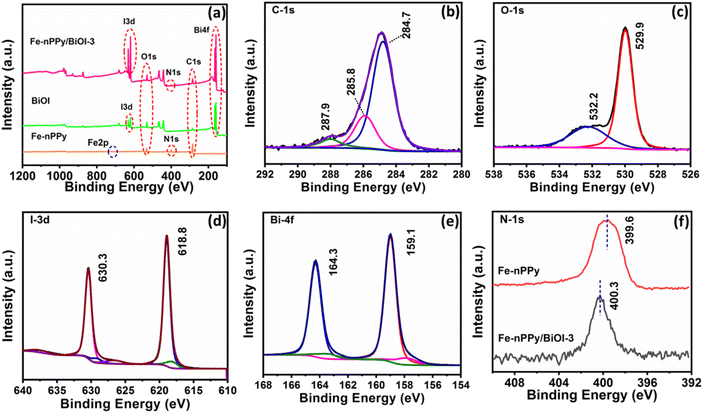 | ||
| Fig. 4 XPS spectra: (a) survey spectra of Fe-nPPy, BiOI and Fe-nPPy/BiOI-3 and (b) C-1s, (c) O-1s, (d) I-3d and (e) Bi-4f of Fe-nPPy/BiOI-3 and (f) N-1s of Fe-nPPy and Fe-nPPy/BiOI-3. | ||
3.2. Morphological and compositional studies
FESEM images of Fe-nPPy and BiOI are shown in Fig. S4.† Spherical particles of nPPy having size in the range of 200 to 500 nm were evident from FESEM images, similar to the previously reported values.18 Typical nanosheets of BiOI forming flower like aggregates were evident from the FESEM images. Average edge length of the BiOI nanosheets was 100–200 nm. The microstructure of Fe-nPPy/BiOI-3 was visualized using FESEM and TEM imaging as shown in Fig. 5. The particle morphology of Fe-nPPy/BiOI-3 was similar to that of pure BiOI. However, it was difficult to spot the presence of PPy due to the vast difference in atomic masses of Bi/I in BiOI and C/N in PPy. The (110) lattice of tetragonal BiOI was evident in the HRTEM image (Fig. 5c) with lattice fringes with an interval of 0.29 nm. However, there were domains with no lattice fringes corresponding to the presence of amorphous Fe-nPPy in the nanocomposite. Selected area electron diffraction (SAED) patterns showed a single set of diffraction spots which indicate the presence of crystalline BiOI in the nanocomposite (Fig. 5d). The as-prepared Fe-nPPy/BiOI-3 crystals have a special anisotropy that mainly grows along the (110) crystallographic plane, which was seen in the XRD data as mentioned earlier. This further indicated that BiOI incorporated Fe-nPPy/BiOI has highly exposed (001) facets.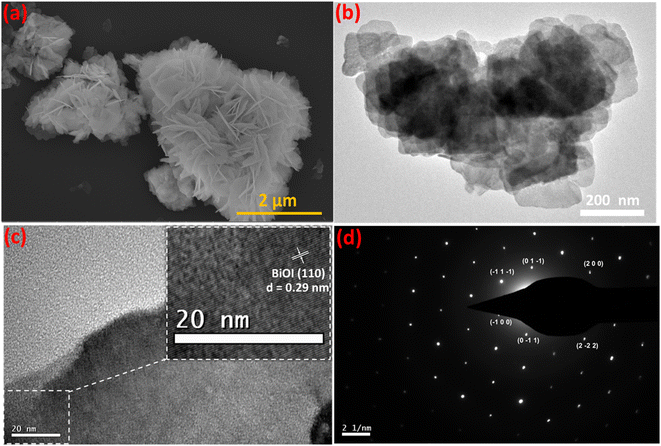 | ||
| Fig. 5 Particle and microstructure of Fe-nPPy/BiOI-3: (a) FESEM image, (b) TEM image, (c) HRTEM image and (d) SAED pattern. | ||
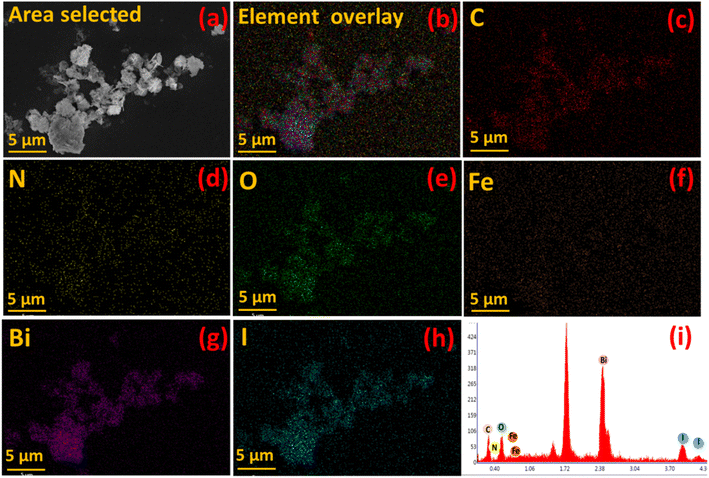
Furthermore, elemental mapping of C, N, O, Fe, Bi and I in Fe-nPPy/BiOI-3 was performed using an EDX attached to the FESEM and is shown in Fig. 6(c–h). Intensities of C, O, Bi and I were stronger than those of N and Fe in the elemental map and the EDX spectrum (Fig. 6i). This is according to the chemical composition of the material. Moreover, the co-existence of all the major elements (C, O, Bi and I) in the nanocomposite Fe-nPPy/BiOI-3 was evident, confirming the successful incorporation of Fe-nPPy in the BiOI nanosheets.
3.3. Optical properties
DRS of Fe-nPPy/BiOI-3 were recorded and compared with those of BiOI and Fe-nPPy in Fig. 7a. Pure BiOI absorbs in the UV and visible regions up to about 650 nm. However, Fe-nPPy/BiOI-3 showed the ability to absorb light in the NIR region also, in addition to UV and visible regions, due to the incorporation of Fe-nPPy. Moreover, the Kubelka–Munk function model was applied for the band gap calculations using the relation:28| αhν = A (hν − Eg)n |
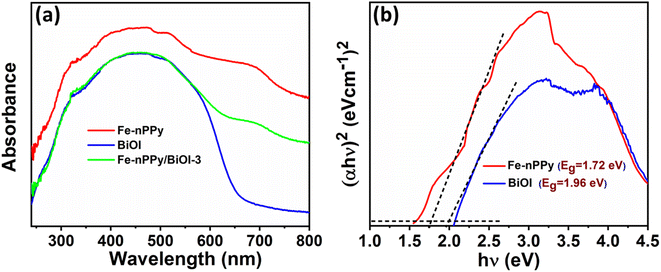 | ||
| Fig. 7 Optical properties of Fe-nPPy, BiOI and Fe-nPPy/BiOI-3: (a) DRS spectra and (b) Tauc plots for band gap calculation of Fe-nPPy and BiOI. | ||
3.4. Photocatalytic activity studies
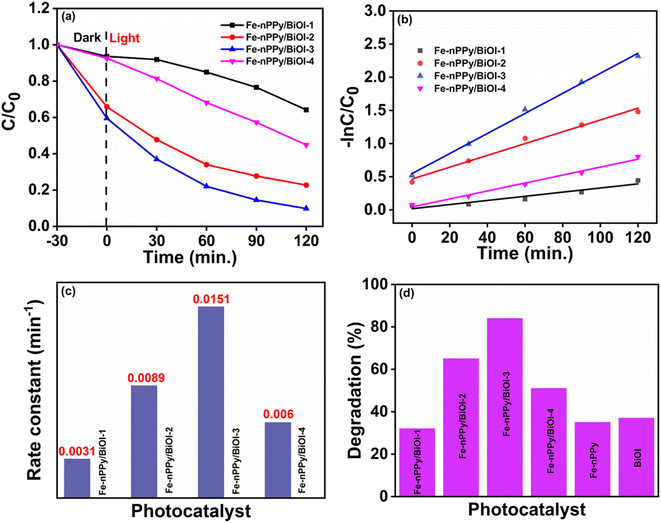
Photocatalytic activities of all the synthesized materials (5 mg) were compared by studying the degradation of CV dye in an aqueous medium (10 ppm, 10 mL). The catalysts showed varying abilities to adsorb CV, as evident from Fig. S5.† However, adsorption–desorption equilibrium was established within 30 min. Hence, the photocatalysts were allowed to equilibrate for 30 min before switching on the irradiation. Time-dependent UV-visible absorbance spectra of CV dye in the presence of Fe-nPPy/BiOI-3 as the catalyst are shown in the ESI (Fig. S6(a)†). Absorbance intensity of the dye at 590 nm continuously decreased, indicating its photodegradation. There was a small hypsochromic shift in the absorbance maximum due to the formation of some N-demethylated intermediates as reported previously.29Additionally, the kinetics of photocatalytic CV degradation was examined by employing the pseudo first-order reaction kinetics model:30
| ln(C/C0) = −kt |
Fig. 8c presents kinetic plots for CV dye degradation using the nanocomposites as catalysts. The plots show that the degradation of CV dye followed pseudo first order kinetics. The rate of photocatalytic degradation follows the order: Fe-nPPy/BiOI-3 > Fe-nPPy/BiOI-2 > Fe-nPPy/BiOI-4 > Fe-nPPy/BiOI-1, with the corresponding rate constant (k) values of 0.01512, 0.0089, 0.006, and 0.00312 min−1, respectively. Photocatalytic removal efficiencies of all the catalysts under the same reaction conditions are shown in Fig. 8d. BiOI, Fe-nPPy and Fe-nPPy/BiOI-1 nanocomposite showed similar photocatalytic activities, which were nevertheless much lower than those of the other nanocomposites. The photocatalytic activities of the nanocomposites increased up to Fe-nPPy/BiOI-3 and then decreased for Fe-nPPy/BiOI-4. Evidently, the Fe-nPPy/BiOI-3 nanocomposite showed the highest removal efficiency of 84% for CV dye on visible light irradiation for 120 min and highest rate constant. Thus, the composition of the nanocomposite has a significant impact on the photocatalytic activities.
Furthermore, photodegradation of pharmaceutical pollutant tetracycline (TC) was attempted with the best nanocomposite Fe-nPPy/BiOI-3, under similar conditions and the progress of degradation is represented in the ESI (Fig. S6(b)†). There was a significant decrease in absorbance intensity with time, showing the progressive degradation of the drug. The degradation efficiency reached 74% when the pollutant solution was exposed to visible light for 120 min. Hence, the Fe-nPPy/BiOI-3 nanocomposite has shown versatility as a photocatalyst for the degradation of an organic dye (CV) and a pharmaceutical pollutant (TC).
The photocatalytic activities of the best catalyst were compared with those of some previously reported catalysts for CV and TC degradation and the comparison table is provided in the ESI (Table S2†). Comparison of the photocatalytic activities is not straightforward, as various experimental variables such as intensity of light, concentration of reactants, catalysts, and ambient conditions affect the performance. Hence, all the available experimental factors are summarized in Table S2.† Evidently, the photocatalytic activity of Fe-nPPy/BiOI-3 is comparable to that of the nanocomposites of even bench mark visible light active materials such as graphitic carbon nitride (g-C3N4).31 Furthermore, the photocatalytic activity of Fe-nPPy/BiOI-3 for TC degradation was better than that of another PPy-BiOI catalyst.13 Additionally, the facile room temperature synthesis makes Fe-nPPy/BiOI-3 an attractive catalyst over other nanocomposites that are prepared at high temperature.
Furthermore, the recyclability of Fe-nPPy/BiOI-3 in the CV degradation reaction was studied by repeating three cycles, and the obtained results are shown in Fig. 9a and b. After completing each cycle, the catalyst was collected by centrifugation. It was then washed with deionized water, dried, and utilized in subsequent cycles. Most significantly, even after three consecutive cycles, only 2% reduction in the photocatalytic activity was seen. Furthermore, the XRD pattern of the catalyst after three cycles (ESI Fig. S7†) was consistent with the pattern of the fresh sample (Fig. 1a). Thus, the catalyst showed very good recyclability.
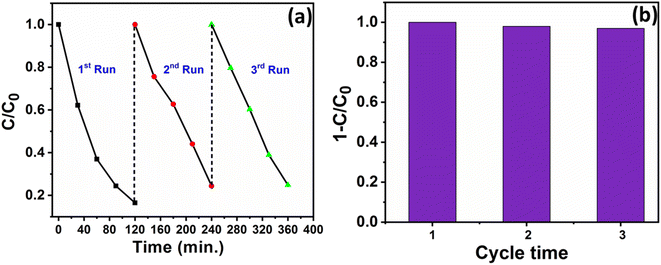 | ||
| Fig. 9 (a) Photocatalytic activity and (b) degradation efficiency of Fe-nPPy/BiOI-3 towards CV dye degradation for three cycles under visible light irradiation. | ||
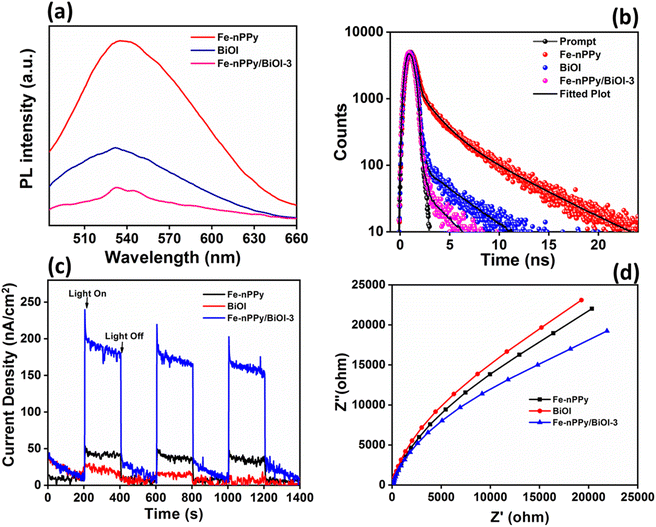
Synergistic enhancement of photocatalytic activities of the nanocomposites may be due to the modification of optical properties that were probed thoroughly. Photoluminescence (PL) studies of Fe-nPPy/BiOI-3 were carried out and compared with those of BiOI and Fe-nPPy (Fig. 10 a). At around 535 nm, a strong emission peak was observed for Fe-nPPy. However, the emission peak was of much lower intensity for BiOI and the lowest for Fe-nPPy/BiOI-3. Thus, electron–hole pair recombination is least in Fe-nPPy/BiOI-3 as compared to Fe-nPPy and BiOI, due to the presence of favorable heterojunctions. This is consistent with the CV dye degradation results. Furthermore, life time decay curves were fitted with tri-exponential decay functions and are shown in Fig. 10(b). The average lifetime (τ) of Fe-nPPy, BiOI and hybrid Fe-nPPy/BiOI-3 was 1.83, 0.26 and 0.08 ns, respectively. With the incorporation of BiOI into Fe-nPPy, there is a reduction in the life time of the nanocomposite which can be interpreted as due to electron transfer from the conduction band of BiOI and the resultant reduction in the conduction band population.32 Thus, the faster life time decay and decrease in the PL intensity in Fe-nPPy/BiOI-3 are indicative of efficient charge separation and transfer through the heterojunction mechanism.33,34
Furthermore, the separation efficiency of photoinduced charge carriers is correlated with the response of photocurrent35 as plotted in Fig. 10(c). The photocurrent response of Fe-nPPy/BiOI-3 was significantly higher than that of Fe-nPPy and BiOI, due to the efficient generation of photoinduced charges in Fe-nPPy/BiOI-3. Furthermore, lower resistance to interfacial charge transfer is indicated by a smaller arc diameter of Nyquist plots.36,37Fig. 10(d) shows that Fe-nPPy/BiOI-3 has a smaller arc diameter than pure BiOI and Fe-nPPy, indicating more favourable photoinduced electron–hole pair separation and transfer in it. Thus, the enhanced ability of Fe-nPPy/BiOI-3 to absorb light, generate and transfer charge and resist recombination when compared to BiOI and Fe-nPPy are the reasons for its higher photocatalytic activity.
3.5 Control studies to support the suggested photocatalytic activity mechanism
As discussed in the introduction, the photocatalytic activities of the catalysts are due to the generation of electrons and holes that are responsible for redox reactions. Moreover, reactive oxygen species (ROS) are generated by the photogenerated charge carriers that promote the degradation of pollutants. Various scavengers that selectively remove the reactive species can provide information about the possible mechanism.38 Benzoquinone (BQ), formic acid (FA), isopropyl alcohol (IPA) and chloroform (CHCl3) were used for scavenging ˙O2− radicals, photogenerated holes, ˙OH radicals and electrons, respectively. Fixed amounts of each scavenger were added just before the addition of the catalyst (Fe-nPPy/BiOI-3) in all the experiments. The photocatalytic degradation percentage of CV dye with and without the presence of the scavengers is presented in Fig. 11. Whereas the CV dye degradation was 84% in the absence of any quencher, it reduced to 72% and 71% in the presence of FA and IPA, respectively. However, the CV degradation decreased significantly to 50% with BQ and 55% with CHCl3, revealing that electrons are primarily responsible for the photodegradation of CV dye through the formation of ˙O2− radicals. The concentration of ˙O2− radicals was estimated quantitatively by employing nitro blue tetrazonium (NBT, 30 μM).39 The concentration of NBT decreased progressively during visible light irradiation in the presence of Fe-nPPy-BiOI-3 as shown in ESI Fig. S8(a)†. The rate constant for NBT degradation over Fe-nPPy/BiOI-3 was calculated to be 0.0295 min−1 (ESI Fig. S8(b)†) and the concentration of ˙O2− radicals was around 5.3 × 10⁻⁷ M.39 Furthermore, the role of atmospheric oxygen was clearly seen on purging the reaction with N2 gas. O2 was involved in the formation of superoxide radicals after receiving electrons from the photocatalyst.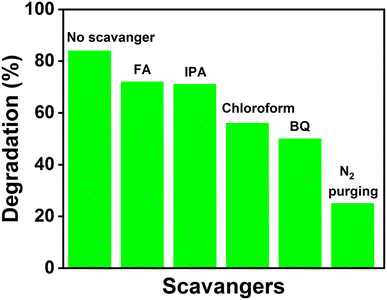 | ||
| Fig. 11 Scavenger study results of the Fe-nPPy/BiOI-3 photocatalyst for the degradation of CV dye under visible light. | ||
Based on the experimental results, two possible pathways for photoexcited electron–hole pairs in Fe-nPPy/BiOI-3 have been considered as shown in Fig. 12a and b. After exposure to visible light radiation, there is generation of electrons and holes in the photocatalyst. In the conventional type-II staggered heterojunction (Fig. 12a), electrons excited by visible light irradiation are transferred from the CB (ESI Fig. S9†) of Fe-nPPy (CBmax = −0.36 V) to the CB of BiOI (CBmax = −0.27 V). However, the electrons in the CB of BiOI do not exhibit enough potential to activate the oxygen molecule to ˙O2− radicals. This is because the position of the CB of BiOI (−0.27 V vs. NHE) is not suitable for generation of ˙O2− radicals (−0.33 V vs. NHE), whereas our scavenger study results suggest that the electrons are the major species causing the activation of oxygen to produce ˙O2− radicals. Additionally, the type- II heterojunction (Fig. 12a) can result in charge recombination in the Fe-nPPy/BiOI-3 nanocomposite which is not in accordance with the optical and electrical properties of the material. Therefore, the possibility of a conventional type-II staggered type of charge transfer mechanism is not supported.
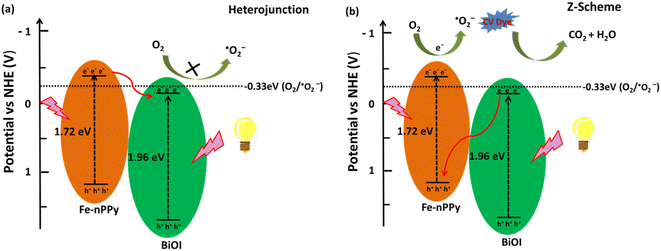 | ||
| Fig. 12 Schematic of plausible mechanisms (a) and (b) for CV dye degradation under visible light irradiation over the hybrid Fe-nPPy/BiOI-3 nanocomposite. | ||
Thus, we assume that the transfer of charges follows a Z-scheme type of mechanism in the Fe-nPPy/BiOI-3 nanocomposite which is further supported by XPS analysis of the Fe-nPPy/BiOI-3 nanocomposite before and after photocatalysis (ESI Fig. S10†).40 The binding energy of Bi-4f increased slightly while the binding energy of N-1s decreased, after the photocatalysis. This may be due to electron transfer from BiOI to Fe-nPPy. This is consistent with the proposed Z-scheme mechanism.38 Hence, after exposure to visible light, both Fe-nPPy and BiOI are excited. The photoexcited electrons from the CB of BiOI (CBmax = −0.27 V) move to the VB of Fe-nPPy (VBmax = 1.35 V), where they combine with the holes. As a result, the excess electrons are excited from the CB of Fe-nPPy (CBmax = −0.36 V),41 where they react with molecular oxygen due to suitable alignment of band positions and generate ˙O2− radicals. Therefore, we propose a Z-scheme type of mechanism for this photocatalytic system which is in agreement with the experimental results. This type of mechanism results in the efficient degradation of CV dye and TC through the formation of reactive radical species.34 Furthermore, this type of mechanism agrees with the earlier proposed photodegradation mechanisms for MO, RhB and MB dyes by hybrid catalysts.42–44
4. Conclusions
In this work, we have synthesized a series of conducting polymer (CP) based nanocomposites (Fe-nPPy/BiOI-X) via a room temperature synthesis route. Among the prepared materials, Fe-nPPy/BiOI-3 exhibited the highest photocatalytic efficiency for the degradation of crystal violet (CV) dye, under visible light irradiation. Fe-nPPy/BiOI-3 is a versatile photocatalyst, as it could degrade a pharmaceutical pollutant tetracycline (TC) also. Moreover, Fe-nPPy/BiOI-3 has shown increased photocatalytic efficiency in comparison to bare BiOI and Fe-nPPy. The high rate of production of photoexcited electron–hole pairs along with suppressed charge carrier recombination in Fe-nPPy/BiOI-3 are the reasons for the enhanced photocatalytic activities. These are evident from the photo and electro-characteristics of the material. Scavenging studies during photocatalysis revealed that electrons were the primary reactive species through the formation of superoxide radicals. Based upon the life time measurement, photoelectrochemical characterization and scavenger studies, formation of a Z-scheme type of heterojunction is established between Fe-nPPy and BiOI. The heterojunction facilitates photo degradation because of its enhanced ability for optical absorption in a wide region, charge-carrier generation and transfer. Hence, the composite formation provides a new insight into CP and inorganic semiconductor based photocatalysts for pollutant degradation.Availability of data and material
All data generated and analyzed are included in this manuscript, along with the ESI.†Author contributions
All authors contributed to the study conception and design. Material preparation, data collection and analysis were performed by Rajesh Kumar, Rituporn Gogoi, Kajal sharma and Astha Singh. Prem Felix Siril supervised the research and arranged funding. The first draft of the manuscript was written by Rajesh Kumar and all authors commented on the same. All authors read and approved the final manuscript.Conflicts of interest
The authors have no relevant financial or non-financial interests to disclose.Acknowledgements
We are grateful to the Indian Institute of Technology Mandi for providing the necessary infrastructure for this research. Financial support from the Ministry of Education, Government of India through the Scheme for Promotion of Academic and Research Collaboration Project No. P-32 is also gratefully acknowledged.References
- R. Gogoi, S. Dutt and P. F. Siril, Conjugated Polym. Nanostruct. Energy Convers. Storage Appl., 2021, 267–296 CAS.
- X. Jin, L. Ye, H. Xie and G. Chen, Coord. Chem. Rev., 2017, 349, 84–101 CrossRef CAS.
- J. Di, J. Xia, H. Li, S. Guo and S. Dai, Nano Energy, 2017, 41, 172–192 CrossRef CAS.
- H. Cheng, B. Huang, Y. Dai, X. Qin and X. Zhang, Langmuir, 2010, 26, 6618–6624 CrossRef CAS PubMed.
- M. Arumugam and M. Y. Choi, J. Ind. Eng. Chem., 2020, 81, 237–268 CrossRef CAS.
- A. Singh, R. Gogoi, K. Sharma, S. K. Jena, N. Fourati, C. Zerrouki, S. Remita and P. F. Siril, J. Cleaner Prod., 2023, 139476 CrossRef CAS.
- A. Thadathil, H. Pradeep, D. Joshy, Y. A. Ismail and P. Periyat, Mater. Adv., 2022, 3, 2990–3022 RSC.
- M. A. del Valle, M. A. Gacitúa, F. Hernández, M. Luengo and L. A. Hernández, Polymers, 2023, 15, 1450 CrossRef CAS PubMed.
- X. Yuan, D. Floresyona, P.-H. Aubert, T.-T. Bui, S. Remita, S. Ghosh, F. Brisset, F. Goubard and H. Remita, Appl. Catal., B, 2019, 242, 284–292 CrossRef CAS.
- R. Gogoi, H. M. Dohling, A. Singh, K. Sharma, P. S. Sagara and P. F. Siril, J. Catal., 2022, 414, 109–124 CrossRef CAS.
- R. Gogoi, A. Singh, V. Moutam, L. Sharma, K. Sharma, A. Halder and P. F. Siril, J. Environ. Chem. Eng., 2022, 10, 106649 CrossRef CAS.
- A. Singh, R. Gogoi, K. Sharma, N. Fourati, C. Zerrouki, S. Remita and P. Felix Siril, Sep. Purif. Technol., 2023, 323, 124459 CrossRef CAS.
- J. Xu, Y. Hu, C. Zeng, Y. Zhang and H. Huang, J. Colloid Interface Sci., 2017, 505, 719–727 CrossRef CAS PubMed.
- G. Yuan, G. Zhang, K. Li, F. Li, Y. Cao, J. He, Z. Huang, Q. Jia, S. Zhang and H. Zhang, Nanomater, 2020, 10, 2206 CrossRef CAS PubMed.
- M. Abinaya, R. Rajakumaran, S. M. Chen, R. Karthik and V. Muthuraj, ACS Appl. Mater. Interfaces, 2019, 11, 38321–38335 CrossRef CAS PubMed.
- N. M. Dimitrijevic, S. Tepavcevic, Y. Liu, T. Rajh, S. C. Silver and D. M. Tiede, J. Phys. Chem. C, 2013, 117, 15540–15544 CrossRef CAS.
- K. Lv, D. Wan, D. Zheng, Y. Qin and Y. Lv, J. Alloys Compd., 2021, 872, 159597 CrossRef CAS.
- D. Peng, X. Li, L. Zhang and J. Gong, Electrochem. Commun., 2014, 47, 9–12 CrossRef CAS.
- F. Gao, J. Luo, X. Zhang, X. Hao, G. Guan, Z. Liu, J. Li and Q. Luo, Chin. J. Chem. Eng., 2022, 49, 161–169 CrossRef CAS.
- D. Jeon, N. Kim, S. Bae, Y. Han and J. Ryu, ACS Appl. Mater. Interfaces, 2018, 10, 8036–8044 CrossRef CAS PubMed.
- X. G. Li, A. Li, M. R. Huang, Y. Liao and Y. G. Lu, J. Phys. Chem. C, 2010, 114, 19244–19255 CrossRef CAS.
- W. Tang, Y. Zhang, H. Guo and Y. Liu, RSC Adv., 2019, 9, 14060–14071 RSC.
- H. Huang, K. Xiao, Y. He, T. Zhang, F. Dong, X. Du and Y. Zhang, Appl. Catal., B, 2016, 199, 75–86 CrossRef CAS.
- K. Sunderland, P. Brunetti, L. Spinu, J. Fang, Z. Wang and W. Lu, Mater. Lett., 2004, 58, 3136–3140 CrossRef CAS.
- M. E. Malefane, U. Feleni, P. J. Mafa and A. T. Kuvarega, Appl. Surf. Sci., 2020, 514, 145940 CrossRef CAS.
- M. Šetka, R. Calavia, L. Vojkůvka, E. Llobet, J. Drbohlavová and S. Vallejos, Sci. Rep., 2019, 9, 1–10 CrossRef PubMed.
- R. P. Antony, T. Mathews, S. Dash, A. K. Tyagi and B. Raj, Mater. Chem. Phys., 2012, 132, 957–966 CrossRef CAS.
- N. Alebachew, H. C. A. Murthy, B. Abdissa, T. B. Demissie, K. G. von Eschwege, E. H. G. Langner and L. Coetsee-Hugo, RSC Adv., 2022, 12, 29959–29974 RSC.
- Y. R. Jiang, H. P. Lin, W. H. Chung, Y. M. Dai, W. Y. Lin and C. C. Chen, J. Hazard. Mater., 2015, 283, 787–805 CrossRef CAS PubMed.
- P. M. K. Reddy and C. Subrahmanyam, Ind. Eng. Chem. Res., 2012, 51, 11097–11103 CrossRef CAS.
- S. Wang, D. Li, C. Sun, S. Yang, Y. Guan and H. He, Appl. Catal., B, 2014, 144, 885–892 CrossRef CAS.
- M. Tasbihi, F. Fresno, I. Álvarez-Prada, A. Acharjya, A. Thomas, L. Escriche, N. Romero, X. Sala, V. A. De La Peña O’Shea and J. García-Antón, J. CO2 Util., 2021, 50, 101574 CrossRef CAS.
- C. Cheng, B. He, J. Fan, B. Cheng, S. Cao and J. Yu, Adv. Mater., 2021, 33, 1–8 Search PubMed.
- Q. Meng, H. Lv, M. Yuan, Z. Cheng, Z. Chen and X. Wang, ACS Omega, 2017, 2, 2728–2739 CrossRef CAS PubMed.
- Z. Zhang, F. Kong, B. Yuan, Y. Liao, X. Ren and Y. Hou, RSC Adv., 2023, 13, 17362–17369 RSC.
- T. Jiang, J. Wei, J. Li, H. Xue, J. Tian and R. Gautier, ACS Catal., 2023, 13, 4168–4177 CrossRef CAS.
- M. Zhu, Q. Liu, W. Chen, Y. Yin, L. Ge, H. Li and K. Wang, ACS Appl. Mater. Interfaces, 2017, 9, 38832–38841 CrossRef CAS PubMed.
- Y. Nosaka and A. Y. Nosaka, Chem. Rev., 2017, 117, 11302–11336 CrossRef CAS PubMed.
- X. Zhan, Y. Zeng, Z. Zhang, Y. Xia, J. Xu, B. Hong and X. Wang, Chem. Eng. J., 2023, 474, 145948 CrossRef CAS.
- X. Zhao, X. Wang, Y. Zhao, H. Sun, H. Tan, T. Qiu, Z. Zhao, X. Zhao, S. Cheng and Y. Li, Environ. Sci.: Nano, 2021, 8, 3855–3864 RSC.
- Z. Liu, K. Xu, H. Yu, M. Zhang and Z. Sun, Appl. Surf. Sci., 2021, 545, 1–9 Search PubMed.
- M. L. Xu, X. J. Jiang, J. R. Li, F. J. Wang, K. Li and X. Cheng, ACS Appl. Mater. Interfaces, 2021, 13, 56171–56180 CrossRef CAS PubMed.
- V. Ramar and K. Balasubramanian, ACS Appl. Nano Mater., 2021, 4, 5512–5521 CrossRef CAS.
- N. Verma and R. Ananthakrishnan, J. Phys. Chem. C, 2020, 124, 404–415 CrossRef CAS.
Footnote |
| † Electronic supplementary information (ESI) available. See DOI: https://doi.org/10.1039/d3va00250k |
| This journal is © The Royal Society of Chemistry 2024 |

