 Open Access Article
Pesticide luminescent detection and degradation using NU-1000 MOF†
Fatine
Gabriel
a,
Arthur
Roussey
*a,
Sonia Sousa
Nobre
*a and
Alexandre
Carella
 b
b
aCEA, LITEN, DTNM, Univ. Grenoble Alpes, Grenoble, 38 000, France. E-mail: arthur.roussey@cea.fr; sonia.de-sousa-nobre@cea.fr
bCEA, DES, ISEC, DMRC, Univ. Montpellier, Marcoule, France
First published on 20th June 2024
Abstract
The metal–organic-framework (MOF) NU-1000 was synthetized and investigated for the concomitant detection and degradation of organophosphorous pesticides such as paraoxon-methyl. After confirming the stability of the synthesized NU-1000 in a buffered suspension of N-ethylmorpholine (NEM) at pH 10, the degradation properties of paraoxon-methyl were studied for different NU-1000 concentrations and pesticide/NU-1000 ratios. UV-Vis absorption was used to monitor the concentration of p-nitrophenol, the degradation product of paraoxon-methyl, and to determine the reaction half-life. NU-1000 luminescence was found to be quenched by the presence of p-nitrophenol in the buffered suspension and an alteration of the emission spectra was observed. As an example of potential practical applications, NU-1000 was used to detect paraoxon-methyl on fresh fruit. Concentrations as low as 1 ppm were successfully detected and revealed to the naked eye under UV light.
Introduction
Environmental pesticide pollution is a major public health problem because pesticides can accumulate in the human body with permanent neurotoxic, genotoxic and reprotoxic effects, resulting in various chronic diseases, such as asthma, diabetes, Parkinson's disease, and cancer.1,2 A large proportion of currently used pesticides (approximately 40%) are organophosphate compounds,3 such as parathion-methyl, fenthion and malathion. These pesticides are particularly toxic because of their structural similarity to organophosphate chemical warfare agents and high levels of exposure can cause convulsions, loss of consciousness, respiratory problems or paralysis, and can even be fatal.2,4 Effective detection and degradation of these environmental pollutants is urgently needed to avoid everyday contact. Various detection strategies have been developed in recent decades, based on colorimetric,5–8 luminescent,9–13 and electrochemical sensing,14,15 GC-MS,16 Raman spectroscopy,17–19 quantum dots,20–23 and enzymatic systems.24–26 However, these approaches are typically limited by high initial costs, the release of toxic by-products, operational difficulties, and/or low selectivity.Metal–organic frameworks (MOFs) are self-assembled crystalline porous materials consisting of metal ions or metal clusters coordinated with organic ligands. Their large surface area, uniform but tuneable pore sizes and abundant active sites make them well suited for simultaneous detection and degradation applications. Zr-based MOFs are particularly attractive in this context because they have large mesopores and readily accessible Zr–OH–Zr sites similar to those of nerve-agent destroying enzymes such as phosphotriesterase (PTE). Indeed, the Zn–OH–Zn active sites of PTE have been shown to hydrolyse phosphoesters in bacteria.27,28 The focus of the present study was on the detection and removal of paraoxon-methyl (dimethyl 4-nitrophenyl phosphate, DMNP), an organophosphate pesticide and nerve agent simulant.
MOFs with oxophilic [Zr6IV] nodes such as those in the UiO (University of Oslo) and NU (Northwestern University) families, are known for their high thermal (up to 500 °C), chemical (pH 1 to pH 10) and mechanical stability.29
Some of the macrocyclic ligands in MOFs (capable of organophosphorus degradation) are also luminescent, potentially revealing to the naked eye otherwise invisible pollutants.30 An effective luminescent probe should have a short response time, high sensitivity (a low detection limit), high selectivity for the target compound (in this case, paraoxon-methyl), strong emission in the on-state, high stability, and reusability in real-world conditions.31 The potential of MOFs for the sensing of organophosphorus pesticides has already been highlighted in the literature.32–40 Vikrant et al. reported that the main mechanisms involved in MOF-based luminescence are (i) variation in the intermolecular distances between the metallic centres and the organic linkers, (ii) chemical interactions between the target analyte and the metallic clusters in the MOF framework, and (iii) host–guest interactions between the organic ligands and the guest analyte.40,41
NU-1000 is a luminescent MOF with zirconium clusters and macrocyclic ligands that has already been investigated for pollutant detection.41,42 Elsewhere, Deria et al. have studied the extent of ground- and excited-state interchromophoric interactions between the π-conjugated macrocyclic linkers in NU-1000 and two other tetraphenyl-pyrene based MOFs using steady-state and time-resolved spectroscopic techniques.43 Shaikh et al. studied the structural dependence of the photophysical properties of pyrene- and porphyrin-based mixed-ligand MOFs.44 Luconi et al. described the use of NU-1000 for carbon dioxide adsorption and cyanide luminescence sensing.45 Gong et al. grafted carboxymethyl b-cyclodextrin into NU-1000 mesopores and used this system for selective cholesterol detection in blood serum.46 And finally, Goswami et al. demonstrated the potential of MOFs such as NU-1000 as artificial light-harvesting complexes.41
Most of these publications focus on the use of MOFs for the detection or degradation of pesticides, but not on both functions. However, the degradation of pesticides by a material capable of detection would be useful for wastewater depollution or food quality control. Herein, we describe the use of NU-1000 for the degradation and luminescent detection of paraoxon-methyl. This was investigated by monitoring the luminescence of NU-1000 during degradation. Luminescence quenching in the presence of low concentrations of paraoxon-methyl was also demonstrated on fresh fruit.
Experimental
Reagents and material synthesis
All the chemicals and reagents used in this study were purchased from Sigma-Aldrich and used without further purification. Tetraethyl 4,4′,4′′,4′′′-(pyrene-1,3,6,8-tetrayl)tetrabenzoate (compound 1), 4,4′,4′′,4′′′-(pyrene-1,3,6,8-tetrayl)tetrabenzoic acid (H4TBAPy) and NU-1000 were synthesized as described by Wang et al.47 The procedures are described in detail in the ESI.† The structures of compound 1 and H4TBAPy structures were confirmed by 1H, 13C and J-modulated NMR spectroscopy (Fig. S1 shows the J-modulated NMR spectra of H4TBAPy, ESI†). The structure of NU-1000 was confirmed by XRD and was activated (the solvent was removed) by drying under vacuum at 120 °C for 18 h.Instrumentation
Powder X-ray diffraction (PXRD) patterns were recorded using a Bruker D8 diffractometer and CuKα radiation (λ = 1.5418 Å). The diffractograms were recorded over a 2θ range of 1 to 50°. The reference XRD pattern was simulated using VESTA software using the CIF file deposited in the Cambridge Crystallographic Data Centre (CCDC; identifier 1580411). Nitrogen adsorption/desorption isotherms were measured at liquid nitrogen temperature using a BELSORP-max pore size distribution analyser. Scanning electron microscopy (SEM) images of activated NU-1000 in NEM buffer deposited on a silicon substrate were obtained with a Hitachi S-5500 device and energy-dispersive X-ray analysis (EDX) was performed using a NORAN System 7 microanalysis system. Thermo-gravimetric analysis (TGA) was performed under N2 with a heating rate of 1 °C min−1 on a SDT Q-600 instrument. Transmission-mode Fourier transform infrared (FTIR) spectra (4000 to 400 cm−1) were recorded using KBr pellets or by depositing a drop of MOF suspension on an attenuated total reflectance accessory using a Bruker VERTEX 70v spectrometer. UV-Vis absorption spectra were measured with a Varian Cary 5000 spectrophotometer. Photoluminescence spectra were recorded at room temperature with a Fluorolog-3 model FL3-22 spectrophotometer with double grating excitation and emission monochromators (Horiba Jobin Yvon-Spex) coupled to a R928 Hamamatsu photomultiplier. The excitation source was a 450 W Xe arc-lamp. Calibration emission spectra and automated measurements (pesticide screening) were recorded using Infinite® M1000 with Quad4 monochromators. The portable spectrometer was developed in house and consists of an electroluminescent diode (excitation source) coupled to an optical fibre which is connected to an Ocean Optics spectrometer in order to read the signal.Hydrolysis tests and optical characterization
NU-1000 powder was dispersed in 1 mL of NEM buffer (0.45 M pH 9–10) in 1.5 mL Eppendorf tubes. The suspensions were stirred at 1500 rpm for 15 min at 25 °C in an Eppendorf thermomixer® C. Paraoxon-methyl was then added in N-ethylmorpholine (NEM) buffer and the mixtures were stirred for 5 h, during which aliquots (20 μL) were extracted at regular intervals and diluted in 10 mL of NEM buffer (0.15 M pH 10) to stop the reaction and monitor degradation by UV-Vis spectroscopy.The diluted suspensions were filtered using Millex-VV 0.1 μm PVDF 33 mm sterilized filters to remove the NU-1000 particles, which absorb at 266 nm (Fig. S2, ESI†). The conversion percentage was calculated using eqn (1) and the calibration curve (Fig. S3, ESI†) from the intensity of the peak at 401 nm (assigned to p-nitrophenol).
 | (1) |
The unfiltered solution was used to record the emission and the excitation spectra of NU-1000, and the quenching efficiency was calculated using eqn (2), from the initial emission intensity of NU-1000 (It0) and the emission intensity (It) measured after adding paraoxon-methyl.
 | (2) |
 | (3) |
 | (4) |
Selectivity measurements
The MOF/NEM suspension is poured into the wells of a black plate with a transparent bottom. Pure or diluted pesticides are then added to these wells. A volume of NEM buffer is added to adjust the wells to the desired final concentrations. The wells are shaken mechanically with glass rods and left to stand for 2 h. Luminescence measurements are then carried out using an automated spectrometer with a robotic arm.Naked-eye detection of luminescence quenching on lemon surface
Several drops of a 0.09 mM NU-1000/NEM suspension were drop casted on the surface of a lemon to form a 2 × 4 grid. The lemon was thoroughly washed with deionized water before use. Paraoxon-methyl solutions (1 μL) with concentrations ranging from 0.01 to 10 ppm were then applied on each square. The lemon was observed under UV light (254 nm) and photographs were taken shortly afterwards.Naked-eye detection and monitoring luminescence quenching using a portable spectrometer on supported NU-1000
Several drops of a 0.09 mM NU-1000/NEM suspension were drop casted on cotton paper (filter paper made of white vellum (PRAT DUMAS N042205)). After drying in ambient conditions, paraoxon-methyl solutions in NEM with concentrations ranging from 0.01 to 10 ppm were casted on the MOF spot. The emission signals from the various spots were measured using a portable spectrometer after 16 h.Results
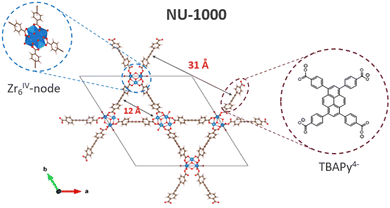
NU-1000 is a micro- and mesoporous MOF of general formula [Zr6(μ3-O)4(μ3-OH)4(OH)4(H2O)4(TBAPy)2] with [Zr6(μ3-O)4(μ3-OH)4(OH)4(H2O)4]8+ nodes where eight of the twelve coordination sites are occupied by TBAPy4− linkers (H4TBAPy = 1,3,6,8-tetrakis(p-benzoic-acid)pyrene) in a csq topology, producing a framework with hexagonal channels 31 Å in diameter and triangular channels of 12 Å across.48 The four –OH groups are reactive and potential adsorption (and subsequent degradation) sites for pesticides. Scheme 1 shows the typical coordination environment of NU-1000. Paraoxon-methyl can be hydrolysed to p-nitrophenol and dimethyl phosphate (Scheme 2). This reaction than can be catalysed using Zr-MOFs, typically in NEM buffer.49 P–O bond cleavage is facilitated by coordination of O to an undercoordinated Zr of the node, which acts as a Lewis acid.50–53Characterization of NU-1000 and stability of NU-1000/NEM suspensions
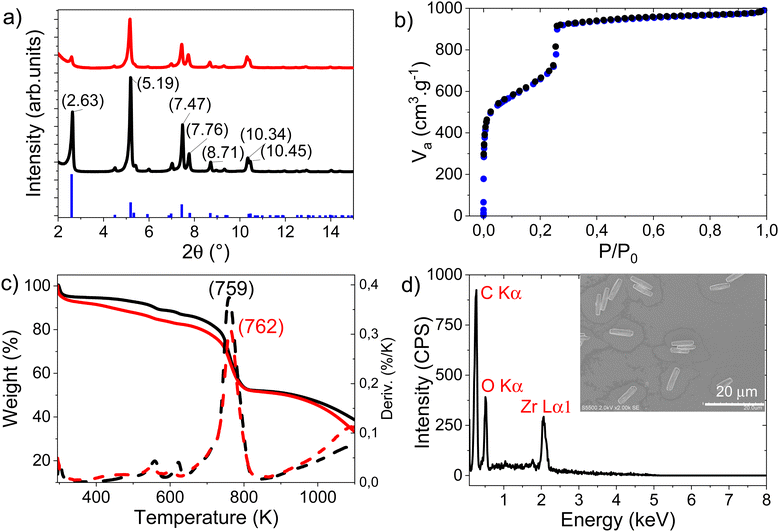
NU-1000 was synthetized from a mixture of zirconium chloride octahydrate, H4TBAPy and benzoïc acid, under solvothermal conditions, yielding a yellow microcrystalline powder. The composition of the powder was confirmed by PXRD, with good agreement between the measured data and the reference pattern for NU-1000 (Fig. 1a). After activation at 120 °C under vacuum, the specific surface area was measured by N2 adsorption/desorption at 2700 m2 g−1 (Fig. 1b). The isotherm profiles correspond to a cylindrical mesoporous structure,54 with mesopores sufficiently large (31 Å) to allow internal diffusion of NEM and paraoxon-methyl. To investigate the effects of the basic buffer, NEM, on the porous structure of the MOF, a sample of activated NU-1000 (referred to as NU-1000/NEM in the following) was dispersed in the buffer solution (0.45 M NEM), recovered by centrifugation and finally dried under vacuum.Fig. 1a shows that contact with the NEM buffer does not affect the crystallographic structure; the slight differences in peak intensities and positions can be ascribed to changes in electron density induced by NEM in the pores.
The TGA data for NU-1000 and NU-1000/NEM in Fig. 1c show that NU-1000/NEM has a slightly higher decomposition temperature than NU-1000 (762 vs. 759 K), possibly because of the (stabilizing) electronic effect of the NEM molecules attached to the metal nodes.
The main infrared bands of NU-1000 appear at 1699, 1603, 1587, 1554, 1541, 1410 and 1366 cm−1, in agreement with the literature.55,56 When dispersed in NEM (NU-1000/NEM), a signal at 1111 cm−1 attributed to NEM is observed, while signals at 1410 and 1366 cm−1 associated with stretching of the carboxylate groups of the ligand are shifted to 1412 and 1385 cm−1, respectively (Fig. S4, ESI†).
The EDX spectrum of NU-1000/NEM (Fig. 1d) shows the presence of C, O and Zr, and SEM images of NU-1000/NEM (Fig. 1d, inset) show rectangular particles with an average length of 7.24 μm and an average width of 1.73 μm. (The method used to calculate the size of the particles is detailed in Table S1, ESI†). Together, these results indicate that NEM is indeed adsorbed in the pores.
Quantitative degradation time course of paraoxon-methyl
Fig. 2 shows the UV-Vis spectra recorded at different times during the NU-1000-catalysed hydrolysis of paraoxon-methyl in NEM. The peak corresponding to p-nitrophenol at 401 nm appears almost immediately (1 min) and becomes more intense as the reaction time increases, while the broad peak at 275 nm (assigned to paraoxon-methyl, see Fig. S5, ESI†) becomes weaker, in agreement with the proposed mode of degradation (Scheme 2). With a NU-1000/DMNP ratio of 3 mg/4 μL (as used to record the data in Fig. 2), the degradation half-life was calculated to be 7 min with complete conversion in roughly 90 min (Fig. S6, ESI†).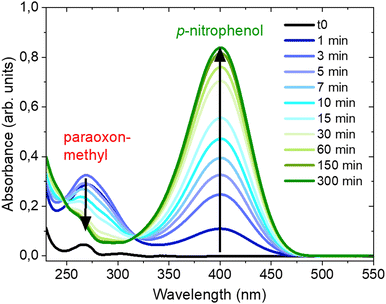 | ||
| Fig. 2 UV-Vis spectra recorded at different times during the degradation of paraoxon-methyl in NEM in the presence of NU-1000. | ||
Table 1 lists the different conditions investigated for the degradation of paraoxon-methyl by NU-1000 and the corresponding half-lives and calculated TOFs. The results obtained with the standard conditions reported in literature48,57 are shown on the second line. Three methods of homogenisation were tested under standard degradation conditions: magnetic stirring, an ultrasound bath, and circular movements with an Eppendorf Thermomixer® C. Fig. S7 (ESI†) shows that the latter lead to the shortest half-life (7 min). This half-life is shorter than has previously been reported (15 min),48,57 possibly because of the different homogenisation systems used.
| NU-1000 (mg) | DMNV (μL) | NU-1000 (mol L−1) | DMNP (mol L−1) | DMNP/Zr6 molar ratio | t 1/2 (min) | TOF (s−1) | |
|---|---|---|---|---|---|---|---|
| a Triplicated experiment, mean values. b Estimated. | |||||||
| 1 | 2.6 | 2 | 1.2 × 10⁻³ | 1.1 × 10⁻² | 9.4 | 7.0 | 0.006 |
| 2 | 2.8a | 4 | 1.3 × 10⁻³ | 2.2 × 10⁻² | 17.4 | 7.0a | 0.01a |
| 3 | 2.7 | 8 | 1.3 × 10⁻³ | 4.5 × 10⁻² | 36.1 | 24.8 | 0.006 |
| 4 | 1.3 | 2 | 6.0 × 10⁻⁴ | 1.1 × 10⁻² | 18.7 | 13.2 | 0.006 |
| 5 | 1.5 | 4 | 7.0 × 10⁻⁴ | 2.2 × 10⁻² | 32.5 | 18.2 | 0.007 |
| 6 | 1.8 | 8 | 8.4 × 10⁻⁴ | 4.5 × 10⁻² | 54.1 | 47.7 | 0.005 |
| 7 | 0.2b | 4 | 9.0 × 10⁻⁵ | 2.2 × 10⁻² | 248.7 | 95 | 0.011 |
Similar TOFs (around 0.007 s−1) were obtained under each condition, confirming that there was good contact with the catalyst.58
FTIR monitoring of the degradation of paraoxon-methyl
First, the FTIR spectra of NU-1000/NEM, in the presence of paraoxon-methyl, p-nitrophenol and DMP, where compared (Fig. S8, ESI†). The spectra of NU-1000/NEM varies little in the presence of DMP, but changes in the presence of paraoxon-methyl and of p-nitrophenol. The two spectra are similar, as expected (paraoxon methyl being fully degraded in these conditions) with an additional N![[double bond, length as m-dash]](https://www.rsc.org/images/entities/char_e001.gif) O band. We observe an additional signal at 1290 cm−1 attributed to N
O band. We observe an additional signal at 1290 cm−1 attributed to N![[double bond, length as m-dash]](https://www.rsc.org/images/entities/char_e001.gif) O bonds. Intensity of the signal at 1383 cm−1 of NU-1000/NEM is interestingly deceased by the presence of p-nitrophenol and this can be attributed to π-stacking between the CH
O bonds. Intensity of the signal at 1383 cm−1 of NU-1000/NEM is interestingly deceased by the presence of p-nitrophenol and this can be attributed to π-stacking between the CH![[double bond, length as m-dash]](https://www.rsc.org/images/entities/char_e001.gif) CH of the ligand and p-nitrophenol. A similar modification is observed for the CH
CH of the ligand and p-nitrophenol. A similar modification is observed for the CH![[double bond, length as m-dash]](https://www.rsc.org/images/entities/char_e001.gif) CH signal of the p-nitrophenol at 1490 cm−1. These changes indicate that the structure of NU-1000 is affected similarly by contact with paraoxon-methyl and p-nitrophenol presence, but not by the presence of DMP.
CH signal of the p-nitrophenol at 1490 cm−1. These changes indicate that the structure of NU-1000 is affected similarly by contact with paraoxon-methyl and p-nitrophenol presence, but not by the presence of DMP.
Luminescence detection and quenching efficiency of p-nitrophenol from paraoxon-methyl degradation
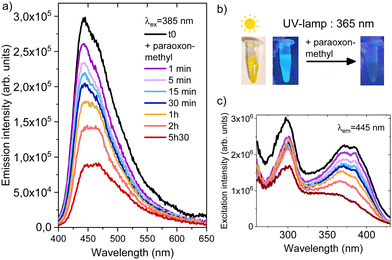
The emission spectra of NU-1000 for different excitation wavelengths (Fig. S9, ESI†) show a broad band at about 440 nm, as reported previously in the literature.45 The maximum emission wavelength is independent of the excitation wavelength, but the emission intensity is highest under excitation at 385 nm. This emission is assigned to the ligand H4TBAPy, whose emission spectra are also shown in Fig. S9 (ESI†). These results, similar emission spectra for NU-1000 and the ligand, were also reported by Derai et al. based on experimental data and computational calculations.43 The inset highlights the small shoulder around 380 nm that appeared in the emission spectrum of NU-1000 at an excitation wavelength of 300 nm but not in that of H4TBAPy. The excitation spectra of H4TBAPy and of NU-1000 consist of two bands, one around 300 nm and the other around 380 nm, as shown in Fig. S10 (ESI†).Fig. 5 shows the emission and excitation spectra of NU-1000 (0.09 mM) measured before and during exposure to a 249-fold excess of paraoxon-methyl. The calibration curve in Fig. S11 (ESI†) shows that NU-1000 emission is linear at concentrations between 0.025 and 0.2 mM so a value in the middle of this range was chosen for the detection of paraoxon methyl. The emission intensity clearly decreases over time (Fig. 3a), as the paraoxon-methyl is degraded, with a quenching efficiency of 40% after 1 h. Emission maximum and conversion as a function of time are plotted in ESI† (Fig. S12 and S13). Fig. 3b shows how the photoluminescence of the NU-1000 suspensions is quenched by the presence of p-nitrophenol at the end of the monitoring. Fig. 3c shows that the excitation band at 380 nm decreases more than the one at 300 nm does.
Fig. 4 shows that in addition to the quenching effect, the degradation of paraoxon-methyl leads to alteration of the shape and a widening of the emission band from NU-1000 (chromaticity diagram in Fig. S14, ESI†). Deria et al. have proposed based on the deconvolution of time resolved emission spectra that the emission of these MOFs consists of two components, one at smaller wavelengths due to S1 → S0 transitions, and the other at larger wavelengths due to excimer transitions.43 The overall alteration of the shape on the NU-1000 emission peak is consistent with this model.
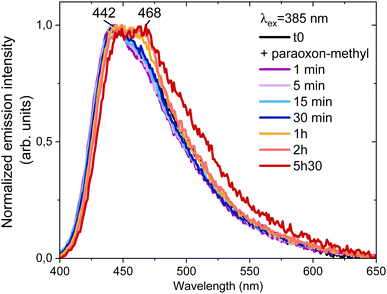 | ||
| Fig. 4 Normalized NU-1000 emission spectra at λex = 385 nm as a function of time during the degradation of paraoxon-methyl. | ||
This quenching is most likely due to the transfer of photoexcited electrons to the p-nitrophenol and/or paraoxon-methyl in the suspension. Xu et al. indicate that the photo-induced electron transfer (PET) is not the only mechanism for luminescence quenching of LMOFs.59 The resonance energy transfer (RET) process can also strongly promote the fluorescence quenching. Indeed, Fig. 5 shows a spectral overlap between the emission spectrum of NU-1000 and the absorption spectrum of p-nitrophenol which points out that p-nitrophenol induce the quenching. This was further confirmed with a direct comparison of the evolution of the quenching of NU-1000 with p-nitrophenol. The quenching efficiency is the same in the presence of p-nitrophenol or paraoxo-methyl at the same concentration (Fig. S15, ESI†). There is also a linear relationship between the emission intensity of NU-1000 after exposure to paraoxon-methyl and conversion (Fig. S16, ESI†), again confirming that p-nitrophenol is responsible for the quenching.
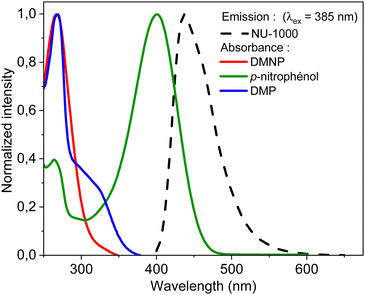 | ||
| Fig. 5 Comparison of the absorbance spectra of paraoxon-methyl (red solid line), p-nitrophenol (green), and DMP (blue), with the emission spectrum of NU-1000 (dashed black line). | ||
This linear relationship between the conversion percentage and the level of luminescence quenching could be useful in practice to estimate the level of degradation of a given sample.
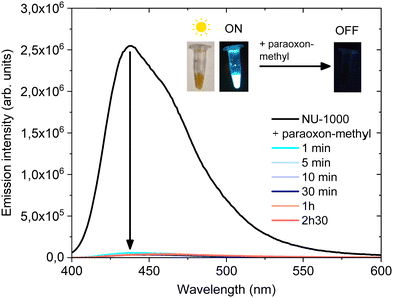
Fig. 6 shows the emission spectra of the NU-1000 at the standard high concentration (1.3 mM) for degradation, before exposure and after exposure to a 249-fold excess of paraoxon-methyl. In contrast with the low concentration data shown in Fig. 3, the emission peak disappears almost immediately, consistent with the very short half-life of 7 min measured under these conditions (Fig. S12, ESI†). The rapid quenching of luminescence at this concentration of NU-1000 indicates therefore that paraoxon-methyl is rapidly converted into p-nitrophenol and DMP. This abrupt decrease in emission intensity could be applied in practice to rapidly detect the presence of paraoxon-methyl.
Selectivity and limit of detection
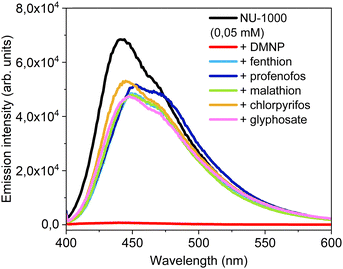
NU-1000 luminescence behaviour was tested with other phosphorus based pesticide in large excess (profenofos, glyphosate, malathion, fenthion and chlorpyrifos) (Fig. S17, ESI†). NU-1000 appears to be selective for paraoxon-methyl, with a 99% loss of emission signal compared with a 20–30% signal loss for the other pesticides tested (Fig. 7).In order to study the effect of paraoxon-methyl concentration, NU-1000 was supported on cotton paper. NU-1000 covers well the paper, as observed by SEM (Fig. S18, ESI†), Supported NU-1000 were contacted with paraoxon-metyl solutions (0.01 to 10 ppm). Spots are observed with the naked eye under a UV lamp (312 nm) after 16 h and the quenching is already observed at 0.05 ppm (Fig. 8). Measurements using a portable spectrometer (λex = 310 nm) confirms that the emission decreases with paraoxon-methyl concentration (Fig. 8). Small variations are noted between 0.1 and 1 ppm and significant quenching (around 60%) is measured at 1 ppm.
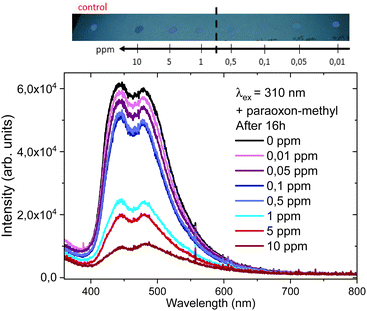 | ||
| Fig. 8 NU-1000 emission intensity on cotton paper at different paraoxon-methyl concentrations (top) and measurements after 16 h using a portable spectrometer at λex = 310 nm (bottom). | ||
Visualisation of paraoxon-methyl contamination on fresh fruit
Fig. 9 shows photographs under UV light of an organic lemon whose surface was coated with a NU-1000/NEM suspension and drops of paraoxon-methyl solutions at different concentrations. After addition, NU-1000/NEM emission is clearly visible to the naked eye in the areas treated with less than 0.5 ppm of paraoxon-methyl. However, an immediate quenching is observed with concentration above 1 ppm. This example highlights the potential practical uses of NU-1000 for pesticide detection.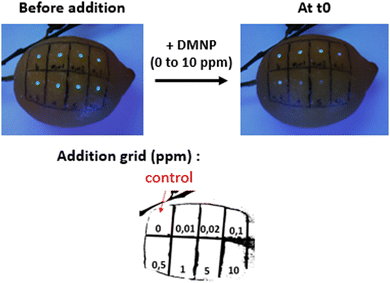 | ||
| Fig. 9 Photographs under UV light (312 nm) of an organic lemon with a drop-cast film of 0.09 mM NU-1000/NEM and drops of paraoxon-methyl arranged in a grid. | ||
Conclusions
NU-1000 can be used to adsorb and rapidly hydrolyse paraoxon-methyl to non-toxic compounds. This study further reveals that luminescence can be used to reveal paraoxon-methyl degradation, as p-nitrophenol was shown not only to quench NU-1000 emission, but also to modify the maximum emission wavelength. Furthermore, these results highlight the potential uses of NU-1000 at low concentrations to evaluate the degradation state of paraoxon-methyl, and at high concentrations to rapidly detect the presence of paraoxon-methyl. NU-1000 appears quite selective when tested against OPs pesticides due to its ability to in fact selectively detect p-nitrophenol, the degradation product of paraoxon methyl. This selectivity should be confirmed with further tests with pesticides of other types.Data availablity
The data supporting this article have been included as part of the ESI.†Conflicts of interest
There are no conflicts to declare.References
- S. Mostafalou and M. Abdollahi, Arch. Toxicol., 2017, 91, 549–599 CrossRef CAS PubMed.
- L. Karalliedde, Anaesthesia, 1999, 54, 1073–1088 CrossRef CAS PubMed.
- J. Kaushal, M. Khatri and S. K. Arya, Ecotoxicol. Environ. Saf., 2021, 207, 111483 CrossRef CAS PubMed.
- N. I. M. Fauzi, Y. W. Fen, N. A. S. Omar and H. S. Hashim, Sensors, 2021, 21, 3856 CrossRef CAS PubMed.
- S. Singh, P. Tripathi, N. Kumar and S. Nara, Biosens. Bioelectron., 2017, 92, 280–286 CrossRef CAS PubMed.
- M. Liang, K. Fan, Y. Pan, H. Jiang, F. Wang, D. Yang, D. Lu, J. Feng, J. Zhao, L. Yang and X. Yan, Anal. Chem., 2013, 85, 308–312 CrossRef CAS PubMed.
- G. Fu, W. Chen, X. Yue and X. Jiang, Talanta, 2013, 103, 110–115 CrossRef CAS PubMed.
- S.-X. Zhang, S.-F. Xue, J. Deng, M. Zhang, G. Shi and T. Zhou, Biosens. Bioelectron., 2016, 85, 457–463 CrossRef CAS PubMed.
- C. A. Constantine, K. M. Gattás-Asfura, S. V. Mello, G. Crespo, V. Rastogi, T.-C. Cheng, J. J. DeFrank and R. M. Leblanc, J. Phys. Chem. B, 2003, 107, 13762–13764 CrossRef CAS.
- Y. He, B. Xu, W. Li and H. Yu, J. Agric. Food Chem., 2015, 63, 2930–2934 CrossRef CAS PubMed.
- X. Wu, P. Wang, S. Hou, P. Wu and J. Xue, Talanta, 2019, 198, 8–14 CrossRef CAS PubMed.
- C. Sahub, T. Tuntulani, T. Nhujak and B. Tomapatanaget, Sens. Actuators, B, 2018, 258, 88–97 CrossRef CAS.
- G. Xue, Z. Yue, Z. Bing, T. Yiwei, L. Xiuying and L. Jianrong, Analyst, 2016, 141, 4941–4946 RSC.
- S. Sajjadi, H. Ghourchian and H. Tavakoli, Biosens. Bioelectron., 2009, 24, 2509–2514 CrossRef CAS PubMed.
- Y. Yang, H. Tu, A. Zhang, D. Du and Y. Lin, J. Mater. Chem., 2012, 22, 4977–4981 RSC.
- L. Pogačnik and M. Franko, Biosens. Bioelectron., 2003, 18, 1–9 CrossRef PubMed.
- A. M. Dowgiallo and D. A. Guenther, J. Agric. Food Chem., 2019, 67, 12642–12651 CrossRef CAS PubMed.
- J. Chen, Y. Huang, P. Kannan, L. Zhang, Z. Lin, J. Zhang, T. Chen and L. Guo, Anal. Chem., 2016, 88, 2149–2155 CrossRef CAS PubMed.
- C. D. L. Albuquerque and R. J. Poppi, Anal. Chim. Acta, 2015, 879, 24–33 CrossRef CAS PubMed.
- J. Wei, J. Cao, H. Hu, Q. Yang, F. Yang, J. Wan, H. Su, C. He, P. Li and Y. Wang, Molecules, 2017, 22, 1421 CrossRef PubMed.
- R. Ban, J. Zhu and J. Zhang, Microchim. Acta, 2014, 181, 1591–1599 CrossRef CAS.
- H. Liang, D. Song and J. Gong, Biosens. Bioelectron., 2014, 53, 363–369 CrossRef CAS PubMed.
- H. Li and F. Qu, Chem. Mater., 2007, 19, 4148–4154 CrossRef CAS.
- S. M. Z. Hossain, R. E. Luckham, M. J. McFadden and J. D. Brennan, Anal. Chem., 2009, 81, 9055–9064 CrossRef CAS PubMed.
- Z. Zheng, X. Li, Z. Dai, S. Liu and Z. Tang, J. Mater. Chem., 2011, 21, 16955–16962 RSC.
- L. Lu and Y. Xia, Anal. Chem., 2015, 87, 8584–8591 CrossRef CAS PubMed.
- K. O. Kirlikovali, Z. Chen, T. Islamoglu, J. T. Hupp and O. K. Farha, ACS Appl. Mater. Interfaces, 2020, 12, 14702–14720 CrossRef CAS PubMed.
- A. N. Bigley and F. M. Raushel, Biochim. Biophys. Acta, Proteins Proteomics, 2013, 1834, 443–453 CrossRef CAS PubMed.
- A. E. Platero-Prats, A. Mavrandonakis, L. C. Gallington, Y. Liu, J. T. Hupp, O. K. Farha, C. J. Cramer and K. W. Chapman, J. Am. Chem. Soc., 2016, 138, 4178–4185 CrossRef CAS PubMed.
- S. Fan, G. Zhang, G. H. Dennison, N. FitzGerald, P. L. Burn, I. R. Gentle and P. E. Shaw, Adv. Mater., 2020, 32, 1905785 CrossRef CAS PubMed.
- J. Tang, X. Ma, J. Yang, D.-D. Feng and X.-Q. Wang, Dalton Trans., 2020, 49, 14361–14372 RSC.
- P. Kumar, K.-H. Kim, V. Bansal, A. K. Paul and A. Deep, Microchem. J., 2016, 128, 102–107 CrossRef CAS.
- X. Zheng, L. Zhou, Y. Huang, C. Wang, J. Duan, L. Wen, Z. Tian and D. Li, J. Mater. Chem. A, 2014, 2, 12413 RSC.
- X. Xu, Y. Guo, X. Wang, W. Li, P. Qi, Z. Wang, X. Wang, S. Gunasekaran and Q. Wang, Sens. Actuators, B, 2018, 260, 339–345 CrossRef CAS.
- P. Kumar, A. K. Paul and A. Deep, Anal. Methods, 2014, 6, 4095–4101 RSC.
- P. Kumar, A. K. Paul and A. Deep, Microporous Mesoporous Mater., 2014, 195, 60–66 CrossRef CAS.
- D. K. Singha, P. Majee, S. Mandal, S. K. Mondal and P. Mahata, Inorg. Chem., 2018, 57, 12155–12165 CrossRef CAS PubMed.
- E. A. Dolgopolova, A. M. Rice, C. R. Martin and N. B. Shustova, Chem. Soc. Rev., 2018, 47, 4710–4728 RSC.
- X. Xu, M. Ma, T. Sun, X. Zhao and L. Zhang, Biosensors, 2023, 13, 435 CrossRef CAS PubMed.
- K. Vikrant, D. C. W. Tsang, N. Raza, B. S. Giri, D. Kukkar and K.-H. Kim, ACS Appl. Mater. Interfaces, 2018, 10, 8797–8817 CrossRef CAS PubMed.
- S. Goswami, J. Yu, S. Patwardhan, P. Deria and J. Hupp, ACS Energy Lett., 2021, 6, 848–853 CrossRef CAS.
- S. Sun, C. Wei, Y. Xiao, G. Li and J. Zhang, RSC Adv., 2020, 10, 44912–44919 RSC.
- P. Deria, J. Yu, T. Smith and R. P. Balaraman, J. Am. Chem. Soc., 2017, 139, 5973–5983 CrossRef CAS PubMed.
- S. M. Shaikh, S. Ilic, B. J. Gibbons, X. Yang, E. Jakubikova and A. J. Morris, J. Phys. Chem. C, 2021, 125, 22998–23010 CrossRef CAS.
- L. Luconi, G. Mercuri, T. Islamoglu, A. Fermi, G. Bergamini, G. Giambastiani and A. Rossin, J. Mater. Chem. C, 2020, 8, 7492–7500 RSC.
- M. Gong, J. Yang, Y. Li, Q. Zhuang and J. Gu, J. Mater. Chem. C, 2019, 7, 12674–12681 RSC.
- T. C. Wang, N. A. Vermeulen, I. S. Kim, A. B. F. Martinson, J. F. Stoddart, J. T. Hupp and O. K. Farha, Nat. Protoc., 2016, 11, 149–162 CrossRef CAS PubMed.
- J. E. Mondloch, M. J. Katz, W. C. Isley Iii, P. Ghosh, P. Liao, W. Bury, G. W. Wagner, M. G. Hall, J. B. DeCoste, G. W. Peterson, R. Q. Snurr, C. J. Cramer, J. T. Hupp and O. K. Farha, Nat. Mater., 2015, 14, 512–516 CrossRef CAS PubMed.
- M. J. Katz, S.-Y. Moon, J. E. Mondloch, M. H. Beyzavi, C. J. Stephenson, J. T. Hupp and O. K. Farha, Chem. Sci., 2015, 6, 2286–2291 RSC.
- H. Chen, P. Liao, M. L. Mendonca and R. Q. Snurr, J. Phys. Chem. C, 2018, 122, 12362–12368 CrossRef CAS.
- H. Chen and R. Q. Snurr, ACS Appl. Mater. Interfaces, 2020, 12, 14631–14640 CrossRef CAS PubMed.
- A. M. Ploskonka and J. B. DeCoste, J. Hazard. Mater., 2019, 375, 191–197 CrossRef CAS PubMed.
- Y. Liao, T. R. Sheridan, J. Liu, Z. Lu, K. Ma, H. Yang, O. K. Farha and J. T. Hupp, ACS Catal., 2024, 14, 437–448 CrossRef CAS.
- M. Thommes, K. Kaneko, A. V. Neimark, J. P. Olivier, F. Rodriguez-Reinoso, J. Rouquerol and K. S. W. Sing, Pure Appl. Chem., 2015, 87, 1051–1069 CrossRef CAS.
- A. Pankajakshan, M. Sinha, A. A. Ojha, S. Mandal and A. Pankaj, ACS Omega, 2022, 3, 7832–7839 CrossRef PubMed.
- Y. Pan, S. Sanati, M. Nadafan, R. Abazari, J. Gao and A. M. Kirillov, Inorg. Chem., 2022, 61, 18873–18882 CrossRef CAS PubMed.
- S. S. Mondal and H.-J. Holdt, Angew. Chem., Int. Ed., 2016, 55, 42–44 CrossRef CAS PubMed.
- R. J. Madon and M. Boudart, Ind. Eng. Chem. Fundam., 1982, 21, 438–447 CrossRef CAS.
- N. Xu, Q. Zhang and G. Zhang, Dalton Trans., 2019, 48, 2683–2691 RSC.
Footnote |
| † Electronic supplementary information (ESI) available. See DOI: https://doi.org/10.1039/d3tc04101h |
| This journal is © The Royal Society of Chemistry 2024 |

