
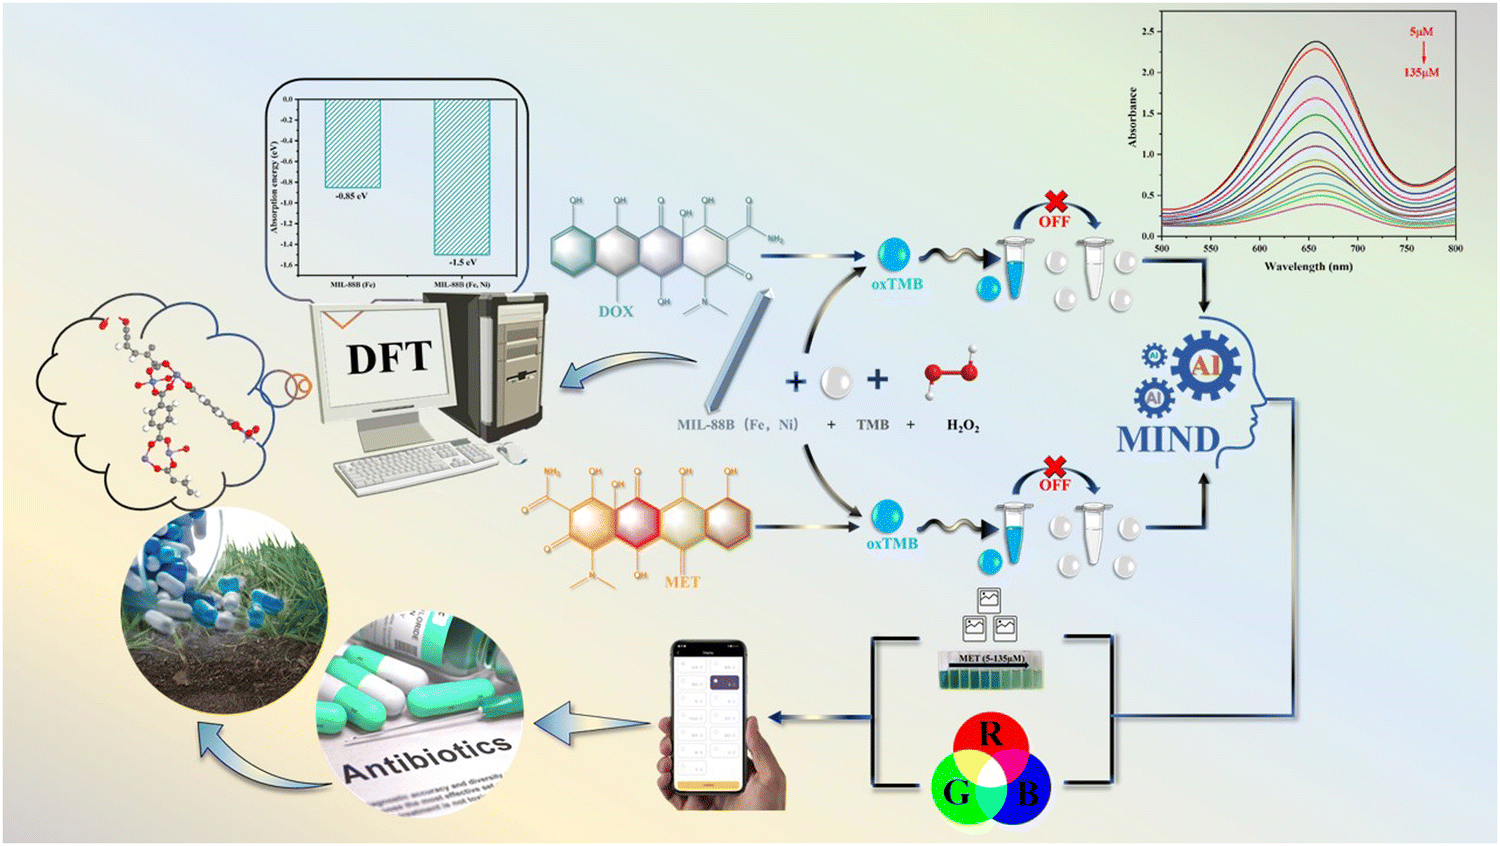
Reasonable construction of a bimetallic organic framework MIL-88B (Fe, Ni) nanoenzyme based on deep learning assisted doxycycline hydrochloride and methyloxytetracycline hydrochloride†
Mengmeng
Sun‡
a,
Kaixin
Pu‡
a,
Xingrong
Hao
a,
Tao
Liu
b,
Zhiwei
Lu
 a,
Gehong
Su
a,
Chun
Wu
a,
Yanying
Wang
a,
Shuang
Cai
*c,
Xiaoqing
Zhao
*a and
Hanbing
Rao
*a
a,
Gehong
Su
a,
Chun
Wu
a,
Yanying
Wang
a,
Shuang
Cai
*c,
Xiaoqing
Zhao
*a and
Hanbing
Rao
*a
aCollege of Science, Sichuan Agricultural University, Xin Kang Road, Yucheng District, Ya’an 625014, P. R. China. E-mail: rhb@sicau.edu.cn
bCollege of Information Engineering, Sichuan Agricultural University, Xin Kang Road, Yucheng District, Ya’an 625014, P. R. China
cDepartment of Chemical Engineering and Food Science, Hubei University of Arts and Science, 296 Longzhong Road, Xiangyang 441053, P. R. China
First published on 17th November 2023
Abstract
Developing a real-time and effective monitor of antibiotic residues in the environment is still a challenge. The bimetallic organic framework nanoenzyme MIL-88B (Fe, Ni) was simply synthesized using a solvothermal method. MIL-88B (Fe, Ni) with an excellent peroxidase activity could catalyze H2O2 to produce O2˙− and OH. FTIR and DFT results found that the introduction of Ni2+ to replace a portion of Fe3+ formed rich Fe2NiO clusters, which could reduce the energy consumption of the reaction rate determining step. Based on its high peroxidase activity, a multifunctional colorimetric detection platform for DOX and MET was successfully constructed, with real-time and rapid detection capabilities. The linear ranges of MET and DOX were both 5–135 μM, with a minimum detection limit of 0.8524 μM and 1.0553 μM, respectively. Above all, this study has shown great potential in detecting antibiotic residues in environmental soil and water.
1. Introduction
As a kind of nanomaterial with catalytic activity, nanoenzymes have attracted the attention of more and more researchers. Due to its advantages of an adjustable catalytic activity, low-cost batch production and robustness under harsh conditions, it has become a promising candidate material for natural enzymes.1 Since Yan Xiyun's team first reported that magnetic Fe3O4 has a peroxidase-like activity in 2007,2 many nanomaterials have been proved to possess oxidase-like,3 peroxidase-like,4 catalase-like,5 superoxide dismutase-like6 and glutathione oxidase-like activities,7 such as metal organic frameworks (MOFs),8 metal oxides,9 metal sulfides10 and carbon-based materials.11 It has been developed and widely used in biosensors,12 restoration of the environment,13 and immunoassays,14 as well as in clinical treatment.15Metal–organic frameworks, or MOFs, are porous networks made up of metal centers or clusters linked by organic frameworks,16 and are gaining popularity as a new form of porous material. MOFs have several benefits over conventional nanomaterials, including an exceptional stability, high porosity, distinct chemical activity, and a controlled structure.17,18 As a result, MOFs are regarded as a very promising nanoenzyme. In this context, MOFs offer a wide range of possible applications, including catalysis, gas adsorption/separation, biosensing, drug administration, and biomedical imaging.19,20 MOFs are currently being used in the biosensors industry, such as Tb-MOF luminescent nanoenzyme catalyzed tyrosine detection,21 two-dimensional thin Co MOF nanoenzyme for GSH detection, etc.,22 based on their high enzyme activity. MOFs can be modified by introducing acceptable metal ions, replacing them with appropriate functional groups, or combining them with other suitable materials.23,24 MOFs have open metal sites in their skeletons, which provide mimicked catalytic characteristics as well as enhancing colorimetric signals, potentially improving detection sensitivity.25 However, the low colorimetric absorption rate and low catalytic reaction rate of MOF-based biosensors prevent them from being used widely. Bimetallic centers are introduced by MOFs, which results in defects and notable metal site synergy, boosting the quantity of active sites and enhancing catalytic activity even more.26 These bimetallic MOFs show considerable promise in biosensing.27 Among numerous nano-enzymes, iron (Fe) provides good catalytic opportunities because of the inexpensive cost, superior chemical stability and attractive catalytic activity. Despite having made key breakthroughs, iron-based nanoenzymes still face enormous difficulties, such as the time-consuming synthesis process and that most iron-based nanoenzymes are prone to aggregation, which may influence their catalytic activity and impede the sustainable development of iron-based nanoenzymes. Therefore, it is important to reasonably design and develop iron-containing nanoenzyme that have a straightforward fabrication process and excellent stability.28,29 Fe3+/Ni2+ ions exhibit a high apparent metal binding affinity.30,31 As a result, we chose Fe3+ and Ni2+ as metal ions for the synthesis of bimetallic MOFs.
With the development of livestock and poultry breeding and the increase of clinical treatment, antibiotics have become a potential source of environmental pollution.32 Doxycycline hydrochloride (DOX)33 and methyloxytetracycline hydrochloride (MET)34 are broad-spectrum antibiotics with an antibacterial effect more than ten times stronger than tetracycline. As the most widely used tetracycline at present, DOX is often used to treat rickettsia infection, mycoplasma infection, chlamydia infection, and so on. MET can inhibit chlamydia trachomatis and actinomycetes, and can be used for the treatment of trachoma and cervicitis.35 However, the abuse of antibiotics not only damages the body due to their toxic side effects, but also leads to the proliferation of antibiotics in the environment, causing bacteria to develop drug resistance, ultimately leading to the emergence of super bacteria and bringing devastating disasters to humanity. Therefore, it is necessary to establish a standardized method for detecting these two antibiotics. Although liquid chromatography, gas chromatography, and electrochemical methods can be used to detect DOX and MET, these methods have many drawbacks, including costly equipment, complex operation, and taking a lot of time. Therefore, there is an urgent need to develop an inexpensive, simple to operate, and fast detection analysis method.
An innovative method for creating MIL-88B (Fe, Ni) with a peroxidase-like activity is suggested in this work,36,37 as shown in Scheme 1. A DOX/MET multi-function colorimetric sensing system was built using the peroxidase-like activity of MIL-88B (Fe, Ni). When combined with smart phones, it can detect DOX and MET in real time, with a large detection range and low detection limit. This study provides ideas for the efficient design of bimetallic MOF nanoenzymes, and it is also expected to provide some ideas for the rational design of other advanced catalysts.
 | ||
| Scheme 1 Schematic diagram of MET/DOX, portable smartphone biosensors. | ||
2. Experimental section
All the reagents and solvents were purchased commercially and utilized without additional purification. In the supplementary information, reagents and compounds, as well as characterization equipment, are shown.2.1 Synthesis of materials
The MIL-88B (Fe) framework was prepared according to the previously reported method.38 Simply put, FeCl3·6H2O (0.90 mmol) and terephthalic acid (1.0 mmol) were dissolved in 10 mL of N, N-dimethylformamide (DMF). 2 mL of 0.2 M sodium hydroxide were quickly added to the above uniform solution, and the resulting mixture was continuously stirred for 1 h. After that, the mixture was placed in a Teflon-lined autoclave (25 mL) and heated at 100 °C for 15 hours. The product was centrifuged and washed with DMF and methanol three times, and then dried overnight under vacuum at 80 °C to obtain MIL-88B (Fe).MIL-88B (Ni) was made in the same way as MIL-88B (Fe), except that the metal salt was Ni(NO3)2·H2O (0.9 mmol).
MIL-88B (Fe, Ni) was made in the same way as MIL-88B (Fe), except that FeCl3·6H2O (0.57 mmol) and Ni(NO3)2·6H2O (0.9 mmol) were employed as the metal salts. The final bimetallic MOF was prepared, in which the Fe![[thin space (1/6-em)]](https://www.rsc.org/images/entities/char_2009.gif) :Ni atomic ratio was 11.83:3.05 (Table S1, ESI†).
:Ni atomic ratio was 11.83:3.05 (Table S1, ESI†).
2.2 MIL-88B (Fe, Ni) enzyme-like activity testing
The variation in color of the reagent TMB was monitored for the purpose of evaluating the oxidase-like activity of MIL-88B (Fe, Ni). The particular process was as follows: 50 μL of MIL-88B (Fe, Ni) (1 mg mL−1) as well as 100 μL of TMB (5 mM dimethyl sulfoxide) were dissolved in 0.2 M ABS buffer (2 mL total, pH = 3.5) and treated for 15 minutes at 37 °C. The absorbance generated by the combined solution was subsequently determined using a UV-vis (UV-visible spectrophotometer) with a wavelength of 652 nm. Furthermore, the pH (3.0–7.0), temperature (20–60 °C), TMB concentrations, and MIL-88B (Fe, Ni) concentration were all systematically optimized.The MIL-88B (Fe, Ni) peroxidase activity was evaluated; 50 μL of H2O2 (30%,10 mM), 50 μL of MIL-88B (Fe, Ni) (1 mg mL−1) as well as 50 μL of TMB and ABS (pH = 3.5) mixed solution were used. After 15 minutes of incubation, the UV-vis was captured and the testing process was identical to that of the oxidase-like experiment.
2.3. Enzymatic reaction kinetic analysis
The kinetic variables as well as catalytic characteristics for the peroxidase were determined under optimal conditions. The peroxidase kinetic activity was evaluated with a UV spectrophotometer by fixing the quantity of TMB as well as H2O2 and adjusting the concentration of TMB as well as H2O2, followed by incubation at 37 °C for 20 minutes, and then the absorbance was detected. Then, H2O2 was measured in the same way. The Michaelis–Menten equation was used to compute Km and Vmax:39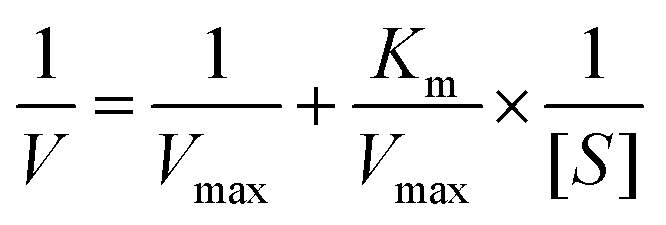
V max: maximal pace of reaction; [S]: substrate concentration; Km: Michaelis unchanging.
2.4. The catalytic mechanism of peroxidase-like activity
Different scavengers of free radicals were utilized to investigate the catalytic mechanism of MIL-88B (Fe, Ni) with the goal of demonstrating the reactive oxygen species (ROS) created during the catalytic procedure. Isopropanol (IPA) was used to scavenge hydroxyl radicals (OH), 1, 4-benzoquinone (PBQ) and sodium azide as the superoxide anion (O2˙−) as well as singlet oxygen (1O2) scavengers, while EDTA was utilized to eliminate the oxygen vacancy. The method of experimentation is as follows: 100 μL of various scavenger concentrations were added to the ABS buffer system, comprising 100 μL of TMB, 50 μL of MIL-88B (Fe, Ni), and 50 μL of H2O2. At 652 nm, the absorbance was measured. The intensity of the absorption reduced as the scavenger increased, showing that the equivalent free radicals were created by catalysis.2.5. Application of MIL-88B (Fe, Ni) nanorods
MET was detected by adding 50 μL of MIL-88B (Fe, Ni) (1 mg mL−1), 100 μL of TMB (5 mmol), 50 μL of H2O2 (10 mmol), and various doses of MET into the ABS buffer (pH = 3.5, total system unaltered at 2 mL). After 15 minutes of incubation at 45 °C, the absorbance at 652 nm was determined using a UV-vis, and the MET standard curve was established.
3. Results and discussion
3.1. Synthesis and characterization of the MIL-88B (Fe, Ni) nanorods
MIL-88B (Fe), MIL-88B (Ni), and MIL-88B (Fe, Ni) frameworks were created by combining suitable metal ions with terephthalic acid by a solvothermal method. SEM (scanning electron microscopy) and TEM (transmission electron microscopy) were utilized to analyze the morphology and structure of MIL-88B (Fe), MIL-88B (Ni), and MIL-88 (Fe, Ni) (Fig. 1). MIL-88B (Fe) has a smooth surface and a regular polyhedral cubic structure (Fig. 1A and D), which was a typical MIL-88B structure.40,41 The length of MIL-88B (Fe) MOFs was determined to be 746.79 ± 165.47 nm (Fig. S1, ESI†); MIL-88B (Ni), on the other hand, is a stack of smooth nanosheets, which may be due to the coordination of Ni2+ with terephthalic acid (Fig. 1B and E). With the addition of Ni2+, MIL-88B (Fe, Ni) still maintains a typical MIL-88B structure; However, stacked MIL-88B (Ni) nanosheets also appeared around it, and some small Ni nanoparticles grew on the surface of MIL-88B (Fe, Ni), which may be advantageous for generating more active sites and promoting enzyme activity (Fig. 1C and F). The TEM image particle size distribution revealed that the length of the MIL-88B (Fe, Ni) MOF was 499.13 ± 104.08 nm (Fig. 2A), and it has a smaller size than that of MIL-88B (Fe), which may be due to Ni doping changing the internal coordination environment. The corresponding EDS (element mapping) results showed that C, N, O, Fe, and Ni were equally distributed across the surface of MIL-88B (Fe, Ni) (Fig. 1G–L). Notably, the Fe and Ni elements co-existed in the fusiform region, which indicated that the Ni element may be in the lattice of MIL-88B (Fe).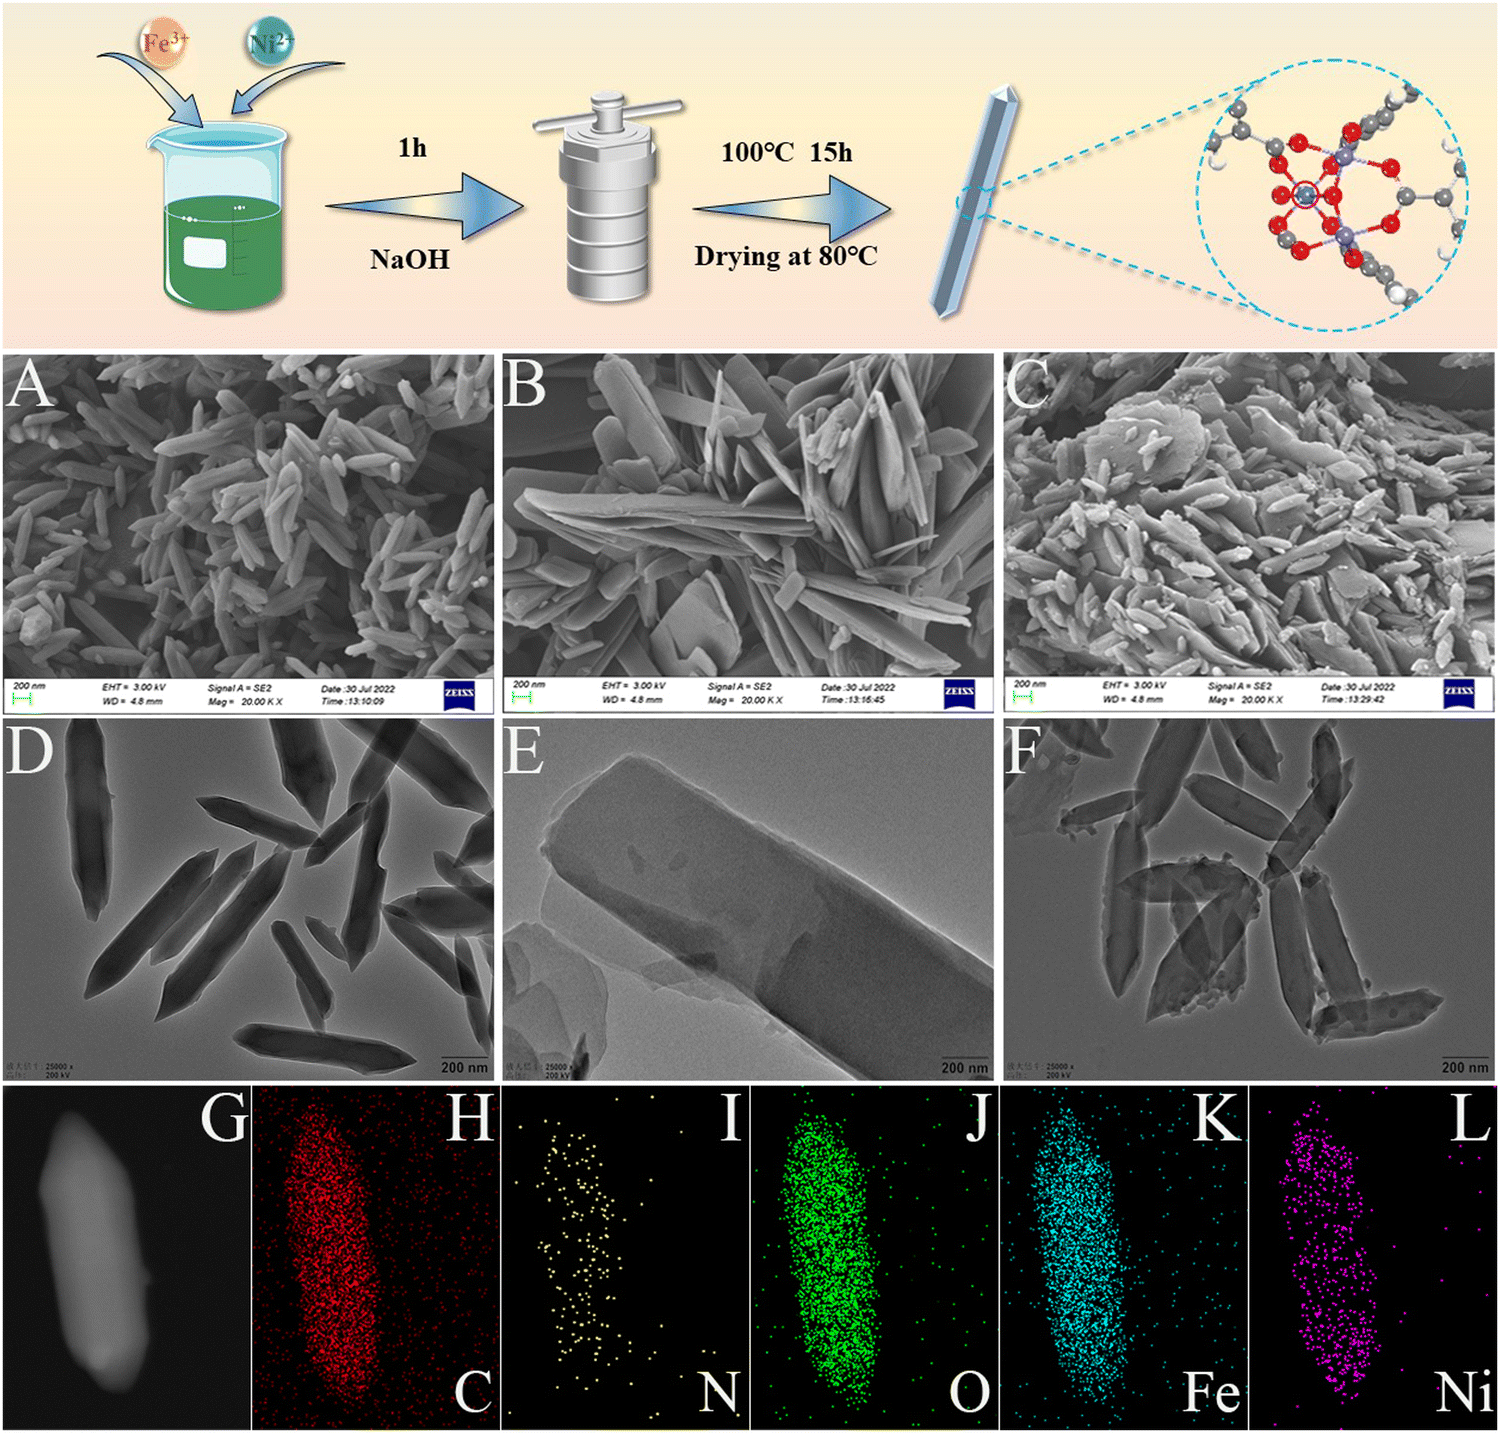 | ||
| Fig. 1 Method used for preparing MIL-88B (Fe, Ni) (top). (A) MIL-88B (Fe), (B) MIL-88B (Ni), and (C) MIL-88B (Fe, Ni) SEM pictures. (D) MIL-88B (Fe), (E) MIL-88B (Ni), and (F) MIL-88B (Fe, Ni) TEM pictures. (G)–(L) HRTEM images and mapping images of MIL-88B (Fe, Ni). | ||
 | ||
| Fig. 2 (A) Particle size distribution maps of MIL-88B (Fe, Ni). (B) MIL-88B (Fe), MIL-88B (Ni), and MIL-88B (Fe, Ni) XRD pictures (The initial simulation data were obtained from the Crystallographic data center “CCDC” in Cambridge, with the identifier name “2088535”). (C) Fourier-transform infrared spectral images of MIL-88B (Fe), MIL-88B (Ni), MIL-88B (Fe, Ni) and MIL-88B (Fe, Ni) after the experiment. (D) and (E) MIL-88B (Fe), MIL-88B (Ni), MIL-88B (Fe, Ni), and MIL-88B (Fe, Ni) after Raman spectroscopic pictures. (F) XPS (X-ray photoelectron spectroscopy) full spectra of MIL-88B (Fe), MIL-88B (Ni), MIL-88B (Fe, Ni) and MIL-88B (Fe, Ni) after the experiment. | ||
Using X-ray diffraction (XRD), the crystal structure of MIL-88B (Fe, Ni) was examined, as shown in Fig. 2B. The XRD spectrum of MIL-88B (Fe) synthesized by a solvothermal method was compared with the simulated peak of CCDC-2088535. The diffraction peaks of MIL-88B (Fe) at 7.14°, 8.8°, and 9.96° are (100), (101), and (002), respectively, indicating the successful synthesis of MIL-88B (Fe). According to PDF#02-095-5538, the diffraction peaks of MIL-88B (Ni) at 9.22°, 11.8°, and 12.2° are (100), (010), and (−110), respectively, indicating the successful synthesis of MIL-88B (Ni). As for the tiny different peaks and shifts, these may be due to the formation of Fe2NiO clusters in MIL-88B (Fe, Ni) from the effect of Ni on MIL-88B (Fe).
FTIR (Fourier transform infrared spectroscopy) further confirmed the successful synthesis of Ni incorporation (Fig. 2C). The formation of a wide absorption band of 3600–3200 cm−1 was related to the tensile vibration of strong OH–. The coordination bonds corresponding to the ligands and metal clusters adsorbed by the three nuclear oxygen centers Vas (–COO–) and vs. (–COO–) appeared at 1580 and 1380 cm−1, respectively, indicating that there were no free ligands in the material, and the ligands coordinated with the metal clusters.42 Furthermore, the out of plane bending vibration of O–H resulted in a peak at 1013 cm−1, and the benzene ring's stretching vibrations C–C and C–H were responsible for the peaks at 816 cm−1 and 755 cm−1, respectively. This demonstrated that the coordination of ligands was successfully formed.43 When Ni was doped, compared to MIL-88B (Fe), the vibration of oxygen in the C2v symmetric plane Fe3O cluster was located at 552 cm−1, and its intensity was significantly reduced. At 609 cm−1, a brand-new absorption peak for the Ni–O vibration in MIL-88B (Ni) emerged,44 marking the formation of Fe2NiO clusters. After the catalytic reaction occurred, the Ni–O vibration at 609 cm−1 disappeared, while the Fe–O at 552 cm−1 was re-exposed. The results indicated that the incorporation of Ni does, indeed, replace a portion of Fe3+ to form Fe2NiO clusters, which could be the active regions of nanoenzymes.
Raman spectroscopy further confirms the incorporation of Ni. Fig. 2D and E showed the Raman spectra of MIL-88B (Fe), MIL-88B (Ni), MIL-88B (Fe, Ni) and MIL-88B (Fe, Ni) after catalytic reaction. Four diffraction peaks were observed at 1602, 1444, 1130, and 854 cm−1 for MIL-88B (Fe). The above-mentioned peaks are caused by the benzene ring's C![[double bond, length as m-dash]](https://www.rsc.org/images/entities/char_e001.gif) C and C–H bonds as well as the stretching vibration of the carboxylic acid groups. The formation of the first three peaks was caused by the out of plane and in plane deformation modes of the C–H bond, with a main Raman band of 1601 cm−1 distributed on the main tensile vibration of C–C. Furthermore, the band at 1439 cm−1 is related to the stretching mode of carboxylic acid groups (–OOCC6H4COO– and –CH3COO–). The last one is caused by C–O–Fe stretching of the FeO6 hexahedron, exposing the creation of C–O–Fe coordination. The metal ions in the skeleton determine the formation of the above peaks, indicating an effective coordination between ligands and metal ions. It is worth noting that compared to MIL-88B (Fe), these four diffraction peaks showed a smaller degree of redshift, decreased diffraction peak intensity, and increased half peak width compared with those of MIL-88B (Fe, Ni), further proving the incorporation of Ni, which corresponded to the FTIR results. These results indicate that MIL-88B (Fe, Ni) has been effectively produced.
C and C–H bonds as well as the stretching vibration of the carboxylic acid groups. The formation of the first three peaks was caused by the out of plane and in plane deformation modes of the C–H bond, with a main Raman band of 1601 cm−1 distributed on the main tensile vibration of C–C. Furthermore, the band at 1439 cm−1 is related to the stretching mode of carboxylic acid groups (–OOCC6H4COO– and –CH3COO–). The last one is caused by C–O–Fe stretching of the FeO6 hexahedron, exposing the creation of C–O–Fe coordination. The metal ions in the skeleton determine the formation of the above peaks, indicating an effective coordination between ligands and metal ions. It is worth noting that compared to MIL-88B (Fe), these four diffraction peaks showed a smaller degree of redshift, decreased diffraction peak intensity, and increased half peak width compared with those of MIL-88B (Fe, Ni), further proving the incorporation of Ni, which corresponded to the FTIR results. These results indicate that MIL-88B (Fe, Ni) has been effectively produced.
XPS (X-ray photoelectron spectroscopy) of MIL-88B (Fe), MIL-88B (Ni), MIL-88B (Fe, Ni), and MIL-88B (Fe, Ni) after the reactions were measured to better understand the electronic states. The results showed that the C, N, O, Fe, and Ni elements were present in MIL-88B (Fe, Ni), which was compatible with the element mapping results, as shown in Fig. 2F. In order to quantitatively estimate the oxygen vacancy (OVs) concentration, the O 1s peak of MIL-88B (Fe, Ni) was analyzed and is shown in Fig. 3A and D. For MIL-88B (Fe, Ni), the peak at 530.04eV was due to lattice oxygen (Olatt),45–47 while the peak at 532.42eV was generated by contact with the hydroxyl oxygen (Oads) adsorbed on the catalyst surface.48,49 Second, the signal at 531.65 eV might have been formed by a defect site with a low hypoxic coordination, indicating the production of OVs on the surface of MIL-88B (Fe, Ni). Furthermore, MIL-88B (Fe, Ni) contained 58.02% OVs, which was much greater than MIL-88B (Fe) (44.74%) and MIL-88B (Ni) (33.51%). The results showed that Ni doping can, indeed, produce more OVs. It is noteworthy that the content of OVs in MIL-88B (Fe, Ni) was lowered to 42.53% during the catalytic process; inversely, lattice oxygen was increased from 17.69 to 41.39% during the reaction. An explanation for this might be that some oxygen vacancies could be changed to lattice oxygen during the reaction. Previous research has demonstrated that OVs may activate adsorbed oxygen and offer a lattice site for oxygen immigration, resulting in the formation of electrophilic oxygen species with significant catalytic activity. Defects, on the other hand, can be created in the co-oxidation state's energy band gap, and electrons that reside in this defect state are easily activated, considerably boosting the catalytic activity. The electron transfer pathway was disclosed through analysis of the XPS of Fe and Ni in MIL-88B (Fe, Ni), MIL-88B (Fe), and MIL-88B (Ni). The signal peaks of MIL-88B (Fe, Ni) at 725.67 eV and 712.06 eV were attributed to Fe2p1/2 and Fe2p3/2 of Fe3+ (Fig. 3B). Furthermore, the two characteristic peaks of Fe2p1/2 and Fe2p3/2 of Fe2+ were at 724.34 and 710.74 eV, respectively. Clearly, as compared with MIL-88B (Fe) (0.53), MIL-88B (Fe, Ni) exhibited a larger Fe3+/Fe2+ surface ratio (1.2) (Fig. 3E). This showed that the inclusion of the Ni element altered the electrical density of MIL-88B (Fe, Ni), and the Fe3+ content of MIL-88B (Fe, Ni) was much higher than that of MIL-88B (Fe). However, during the catalytic reaction, the Fe3+ content of MIL-88B (Fe, Ni) decreased while the Fe2+ content increased, indicating that electron transfer occurred during the catalytic reaction. As illustrated in Fig. 3C and F, the signal peaks of MIL-88B (Fe, Ni) at 874.51 eV and 856.61 eV were attributed to Ni2p1/2 and Ni2p3/2 of Ni2+. In addition, the two characteristic Ni2p1/2 and Ni2p3/2 peaks of Ni0 were found to be 873.06 and 855.57 eV, respectively. It should be noted that, as compared with MIL-88B (Ni), the Ni2+ content of MIL-88B (Fe, Ni) significantly decreased (61.39% → 40.28%). These phenomena indicated that by doping Ni, the electron transfer from Ni0 to Fe2+ was significant, leading to an increase in the proportion of Fe3+/Fe2+. Various phenomena indicate that Ni plays an important role in the redistribution of interface charges. It can replace a portion of Fe to form Fe2NiO clusters, transferring electrons from Ni to the MIL-88B (Fe) species. Second, the existence of a generous electron transfer on the surface may be the primary cause of the high enzyme activity.
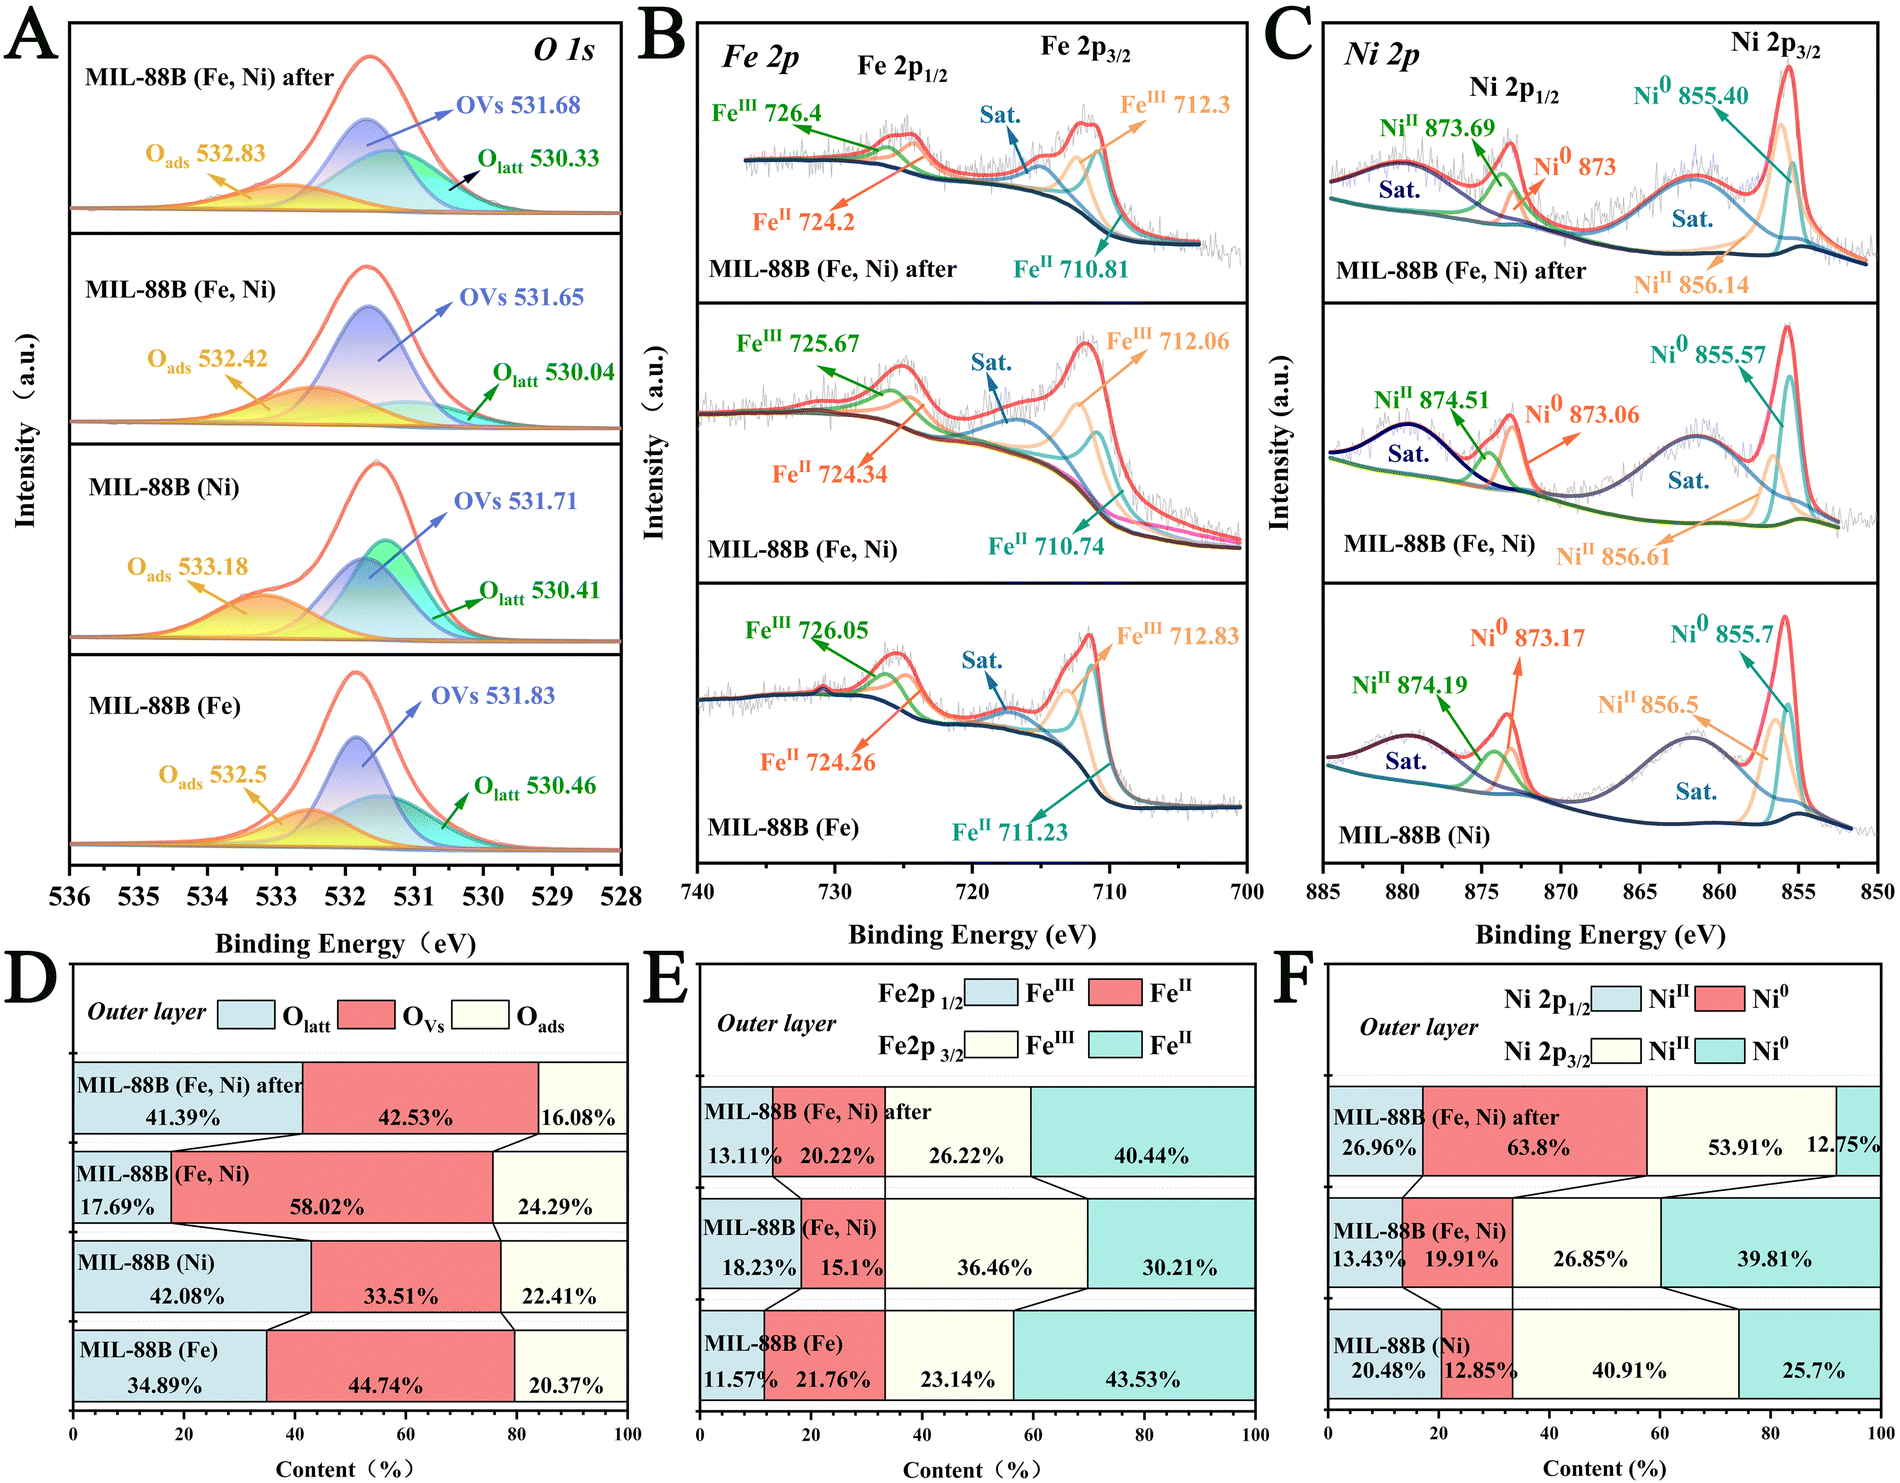 | ||
| Fig. 3 (A)–(C) XPS spectra of (A) O 1s of MIL-88B (Fe), MIL-88B (Ni), and MIL-88B (Fe, Ni), MIL-88B (Fe, Ni) after the experiment. (B) Fe2p of MIL-88B (Fe), MIL-88B (Fe, Ni), and MIL-88B (Fe, Ni) after the experiment. (C) Ni2p of MIL-88B (Ni), MIL-88B (Fe, Ni), and MIL-88B (Fe, Ni) after the experiment. (D)–(F) XPS spectra area percentage chart (D) O 1s of MIL-88B (Fe), MIL-88B (Ni), MIL-88B (Fe, Ni), and MIL-88B (Fe, Ni) after the experiment. (E) Fe2p of MIL-88B (Fe), MIL-88B (Fe, Ni), and MIL-88B (Fe, Ni) after the experiment. (F) Ni2p of MIL-88B (Ni), MIL-88B (Fe, Ni), and MIL-88B (Fe, Ni) after the experiment. | ||
3.2. DFT calculation
DFT (density functional theory) simulations were used to investigate the catalytic mechanism of the MIL-88B (Fe, Ni) H2O2 reduction. The adsorption model of H2O2 on different active sites (Fe3O site and Fe2NiO site) is shown in Fig. 4A. The free energy of H2O2 at various places during the adsorption and desorption procedures is depicted in Fig. 4B. It should be noted that the energy variation of RDS was Fe2NiO (0.53 eV) < Fe3O (0.97 eV). Fig. 4C demonstrates that MIL-88B (Fe, Ni) had a substantially reduced Gibbs free energy in RDS (G) than MIL-88B (Fe) because the formation of Fe2NiO clusters in MIL-88B (Fe, Ni) can accelerate the kinetics of catalytic reactions. Fig. 4D depicts the H2O2 catalytic process. The activated hydrogen peroxide was first adsorbed on the site that was active, and then it was evenly decomposed into two-OH* species, one of which desorbed from the adsorption site to create OH as a rate determining step (RDS). The additional adsorbed hydroxyl group would produce a water molecule by reacting with the protonation hydrogen atom. Afterwards, after hydrolysis and adsorption, the catalyst reverted to its original condition. As a result, MIL-88B (Fe, Ni) showed a strong catalytic ability, which was closely related to its OH generation (reduced energy barrier). At the same time, the formation of Fe2NiO clusters promoted more interactions between Fe3+ and Ni2+, a richer electron transfer, and the generation of more active sites, resulting in the good enzyme activity of MIL-88B (Fe, Ni).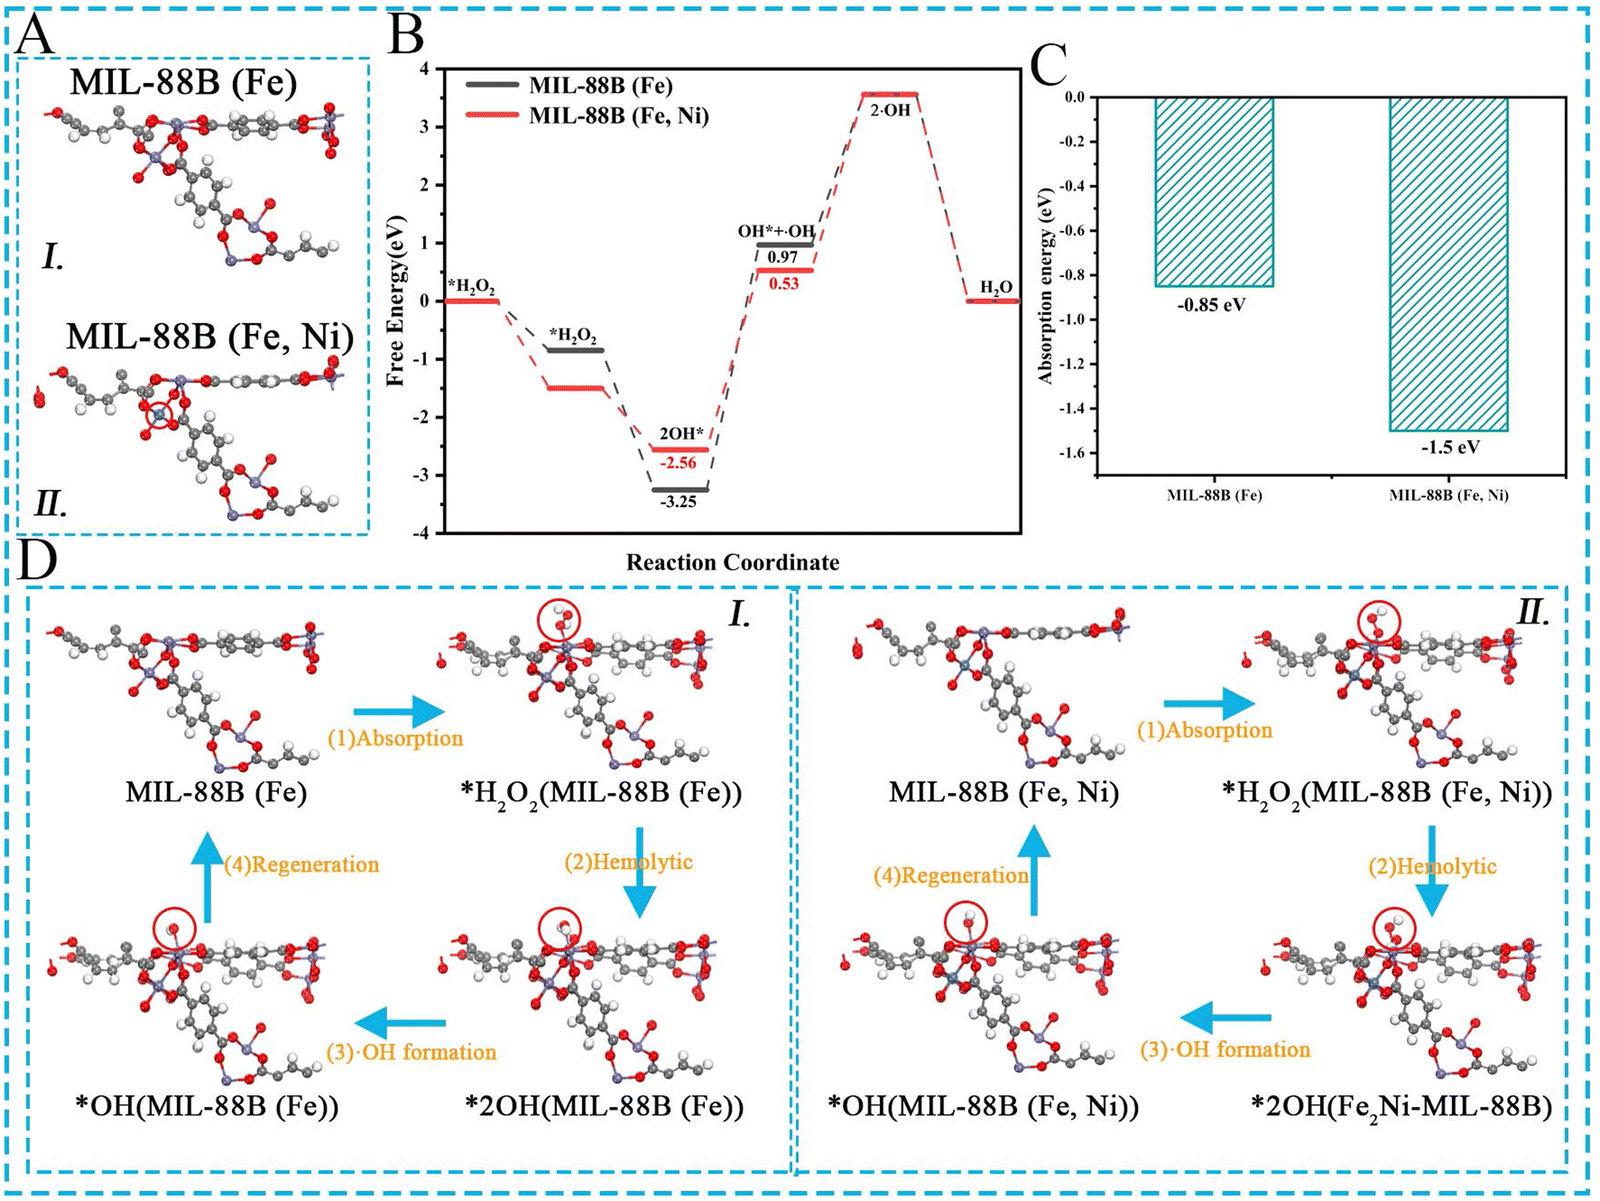 | ||
| Fig. 4 DFT calculations (A) show the adsorption model of MIL-88B (Fe)(I) and MIL-88B (Fe, Ni)(II) for H2O2. (B) Calculations were made of the free energies of MIL-88B (Fe) and MIL-88B at various locations during the adsorption and desorption of H2O2. (C) Calculations were made to determine the adsorption energies of MIL-88B (Fe) and MIL-88B (Fe, Ni) for H2O2. (D) The reaction process of H2O2 adsorption and desorption by MIL-88B (Fe)(I) and MIL-88B (Fe, Ni)(II) | ||
3.3. Examination of the catalytic activity and mechanism.
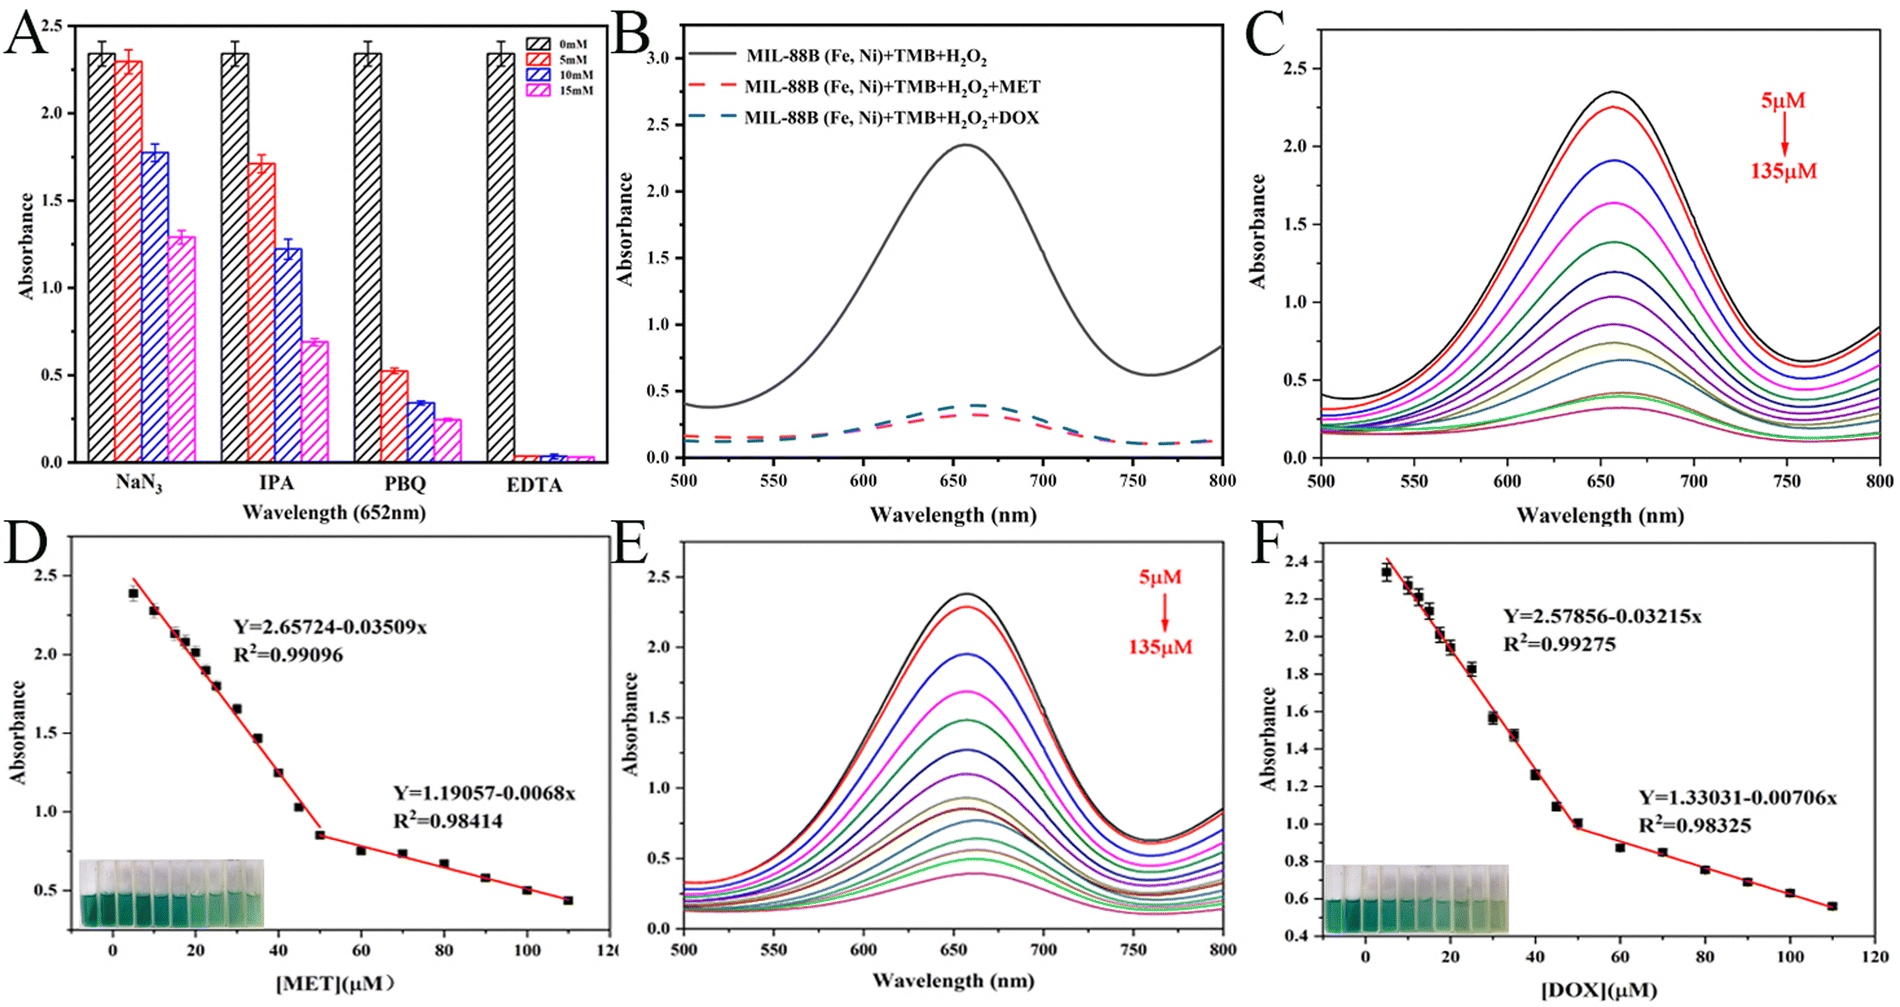 | ||
| Fig. 5 (A) The comparative activity of various scavengers on the MIL-88B (Fe, Ni)/TMB/H2O2 system (n = 3). (B) UV-vis absorption spectrum of the MIL-88B (Fe, Ni)/TMB/H2O2, MIL-88B (Fe, Ni)/TMB/H2O2/MET and MIL-88B (Fe, Ni)/TMB/H2O2/DOX systems. (C) and (D) UV-vis of MET and linear fitting based on MET concentration in the reaction system. (E) and (F) The UV-vis of DOX and linear fitting based on DOX concentration in the reaction system. | ||
3.4. Colorimetric biosensor analysis of doxycycline hydrochloride (DOX) and methyloxytetracycline hydrochloride (MET) based on peroxidase-like activity
In Fig. 5B, according to the peroxidase-like activity of MIL-88B (Fe, Ni), different systems were tested, including MIL-88B (Fe, Ni)/TMB/H2O2, MIL-88B (Fe, Ni)/TMB/H2O2/MET and MIL-88B (Fe, Ni)/TMB/H2O2/DOX. The absorbance reduced dramatically with the addition of MET or DOX, according to the findings. The absorbance at 652 nm gradually lowers as the MET amount increases (Fig. 5C). It was thought that in the 5–50 μM range, there was a good linear relationship between absorbance value and MET concentration, and the linear relationship was y = 2.6572x + 0.0351 (Fig. 5D). With the increase of DOX content, its absorbance at 652 nm also decreased slowly, and there was a good linear relationship with y = 2.5874 − 0.032x between its absorbance value and the DOX concentration (Fig. 5E and F). Based on 3σ/B (of which σ was the standard deviation of the blank signal, and B was the slope of the regression line), the limit of detection (LOD) was 0.8524 μM and 1.0553 μM (S/N = 3). The LOD value was less than the national safety standard's maximum antibiotic limit. In comparison to other detection techniques, it additionally showed the advantages of a low limit of detection and a wide linear range (Table S3, ESI†). These findings showed that MIL-88B (Fe, Ni) as a sensor had considerable promise for quantitative antibiotic detection. In short, under the action of the peroxidase-like enzyme of MIL-88B (Fe, Ni), the MET/DOX double detection with “blocking” mechanism was successfully constructed. When MET/DOX is not present, the sensor is in the “ON” state during the TMB oxidation catalyzed by MIL-88B (Fe, Ni). When MET/DOX was present, the absorbance was greatly reduced, and the sensor was in the “off” state.3.5. Building a smartphone platform
Furthermore, a self-developed portable smart phone platform was constructed in conjunction with the visual colorimetric signal. As shown in Fig. 6A, the overall blue color of the system gradually grew lighter as various concentration gradients of MET were added, and then the images were collected through smart phones. The R/G value and MET concentration were then chosen for a linear fit. In the end, the fitting curve y = 3.9864 + 1000.7428x (R2 = 0.9812) was automatically generated, and thus the objective of MET visualization and convenient detection was achieved. Likewise, smart phones may also detect DOX through the fitting curve y = 17.5205 + 897.4938x (R2 = 0.9835) (Fig. 6B).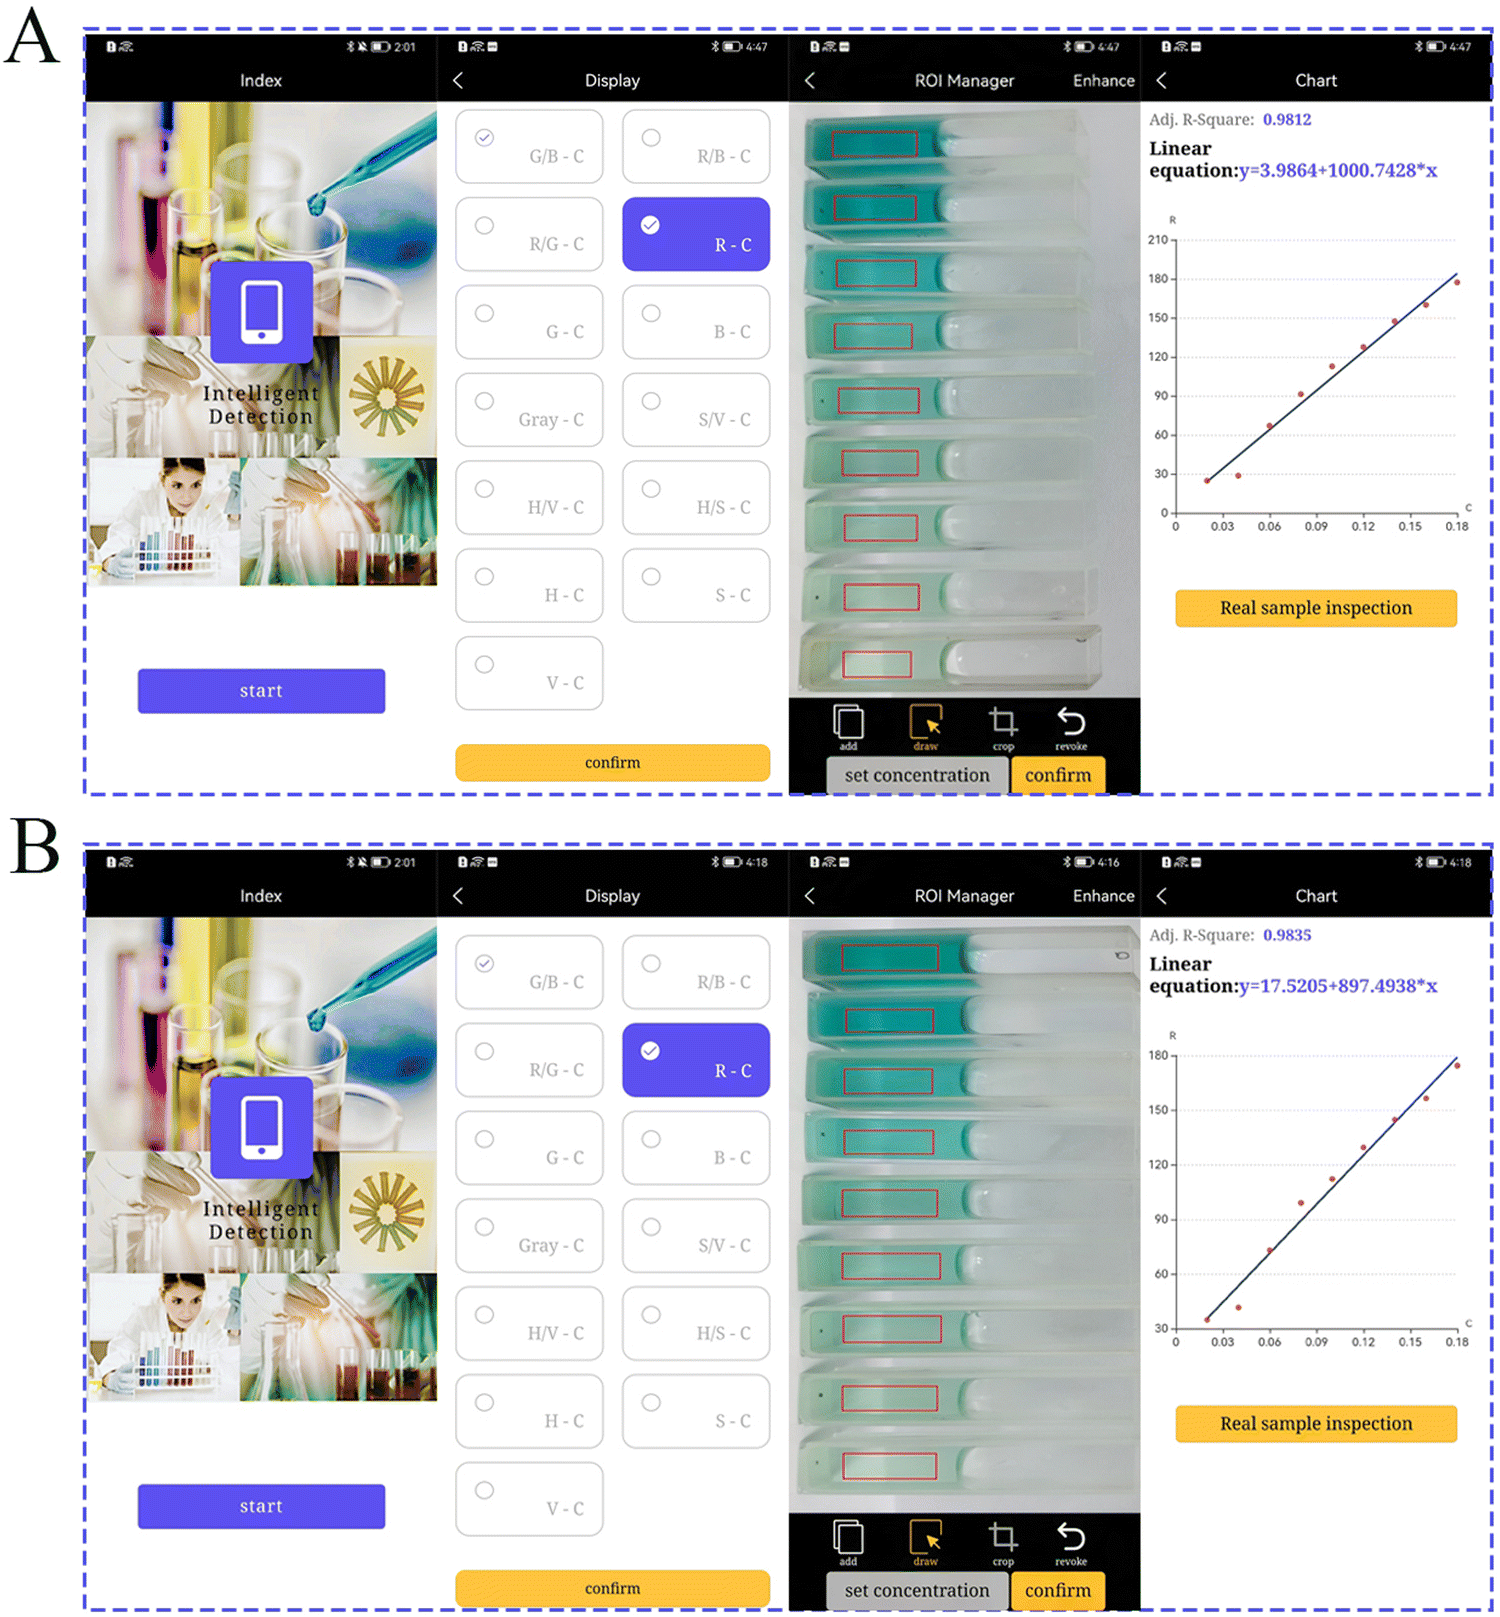 | ||
| Fig. 6 (A) and (B) The RGB smartphone platform generates MET/DOX color signals as well as a linear fitting. | ||
3.6. Real sample analysis
To assess the method's applicability for realistic samples, MET and DOX in drug samples were evaluated through the use of added standard methods. Various medication concentrations were added to the soil and water (Table S3, ESI†). In comparison to the standard value, DOX recovered at a rate of 101.43%–102.98%, and the relative standard deviation (RSD) was 1.02%–2.43% (n = 3). Using the same method to detect MET, the MET recovery rate ranged from 99.57% to 103.01%, and the RSD ranged from 1.35% to 2.20% (n = 3). The test results validated the colorimetric sensing validity and suitability for use in real sample analysis.Actual samples of DOX and MET were tested using the smart phone to demonstrate the viability of the RGB platform for mobile devices. In comparison to the norm and measurements of a UV spectrophotometer, the smartphone platform can effectively measure the concentrations of substances that were actually determined with an RSD of less than 3%. The outcomes demonstrated that the colorimetric sensor of a smartphone was accurate and practical for the examination of actual samples.
3.7. Selectivity and stability assay
By studying and contrasting certain probable interfering factors, the specificity was assessed. As shown in Fig. S5 (ESI†), an antibiotic interference test was carried out on ciprofloxacin, formezin, atrazine, amoxicillin and other substances. Except for DOX/MET (very low absorbance), the absorption spectra of other substances were similar to that of the blanks. According to the results, MIL-88B (Fe, Ni) has an excellent specificity for DOX/MET, and the interference degree was 100 times that. The same conditions were used to measure the absorbance of 10 parallel samples, and the peroxidase RSD deviation was 2.29%. This also proved that the catalytic ability of MIL-88B (Fe, Ni) had a good reproducibility. In addition, MIL-88B (Fe, Ni) can maintain a good catalytic activity even after 30 days. Due to the high stability of peroxidase, the RSD of peroxidase activity was only 1.39%. It was proved that MIL-88B (Fe, Ni) has a good reproducibility and stability.4. Conclusion
In summary, with the help of Fe2NiO clusters, MIL-88B (Fe, Ni) bimetallic MOF exhibited an excellent dual enzyme activity. Additionally, a number of characterization and density functional theory (DFT) calculations can be used to comprehend its catalytic mechanism, emphasizing the significance that transition metal element doping plays in enhancing its catalytic activity. Following that, a deep learning-based colorimetric approach and an intelligent detection platform were built. For peroxidase activity, MTE and DOX can be detected concurrently based on changes in the “off” signal, with a linear range of 5–135 μM. The detection mechanism showed that the generated MET and DOX can inhibit the bimetallic catalytic active site (Fe2NiO), which reduced the UV visible signal. Real-time monitoring for antibiotic residues has been developed through the combination of colorimetric sensing and portable smartphones.Author contributions
Kaixin Pu and Mengmeng Sun contributed equally to this work.Conflicts of interest
The authors declare no conflict of interest.Acknowledgements
The authors thank the financial support of this work by the Science and Technology Program of Sichuan Province (Grant No. 2022NSFSC0227, 2022NSFSC1266 and 2022NSFSC1924), the Science and Technology Program of Ya’an Province (Project No. 22KJJH006), the Two-Way Support Team Programs of the Sichuan Agricultural University (Project No. 2121993048), and the National Natural Science Foundation of China (Grant No. 21905186 and 32001009).References
- Z. Wang, R. Zhang, X. Yan and K. Fan, Mater. Today, 2020, 41, 81–119 CrossRef CAS.
- L. Gao, J. Zhuang, L. Nie, J. Zhang, Y. Zhang, N. Gu, T. Wang, J. Feng, D. Yang, S. Perrett and X. Yan, Nat. Nanotechnol., 2007, 2, 577–583 CrossRef CAS PubMed.
- D. Zhang, P. Du, J. Chen, H. Guo and X. Lu, Sens. Actuators, B, 2021, 341, 13000 Search PubMed.
- F. Attar, M. G. Shahpar, B. Rasti, M. Sharifi, A. A. Saboury, S. M. Rezayat and M. Falahati, J. Mol. Liq., 2019, 278, 130–144 CrossRef CAS.
- B. Liu, Z. Sun, P. J. Huang and J. Liu, J. Am. Chem. Soc., 2015, 137, 1290–1295 CrossRef CAS PubMed.
- N. Singh, S. K. NaveenKumar, M. Geethika and G. Mugesh, Angew. Chem., Int. Ed., 2021, 60, 3121–3130 CrossRef CAS PubMed.
- J. Wu, Y. Yu, Y. Cheng, C. Cheng, Y. Zhang, B. Jiang, X. Zhao, L. Miao and H. Wei, Angew. Chem., Int. Ed., 2021, 60, 1227–1234 CrossRef CAS PubMed.
- M. Li, J. Chen, W. Wu, Y. Fang and S. Dong, J. Am. Chem. Soc., 2020, 142, 15569–15574 CrossRef CAS PubMed.
- Q. Liu, A. Zhang, R. Wang, Q. Zhang and D. Cui, Nanomicro Lett, 2021, 13, 154 CAS.
- P. Borthakur, G. Darabdhara, M. R. Das, R. Boukherroub and S. Szunerits, Sens. Actuators, B, 2017, 244, 684–692 CrossRef CAS.
- J. Zhang, X. Lu, D. Tang, S. Wu, X. Hou, J. Liu and P. Wu, ACS Appl. Mater. Interfaces, 2018, 10, 40808–40814 CrossRef CAS PubMed.
- A. M. Ashrafi, Z. Bytesnikova, J. Barek, L. Richtera and V. Adam, Biosens. Bioelectron., 2021, 192, 113494 CrossRef CAS PubMed.
- A. Apriceno, I. Silvestro, A. Girelli, I. Francolini, L. Pietrelli and A. Piozzi, Polymers, 2021, 13, 1453 CrossRef CAS PubMed.
- F. Wang, Z. F. Li, Y. Y. Yang, D. B. Wan, N. Vasylieva, Y. Q. Zhang, J. Cai, H. Wang, Y. D. Shen, Z. L. Xu and B. D. Hammock, Anal. Chem., 2020, 92, 11935–11942 CrossRef CAS PubMed.
- S.-S. Ding, L. He, X.-W. Bian and G. Tian, Nano Today, 2020, 35, 100920 CrossRef CAS.
- H. Furukawa, K. E. Cordova, M. O'Keeffe and O. M. Yaghi, Science, 2013, 341, 1230444 CrossRef PubMed.
- L. E. Kreno, K. Leong, O. K. Farha, M. Allendorf, R. P. Van Duyne and J. T. Hupp, Chem. Rev., 2012, 112, 1105–1125 CrossRef CAS PubMed.
- J.-Q. Chen, Z. Sharifzadeh, F. Bigdeli, S. Gholizadeh, Z. Li, M.-L. Hu and A. Morsali, J. Environ. Chem. Eng., 2023, 11, 109469 CrossRef CAS.
- U. Kökçam-Demir, A. Goldman, L. Esrafili, M. Gharib, A. Morsali, O. Weingart and C. Janiak, Chem. Soc. Rev., 2020, 49, 2751–2798 RSC.
- X. Wen, Q. Zhang and J. Guan, Coord. Chem. Rev., 2020, 409, 213214 CrossRef CAS.
- L. Wang and Y. Chen, Sens. Actuators, B, 2022, 350, 130842 CrossRef CAS.
- M. Han, M. Ren, Z. Li, L. Qu and L. Yu, New J. Chem., 2022, 46, 10682–10689 RSC.
- Z. Sharifzadeh, S. A. A. Razavi and A. Morsali, Green Chem., 2023, 25, 8661–8678 RSC.
- A. A. Zemtsov, V. V. Levin and A. D. Dilman, Coord. Chem. Rev., 2022, 459, 214455 CrossRef CAS.
- D. I. Osman, S. M. Sheta, S. M. El-Sheikh, O. I. Ali, A. M. Salem, W. G. Shousha, S. F. EL-Khamisy and S. M. Shawky, Biosens. Bioelectron., 2019, 141, 111451 CrossRef CAS PubMed.
- J. Li, W. Huang, M. Wang, S. Xi, J. Meng, K. Zhao, J. Jin, W. Xu, Z. Wang, X. Liu, Q. Chen, L. Xu, X. Liao, Y. Jiang, K. A. Owusu, B. Jiang, C. Chen, D. Fan, L. Zhou and L. Mai, ACS Energy Lett., 2019, 4, 285–292 CrossRef CAS.
- N. Zhou, F. Su, C. Guo, L. He, Z. Jia, M. Wang, Q. Jia, Z. Zhang and S. Lu, Biosens. Bioelectron., 2019, 123, 51–58 CrossRef CAS PubMed.
- Y. Zhang, A. Khalique, X. Du, Z. Gao, J. Wu, X. Zhang, R. Zhang, Z. Sun, Q. Liu, Z. Xu, A. C. Midgley, L. Wang, X. Yan, J. Zhuang, D. Kong and X. Huang, Adv. Mater., 2021, 33, e2006570 CrossRef PubMed.
- J. Li, N. Lu, S. Han, X. Li and M. Zhang, ACS Appl. Mater. Interfaces, 2021, 13, 21040–21050 CrossRef CAS PubMed.
- Y. Gu, D. Xie, Y. Wang, W. Qin, H. Zhang, G. Wang, Y. Zhang and H. Zhao, Chem. Eng. J., 2019, 357, 579–588 CrossRef CAS.
- D. Bara, E. G. Meekel, I. Pakamorė, C. Wilson, S. Ling and R. S. Forgan, Mater. Horiz., 2021, 8, 3377–3386 RSC.
- C. Monahan, S. Harris, D. Morris and E. Cummins, Sci. Total Environ., 2022, 826, 154008 CrossRef CAS PubMed.
- J. O. Abdulsattar, H. Hadi, S. Richardson, A. Iles and N. Pamme, Anal. Chim. Acta, 2020, 1136, 196–204 CrossRef CAS PubMed.
- M. Gamal, I. A. Naguib and R. M. Abdelfatah, Arch. Pharm., 2021, 354, e2100131 CrossRef PubMed.
- W. D. Linsell and A. P. Fletcher, Br. Med. J., 1950, 2, 1190–1195 CrossRef CAS PubMed.
- R. Abazari, S. Sanati and A. Morsali, Inorg. Chem., 2022, 61, 3396–3405 CrossRef CAS PubMed.
- G. T. Vuong, M. H. Pham and T. O. Do, Dalton Trans., 2013, 42, 550–557 RSC.
- C. Wu, X. Zhang, H. Li, Z. Xia and G. Sun, Chin. J. Catal., 2021, 42, 637–647 CrossRef CAS.
- B. Jiang, D. Duan, L. Gao, M. Zhou, K. Fan, Y. Tang, J. Xi, Y. Bi, Z. Tong, G. F. Gao, N. Xie, A. Tang, G. Nie, M. Liang and X. Yan, Nat. Protoc., 2018, 13, 1506–1520 CrossRef CAS PubMed.
- G.-T. Vuong, M.-H. Pham and T.-O. Do, CrystEngComm, 2013, 15, 9694–9703 RSC.
- W. Cho, S. Park and M. Oh, Chem. Commun., 2011, 47, 4138–4140 RSC.
- F. Sun, G. Wang, Y. Ding, C. Wang, B. Yuan and Y. Lin, Adv. Energy Mater., 2018, 8, 1800584 CrossRef.
- B. Iqbal, M. Saleem, S. N. Arshad, J. Rashid, N. Hussain and M. Zaheer, Chemistry, 2019, 25, 10490–10498 CrossRef CAS PubMed.
- C. Xu, M. Bao, J. Ren and Z. Zhang, RSC Adv., 2020, 10, 39080–39086 RSC.
- H. Sun, J.-G. Li, L. Lv, Z. Li, X. Ao, C. Xu, X. Xue, G. Hong and C. Wang, J. Power Sources, 2019, 425, 138–146 CrossRef CAS.
- W. Luo, C. Jiang, Y. Li, S. A. Shevlin, X. Han, K. Qiu, Y. Cheng, Z. Guo, W. Huang and J. Tang, J. Mater. Chem. A, 2017, 5, 2021–2028 RSC.
- J. G. Li, Y. Gu, H. Sun, L. Lv, Z. Li, X. Ao, X. Xue, G. Hong and C. Wang, Nanoscale, 2019, 11, 19959–19968 RSC.
- Y. J. Li, L. Cui, P. F. Da, K. W. Qiu, W. J. Qin, W. B. Hu, X. W. Du, K. Davey, T. Ling and S. Z. Qiao, Adv. Mater., 2018, 30, e1804653 CrossRef PubMed.
- S. Zhao, Y. Wang, J. Dong, C.-T. He, H. Yin, P. An, K. Zhao, X. Zhang, C. Gao, L. Zhang, J. Lv, J. Wang, J. Zhang, A. M. Khattak, N. A. Khan, Z. Wei, J. Zhang, S. Liu, H. Zhao and Z. Tang, Nat. Energy, 2016, 1, 16184 CrossRef CAS.
- S. Li, L. Wang, X. Zhang, H. Chai and Y. Huang, Sens. Actuators, B, 2018, 264, 312–319 CrossRef CAS.
- X. Zhang, A. Yuan, X. Mao, Q. Chen and Y. Huang, Sens. Actuators, B, 2019, 299, 126928 CrossRef CAS.
- T. M. Chen, X. M. Tian, L. Huang, J. Xiao and G. W. Yang, Nanoscale, 2017, 9, 15673–15684 RSC.
- D. Yıldırım, B. Gökçal, E. Büber, Ç. Kip, M. C. Demir and A. Tuncel, Chem. Eng. J., 2021, 403, 126357 CrossRef.
Footnotes |
| † Electronic supplementary information (ESI) available. See DOI: https://doi.org/10.1039/d3tc03275b |
| ‡ The authors wish it to be known that, in their opinions, Mengmeng Sun and Kaixin Pu should be regarded as joint First Authors. |
| This journal is © The Royal Society of Chemistry 2024 |