
 Open Access Article
 This Open Access Article is licensed under a Creative Commons Attribution-Non Commercial 3.0 Unported Licence
In search of widening the electrochemical window of solid electrolytes for Li-batteries: the La0.29Li0.12+xM1−xZrxO3 (M = Nb, Ta) perovskite-type systems†
Ester
García-González
 a,
Rafael
Marín-Gamero
a,
Miguel
Kuhn-Gómez
a,
Alois
Kuhn
b,
Flaviano
García-Alvarado
b and
Susana
García-Martín
*a
a,
Rafael
Marín-Gamero
a,
Miguel
Kuhn-Gómez
a,
Alois
Kuhn
b,
Flaviano
García-Alvarado
b and
Susana
García-Martín
*a
aDepartamento de Química Inorgánica I, Facultad de Ciencias Químicas, Universidad Complutense, 28040 Madrid, Spain. E-mail: sgmartin@ucm.es
bDepartamento de Química y Bioquímica, Facultad de Farmacia, Universidad San Pablo-CEU, CEU Universities, Urbanización Montepríncipe, Boadilla del Monte, E-28668, Madrid, Spain
First published on 18th September 2024
Abstract
All solid-state batteries (ASSBs) are required to address challenges of the last generation of Li-batteries such as advances in safety performance, energy density and battery life. Progress of Li-ASSBs requires the development of solid electrolytes with high Li-conductivity and wide electrochemical window. The La(2/3)−xLi3xTiO3 (LLTO) oxides present the highest “bulk” Li-conductivity among the electrolytes with perovskite structure but present significant grain boundary effects that decrease the total conductivity and confer poor electrochemical stability. The oxides of the La(1/3)−xLi3xNbO3 system (LLNO) present slightly lower reduction voltages than the LLTO-oxides and similar values of total conductivity. We have studied the La0.29Li0.12+xNb1−xZrxO3 (LLNZO) and La0.29Li0.12+xTa1−xZrxO3 (LLTaZO) systems with the aim of increasing the Li-conductivity and electrochemical stability of perovskite-based electrolyte oxides. Conductivity values as high as in LLNO are found in the LLNZO system but somewhat lower in the LLTaZO system. However, the electrochemical window of these new solid electrolytes is remarkably wide, in particular in the La0.29Li0.17Ta0.95Zr0.05O3 compound, which is stable between 1.35 and 4.8 V vs. Li+/Li.
Introduction
Li-ion batteries (LIBs) are currently the most advanced energy storage systems for portable electronic devices, such as mobile phones and computers, due to their high gravimetric/volumetric energy density, high flexibility of geometry, long cycle life, and low self-discharge. However, the complete introduction of LIBs in the growing fields of electric vehicles and grid energy storage requires improvements in safety and cost reduction. Commercial LIBs use flammable organic liquid electrolytes that decompose when high voltage electrodes are used. On the other hand, these electrolytes react with anodes at low voltage to form a lithium-ion permeable passivation layer, the solid electrolyte interphase (SEI), and consume lithium. In the best cases, the SEI is stable and does not consume any more lithium after the first discharge. At worst, the destruction and formation of the SEI during cycling will deplete the electrolyte of lithium and shorten the battery life. In this context, all solid-state batteries (ASSBs) using a thin solid electrolyte are required to address safety and coulombic efficiency issues while increasing energy density. Despite considerable advances in ASSBs that have been achieved during the past few decades, several challenges still exist that hinder their practical applications and commercialization.1 Progress of Li-ASSBs requires the development of solid electrolytes with high Li-conductivity, negligible electronic conductivity, wide electrochemical window, and chemical compatibility with the electrodes. A variety of inorganic oxides and sulfides, as well as polymers have been investigated as solid electrolytes for Li-ASSBs.2–5 In general, sulfides exhibit higher total conductivity with low grain-boundary resistance and higher mechanical robustness than oxides. However, the electrochemical window of oxides is significantly wider due to their high oxidation potential (in some cases above 4.0 V). First-principles calculations suggest that this high voltage stabilization is not thermodynamically intrinsic but is associated with slow kinetics of decomposition reactions that lead to the formation of passivation layers at the interface, which inhibit further decomposition of the electrolyte.6 In addition to oxides and sulfides, newly emerging halide solid state electrolytes have recently been intensively studied for application in ASSBs due to their favorable combination of high ionic conductivity, high chemical and electrochemical stability, and superior mechanical deformability.7 Regarding oxides, garnet-type, and perovskite-type Li-oxides are considered among the most promising (and most explored) solid electrolytes. In general, lithium-garnet oxides exhibit excellent stability against Li metal concluded by their low reduction potential versus Li+/Li (0.05 V in the case of Li7La3Zr2O12). However, these compounds are air-sensitive to the atmosphere (moisture and CO2) which greatly affects their application as electrolytes. In contrast, lithium-perovskite oxides present higher chemical stability although higher reduction potential. Perovskite-type oxides (ABO3 stoichiometry) have been widely investigated since Li-ion conductivity as high as ≈1 × 10⁻³ S cm−1 at room temperature was reported in 1993 in a compound of the family La(2/3)−xLi3xTiO3 (LLTO) that contains A-cation vacancies.8 Despite their high bulk Li-conductivity, the LLTO-oxides present large grain boundary resistances that significantly decrease the total conductivity. Besides, these electrolytes have a relatively narrow electrochemical window because intercalation of Li with reduction of Ti4+ occurs at about 2 V.9–11 Several systems have been developed by substituting other transition metals for Ti to widen the electrochemical window and/or to decrease the grain boundary resistance.12–19 The current interest seems to be focused on Li-perovskites of transition metals of the second and third rows of the periodic table, mainly on Nb-perovskites with low grain boundary resistances leading to total Li-conductivity in the range from 10−4 to 10−5 S cm−1 at room temperature and reduction potentials vs. Li+/Li lower than 2 V.In this context, following initial reports, the study of the system La(1/3)−xLi3xNbO3 regained a great deal of attention.20–22 The range of existence of the solid solution corresponds to 0 ≤ x ≤ 0.06 and the oxide with the highest ionic conductivity is the one of composition La0.29Li0.12NbO3 (x = 0.04).13 In addition to the slight reduction of the intercalation voltage compared to the LLTO-oxides, the Nb-perovskites have the benefit that they show similar values of grain boundary and bulk resistances,13,22 contrary to the Ti-perovskites that, as mentioned above, present high grain boundary resistances, which have been attributed to lithium depletion in the space charge region.23 However, the bulk ionic conductivity in the titanates still is higher than in the niobates, which might be related to differences in the crystal structure, in particular in the location of the cation vacancies that contribute to the Li-motion paths. The average crystal structure of oxides of La(2/3)−xLi3xTiO3 system contains (00l)-layers of La atoms alternating with (00l)-layers of Li and La atoms and vacancies along the [001] direction of the crystal structure.24 In the oxides of the La(1/3)−xLi3xNbO3 system, (00l)-layers of cation vacancies (empty crystallographic positions), which probably do not contribute to the Li-motion, alternate with (00l)-layers containing La, Li, and vacancies (Fig. 1).25 In addition to the ordering of these empty positions along the [001] direction, a modulation of the crystal structure associated with the La/Li/vacancies planes has been revealed by transmission electron microscopy, a likely additional barrier to the Li motion.25–27 The La(1/3)−xLi3xTaO3 system has been less explored although previous studies report that these oxides present a similar average crystal structure to the corresponding Nb-oxides and that the highest ionic conductivity, although lower than in the Nb system, is achieved for the compound with x = 0.06.28
 | ||
| Fig. 1 Schematic representation of the crystal structure of La(1/3)−xLi3xNbO3 oxides. | ||
We report in this article the study of La0.29Li0.12+xNb1−xZrxO3 and La0.29Li0.12+xTa1−xZrxO3 systems. The x = 0 compounds correspond to the stoichiometry with the highest conductivity of the niobates.13 The aim of this work is to improve the ionic conductivity, compared to the La0.29Li0.12MO3 oxides (M = Nb, Ta), by increasing the Li content. In this sense, the substitution of Nb5+ (or Ta5+) by Zr4+ requires an increase of Li+ cations within the A-positions of the crystal structure, decreasing the high concentration of ordered cation vacancies and, in principle, favoring the less ordered structure of the Ti-system. Furthermore, replacing Nb(Ta) with Zr is expected to widen the electrochemical window of the electrolytes.
Experimental section
Synthesis
La0.29Li0.12+xNb1−xZrxO3 and La0.29Li0.12+xTa1−xZrxO3 oxides with 0.05 ≤ x ≤ 0.2 have been prepared by the conventional ceramic method using Li2CO3 (Sigma-Aldrich ≥ 99.00%), La2O3 (Sigma-Aldrich 99.99%), Nb2O5 (Sigma-Aldrich 99.99%), Ta2O5 (Sigma-Aldrich 99.00%) and ZrO2 (Riedel-de Haën A.G. pure). La2O3 was dried at 1173 K prior to weighing in order to eliminate La(OH)3. Stoichiometric amounts of the starting materials were mixed and heated at 1173 K in air to decompose the lithium carbonate. Afterwards, the samples were pelletized and heated at 1523 K in air for 48 h with intermediate grindings. The pellets were covered with a powder of the same composition to avoid Li-losses. Fast cooling of the samples was carried out by taking them out of the furnace at 1523 K to avoid A-cation ordering. The La0.29Li0.12NbO3 (LLNO) composition was also prepared and studied for comparison with previous reports.13Crystal structure characterization
The initial crystalline phase identification was carried out by powder X-ray diffraction (PXRD) using a PANalytical X'PERT PRO MPD diffractometer with Cu Kα radiation and X'PERT PEAPD software. The patterns were recorded in step mode with a step size equal to 0.02 (2θ degrees) and time per step equal to 10 s. Le Bail fitting of the XRD patterns was performed to obtain the lattice parameters of the phases in every sample using Fullprof software.29,30For transmission electron microscopy (TEM) studies, the compounds were ground in n-butyl alcohol and ultrasonically dispersed. A few drops of the resulting suspension were deposited on a carbon-coated copper grid. The selected-area electron diffraction (SAED) and high-resolution transmission electron microscopy (HRTEM) experiments were performed on a JEOL JEM 3000F microscope operating at 300 kV (double tilt ±20°) (point resolution 0.17 nm), fitted with an X-ray energy dispersive spectroscopy (XEDS) microanalysis system (OXFORD INCA) and an ENFINA spectrometer with an energy resolution of 1.3 eV. The atomic ratio of the La, Nb(Ta) and Zr metals was determined by XEDS in at least 20 crystals of each sample.
Electrical characterization
The electrical behavior of the oxides in air and at different temperatures was evaluated by AC impedance spectroscopy. Pellets of 10 mm diameter and 1.2 mm thickness were prepared by pressing the powder samples and sintering them at 1473 K. Electrodes were made by coating opposite pellet faces with platinum paste and heating to 1123 K. The impedance experiments were carried out using a frequency response analyzer Solartron 1255A with a dielectric interface 1296. Measurements were performed in air with heating and cooling cycles between 298 and 473 K, in the frequency range of 10−1 to 107 Hz, and an excitation voltage of 50 mV.Electrochemical characterization
To study the electrochemical stability of the oxides, positive electrodes were prepared from a mixture of the studied oxide, Super C65 conductive carbon, and PVDF binder in an 80![[thin space (1/6-em)]](https://www.rsc.org/images/entities/char_2009.gif) :10:10 weight ratio. Following prolonged stirring, slurries elaborated with NMP as a solvent were cast onto thin copper foil. Disc electrodes with 12 mm diameter were cut and dried at 353 K for 24 h under vacuum. The typical mass load of active material was 1.5–2 mg cm−2 in every electrode. A lithium metal disc was used as the negative electrode. The electrolyte was 1 M LiPF6 in 1:1 v/v ethylene carbonate (EC):dimethyl carbonate (DMC) using Whatman GF/D glass fiber as a separator. Cell assembly was performed in an argon-filled glove box (H2O and O2 content < 0.1 ppm). All electrochemical tests were performed in CR2032 coin cells at 298 K. Cyclic voltammetry was performed at a scan rate of 0.50 mV s−1 in the 3.0–0.0 V and 3.0–5.0 V potential ranges.
:10:10 weight ratio. Following prolonged stirring, slurries elaborated with NMP as a solvent were cast onto thin copper foil. Disc electrodes with 12 mm diameter were cut and dried at 353 K for 24 h under vacuum. The typical mass load of active material was 1.5–2 mg cm−2 in every electrode. A lithium metal disc was used as the negative electrode. The electrolyte was 1 M LiPF6 in 1:1 v/v ethylene carbonate (EC):dimethyl carbonate (DMC) using Whatman GF/D glass fiber as a separator. Cell assembly was performed in an argon-filled glove box (H2O and O2 content < 0.1 ppm). All electrochemical tests were performed in CR2032 coin cells at 298 K. Cyclic voltammetry was performed at a scan rate of 0.50 mV s−1 in the 3.0–0.0 V and 3.0–5.0 V potential ranges.
Results and discussion
Crystal structure and microstructure
Powder X-ray diffraction performed on the compounds La0.29Li0.12+xNb1−xZrxO3 and La0.29Li0.12+xTa1−xZrxO3, showed that only samples with x = 0.05 and 0.1 (the Nb-oxides named LLNZ05 and LLNZ10, and the Ta-oxides named LLTaZ05 and LLTaZ10) are single phases. The corresponding powder X-ray diffraction patterns (Fig. S1 in the ESI†) show the characteristic diffraction maxima of the perovskite structure. Besides, extra reflections related to the √2ap × √2ap × 2ap superstructure are observed (ap refers to the lattice parameter of the cubic perovskite). The unit cell has been considered taking into account the weak modulation of the crystal structure observed in the SAED patterns and HRTEM images of crystals of the studied oxides (see below). The double parameter results from the layered ordering of the La3+ and Li+ cations and vacancies (alternation of (00l) planes with A-vacancies and (00l) planes containing mainly La3+ and Li+ cations) and the √2 factors related to modulation of the tilting of the anion-octahedra sublattice in combination with compositional modulation along the [110]p direction. The atomic ratio of the La, Nb(Ta) and Zr metals has been determined by XEDS in TEM mode, finding good agreement between experimental and nominal composition in all the crystals of the samples (Table S1 in the ESI†). The lattice parameters have been obtained from Le Bail profile fitting of the XRD patterns (Table S2†). In the case of the samples of composition corresponding to values of x higher than 0.1, secondary phases were detected in addition. The hindrance to obtaining oxides with higher Zr-content under the synthesis conditions used in this work might be related to the cation-vacancy ordering within the crystal structure, since higher Zr-content implies partial filling of the empty (00l)-layers with Li-atoms, thus affecting the lamellar ordering of La, Li and vacancies that seems to stabilize the crystal structure.Fig. 2 shows HRTEM images and the corresponding SAED pattern or Fourier Transform, representative of crystals of both the La0.29Li0.22Nb1−xZrxO3 and La0.29Li0.22Ta1−xZrxO3 studied oxides in illustrative orientations. Diffraction patterns have been indexed according to the cubic perovskite structure (ap ≈ 4 Å) (see the ESI†). In the SAED pattern along [100]p (Fig. 2a), in addition to the Bragg-reflections characteristic of the perovskite, Gp ± 1/2(001)* diffraction maxima associated with layered ordering of the La, Li and vacancies along the [001]p direction are detected, in agreement with the XRD results. The contrast differences observed in the HRTEM image (Fig. 2b) clearly show periodicity in accordance with doubling of the perovskite unit cell (2ap). The SAED pattern along the [001]p zone axis and the corresponding HRTEM image are shown in Fig. 2c and d, respectively for a crystal of La0.29Li0.22Nb0.9Zr0.1O3. Four faint reflections in a cross-like arrangement are present at Gp ± 1/2(110)* with arms parallel to [100]p and [010]p directions. The Gp ± 1/2(110)* reflections are associated with the tilting of the octahedral network and the splitting of these reflections into four has been ascribed to the formation of antiphase domains of the twinning of the tilting system in perovskites that present layered-type ordering of two different cations (lanthanide and alkaline atoms) in the A-positions of the structure.25–28,31–37 We should mention at this point that, in the case of the Ta compounds, SAED patterns have not given us experimental evidence of the presence of reflections at Gp ± 1/2(110)*, probably due to their very low intensity. In addition to the tilting-modulation, in some of these perovskite-type oxides,25,27,36,37 compositional modulations have been revealed by means of scanning transmission electron microscopy (STEM) in combination with energy electron loss spectroscopy (EELS). Thus, in the La(1/3)−xLi3xNbO3 system, the compositional modulation along the [110]p direction has been reported to be a consequence of the La, Li and vacancy ordering within the occupied (00l) planes.25,27Fig. 2e shows the HRTEM image of a crystal of La0.29Li0.22Ta0.9Zr0.1O3 in the [−110]p orientation. Subtle contrast periodic variations in the occupied (001) planes are clearly observed. In the corresponding FFT, diffuse maxima at odd multiples of 1/4d*(001)p and ∼1/7d*(110)p are shown and this information, together with the contrasts observed in the image, suggests the same compositional modulation as that described for La(1/3)−xLi3xNbO3. It must be emphasized that all the oxides of both the Nb and Ta systems present similar SAED and HRTEM features, although the extra reflections are weaker in Ta compounds.
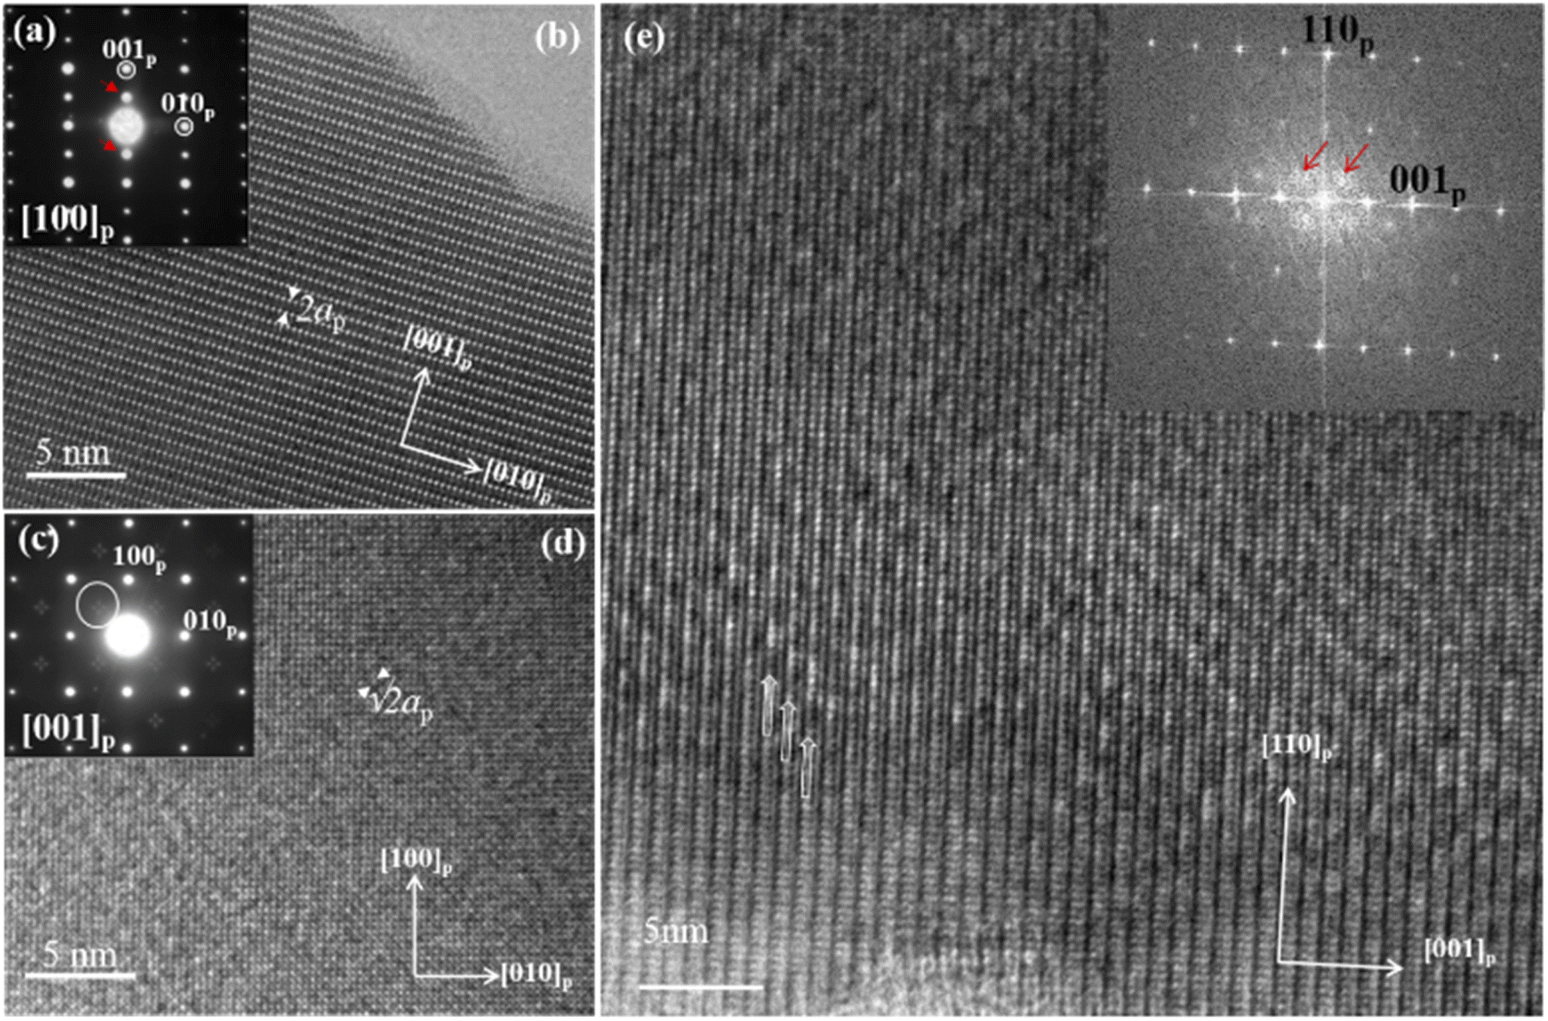 | ||
| Fig. 2 (a) SAED pattern of a crystal of La0.29Li0.22Nb0.9Zr0.1O3 in the [100]p zone axis, red arrows pointing at Gp ± 1/2(001)* extra diffraction maxima. (b) HRTEM image of the crystal in (a). (c) SAED pattern of a crystal of La0.29Li0.22Nb0.9Zr0.1O3 in the [001]p zone axis. The four faint reflections in the cross-like arrangement at Gp ± 1/2(110)* are encircled in white. (d) HRTEM image of the crystal in (c). (e) HRTEM image of a crystal of La0.29Li0.22Ta0.9Zr0.1O3 in the [−110]p orientation. Periodic contrast variations are observed in the occupied (00l) planes (white arrows). The inset shows the corresponding Fourier transform and red arrows point at diffuse maxima at odd multiples of 1/4d*(001)p and ∼1/7d*(110)p. | ||
Ionic conductivity
The Li-ion conductivity of the LLNZ05, LLNZ10, LLTaZ05 and LLTaZ10 oxides has been evaluated from the corresponding Nyquist impedance diagrams and from the Bode diagrams (Z′′ vs. f) in the T range 298–473 K. Fig. 3 displays impedance diagrams of measurements taken at 298 and 373 K. The graphs corresponding to LLNO are shown in Fig. S2† for comparison. The diagrams of Fig. 3 show only one semicircle and a spike at the lowest frequencies, which is characteristic of the blocking of the Li+ ions at the electrodes, except for LLTaZ10. The presence of only one semicircle indicates that the resistance values of both the “bulk” and grain boundaries of the materials are similar and therefore, only the total electrical resistance can be determined. Two semicircles seem to be distinguished in the impedance diagrams of the LLTaZ10 (Fig. 3d) indicating at least two processes at high and middle frequencies, in addition to the spike at the lowest frequencies. Graphic representations of Z′′ and M′′ vs. frequency (Fig. 4) allow us to differentiate the processes that take place at different frequencies as far as the resistance and/or the capacitance of these processes have different enough values. In general, the highest frequency processes are associated with the material-bulk electrical behavior and the processes at middle frequencies are associated with grain boundaries; at the lowest frequencies, the ion blocking at the electrodes appears. At room temperature, in the representations of the LLNZ05, LLNZ10, and LLTaZ05 oxides (Fig. 4a–c), only one Z′′ and one M′′ peak appears at approximately the same frequency (close to 105 Hz in the three cases), thus corresponding to the total electrical behavior of the materials, in agreement with Nyquist diagrams. Z′′ deeply increases at low frequency due to the high resistance associated with the blocking of Li+ ions at the electrodes. However, two Z′′ peaks are clearly detected in the diagram of the LLTaZ10 oxide at about 105 and 1 Hz (Fig. 4d), although only the M′′ peak at the highest frequency can be distinguished due to the lower capacitance of this process. The further increase of Z′′ at the lowest frequencies is associated to the spike due to the Li-blocking at the electrodes. These representations confirm that both the resistances of bulk and grain boundaries are similar in the LLNZ05, LLNZ10, and LLTaZ05 oxides. However, the LLTaZ10 results show, in addition to the high frequency process of the material bulk, a middle frequency process with higher resistance and capacitance due to grain boundary effects. Table S3† shows resistance, conductivity and capacitance values of the studied oxides at different temperatures as determined from both the Nyquist-impedance and Bode diagrams. The results of the La0.29Li0.12NbO3 (LLNO) oxide prepared for this work are included for comparison. The values correspond to the total resistance (i.e., they include the contribution of both the bulk and grain boundary effects) except for LLTaZ10 for which bulk and grain boundary processes are distinguished at room temperature in the Z′′ vs. f diagram (at about 105 and 1 Hz respectively). Fig. 5 shows a graphic representation of the variation of the total conductivity with temperature of the oxides, including the results of the LLNO for comparison. The corresponding activation energies can be found at the end of Table S3.† The obtained values are of the same order as other Li ion conducting perovskite type systems. The Nb-compounds present higher total conductivity than the oxides of the Ta-system. The LLTaZ10 has very low Li-conductivity as a result of the high resistance process at the grain boundaries. The conductivity values of the LLTaZ05, somewhat lower than those of LLNZ10, are in agreement with previous results of the La(1/3)−xLi3xTaO3 system that report the highest Li-conductivity at room temperature in the compound corresponding to x = 0.06 (7 × 10⁻⁶ S cm−1).28 The Li-conductivity increases in the Nb-system by substitution of Nb by Zr and Li in the LLNZ05 due to the increasing number of charge carriers but slightly decreases with higher substitution in LLNZ10 probably due to total occupancy of the conduction-active A-cation vacancies. The results are in agreement with previous conclusions about the characteristics of the grain boundaries in the La(1/3)−xLi3xNbO3 system: the electrical resistance and capacitance values of the grain boundary processes are similar to those of the bulk.13,21,22 Moreover, Kawahara et al.22 claimed higher Li-conductivity at the grain boundaries than at the bulk in La0.31Li0.07NbO3 due to specific local atomic configurations at the grain boundaries. On the contrary, the different nature of the grain boundaries of the Ti systems, which show strong Li-depletion at the grain boundary regions, leads to higher grain boundary resistances and capacitances.23,38 | ||
| Fig. 3 Complex impedance diagrams of LLNZ05 and LLNZ10 at (a) 298 K and (b) 373 K, and LLTaZ05 and LLTaZ10 at (c) 298 K and (d) 373 K. The insets show the circuital models associated with the impedance results. Please note that according to the explanations in the main text, the circuit represented in (d) models only the behavior of LLTaZ10 at 373 K. | ||
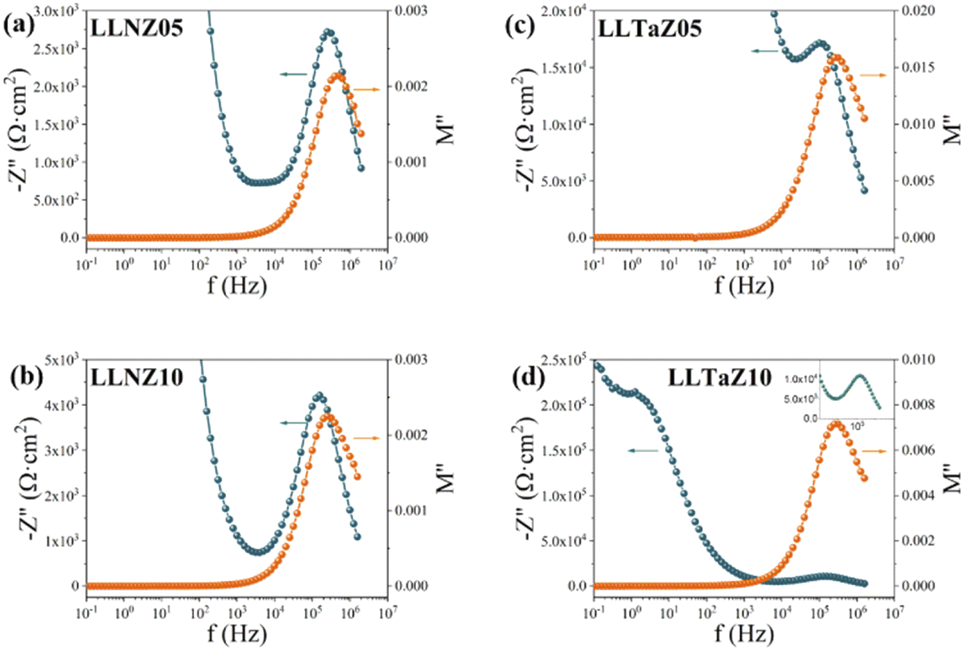 | ||
| Fig. 4 Z′′ and M′′ vs. frequency at 298 K of (a) LLNZ05, (b) LLNZ10, (c) LLTaZ05 and (d) LLTaZ10. Inset on (d) shows the enlargement of the peak observed at ∼105 Hz. | ||
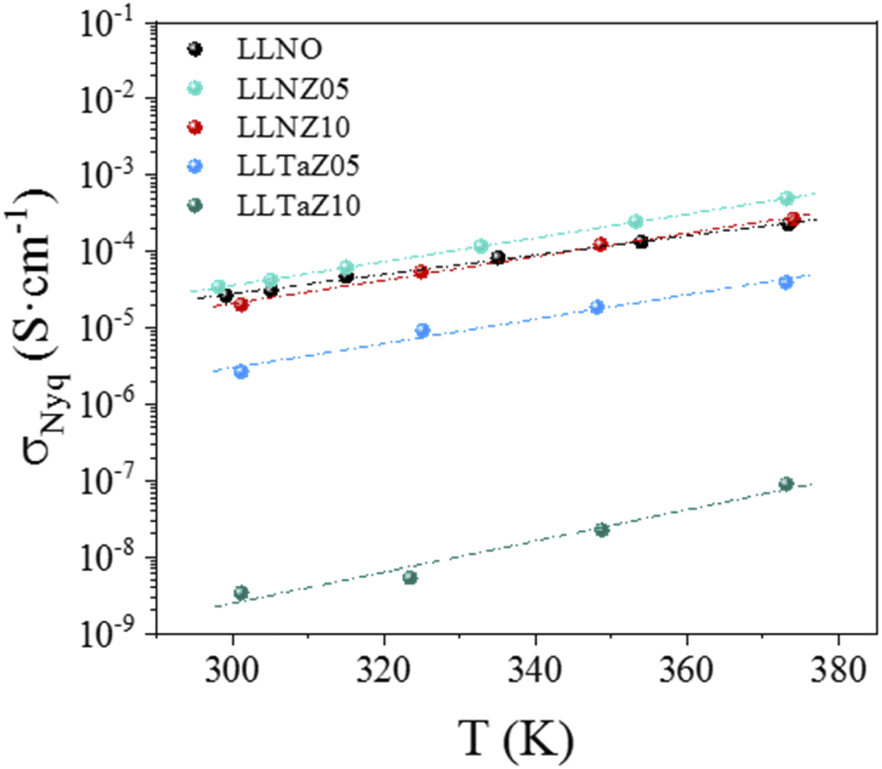 | ||
| Fig. 5 Variation of total conductivity vs. temperature of the oxides. The results of LLNO have been included for comparison. Conductivity values have been determined from the Nyquist-impedance diagrams. | ||
Electrochemical stability
Along with high ionic conductivity, good electrochemical stability of the solid electrolytes is an additional important criterion to be considered for developing ASSBs. The electrochemical stability of the studied perovskites versus lithium has been investigated by cyclic voltammetry of half cells bearing LLNZ05 and LLTaZ05 as the positive electrode. Thus, reduction/oxidation potentials versus Li+/Li are determined. The selection of these oxides has been based on their highest conductivity in the corresponding systems. Fig. 6a and b show the first four reduction–oxidation waves of LLNZ05 and LLTaZ05 respectively, in the low voltage range 3.0–0.0 V. The formation of the solid electrolyte interphase (SEI) is observed in the first cycle (black line) centered at ca. 0.5 V. Subsequent cycles show the reversible processes taking place in these perovskites upon consecutive reduction/oxidation cycles. Electrochemical stability window of the niobate LLNZ05 at low voltage is deduced from Fig. 6a. It shows that cathodic current is negligible down to 2.0 V. Below this potential a broad cathodic peak is developed in the potential range 2.0–0.75 V vs. Li+/Li, ascribed to the reduction of Nb5+ to Nb4+, while another broad peak located at 0.6 V is consistent with the reduction of Nb4+ to Nb3+ at a much lower voltage.39,40 The LLTaZ05 (Fig. 6b) develops one broad cathodic peak located in the potential range 1.3–0.6 V ascribed to the reduction of the Ta5+ to Ta4+ redox couple. Interestingly, the cathodic current appears at a significantly lower voltage in the case of LLTaZ05 (below 1.3 V vs. Li+/Li) compared to the cathodic current in the niobate (below 2.0 V vs. Li+/Li), evidencing a significant widening of the electrochemical stability window of this oxide compared to the corresponding niobate. Cyclic voltammetry studies performed in the high voltage range (3.0–5.0 V) demonstrate the remarkable electrochemical stability of both compounds. Fig. 6c and d show that anodic current is negligible up to 4.8 V in both compounds. Even though a significant overpotential compared to the calculated thermodynamic equilibrium potential is expected in some oxides for the oxidation reaction processes, likely due to having slow kinetics, LLNZ05, LLNZ10 and LLTa05 are among the most stable oxides at high voltages reported. Blanks were run at an identical sweep rate of 0.5 mV s−1 (Fig. S3†) in the low potential (0.0–3.0 V vs. Li+/Li, Fig. S3b†) and high potential range (3.0–5.0 V vs. Li+/Li, Fig. S3d†). Comparison of the cyclic voltammogram of LLTaZ05 and its blank in the low voltage range (0.0–3.0 V, Fig. S3a and b†) confirms that the cathodic current below 1.3 V vs. Li+/Li is due to the active material LLTaZ05 and thus, represents the lower electrochemical stability limit. On the other hand, in the high voltage range, the comparison of the anodic current with that of the corresponding blank cell (Fig. S3c and d†) confirms that the higher electrochemical stability limit is around 4.8 V. | ||
| Fig. 6 Cyclic voltammograms of LLNZ05 and LLTaZ05 in the 0–3 V voltage range (a and b) and in the 3.0–5.0 V voltage range (c and d). | ||
Comparison of the ion-conductivity and electrochemical stability of LLNZ05, LLNZ10 and LLTaZ05 with other Li-ion conducting oxides confirms the valuable behavior of these new materials as solid electrolytes.4,6 As example, the total Li-conductivity in the LLTO system is of the order of 10−5 S cm−1 at room temperature and the calculated electrochemical window is in between 1.7 V (reduction potential vs. Li+/Li) and 4.2 V (oxidation potential vs. Li+/Li).6 The room temperature Li-conductivity in LLNZO5 and LLNZ10 is of the same order of magnitude as in LLTO and somewhat lower in LLTaZ05. However, the electrochemical window is significantly wider in LLTaZ05 (1.3–4.8 V). Interestingly, in LLTaZ05 the reduction of Ta5+ to Ta4+ occurs at a much lower potential than the reduction of Ti4+ to Ti3+ in Li4Ti5O12 (1.55 V) opening the possibility of using these Ta-based oxides as an electrolyte with the Li4Ti5O12 anode, one of the few anodes marketed to date besides graphite.
Conclusions
Single phase oxides of the systems La0.29Li0.12+xNb1−xZrxO3 and La0.29Li0.12+xTa1−xZrxO3 (x = 0.05 and 0.1) have been synthesized. Substitution of Nb or Ta by Zr and Li is limited to x = 0.1 when the oxides are prepared by the conventional ceramic method. The obtained oxides present a perovskite-related structure with ordering of the A-cation vacancies, like in the crystal structure of the parent La0.29Li0.12NbO3 compound, in such a way that (00l) layers of A-cation vacancies alternate with layers of La, Li and vacancies. Ordering of cation vacancies seems to limit the Li-doping to that corresponding to x = 0.1, thus frustrating the filling of the empty (00l) layers with Li-atoms. The LLNZ05, LLNZ10 and LLTaZ05 oxides are potential electrolytes for Li-ASSBs because of their valuable electrical and electrochemical behavior and low grain boundary resistances. LLNZ05 shows slightly higher conductivity and a similar electrochemical window compared to the parent LLNO compound. However, LLTaZ05 exhibits lower Li-conductivity though still in the range of solid electrolytes but remarkably presents a wider electrochemical window (∼1.3–4.8 V vs. Li+/Li) currently reported for solid Li-conductor oxides.Data availability
The data supporting this article have been included as part of the ESI.†Author contributions
Ester García-González: methodology, validation, investigation, writing – review & editing, visualization. Rafael Marín-Gamero: methodology, validation, formal analysis, investigation, writing – review & editing, visualization. Miguel Kuhn-Gómez: investigation. Alois Kuhn: methodology, validation, formal analysis, investigation, writing – review & editing, visualization. Flaviano García-Alvarado: methodology, validation, formal analysis, investigation, writing – review & editing, visualization. Susana García-Martín: conceptualization, methodology, validation, formal analysis, investigation, writing – original draft, visualization, supervision, project administration.Conflicts of interest
There are no conflicts to declare.Acknowledgements
This work has been supported by the Spanish MCIN/AEI/10.13039/501100011033 with the projects PID2022-139039OB-C22, PID2022-139039OB-C21, PID2019-106662RB-C44, and PID2019-106662RB-C41. The authors acknowledge the ICTS-CNME at UCM for electron microscopy facilities.Notes and references
- C. Sun, J. Liu, Y. Gong, D. P. Wilkinson and J. Zhang, Nano Energy, 2017, 33, 363–386 CrossRef CAS.
- T. Famprikis, P. Canepa, J. A. Dawson, M. S. Islam and C. Masquelier, Nat. Mater., 2019, 18, 1278–1291 CrossRef CAS PubMed.
- Z. Wu, Z. Xie, A. Yoshida, Z. Wang, X. Hao, A. Abudula and G. Guan, Renewable Sustainable Energy Rev., 2019, 109, 367–385 CrossRef CAS.
- K. J. Kim, M. Balaish, M. Wadaguchi, L. Kong and J. L. M. Rupp, Adv. Energy Mater., 2021, 11, 2002689 CrossRef CAS.
- R. Chen, Q. Li, X. Yu, L. Chen and H. Li, Chem. Rev., 2020, 120, 6820–6877 CrossRef CAS PubMed.
- Y. Zhu, X. He and Y. Mo, ACS Appl. Mater. Interfaces, 2015, 7, 23685–23693 CrossRef CAS PubMed.
- K. Tuo, C. Sun and S. Liu, Electrochem. Energy Rev., 2023, 6, 17 CrossRef CAS.
- Y. Inaguma, C. Liquan, M. Itoh, T. Nakamura, T. Uchida, H. Ikuta and M. Wakihara, Solid State Commun., 1993, 86, 689–693 CrossRef CAS.
- F. García-Alvarado, A. Várez, E. Morán and M. A. Alario-franco, Phase Transitions, 1996, 58, 111–120 CrossRef.
- Y. J. Shan, L. Chen, Y. Inaguma, M. Itoh and T. Nakamura, J. Power Sources, 1995, 54, 397–402 CrossRef CAS.
- O. Bohnke, C. Bohnke and J. L. Fourquet, Solid State Ionics, 1996, 91, 21–31 CrossRef CAS.
- Y. Kawakami, H. Ikuta and M. Wakihara, J. Solid State Electrochem., 1998, 2, 206–210 CrossRef CAS.
- S. García-Martín, J. M. Rojo, H. Tsukamoto, E. Morán and M. A. Alario-Franco, Solid State Ionics, 1999, 116, 11–18 CrossRef.
- A. Morata-Orrantia, S. García-Martín, E. Morán and M. Á. Alario-Franco, Chem. Mater., 2002, 14, 2871–2875 CrossRef CAS.
- C. H. Chen, S. Xie, E. Sperling, A. S. Yang, G. Henriksen and K. Amine, Solid State Ionics, 2004, 167, 263–272 CrossRef CAS.
- R. Yu, Q.-X. Du, B.-K. Zou, Z.-Y. Wen and C.-H. Chen, J. Power Sources, 2016, 306, 623–629 CrossRef CAS.
- B. Huang, B. Xu, Y. Li, W. Zhou, Y. You, S. Zhong, C.-A. Wang and J. B. Goodenough, ACS Appl. Mater. Interfaces, 2016, 8, 14552–14557 CrossRef CAS PubMed.
- M. Amores, H. El-Shinawi, I. McClelland, S. R. Yeandel, P. J. Baker, R. I. Smith, H. Y. Playford, P. Goddard, S. A. Corr and E. J. Cussen, Nat. Commun., 2020, 11, 6392 CrossRef CAS PubMed.
- A. Jonderian, R. Peng, D. Davies and E. McCalla, Chem. Mater., 2023, 35, 6227–6234 CrossRef CAS.
- Y. Fujiwara, K. Hoshikawa and K. Kohama, J. Cryst. Growth, 2016, 433, 48–53 CrossRef CAS.
- X. Hu, C. A. J. Fisher, S. Kobayashi, Y. H. Ikuhara, Y. Fujiwara, K. Hoshikawa, H. Moriwake, K. Kohama, H. Iba and Y. Ikuhara, Acta Mater., 2018, 156, 379–388 CrossRef CAS.
- K. Kawahara, R. Ishikawa, K. Nakayama, T. Higashi, T. Kimura, Y. H. Ikuhara, N. Shibata and Y. Ikuhara, J. Power Sources, 2019, 441, 227187 CrossRef CAS.
- J.-F. Wu and X. Guo, Phys. Chem. Chem. Phys., 2017, 19, 5880–5887 RSC.
- S. García-Martín, M. A. Alario-Franco, H. Ehrenberg, J. Rodríguez-Carvajal and U. Amador, J. Am. Chem. Soc., 2004, 126, 3587–3596 CrossRef PubMed.
- X. Gao, C. A. J. Fisher, Y. H. Ikuhara, Y. Fujiwara, S. Kobayashi, H. Moriwake, A. Kuwabara, K. Hoshikawa, K. Kohama, H. Iba and Y. Ikuhara, J. Mater. Chem. A, 2015, 3, 3351–3359 RSC.
- S. García-Martín and M. Á. Alario-Franco, J. Solid State Chem., 1999, 148, 93–99 CrossRef.
- X. Hu, S. Kobayashi, Y. H. Ikuhara, C. A. J. Fisher, Y. Fujiwara, K. Hoshikawa, H. Moriwake, K. Kohama, H. Iba and Y. Ikuhara, Acta Mater., 2017, 123, 167–176 CrossRef CAS.
- K. Mizumoto and S. Hayashi, J. Ceram. Soc. Jpn., 1997, 105, 713–715 CrossRef CAS.
- A. Le Bail, H. Duroy and J. L. Fourquet, Mater. Res. Bull., 1988, 23, 447–452 CrossRef CAS.
- J. Rodríguez-Carvajal, Phys. B, 1993, 192, 55–69 CrossRef.
- Y. Sakai, D. Urushihara, T. Asaka, K. Fukuda, Z. Yang, N. Tanibata, H. Takeda and M. Nakayama, Phys. Status Solidi, 2022, 259, 2100561 CrossRef CAS.
- M. Labeau, I. E. Grey, J. C. Joubert, J. Chenevas, A. Collomb and J. C. Guitel, Acta Crystallogr., Sect. B: Struct. Sci., 1985, 41, 33–41 CrossRef.
- S. García-Martin, F. García-Alvarado, A. D. Robertson, A. R. West and M. A. Alario-Franco, J. Solid State Chem., 1997, 128, 97–101 CrossRef.
- R. L. Withers, L. Bourgeois, A. Snashall, Y. Liu, L. Norén, C. Dwyer and J. Etheridge, Chem. Mater., 2013, 25, 190–201 CrossRef CAS.
- A. M. Abakumov, R. Erni, A. A. Tsirlin, M. D. Rossell, D. Batuk, G. Nénert and G. Van Tendeloo, Chem. Mater., 2013, 25, 2670–2683 CrossRef CAS.
- S. García-Martín, E. Urones-Garrote, M. C. Knapp, G. King and P. M. Woodward, J. Am. Chem. Soc., 2008, 130, 15028–15037 CrossRef PubMed.
- S. Garcia-Martin, G. King, E. Urones-Garrote and P. M. Woodward, J. Am. Chem. Soc., 2021, 143, 19121–19127 CrossRef CAS PubMed.
- S. García-Martín, A. Morata-Orrantia, M. H. Aguirre and M. Á. Alario-Franco, Appl. Phys. Lett., 2005, 86, 43110 CrossRef.
- R. Zheng, S. Qian, X. Cheng, H. Yu, N. Peng, T. Liu, J. Zhang, M. Xia, H. Zhu and J. Shu, Nano Energy, 2019, 58, 399–409 CrossRef CAS.
- X. Xiong, L. Yang, G. Liang, C. Wang, G. Chen, Z. Yang and R. Che, Adv. Funct. Mater., 2022, 32, 2106911 CrossRef CAS.
Footnote |
| † Electronic supplementary information (ESI) available: Details about Le Bail analysis, atomic percentages by XEDS, and impedance spectroscopy graphics and data of the cells. See DOI: https://doi.org/10.1039/d4ta05326e |
| This journal is © The Royal Society of Chemistry 2024 |