
 Open Access Article
 This Open Access Article is licensed under a Creative Commons Attribution-Non Commercial 3.0 Unported Licence
Unveiling the relationship between polymorphism and ionic conductivity in Na3−xSb1−xWxS4 solid electrolyte for Na-ion batteries†
Marco
Ravalli
a,
Mehdi
Soleimanzade
 b,
Marco
Scavini
c,
Serena Chiara
Tarantino
a,
Mariano
Radaelli
b and
Cristina
Tealdi
*ad
b,
Marco
Scavini
c,
Serena Chiara
Tarantino
a,
Mariano
Radaelli
b and
Cristina
Tealdi
*ad
aDepartment of Chemistry, University of Pavia, Via Taramelli 12, 27100, Pavia, Italy. E-mail: cristina.tealdi@unipv.it
bRicerca Sul Sistema Energetico – RSE S.p.A., Via Raffaele Rubattino 54, 20134 Milano, Italy
cDepartment of Chemistry, University of Milano, Via Golgi 19, 20131 Milano, Italy
dGISEL-INSTM, Firenze 50121, Italy
First published on 16th September 2024
Abstract
Sulphides with general formula Na3−xSb1−xWxS4 are promising solid state electrolytes for Na-ion batteries (SIBs), thanks to their high conductivity at room temperature, their high malleability and the possibility to synthesise them through wet-chemistry techniques. The materials can crystallize either in a tetragonal or a cubic polymorph as a function of composition, with the highest conductive form being the cubic polymorph (for x ≥ 0.075), for which the Na ion diffusion pathways are expected to be 3D and isotropic. However, the existence of a discrepancy at room temperature between average and local structure is known even for higher substituted systems. Here we investigate the effect of composition and structure on the transport properties of the Na3−xSb1−xWxS4 system by combining experimental and computational techniques, including synchrotron X-ray diffraction (XRD), pair distribution function (PDF) analysis, bond valence site energy (BVSE) analysis and classical molecular dynamics (MD). The results obtained from long time-scale MD provide new insights into the mechanistic features of ionic transport in this family of sulphide electrolytes and highlight their subtle interplay with the average and local structure of these materials.
Introduction
The increasing demand for worldwide energy storage capability and the associated necessity to diversify the chemistry behind it, to ensure an adequate supply of materials, have prompted the resurgence of interest in the Na-ion batteries (SIBs) over the past decade.1 After sodium sulphur (Na–S) and ZEBRA (Zero-Emission Battery Research Activities) cells, conventional SIBs based on organic liquid electrolytes acquired importance, with much of the knowledge on electrochemically active insertion materials for Li-ion batteries (LIBs) serving as the basis for a faster development of SIBs components.1,2 For both chemistries, the use of solid electrolytes in an all-solid-state battery undoubtedly has advantages over conventional organic-based systems in order to overcome the safety issues of liquid electrolytes and increase the energy density of the device when used in conjunction with a metal anode.3One of the main challenges hindering the development of solid state SIBs is the availability of sodium ion solid electrolytes with high ionic conductivity at room temperature and easy processability.4,5 Among the promising candidate materials as solid state electrolytes for SIBs, the family of compounds with general formula Na3MS4 (M = P, Sb) stands out for its relatively high ionic conductivity (1–3 mS cm−1 at room temperature for M = Sb),6 which could be further optimized at room temperature through aliovalent doping. In particular, the series Na3−xSb1−xWxS4 shows the highest conductivity reported in this family, i.e. 30–40 mS cm−1 for x = 0.1–0.12 at room temperature.7,8 This class of materials possesses a rich polymorphism as a function of temperature and composition and thus the optimization of their transport properties through variation in structural and compositional features is an aspect of particular interest. Undoped Na3SbS4 is known to crystallize in the tetragonal P![[4 with combining macron]](https://www.rsc.org/images/entities/char_0034_0304.gif) 21c space group (no. 114) at room temperature,9–12 but the tetragonal distortion decreases at room temperature along the Na3−xSb1−xWxS4 series and when x ≥ 0.075 the system is indexed in the cubic space group I3m (no. 217).12 At the same time, a phase transition from the tetragonal to the cubic polymorph for undoped Na3SbS4 is also reported as a function of temperature, although there are significant discrepancies in the reported temperature of such phase transition, ranging between approximately 120 and 210 °C in different studies.7,10,13 The tetragonal distortion is small in terms of the lattice parameters (c/a = 1.02 at room temperature for Na3SbS4).7 However, the reduction in symmetry results in a slight rotation of the (SbS4)3− tetrahedra along the [111] direction and the splitting of the single Na crystallographic site of the cubic polymorph in Wyckoff position 6b(0, 0, 1/2) into two, labelled respectively Na1 (4d(0, 1/2, z)) and Na2 (2b(0, 0, 1/2)). Such subtle structural changes imply that the diffusion channels for Na ion within the structure, which are equivalent within the cubic polymorph, diversify for the tetragonal polymorph (Fig. 1).
21c space group (no. 114) at room temperature,9–12 but the tetragonal distortion decreases at room temperature along the Na3−xSb1−xWxS4 series and when x ≥ 0.075 the system is indexed in the cubic space group I3m (no. 217).12 At the same time, a phase transition from the tetragonal to the cubic polymorph for undoped Na3SbS4 is also reported as a function of temperature, although there are significant discrepancies in the reported temperature of such phase transition, ranging between approximately 120 and 210 °C in different studies.7,10,13 The tetragonal distortion is small in terms of the lattice parameters (c/a = 1.02 at room temperature for Na3SbS4).7 However, the reduction in symmetry results in a slight rotation of the (SbS4)3− tetrahedra along the [111] direction and the splitting of the single Na crystallographic site of the cubic polymorph in Wyckoff position 6b(0, 0, 1/2) into two, labelled respectively Na1 (4d(0, 1/2, z)) and Na2 (2b(0, 0, 1/2)). Such subtle structural changes imply that the diffusion channels for Na ion within the structure, which are equivalent within the cubic polymorph, diversify for the tetragonal polymorph (Fig. 1).
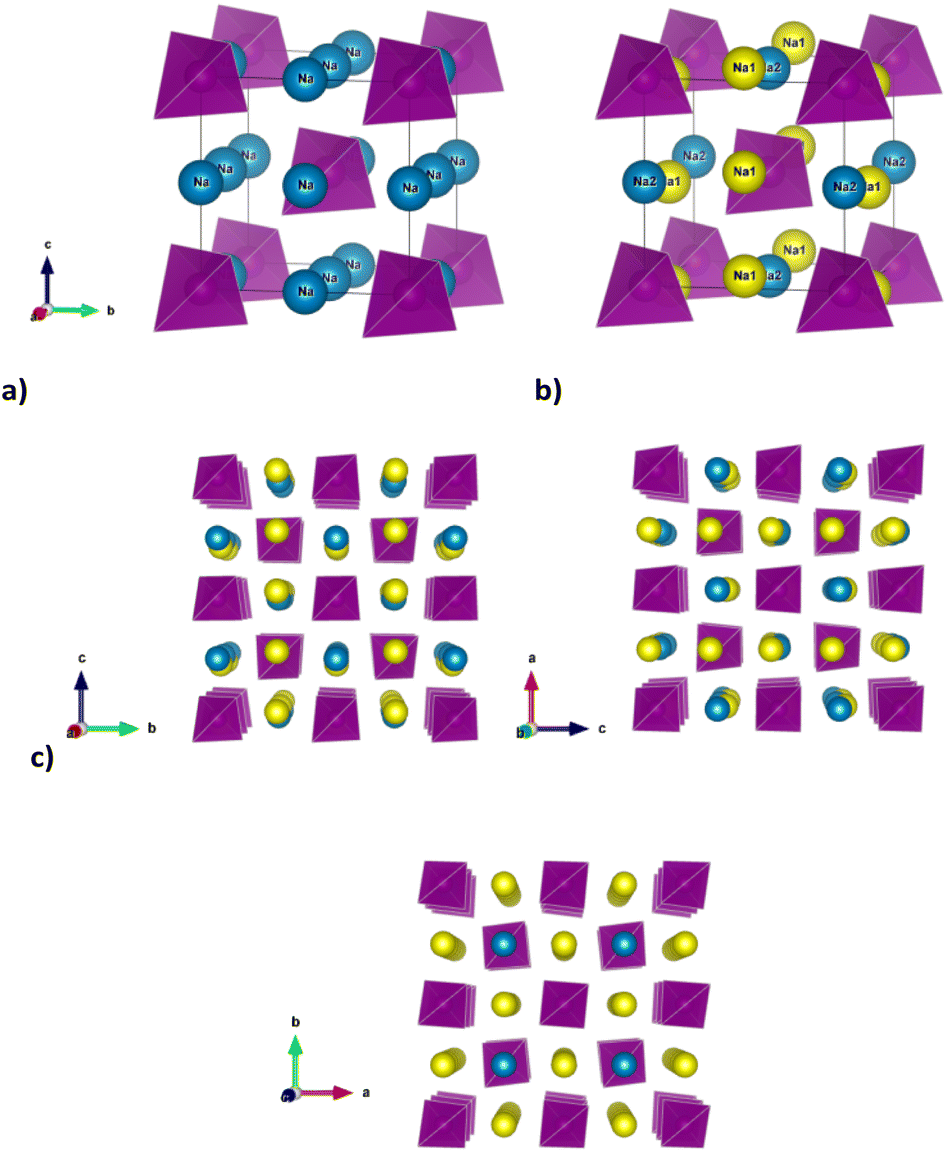 | ||
| Fig. 1 Cubic (a) and tetragonal structure (b) of Na3−xSb1−xWxS4 showing the presence of two Na crystallographic sites for the tetragonal polymorph due to the lower symmetry. Panel (c) shows three perspective views along the three crystallographic axes for the tetragonal polymorph, to highlight the presence of distinct diffusion channels for Na ions, involving Na1 and Na2 along the a and b axes and only Na1 along the c axis. | ||
In particular, as depicted in Fig. 1c, Na diffusion may proceed along the a and b axes involving both Na1 and Na2 sites, with equivalent diffusion paths interconnected in 2 dimensions (2D) within the ab plane, while the channels running along the c axis are occupied by Na1 sites only and provide the possibility to achieve one dimensional (1D) diffusion along this direction. To obtain long-range three dimensional (3D) diffusion within the tetragonal structure, both Na1–Na2 (within the ab plane) and Na1–Na1 (along the c axis) hoppings are required.
The crystallographic changes observed for the average structure upon the phase transition are correlated to a smooth increase in conductivity and are justified by the very similar lattice parameters and limited lattice volume change between the two polymorphs. On the contrary, a significant reduction in activation energy is reported from experimental observation, as calculated from Arrhenius plots of conductivity. In particular, an ultralow activation energy of 0.036 eV was observed experimentally for cubic Na3SbS4, compared to a reported value of 0.224 eV for the tetragonal polymorph, but DFT-based calculations and structural considerations fail to justify such a low activation energy, although being able to reproduce the trend.10 From a computational perspective, the attention is thus directed towards the comprehension of the reasons behind the unusually low activation barrier for Na-ion diffusion in the cubic polymorph, the effect of Na vacancies and dopants.
Despite the increasing number of structural and computational investigations on this interesting family of ionic conductors, several aspects of their behaviour remain controversial. For example, a discrepancy between average (cubic) and local (tetragonal) structure for highly substituted systems is observed from a structural point of view7 but it has not been interpreted computationally although, as introduced above, the dimensionality of the ionic transport may be affected by this structural aspect.
Here we investigate the effect of composition and structure on the transport properties of the Na3−xSb1−xWxS4 system by combining experimental and computational techniques, including high resolution synchrotron X-ray diffraction (XRD), pair distribution function (PDF) analysis, bond valence site energy (BVSE) analysis and classical molecular dynamics (MD). In particular, the results obtained from long time-scale MD provide new insights into the mechanistic features of ionic transport in this family of sulphides electrolytes and highlight their subtle interplay with the average and local structure of these materials.
Experimental and computational methods
Powder samples of nominal composition Na3SbS4 and Na2.9Sb0.9W0.1S4 were prepared by mixing stoichiometric amounts of Na2S (Sigma Aldrich, reagent type), sulfur powder (Sigma Aldrich), antimony(III) sulphide (Alfa-Aesar, 99.999%), and tungsten(IV) sulphide (Sigma Aldrich). After weighing, the precursors were manually grounded in an agate mortar for about 20 minutes. The resulting powders were then pelletized using a ¼” diameter steel die under constant axial load with an MTI Kj group press. The pellets were placed in quartz tubes for vacuum sealing. All these steps occurred in a glovebox to maintain oxygen and moisture levels below 0.5 ppm. Before being cut-sealed by an oxygen–acetylene flame, the quartz tubes were evacuated using a vacuum pump connected via a silicon tube and a Teflon valve. The vacuum-sealed samples were then placed in a muffle furnace for further heat treatments. The synthesis process included a controlled heating and cooling ramp at 6 °C per hour, with a 24 hours dwell at 700 °C.Scanning electron microscopy (SEM) analysis was performed through the JSM-IT200 InTouchScope™ microscope (JEOL), equipped with energy-dispersive X-ray spectroscopy (EDS) for elemental mapping.
High resolution synchrotron X-ray powder diffraction (XRPD) patterns were acquired on pure, W-doped samples and an empty Kapton© capillary at the ID22 beamline Synchrotron Radiation Facility (ESRF) in Grenoble. Borosilicate capillaries with a diameter of 0.5 mm were loaded with the finely grounded powder samples in an Ar-filled glovebox. The XRPD measurements were performed at room temperature, with a λ = 0.354289 Å in the angular range 0–120°, with step size 0.0009°.
Rietveld refinement to verify the crystal structure, and to obtain site occupancies and thermal factors, were performed via the TOPAS v6 software14 using XRPD data up to 40°. The starting structural models were obtained from literature, and are described above, with the only difference being in the refinement of the cubic polymorph, where each 6b-site Na was split into four 24f-site Na, in order to get a better refinement of the thermal factors and occupancies.15 The Rietveld refinement-obtained models were then used to perform bond valence site energy (BVSE) analysis with the software softBV,16 which employs Morse type force-field. The resulting isosurfaces, and their connectivity, were visually analyzed by the VESTA software.17 The pathway's energy profiles were plotted in order to obtain the BVSE calculated migration barriers relative to the undoped tetragonal and W-doped cubic phases. The same screening factor (0.75) was used for all the BVSE calculations, making the comparison within results straightforward.
The PDF/G(r) (pair distribution function) data were extracted with the PDFgetX3 (ref. 18) software, and a Qmax cutoff of 20 Å−1 (where Q = 4π![[thin space (1/6-em)]](https://www.rsc.org/images/entities/char_2009.gif) sinθ/λ) was used. Their analysis was performed through the PDFgui software19 applying the cubic and tetragonal models over described. In each model we varied the scale factor, a correlated motion factor, lattice parameter(s), atomic positions and anisotropic thermal factors using the symmetry constrains of the pertinent space group. The refinement was first performed in the medium r-range (20 to 50 Å), and the resulting crystallographic information was then used to perform the refinement focusing on two different r-ranges: short (2 to 20 Å) and local (2 to 9.5 Å), in order to assess if the obtained medium range structural models kept their descriptive power at shorter ranges.
sinθ/λ) was used. Their analysis was performed through the PDFgui software19 applying the cubic and tetragonal models over described. In each model we varied the scale factor, a correlated motion factor, lattice parameter(s), atomic positions and anisotropic thermal factors using the symmetry constrains of the pertinent space group. The refinement was first performed in the medium r-range (20 to 50 Å), and the resulting crystallographic information was then used to perform the refinement focusing on two different r-ranges: short (2 to 20 Å) and local (2 to 9.5 Å), in order to assess if the obtained medium range structural models kept their descriptive power at shorter ranges.
Raman Spectra of the two powder samples of nominal composition Na3SbS4 and Na2.9Sb0.9W0.1S4 were acquired using a Horiba scientific Raman Spectrometer (XploRA™ PLUS, Japan) equipped with a 532 nm wavelength He–Ne laser. The laser beam was focused on the sample using a ×50 objective and an incident power of 17 mW. A grating with 1200 lines per micron and a 10 seconds integration time was used to obtain high-resolution spectra. The spectra were recorded in the backscattering geometry at ambient temperatures between 50 and 600 cm−1. Due to sensitivity of the materials to air and moisture, the sample powders were first fixed using carbon tape inside a Raman three-electrode battery cell from Redoxme AB company within the glovebox. This cell has a gas-tight construction containing 2 O-rings that provide a high sealing. The sapphire window, at top, with 14 mm visible area, allows the access of Raman laser to the materials for analysis.
Electrochemical impedance spectroscopy (EIS) was conducted on pressed pellets through the use of the controlled-environment sample holder known as CESH-e, manufactured by Biologic, and a SP-150 Biologic potentiostat. The measurements were performed by applying an AC voltage of 30 mV (Vrms ∼ 21.21 V) within a frequency range spanning from 106 to 10−1 Hz, sampling 10 points per decade, over a temperature range from 243 K to 323 K. Prior to conducting measurements, the CESH cell, equipped with dual entry-exit tubes, is subjected to a continuous flow of N2. This process is crucial for preventing the samples from reacting with air or moisture. The as-synthesised powders were compressed into pellets using a 10 mm die from Specac, applying a pressure of 190 MPa. The surfaces of the pellets were coated with conductive carbon powder. The fitting of the EIS data was performed using the SciPy package within the Python programming language.20
Classical molecular dynamics (MD) simulations were performed on the Na3−xSb1−xWxS4 (x = 0; 0.03; 0.06; 0.125) compositions, which in the following will be labelled SbW0; SbW3; SbW6 and SbW12.5, respectively. For comparison a model of composition Na2.94SbS4 without W substitution (SbW0-VNa) was also tested. Such model includes 2% of intrinsic Na vacancies, corresponding to the Na vacancies content of the SbW6 composition. Table S1† shows the potential model parameters used in this study. For the construction of all the computational models, the starting structural parameters were those of the cubic polymorph. The optimization of the pair-wise potential parameters was performed using the GULP software,21 while the molecular dynamic simulation were carried out using the Dl-POLY classic code.22 An 8 × 8 × 8 supercell of the original single cell of Na3SbS4 (cubic polymorph) was created as starting point for the simulations. W substitution on the Sb crystallographic site and Na vacancies were created randomly within the supercells to reproduce the desired compositions, ensuring charge neutrality in the system. The supercells were geometrically optimized at 0 K and subsequently MD simulations in the NPT ensemble were performed by equilibrating the system for 200 ps using the Nosé–Hoover thermostat and the Velocity-Verlet algorithm to derive the equilibrium cell volume at 300 K for each composition. The production run in the NVT ensemble was performed for 2 ns using the Nosé–Hoover thermostat and the Velocity-Verlet algorithm with an integration time step of 1 fs. Visual analysis of the ion trajectory was performed through the VMD software,23 while mean square displacement vs. time plots were derived by using the nMoldyn code,24 through the use of the following standard relation:
| 〈|ri(t) − ri(0)|2〉 = 6D + B | (1) |
The partial charges assigned to the ions (Table S1†) were determined through DFT-based calculations on the tetragonal and the cubic crystal structure respectively. All the DFT-level simulations were performed within the QuantumESPRESSO (QE) code.25 PBE-sol (PAW GGA) pseudopotentials were used for all calculations, and the BFGS algorithm was used for the structural relaxation. For the unit cells, a 520 eV energy cutoff was used and the Brillouin zones were sampled in 8 × 8 × 8 k-point meshes generated following the Monkhorst–Pack scheme. The partial effective charges were obtained by calculating the dielectric static tensors at Γ-point performed by the PHonon package implemented in QE. To be able to model the W-doping and the formation energy of Na vacancies, 2 × 2 × 2 supercells were generated and structurally relaxed: the maximum amount of W-substitution was 2 atoms per supercell, resulting in 6% (1 W per supercell) and a 12.5% (2 W per supercell) substitution, thus the choice of the compositions for the MD simulation.
Results and discussion
Fig. 2 reports the room temperature Rietveld refined XRPD synchrotron patterns of the pristine Na3SbS4 and the doped Na2.9Sb0.9W0.1S4 compounds. In agreement with previous studies,12 the average structure of the undoped compound can be indexed in the tetragonal space group (s.g. P21c), while the 10% W-substituted compound can be described in terms of the cubic phase (s.g. I3m). The XRPD synchrotron patterns, and their Rietveld refinements, for the pristine Na3SbS4 and the doped Na2.9Sb0.9W0.1S4 compounds are reported in Fig. 1. The structural parameters obtained from the refinements are reported in Table S2a and b† and are in good agreement with previous studies on these compositions.6,7,9,12 Raman spectra acquired on the two compositions are shown in Fig. S1.† These data, in agreement with previous reports,8 confirm the cationic substitution on the Sb site. In particular, the three Raman bands around 360, 380, and 410 cm−1 in the Raman spectrum of the prepared Na2.9Sb0.9W0.1S4 are ascribed to the presence of SbS43− units, as visible in the spectra of the undoped sample. The Raman band at ∼470 cm−1 is attributed to the presence of WS4 units, typically observed for crystalline Na2WS4, in line with previous investigations on this system.8 The synthesis led to almost single phase samples, and only slight traces of impurities were detected from the XRD patterns (approximately 3% of Na2SbS2) for the pure phase. As shown in Fig. S2,† the elemental mapping through EDS indicates a homogenous distribution of the elements and supports the cationic substitution in the W-doped sample. Elemental analysis through EDS indicates a slight overstoichiometry in W, but the refinement of the partial site occupancies on the Sb/W site from the high quality XRPD data confirms the nominal stoichiometry (Table S2b†). Interestingly, the refinement of Na site occupancy for pristine tetragonal Na3SbS4 indicated approximately 2% of intrinsic Na vacancies in the undoped system (Table S2a†). This result is in agreement with previous investigations and justifies the relatively high ionic conductivity of the undoped system, in light of the mechanism of diffusion that is known to proceed through Na vacancy hopping.26 In particular, the Na vacancies are localized on the Na1 site (4d(0, 1/2, z)), in agreement with the DFT calculated formation energies for Na vacancies in the tetragonal polymorph in this study, which show a preference for the Na1 position (calculated energy difference between the formation energy on the Na2 and the Na1 site, ΔE = 0.277 eV). The obtained crystallographic information was used to perform BVSE analysis, enabling us to analyze in a computationally inexpensive way the difference in diffusion mechanism and energetics between the two samples.
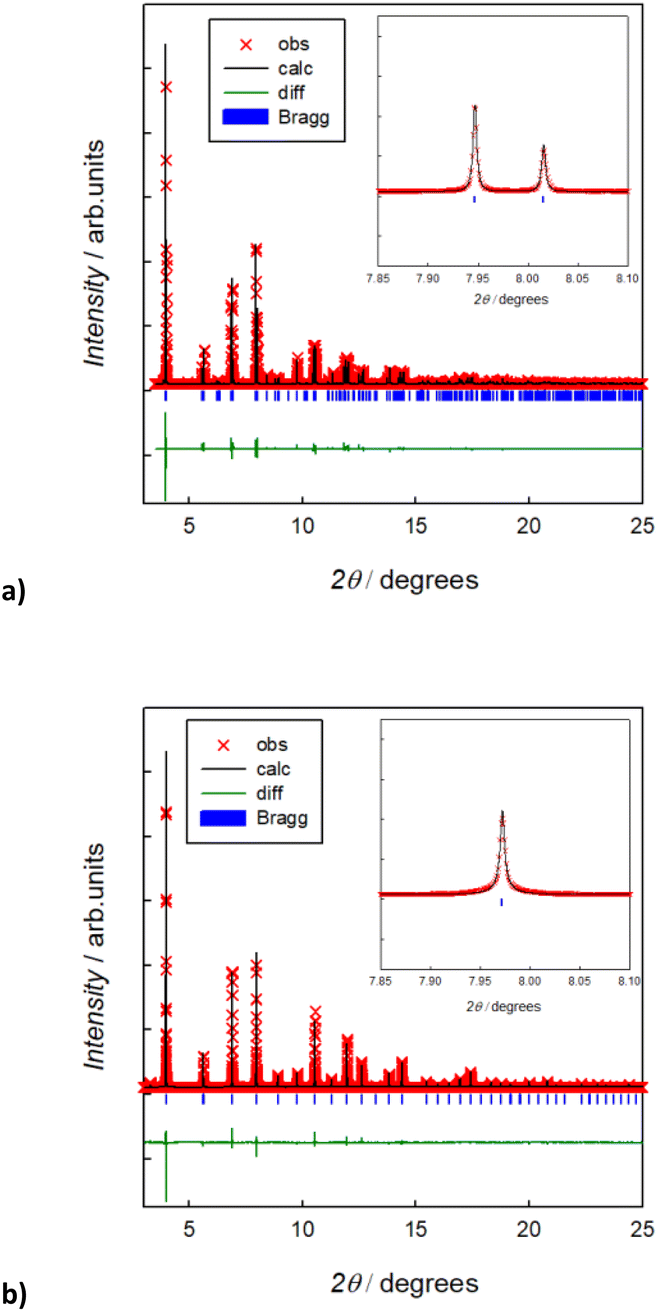 | ||
| Fig. 2 Room temperature Rietveld refined synchrotron XRPD patterns of (a) Na3SbS4 and (b) Na2.9Sb0.9W0.1S4, showing in the inset the splitting of a selected peak (2 2 0) for the tetragonal polymorph (a). | ||
In Fig. 3, the activation energies for Na-ion hopping obtained by the SoftBV software are reported. The values obtained by the BVSE calculations are in line with both ab initio calculations and experimental results reported before in literature, although slightly overestimated. For the tetragonal undoped phase, reported activation energies varies between 0.1 and 0.65 eV, depending on the synthetic route or the computational method employed.10,12 In this regard, Fig. S3† shows the Arrhenius plots of conductivity for the two samples under investigation in this study. The experimentally derived activation energy for tetragonal Na3SbS4 is 0.26 eV. As it can be seen from Fig. 3, the lowest energy path derived from BVSE involves the Na-ion sites along the ab-plane (Na1 (4d) and Na2 (2b)), leading to a bidimensional diffusion, requiring ∼0.3 eV; to form a 3D-diffusion network, a higher energy diffusion path along the c-axis is required, involving only Na1 (4d) with a higher activation energy of ∼0.5 eV. This can be explained considering that the c-axis in the tetragonal phase is elongated compared to a and b, resulting in longer distances for the Na-ion hopping into a vacant site (Table S2a†). As for the cubic doped phase, the high symmetry of the crystal structure results in a 3D-diffusion network, greatly enhancing the transport properties of the material. The activation energy is in this case overestimated compared to computational and experimental studies reported in literature: most studies report ∼0.1 eV as the activation energy,10 with several articles in literature reporting energies one or two orders of magnitude lower.10,13 The experimentally derived activation energy for the prepared Na2.9Sb0.9W0.1S4 is 0.20 eV (Fig. S3†).
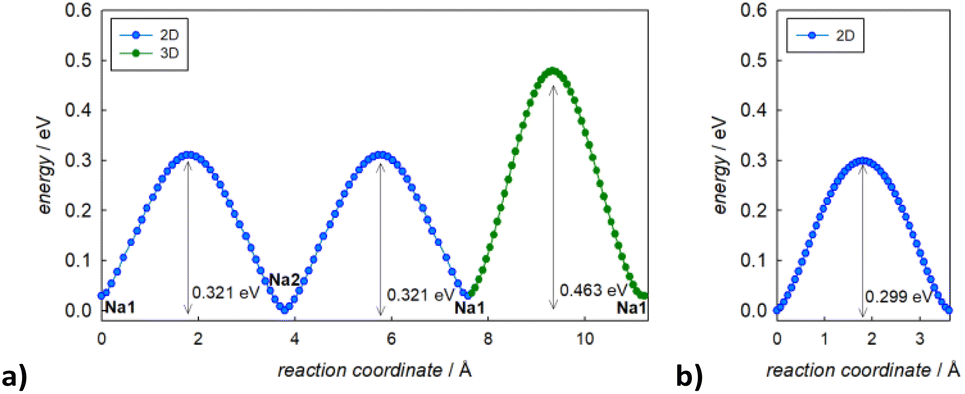 | ||
| Fig. 3 Migration energy profiles as derived from BVSE analysis of the synchrotron diffraction data for tetragonal Na3Sb1S4 (a) and cubic Na2.9Sb0.9W0.1S4 (b). | ||
As expected, the BVSE method gives slightly overestimated values. In order to explain this result, two different remarks about the technique should be highlighted. Firstly, the BVSE method is a static method, which involves no relaxation of the local structure surrounding the migrating defect during the simulation; this hinders the ion diffusion within the structure. The second consideration to be made is about the Morse potentials employed for the simulation, as they are not tailored for a specific family of materials but are constructed to be as general as possible, which may lead to imperfect predictions.27 Nonetheless, the BVSE method gives a valuable information, mainly when comparing similar compounds, to obtain significant trends in the energetics of the diffusion and to identify the dimensionality of ion diffusion. In this particular case, the method correctly describes the expected change in the dimensionality of the ion transport and indicates a lower activation energy for Na ion diffusion in the cubic system. In particular, the visualization of the BVSE-generated isosurfaces reported in Fig. 4a (tetragonal Na3SbS4) and Fig. 4b (cubic 10% W-doped phase) gives significant insight into the dimensionality of the ion transport. Regarding the doped phase, the three dimensional diffusion path is evident (Fig. 4b) and confirms the considerations above. Focusing on the tetragonal undoped phase, it can be seen that there is a significant percolation within the ab-plane, resulting from the hopping of the Na1 site into the Na2 sites and vice versa; from the isosurfaces, it can be noted that the lower energy zones are all along the plane (left panel), and that the planes are interconnected by higher energy isosurfaces (right panel), corresponding to the Na1–Na1 hopping phenomenon (BVSE calculated Ea ≈ 0.47 eV, Fig. 3a). As it is known that lower dimensional diffusion pathways in solid state electrolytes often result in lower conductivity values when compared to three dimensional ones, it can be assumed that the better electrochemical performance of the cubic phases can be partially attributed to this effect.
 | ||
| Fig. 4 BVSE isosurfaces generated from the crystal structure of the tetragonal (a) and cubic (b) phases of Na3SbS4 and Na2.9Sb0.9W0.1S4 respectively. The isosurfaces of constant Na+ bond-valence site energy 0.26 eV and 0.61 eV above the site energy of the lowest energy Na+ site are shown, with blue spheres marking the local BVSE minima representing possible Na+ sites. | ||
To better understand the Na diffusion process in Na3SbS4 and the effect of W-substitution, molecular dynamics simulations were performed, as described above. The structural models employed for these simulations were initially all cubic phases: not only to better compare the results for different concentrations of dopants and/or Na-vacancies, but most importantly because the most conductive and therefore the most interesting polymorph is indeed the cubic phase, as explained above. Experimentally, it is known that it is possible to synthetize even pristine cubic Na3SbS4,13 and it is known that even the pure compound can have Na-ion vacancies, supporting Na diffusion (Table S2a†). As a starting point, the pristine Na3SbS4 with no Na-ion vacancies (SbW0) was investigated to confirm that the diffusion mechanism is vacancy-driven: when no vacancies are introduced into the system, as it can be seen in Fig. S4,† not only at room temperature, but even at 700 K no long range diffusion of Na ion is visualized in the trajectory plots from MD. To assess the effect of doping, three different models with different W-substitution percentage (3%, 6%, 12.5%) were generated: the W ions and the corresponding amount of Na vacancies to achieve charge neutrality (1 Na vacancy for each cation substitution) were randomly distributed in the simulation box, as there is no evidence in our data (or in literature) of long range ordering of W or Na vacancies. Moreover, a DFT-study on the 10% W-substituted compound suggested that the formation of the vacancy isn't influenced by the nearby W cation, meaning that the defect in the substituted compound has the same probability of being generated in any of the Na sites, showing no preference for the W or the Sb polyhedra.11 The presence of Na vacancies introduces Na ion diffusion in the system at room temperature, as shown in Fig. 5 for SbW3 (panels a and b) and SbW12.5 (panels c and d). The long range diffusion is considerably more evident for the model containing the larger amount of Na vacancies (i.e., SbW12.5), and it can be appreciated both within the ab plane (panel c) and along the c axis (panel d) for SbW12.5, while it is not clearly visible along the c axis for the SbW3 model (panel b).
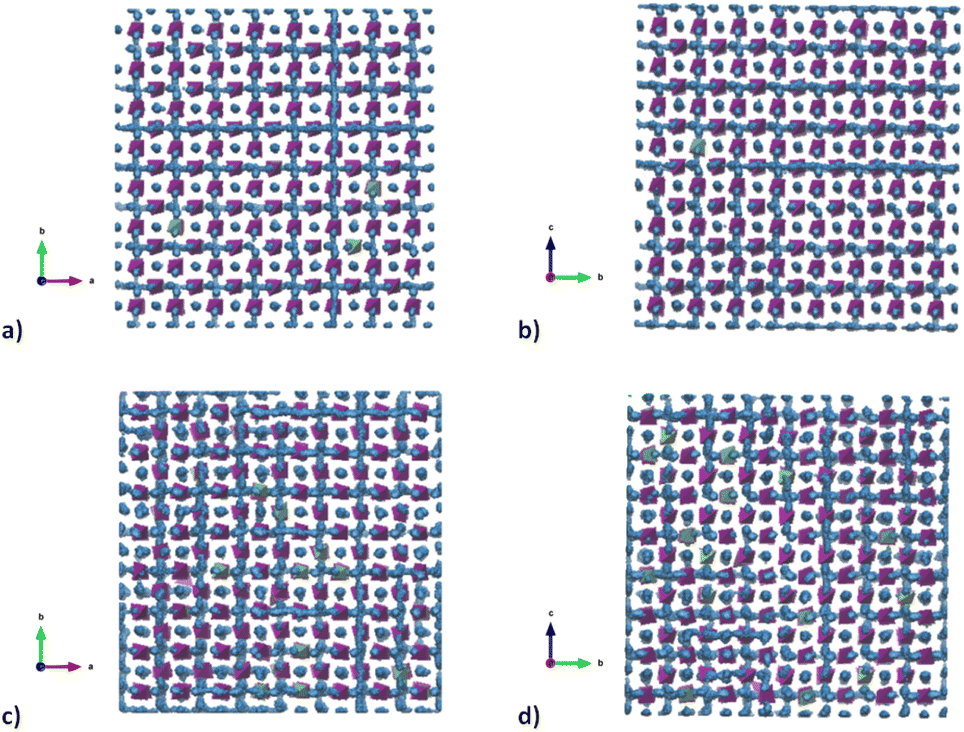 | ||
| Fig. 5 Trajectory plots of Na ion diffusion in SbW3 (panels (a) and (b)) and SbW12.5 (panels (c) and (d)), as derived from MD simulations at 300 K. Purple polyhedra represent the coordination environment of Sb; green polyhedra represent the coordination environment of W; blue dots represent the positions that the Na ions have occupied over the simulation time. | ||
In order to derive more quantitative information on the diffusion process, MSD parameters were derived for each composition. Fig. S5† shows the MSD vs. time for all the atomic species included in the simulation cell for the sample SbW12.5, selected as an example. This result confirms that the only species presenting appreciable long range diffusion over the simulation time is indeed Na. The evolution of the Na-ion MSDs vs. time for the three doped compositions under investigation (SbW3, SbW6, SbW12.5) is reported in Fig. 6a, together with the calculated diffusion coefficients (Fig. 6b), obtained by linearly fitting the central portion of the MSD vs. time curves. Fig. 6a shows that when Sb is partially substituted by W long range diffusion of Na ions is detectable in all the computational models as a result of the presence of Na vacancies introduced for charge compensation. The diffusion coefficient of Na ion increases along with the concentration of Na vacancies, which is directly correlated to the degree of W substitution in the system (Fig. 6b). It is interesting to note that while there is a relatively small increment in D between 1 and 2% Na vacancies, corresponding to models SbW3 and SbW6, a steeper increase in visible when moving to SbW12.5. We recall here that, based on experimental data, above approximately 7.5% substitution the system becomes cubic at room temperature.12 The results presented in this study (Fig. 2 and Table S2b†) support the finding that the system with 10% substitution can be indexed in the cubic space group I3m based on its average structure, thus suggesting higher diffusion of Na ion in the SbW12.5 model compared to SbW3 and SbW6, and the presence of a 3D diffusion path in SbW12.5 (Fig. 4), in contrast to the models containing a lower W doping content.
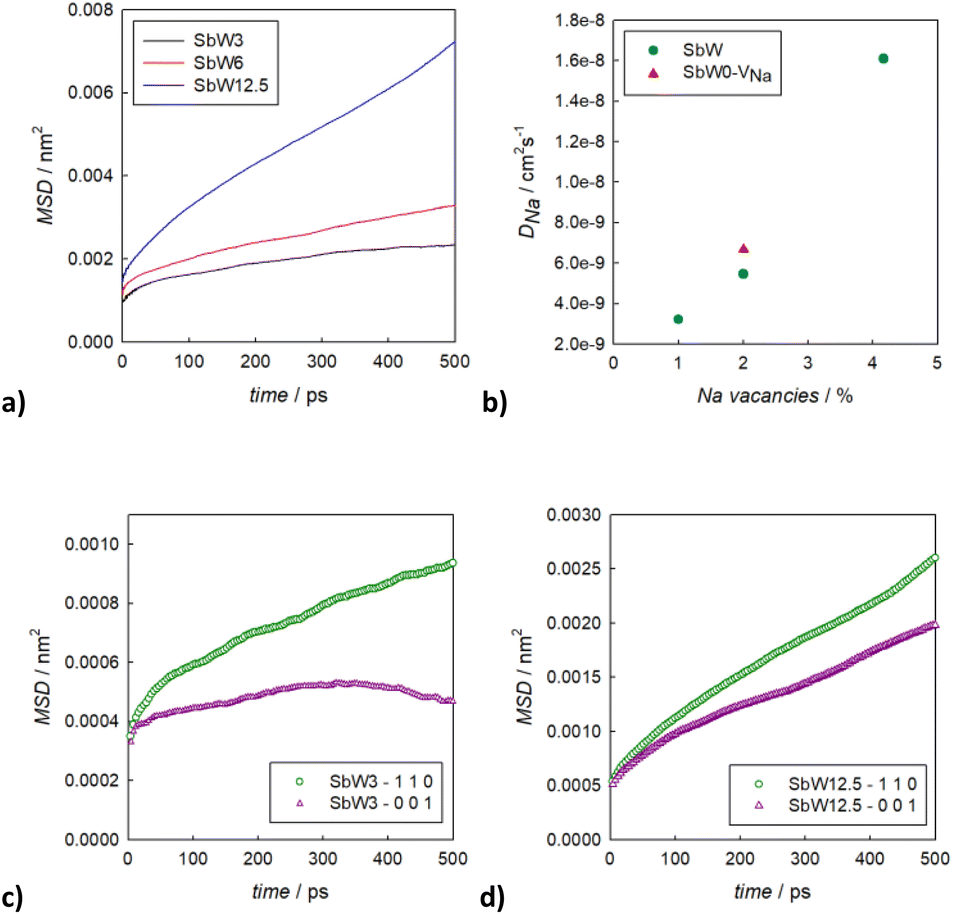 | ||
| Fig. 6 Comparison between the Na ion MSD over simulation time for three different compositions (a) together with the calculated diffusion coefficient for Na ion along with the Na vacancies content (b); comparison between the in-plane and out-of-plane contribution for the Na ion diffusion in SbW3 (c) and SbW12.5 (d). | ||
It should be recognized that the diffusion coefficients obtained by ab initio molecular dynamics (AIMD) are almost one order of magnitude higher than the ones reported in this study for similar compositions,28 but this could be attributed to the vastly different simulation times employed in AIMD simulations compared to classical MD:29 as AIMD is computationally expensive, the simulation time is limited to decades of picoseconds, while our classical MD simulation span is in the range of the several nanoseconds. In addition, it should be recognized that diffusion coefficients derived from simulations at low temperatures or over shorter simulation time may have a significantly smaller number of ion hops and thus a higher uncertainty.30 Even accounting for that, the results herein presented clearly show that increasing the concentration of vacancies in the system enhances the diffusion of sodium, and an increase of only 3% of vacancies (from 1 to approximately 4%) makes the diffusion coefficient gain up to an order of magnitude. In order to be able to discern between the effect of Na vacancies and the effect of doping, another model system was considered, the cubic Na2.98SbS4 (SbW0-VNa). Based on the refinement results (Table S2a†) and literature available, a low amount (approximately 2%) of Na vacancies can be present in the pristine system even without W substitution. The concentration of vacancies in this model matches the 6% W-substituted model, allowing a direct comparison of the two systems. A slightly higher diffusivity is present in the undoped system (SbW0-VNa) when comparing models presenting the same concentration of Na vacancies.
Interestingly, the higher diffusivity for the sodium ion in the undoped system matches the difference in volume between it and the 6% W-doped model, hinting that the presence of W may have a detrimental effect on diffusion for the tetragonal system. These results are only preliminary, and further investigations are required to confirm this hypothesis, but when taking into account other well known (and similar) sulphide-based materials,31 it is reasonable that, being the mechanism dominated by vacancy hopping, the decrease in volume caused by W substitution, and maybe other effects caused by the highly localized positive charge on W6+, could have a slight negative impact on the material's performance. On the other hand, the amount of intrinsic Na vacancies that can be introduced in the system without aliovalent substitution is limited and therefore the introduction of W provides additional positive effects that go beyond the present argument. For example, W doping has a positive effect on the dimensionality of Na diffusion in the system linked to the reduction in structural distortion.
To gain further insight into the relationship between doping, structure and transport in the Na3−xSb1−xWxS4 system, the dimensionality of the ion transport at a local scale was investigated by separating the contributions to the MSD vs. time plots for Na ion in two: one curve relative to the diffusion along the ab plane and one relative to the c axis diffusion. Fig. 6c and d shows the results for SbW3 and SbW12.5 respectively. We recall that the pristine Na3SbS4 (model SbW0) does not show significant long range diffusion of Na ion, in agreement with the fact that no intrinsic vacancies are present in the model (Fig. S4†). There is a distinct splitting between the two contributions for the SbW3 model (Fig. 6c), with most of the diffusivity happening within the ab plane, in a 2D fashion, matching with the results obtained for tetragonal Na3SbS4 by BVSE method (Fig. 4), as well as MD (Fig. 5), where most of the diffusion happens bidimensionally within the ab plane (Fig. 5a), while the diffusion paths are scarcely interconnected along the c axis (Fig. 5b). This result is in agreement with the higher diffusion barrier related to Na1–Na1 hopping (Fig. 3a) for the tetragonal polymorph. The MSD vs. time plot for diffusivity within the ab plane or along the c axis are instead much more similar for the SbW12.5 model (Fig. 6d) compared to the SbW3 case, even though a slight preference for diffusion within the ab plane is still present in this model as well. This result is particularly interesting because it implies that the potential model developed in this study is able to capture the anisotropy in Na ion diffusion typical of the tetragonal phase even though the starting computational models were indeed cubic.
To obtain high conductivity and 3D transport in this family of materials, the stabilization of a cubic structure that is effectively cubic also at the local scale would be important. The fact that the difference between the in-plane (ab) and the out-of-plane (c) contributions to diffusivity is reduced along with the increase of the W doping (Fig. 6) suggests that a further increase in W-doping would achieve such goal. However, approximately 12% is the solubility limit for the Na3−xSb1−xWxS4 solid solution and the trend in conductivity vs. composition reaches a maximum at around x = 0.1.32 Higher substitutions seems to have a slightly negative effect on conductivity, presumably as a result of the competing effects of the increase in charge carrier concentration and the local structural distortion caused by the W substitution. This hypothesis is in line with the comparison of the calculated Na diffusion coefficients for 2% vacancies (Fig. 6b), where for the same amount of Na vacancies, a model including W as a dopant shows a slightly lower diffusivity compared to the undoped model.
The computational modeling results suggest that even the high W substitution chosen for the SbW12.5 model in order to reproduce a composition that is cubic on an average scale, is locally experiencing a slight anisotropy in Na ion diffusion, which is not consistent with the long range structure. This result is surprisingly in agreement with the experimental evidence that there is an apparent discrepancy between the short- and long-range ordering of the cubic phases for these systems, as PDF and Raman analysis suggest that, even if the XRD patterns match with the cubic space group I3m, the structure is locally tetragonal.7,33
To support this finding, Fig. 7 shows the PDF refined with both the cubic (a) and the tetragonal (b) model for Na2.9Sb0.9W0.1S4 for different r-ranges. The refinement method is described in the experimental section. A first hint on the short-range order of the structure is given by looking at Fig. S6,† where only a slight difference is noticeable between the extracted PDF of the pure and the 10% W-substituted phases for the 2–20 Å r-range, suggesting a similar ordering of the atoms. Based on the structural and computational results presented, the PDF data of the 10% W-substituted sample was refined against the cubic and the tetragonal structures. When refining the medium-range data (r-range 20–50 Å, Fig. 7), both the cubic (Rwp = 10.49%) and the tetragonal (Rwp = 7.43%) models give satisfying results, with the latter model giving a slightly but non negligible better fit. The refined parameters of both models were then used as a starting point for the fitting of the lower r-region (2–20 Å and, subsequently 2–9.5 Å), to reveal the local deviations of the structure from the average model derived from XRPD. On decreasing the r range, the quality of the fit performed with the cubic model progressively worsens: Rw = 18.11% in the 2–20 Å range and Rw = 21.01% in the 2–9.5 Å one, after parameters relaxation. Conversely, reasonably good fits are obtained using the tetragonal model: Rw = 13.19% and Rw = 12.60 in the 2–20 Å and 2–9.5 Å ranges, respectively (Table 1).
 | ||
| Fig. 7 Results of the PDF refinements for Na2.9Sb0.9W0.1S4 in different r-ranges against the cubic (a) and the tetragonal (b) model. | ||
| R wp% | ||
|---|---|---|
| r-Range/Å | Cubic model (a) | Tetragonal model (b) |
| 20–50 | 10.49 | 7.43 |
| 2–20 | 18.11 | 13.19 |
| 2–9.5 | 21.01 | 12.60 |
It is interesting to note that the introduction of a tetragonal distortion on the otherwise cubic structure only marginally affects this results; the fit of the local range data with the cubic model can only be improved when the atomic positions of the Na ions are allowed to change from the 6b(0, 0, 1/2) position to a 4d(0, 1/2, z) position, suggesting that disorder in the Na sublattice dominates the short-range structure. Accordingly, the peaks at 2.6 and 3 Å are loosely described even by the tetragonal structural model, as highlighted in the right panel of Fig. 7b. These peaks are relative to the Na–S and the Na–Na atom pair interactions. We should acknowledge the small Q range (Qmax = 20 Å1) of the total scattering data here presented. For this reason, we limit our analysis to the comparison of the quality of fits resulting from either the cubic or the tetragonal model. An in-depth analysis should be performed on data collected in a wider Q range.
To summarize, the average structure of the 10%-doped sample can be described by the cubic model; when the total scattering data in the medium range (20–50 Å) are analyzed, the distances between atoms are averaged and both models are good descriptors of the system, with the tetragonal model performing better. When the analysis is performed in the scale of a few unit cells, while the tetragonal model stays consistent, the cubic one loses his descriptive power, and it becomes clear that the average cubic structure does not match with the local ordering of the system, with the Na-ion sublattice being the most difficult to describe based on the available average structural models.
Overall, our experimental results support the finding that at room temperature, when the average structure of W-substituted samples can be indexed as cubic based on XRD data, the local to medium structure derived from total scattering analysis is instead better described by the tetragonal polymorph. This experimental evidence is in line with our computational modeling results, that show how the average model is cubic for the 12.5% W-substituted sample but, locally, the diffusion of Na-ion is not perfectly isotropic, as expected for a cubic structure. Analysis of the MSD still shows a preference for ab in-plane diffusion, in agreement with what expected for a tetragonal structure. However, the anisotropy of Na diffusion in the computation models is reduced as the W content increases and the absolute diffusion coefficient significantly increases compared to the lower W-substituted computational models. The lower activation energies for the cubic phases could then by addressed not to a different mechanism, but rather to a progressive interconnection of the ab planes through hopping along the c axis caused by the shrinking of the c-axis itself along with the increase in W substitution, even in the tetragonal polymorph. This consistency between experiments and simulations support our computational model and suggest that molecular dynamics can give insight in the relations between structure and transport that BVSE method cannot cover, particularly in conjunction with experimental local structure probes.
Conclusions
The sulphides with general formula Na3−xSb1−xWxS4 are highly investigated solid state electrolytes for SIBs. Their relevance stems from the high conductivity reported in this family at room temperature, i.e. 30–40 mS cm−1 for x = 0.1–0.12, their high malleability which allows the possibility to sinter them at room temperature by cold pressing and the possibility to synthesise them through wet-chemistry techniques. This class of materials possesses a rich polymorphism as a function of temperature and composition, with the highest conductive form being the cubic polymorph crystallizing in the I3m space group, for which the Na ion diffusion pathways are expected to be 3D and isotropic. The cubic polymorph is experimentally known to crystallize when the W substitution exceed 7.5%. However, the existence of a discrepancy at room temperature between average and local structure is known even for higher substituted systems and this will have an impact on the dimensionality of the ion transport.
In this study a classical pair potential model able to reproduce the structural and transport properties of the Na3−xSb1−xWxS4 system has been developed based on structural data and DFT-based calculations, and tested on different substituted compositions for classical molecular dynamics simulations. The main results of this study shed light on the subtle structural distortions that characterize these compounds and their correlation with the dimensionality of the ion transport in this system (2D vs. 3D); moreover, the role of Na ion vacancies in the structure, independently on the presence and nature of the aliovalent dopant element, is clarified, suggesting synthetic strategies that could improve their performances. In particular, it would be important to explore the solubility limits of different dopants (both on the Sb and the S sites) by combining long range and short range structure analysis with computational modelling, to ensure that the highest amount of Na vacancies due to aliovalent doping is achieved in a local-range structure that is cubic.
The simulation techniques employed in this study allowed to correlate the computational results to the local structural distortions of the system, that can be captured by total scattering techniques only. The evidence found at room temperature suggests that a similar behaviour could be found even as a function of temperature across the phase transition and this aspect will be the subject of a subsequent investigation in order to get a clearer picture of the correlation between structure and transport in this interesting family of Na-ion conductors.
Data availability
The data supporting this article have been included in the article and as part of the ESI† section.Author contributions
M. R. investigation, methodology, visualization, writing – review & editing; M. S. investigation, methodology, visualization, writing – review & editing; M. S. formal analysis, investigation, writing – review & editing; S. C. T. methodology, writing – review & editing; M. R. funding acquisition, writing – review & editing; C. T. conceptualization, supervision, methodology, writing – original draft.Conflicts of interest
There are no conflicts to declare.Acknowledgements
This work was funded by the Research Fund for the Italian Electrical System under the Three-Year Research Plan 2022–2024 (DM MITE no. 337, 15.09.2022), in compliance with the Decree of 16 April 2018. M. R. is grateful for a PhD fellowship sponsored by RSE S.p.A. The authors thank the ESRF for providing beamtime and the local contact Dr Catherine Dejoie for her precious support during experiment hc5402.References
- N. Yabuuchi, K. Kubota, M. Dahbi and S. Komaba, Chem. Rev., 2014, 114, 11636–11682 CrossRef CAS.
- B. L. Ellis and L. F. Nazar, Curr. Opin. Solid State Mater. Sci., 2012, 16, 168–177 CrossRef CAS.
- J. G. Kim, B. Son, S. Mukherjee, N. Schuppert, A. Bates, O. Kwon, M. J. Choi, H. Y. Chung and S. Park, J. Power Sources, 2015, 282, 299–322 CrossRef CAS.
- S. Zhao, H. Che, S. Chen, H. Tao, J. Liao, X. Z. Liao and Z. F. Ma, Research Progress on the Solid Electrolyte of Solid-State Sodium-Ion Batteries, Springer Nature Singapore, 2024, vol. 7 Search PubMed.
- Z. Li, P. Liu, K. Zhu, Z. Zhang, Y. Si, Y. Wang and L. Jiao, Energy Fuel., 2021, 35, 9063–9079 CrossRef CAS.
- H. Wang, Y. Chen, Z. D. Hood, G. Sahu, A. S. Pandian, J. K. Keum, K. An and C. Liang, Angew. Chem., Int. Ed., 2016, 55, 8551–8555 CrossRef CAS.
- O. Maus, M. T. Agne, T. Fuchs, P. S. Till, B. Wankmiller, J. M. Gerdes, R. Sharma, M. Heere, N. Jalarvo, O. Yaffe, M. R. Hansen and W. G. Zeier, J. Am. Chem. Soc., 2023, 145, 7147–7158 CrossRef CAS PubMed.
- A. Hayashi, N. Masuzawa, S. Yubuchi, F. Tsuji, C. Hotehama, A. Sakuda and M. Tatsumisago, Nat. Commun., 2019, 10, 5266 CrossRef CAS PubMed.
- A. Banerjee, K. H. Park, J. W. Heo, Y. J. Nam, C. K. Moon, S. M. Oh, S. T. Hong and Y. S. Jung, Angew. Chem., Int. Ed., 2016, 55, 9634–9638 CrossRef CAS PubMed.
- Q. Zhang, C. Zhang, Z. D. Hood, M. Chi, C. Liang, N. H. Jalarvo, M. Yu and H. Wang, Chem. Mater., 2020, 32, 2264–2271 CrossRef CAS.
- S. I. Nishimura, A. Hayashi, A. Sakuda and A. Yamada, ACS Appl. Energy Mater., 2022, 5, 14053–14058 CrossRef CAS.
- T. Fuchs, S. P. Culver, P. Till and W. G. Zeier, ACS Energy Lett., 2020, 5, 146–151 CrossRef CAS.
- D. Zhang, X. Cao, D. Xu, N. Wang, C. Yu, W. Hu, X. Yan, J. Mi, B. Wen, L. Wang and L. Zhang, Electrochim. Acta, 2018, 259, 100–109 CrossRef CAS.
- A. A. Coelho, J. Appl. Crystallogr., 2018, 51, 210–218 CrossRef CAS.
- S. I. Nishimura, N. Tanibata, A. Hayashi, M. Tatsumisago and A. Yamada, J. Mater. Chem. A, 2017, 5, 25025–25030 RSC.
- H. Chen, L. L. Wong and S. Adams, Acta Crystallogr., Sect. B: Struct. Sci., Cryst. Eng. Mater., 2019, 75, 18–33 CrossRef CAS.
- K. Momma and F. Izumi, J. Appl. Crystallogr., 2008, 41, 653–658 CrossRef CAS.
- P. Juhás, T. Davis, C. L. Farrow and S. J. L. Billinge, J. Appl. Crystallogr., 2013, 46, 560–566 CrossRef.
- C. L. Farrow, P. Juhas, J. W. Liu, D. Bryndin, E. S. Boin, J. Bloch, T. Proffen and S. J. L. Billinge, J. Phys.: Condens.Matter, 2007, 19, 335219 CrossRef CAS.
- P. Virtanen, R. Gommers, T. E. Oliphant, M. Haberland, T. Reddy, D. Cournapeau, E. Burovski, P. Peterson, W. Weckesser and J. Bright, SciPy 1.0: fundamental algorithms for scientific computing in Python, Nat. Methods, 2020, 17, 261–272 CrossRef CAS PubMed.
- J. D. Gale and A. L. Rohl, Mol. Simul., 2003, 29, 291–341 CrossRef CAS.
- W. Smith and T. R. Forester, J. Mol. Graphics, 1996, 14, 136–141 CrossRef CAS PubMed.
- W. Humphrey, A. Dalke and K. Schulten, J. Mol. Graphics, 1996, 14, 33–38 CrossRef CAS PubMed.
- T. Róg, K. Murzyn, K. Binsen and G. R. Kneller, J. Comput. Chem., 2003, 24, 657–667 CrossRef.
- P. Giannozzi, S. Baroni, N. Bonini, M. Calandra, R. Car, C. Cavazzoni, D. Ceresoli, G. L. Chiarotti, M. Cococcioni, I. Dabo, A. Dal Corso, S. De Gironcoli, S. Fabris, G. Fratesi, R. Gebauer, U. Gerstmann, C. Gougoussis, A. Kokalj, M. Lazzeri, L. Martin-Samos, N. Marzari, F. Mauri, R. Mazzarello, S. Paolini, A. Pasquarello, L. Paulatto, C. Sbraccia, S. Scandolo, G. Sclauzero, A. P. Seitsonen, A. Smogunov, P. Umari and R. M. Wentzcovitch, J. Phys.: Condens.Matter, 2009, 21, 395502 CrossRef PubMed.
- L. Zhang, D. Zhang, K. Yang, X. Yan, L. Wang, J. Mi, B. Xu and Y. Li, Adv. Sci., 2016, 3, 1600089 CrossRef PubMed.
- B. He, S. Chi, A. Ye, P. Mi, L. Zhang, B. Pu, Z. Zou, Y. Ran, Q. Zhao, D. Wang, W. Zhang, J. Zhao, S. Adams, M. Avdeev and S. Shi, Sci. Data, 2020, 7, 151 CrossRef.
- J. G. Smith and D. J. Siegel, Chem. Mater., 2022, 34, 4166–4171 CrossRef CAS.
- N. J. J. De Klerk, E. Van Der Maas and M. Wagemaker, ACS Appl. Energy Mater., 2018, 1, 3230–3242 CrossRef CAS PubMed.
- X. He, Y. Zhu, A. Epstein and Y. Mo, npj Comput. Mater., 2018, 18, 1–9 Search PubMed.
- F. Tsuji, N. Masuzawa, A. Sakuda, M. Tatsumisago and A. Hayashi, ACS Appl. Energy Mater., 2020, 3, 11706–11712 CrossRef CAS.
- S. Yubuchi, A. Ito, N. Masuzawa, A. Sakuda, A. Hayashi and M. Tatsumisago, J. Mater. Chem. A, 2020, 8, 1947–1954 RSC.
- T. Famprikis, O. U. Kudu, J. A. Dawson, P. Canepa, F. Fauth, E. Suard, M. Zbiri, D. Dambournet, O. J. Borkiewicz, H. Bouyanfif, S. P. Emge, S. Cretu, J. N. Chotard, C. P. Grey, W. G. Zeier, M. S. Islam and C. Masquelier, J. Am. Chem. Soc., 2020, 142, 18422–18436 CrossRef CAS.
Footnote |
| † Electronic supplementary information (ESI) available: Trajectory plots of Na ion in Na3SbS4; MSD vs. time plots from MD simulations; PDF data of Na3SbS4 and Na2.9Sb0.9W0.10S4; potential model and structural parameters. See DOI: https://doi.org/10.1039/d4ta04541f |
| This journal is © The Royal Society of Chemistry 2024 |