
 Open Access Article
 This Open Access Article is licensed under a Creative Commons Attribution-Non Commercial 3.0 Unported Licence
Design principles for anode stable solid-state electrolytes†
Tan-Lien
Pham
,
Lin
Wang
and
Bin
Ouyang
 *
*
Department of Chemistry and Biochemistry, Florida State University, Tallahassee, FL 32304, USA. E-mail: bo22b@fsu.edu
First published on 1st July 2024
Abstract
Metal containing oxides and halides offer a wide range of design spaces for solid-state electrolytes. However, the stability of these electrolytes at the anode/electrolyte interface remains a concern. It is commonly believed that electrolytes containing metals, such as lithium perovskite and lithium metal halides, are inherently unstable at the anode. This issue of electrochemical stability has been somewhat overlooked amidst the surge of research focusing on the development of new superionic conductors. In this work, we employ a computational framework to uncover the underlying causes of anode instability in different electrolytes that contain metals. Our findings indicate that deficient compounds in lithium, such as lithium perovskite or lithium metal halide, tend to be unstable at the anode regardless of the metal chemistry involved. This instability is primarily due to their unsuitable lithium stoichiometry, positioning them in regions of the phase diagram where stronger decomposition phases prevail. Conversely, lithium-rich compounds, such as newly identified overlithiated disordered rocksalt-type electrolytes, exhibit significantly better anode stability. Additionally, our research also shows that while anode stability is generally less problematic for sodium metal oxide-based electrolytes in solid-state sodium-ion batteries, it remains a challenge for sodium metal halides. This work rationales the choice of metal species and structural phases as stoichiometry for more electrochemical stable solid-state electrolytes.
 Bin Ouyang | Dr Bin Ouyang is currently an assistant professor in the Department of Chemistry and Biochemistry at Florida State University (2022–now). He earned his PhD in Materials Science from McGill University (2017.02), followed by postdoctoral training at the University of Illinois Urbana-Champaign (2017) and the University of California, Berkeley (2018–2022). His laboratory focuses on the data-driven design of disordered materials for sustainable energy. |
1. Introduction
The advancement of solid-state electrolytes has been significantly propelled by the computational and experimental identification of novel superionic conductors. Substantial efforts have been dedicated to the discovery of metal contained solid-state electrolytes, particularly metal oxides1–7 and metal halides8–13 as both of them show rich chemical space and structural form. It is of no doubt that both metal oxide and metal halide based solid-state electrolytes can be designed to show very competitive ionic conductivity, even approaching the conductivity of sulfide electrolytes14–16 and liquid electrolytes.17,18 However, one overlooked phenomenon is that many metal oxides and metal halides are very unstable against Li or Na metals.1–4,10–12 To give a few examples, LixLa1−x−δTiO33,19–21 was discovered decades ago but suffers from the reduction of Ti4+. Similarly, Li and Na metal halides, despite being at the forefront of recent materials research for superionic conductors, tend to be unstable against Li/Na metal anodes.10–12 This instability necessitates their use as catholytes, while sulfide electrolytes are employed as the actual electrolyte in contact with the anode.This abovementioned issue highlights the challenges and considerations in developing solely metal contained solid-state electrolytes in solid-state-batteries that aims at long lifetime. In this work, we conducted an extensive theoretical analysis of the various chemical factors influencing anode stability in metal-containing solid-state electrolytes. Furthermore, we propose a set of generalized compositional and structural design principles aimed at developing stable electrolytes at the anode. The issues discussed previously raise significant concerns regarding the exclusive use of metal-containing solid-state electrolytes in solid-state batteries, especially those designed for long lifetimes. In our study, we conduct an extensive theoretical analysis of the various chemical factors influencing anode stability in metal-containing solid-state electrolytes. Furthermore, we propose a set of generalized compositional and structural design principles aimed at developing stable electrolytes at the anode. Specifically, through a high-throughput screening of 16![[thin space (1/6-em)]](https://www.rsc.org/images/entities/char_2009.gif) 644 compositions across three typical structures1,2,5–13 – 3846 compositions for Li(Na) perovskite-based metal oxides, 1238 compositions for Li(Na) disordered rocksalt-type metal oxides, and 11560 compositions for Li(Na) metal halides – we have discovered that lithium-rich compounds, such as overlithiated disordered rocksalt types, generally exhibit significantly better anode stability than lithium-deficient compounds, such as Li perovskites or Li metal halides, even when the same metal species are involved. Additionally, we found that halides tend to be more unstable against anodes than oxides, primarily due to the increased likelihood of forming reduced metal halides. Importantly, our research also highlights that sodium metal oxides typically demonstrate much better stability against the anode compared to lithium metal oxides. However, sodium metal halides exhibit a similar level of instability against the anode as their lithium counterparts. These findings underscore the importance of carefully selecting the composition and structure of solid-state electrolytes to enhance their stability and, by extension, the longevity of solid-state batteries.
644 compositions across three typical structures1,2,5–13 – 3846 compositions for Li(Na) perovskite-based metal oxides, 1238 compositions for Li(Na) disordered rocksalt-type metal oxides, and 11560 compositions for Li(Na) metal halides – we have discovered that lithium-rich compounds, such as overlithiated disordered rocksalt types, generally exhibit significantly better anode stability than lithium-deficient compounds, such as Li perovskites or Li metal halides, even when the same metal species are involved. Additionally, we found that halides tend to be more unstable against anodes than oxides, primarily due to the increased likelihood of forming reduced metal halides. Importantly, our research also highlights that sodium metal oxides typically demonstrate much better stability against the anode compared to lithium metal oxides. However, sodium metal halides exhibit a similar level of instability against the anode as their lithium counterparts. These findings underscore the importance of carefully selecting the composition and structure of solid-state electrolytes to enhance their stability and, by extension, the longevity of solid-state batteries.
2. Methodology
All electrochemical stability analyses were performed with the phase diagram-based approach established by Ceder and Mo et al.22–25 This method involves constructing a phase diagram for the specific compositional space of the target solid-state electrolyte composition. These phase diagrams are created through convex hull optimization, utilizing the DFT (Density Functional Theory) relaxed experimental or hypothetical compounds from the Materials Project database.26 With the constructed phase diagram in hand, we evaluate the electrochemical phase stability using grand canonical phase diagrams. For any given lithium/sodium chemical potential (μLi/μNa), the grand potential (Φ) is considered as| Φ[c,μLi/Na] = E[c] − nLi/Na[c]μLi/Na | (1) |
The systematic exploration of the metal-dependent reduction limits involves a comprehensive examination of three promising categories of metal-containing electrolytes: perovskite-based metal oxides (Li-PRX or Na-PRX),1,2,30,31 disordered rocksalt-type metal oxides (Li-DRX or Na-DRX),5–7 and metal halides (Li-MH or Na-MH).8–13 To ensure our screening encapsulates all typical stoichiometries and compositions capable of maintaining charge balance within these three structures, we employed grid enumeration, as detailed in the ESI Section S1.† In total, we analyzed 3846 compositions for Li(Na)-PRX, 1238 compositions for Li(Na)-DRX, and 11560 compositions for Li(Na)-MH, covering a comprehensive range of possibilities for solid-state electrolytes in lithium and sodium battery technologies.
3. Results
3.1. Metal dependency of the reduction limit
The results in Fig. 1 offer a comparative analysis of the reduction limits (referenced to Li/Li+) of (a) Li-PRX, (b) Li-DRX and (c) Li-MH, respectively. Fig. 1(a)–(c) illustrate the distribution of the reduction voltage obtained from our phase diagram calculations across different metal species. In general, post-transition metals demonstrate the highest voltage for reduction. Several notable examples are Sb5+, Sn4+, Ge4+ and Te6+. In contrast, alkali earth metals and early transition metals, represented by Mg2+, Ca2+, Ba2+, Sc3+ and Y3+, show very low reduction limits in all three structures. It is also notable that several rare earth metals, e.g. La3+, Nd3+, Gd4+ and Sm3+, present very low reduction voltage, which makes them good candidates when designing electrolytes stable against anodes. In general, it can be summarized that alkali (earth) metals and early f-block metals typically result in lower reduction potentials, which is largely attributed to the low electronegativity of these metals. In addition to the general trends, there are divergent trends for some metal species. For example, Ti4+ show a high minimum reduction voltage of 1.714 V in Li-PRX and 1.877 V in Li-MH. However, the reduction voltage turns out to be 0.121 V in Li-DRX. The interesting divergence reveals additional factors that can influence electrochemical stability of metals.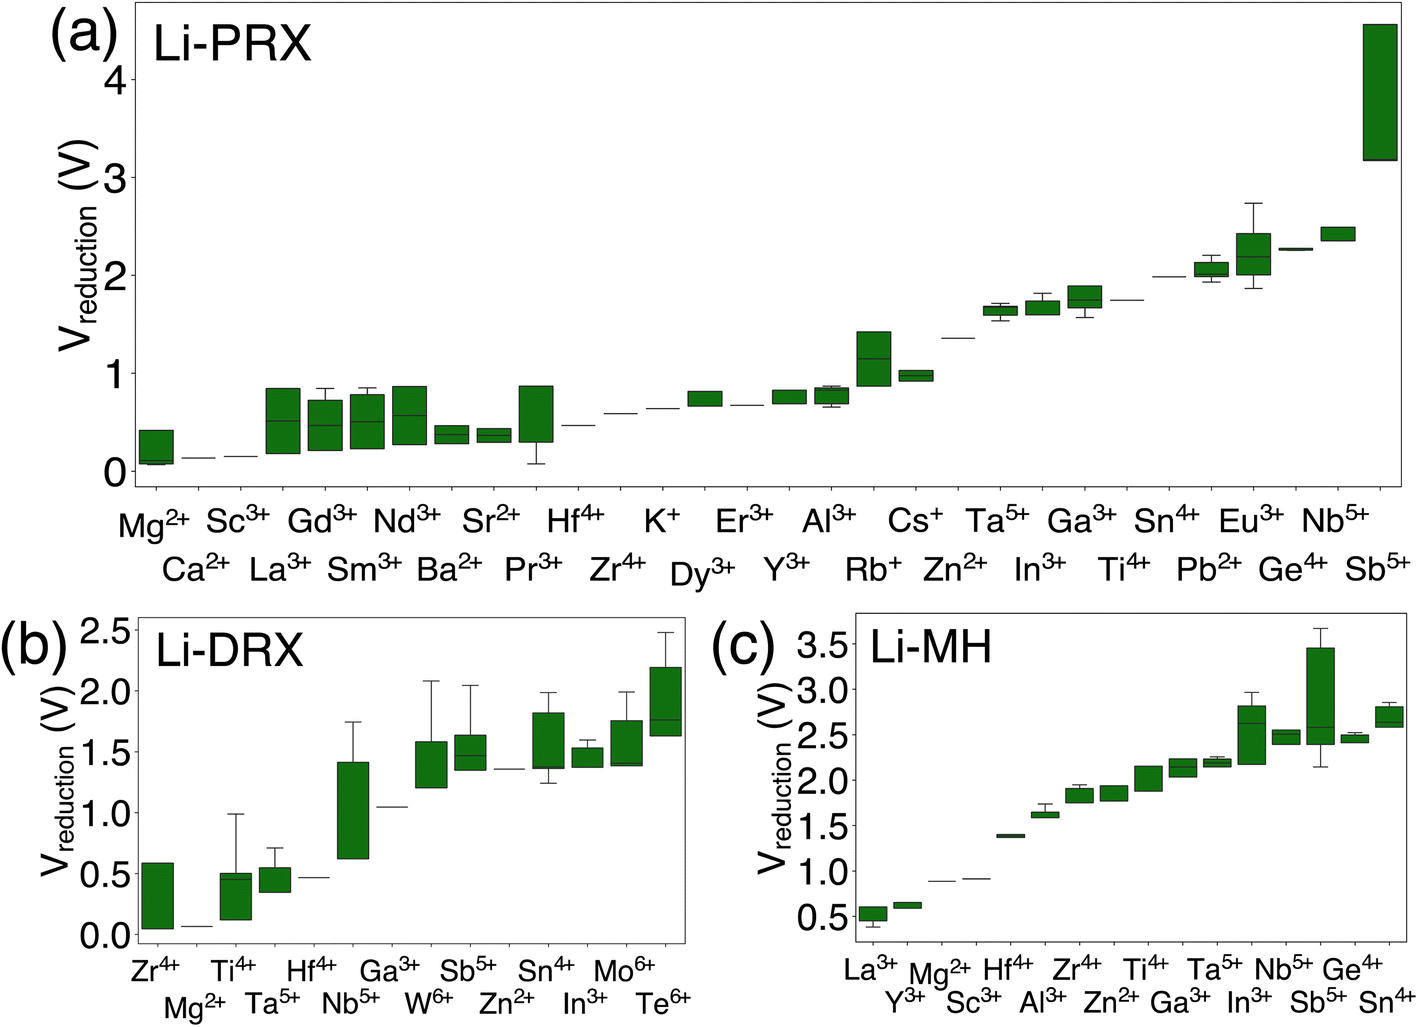 | ||
| Fig. 1 The metal dependent reduction voltage (referenced to Li/Li+) of (a) Li perovskite (Li-PRX), (b) Li disordered rocksalt (Li-DRX) and (c) Li metal halide (Li-MH) compounds. | ||
3.2. Lithium content dependency of the reduction limit
Beside the metal dependent reduction, the influence of the other factors is further investigated in our screened compositional spaces. This analysis allows us to understand the effect of Li stoichiometry by comparing Li-PRX with Li-DRX, as depicted in Fig. 2(a). This comparison highlights a considerable difference in the reduction limit for the same metal species but with a different Li stoichiometry. More specifically, for elements such as Sb5+ and Ti4+, the reduction limit differs by 1.824 V and 1.593 V, respectively, when compared Li-PRX to Li-DRX. The essential difference between Li-DRX and Li-PRX with the same metal species is the Li content per formula unit. The prototype formula for Li in Li-DRX electrolytes,5 Li1+x+δ(M1M2)1−xO2, contrasts with that for Li-PRX1,32 electrolytes, Lix(A,Vac)1−x(M1M2)1O3, indicating a significant variation in Li fraction per formula, regardless of chemical formulae. Typically, Li-PRX will have maximum one Li per five sites or per three anions,33 while Li-DRX will have at least one Li per two anions.5,6,34–38 In essence, the major difference between Li-PRX and Li-DRX is that Li-PRX is substantially more Li deficient than Li-DRX.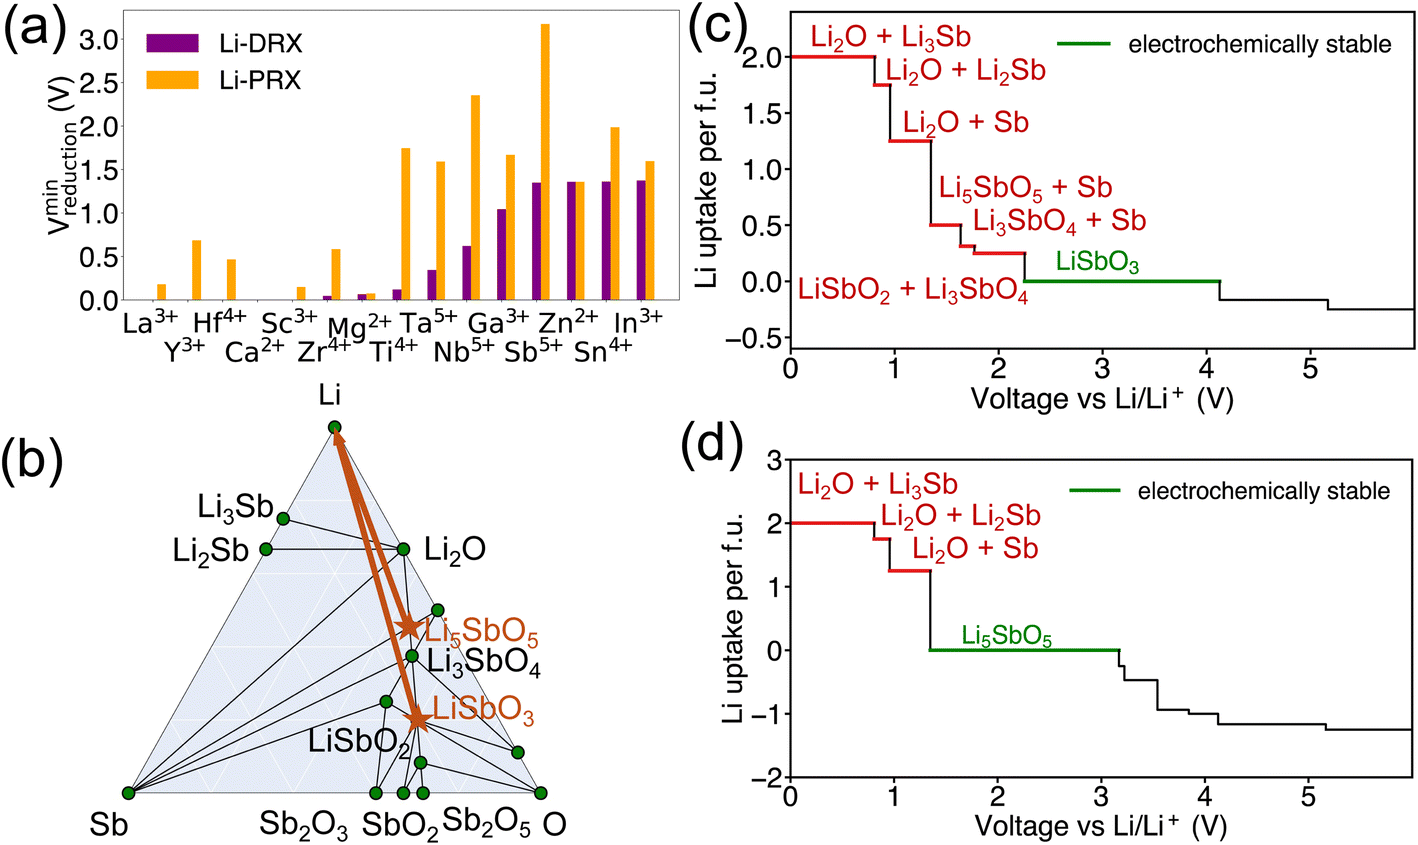 | ||
| Fig. 2 (a) The minimum reduction voltage of Li-DRX and Li-PRX, and (b) the phase diagram of Li–Sb–O shows stable phases in green circles, the target compounds are marked as orange stars, and the orange arrows show the Li decomposition pathway of LiSbO3 and Li5SbO5. (c and d) The equilibrium voltage profiles and phase equilibria for lithiation reactions of the interface reactions at the anode/electrolyte of LiSbO3 and Li5SbO5 respectively, the decomposition products of lithiation reactions at the anode side are labeled in red color, and the electrochemically stable voltage range is marked in green color. | ||
To delve into the influence of Li content, we established a comparison group, e.g., LiSbO3 following the Li-PRX stoichiometry constraint1,32 and Li5SbO5 following the Li-DRX stoichiometry constraint.5 The phase diagram of the Li–Sb–O system is visualized in Fig. 2(b) to indicate the fundamental difference in metal reduction mechanisms between these two systems. The two targeted compositions are labelled as orange stars in Fig. 2(b). It's important to note that the actual phases of LiSbO3 with a Li-PRX structure and Li5SbO5 with a Li-DRX structure may not represent the ground state within that specific composition. However, the method employed for electrochemical stability analysis aligns with the approaches used by Ceder and various other research groups.23,25,39–41 This method treats all structures of the same composition equally, as if they were on the convex hull. Given this approach, the precise energetic states of LiSbO3 and Li5SbO5 do not affect the outcomes of our analysis. It is also worth mentioning that the choices of LiSbO3 and Li5SbO5 as our focused compositions are arbitrary solely because they satisfy the stoichiometry constraint of Li-PRX and Li-DRX, respectively. Variations in stoichiometry for practical applications as electrolytes are unlikely to alter our primary conclusion, as any other compounds fitting within the Li-PRX and Li-DRX frameworks would occupy the same region on the phase diagram as these two compounds.
Guided by the orange arrows in Fig. 2(b), the differences in decomposition pathways can be elucidated. Together with the phase diagram, the voltage curves that plot the Li uptake of the target compound at different voltages for both LiSbO3 and Li5SbO5 can be found in Fig. 2(c) and (d) respectively. The decomposition pathway of both target compounds towards zero voltage can be directly determined by the intersections between the Li-target tie line (orange arrows) and the ground state tie lines of the phase diagram, which can be supported by the actual voltage curve in Fig. 2(c) and (d). It is evident that Li-deficient compounds are positioned further from the Li metal termination, especially when comparing LiSbO3 with Li5SbO5. This positioning results in more intersections with the ground states on the phase diagram, leading to decomposition at significantly higher voltages (lower Li chemical potentials). Such a trend is also dictated by the topology of phase diagrams, as a phase far away from a certain terminal element tends to have lower chemical potentials for that element.23,42 Specifically in the comparison between LiSbO3 and Li5SbO5, Li-poor LiSbO3 begins to decompose at voltage as high as 2.250 V, yielding LiSbO2 as the initial reduction product, followed by Sb and LixSb at even lower voltages. Conversely, Li5SbO5 initiates reduction at a lower voltage of 1.349 V. As the voltage decreases, its reduction pathway skips LiSbO2, leading directly to the formation of Sb and LixSb. Supported by the comparative analysis of LiSbO3 and Li5SbO5, we elucidate the underlying reason why Li-deficient compounds result in higher reduction voltages and the electrochemical instability of certain metals when used as solid-state electrolytes.
3.3. Anion dependency of the reduction limit
In addition to the effects of metal species and Li content, a notable distinction has been observed as shown in Fig. 3 between Li-MH and Li-DRX regarding the influence of anion sites. The results in Fig. 3 indicate that Li-MH in general gets reduced at much higher voltage compared with Li-DRX with the same metal. To probe the thermodynamic origins, a comparison with controlled variables has been conducted in the chemical space of Li–Zr–Cl in comparison to Li–Zr–O space as shown in Fig. 3(b). Two specific material compositions are picked as Li6Zr2O7 and Li6ZrCl10 respectively with the rationale that both satisfy the stoichiometry constraint of Li-DRX and Li-MH as well as share a similar Li fraction per formula unit (0.4 Li per f.u. and 0.35 Li per f.u.). Such a design will thus ensure a fair comparison which minimizes the influence of the Li content effect that has been presented above.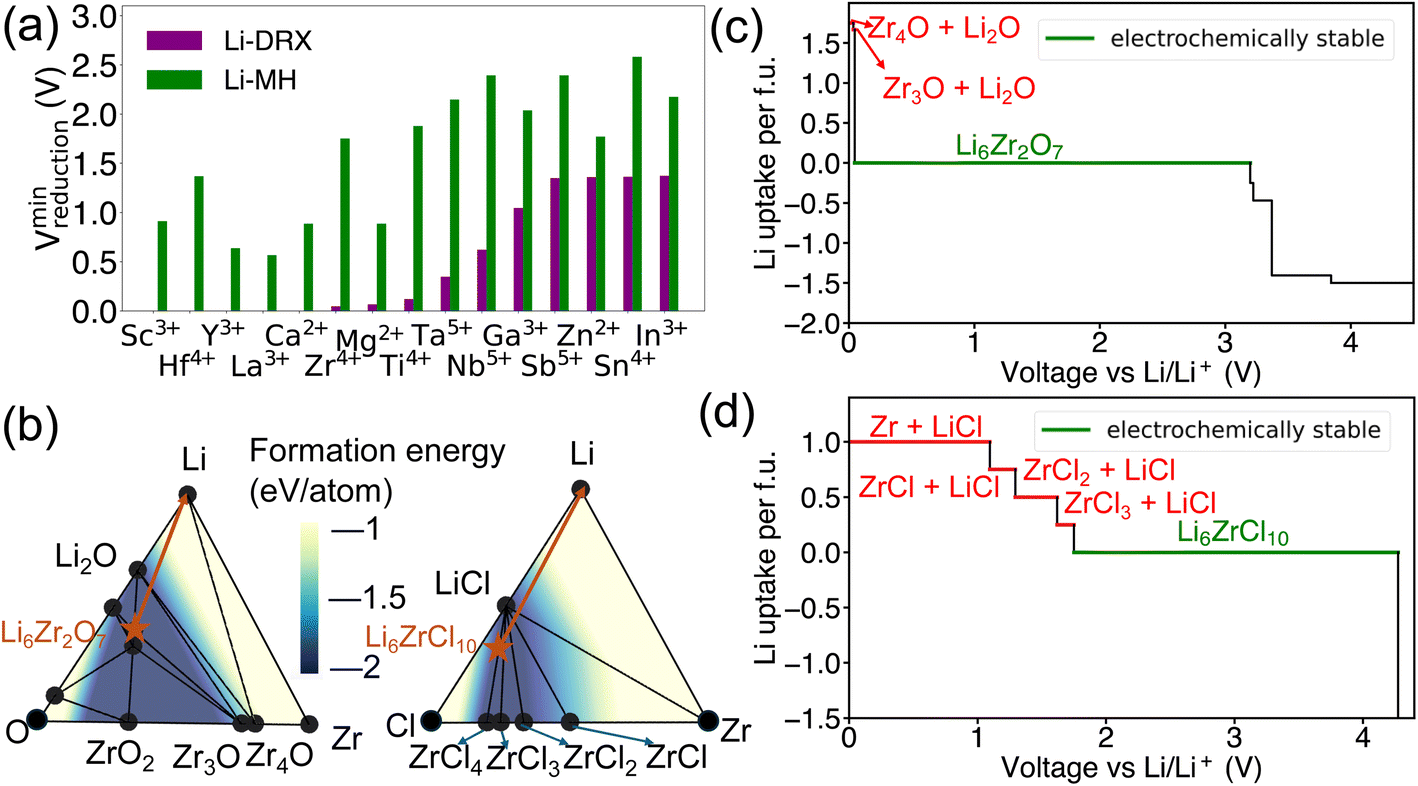 | ||
| Fig. 3 (a) The minimum cathodic limits (referenced to Li/Li+) for Li reduction of Li-DRX and Li-halide and (b) phase diagram of Li–Zr–O and Li–Zr–Cl. The formation energy of compositions in the convex hull is illustrated by the color contour, the stable phases are shown by black circles, the target compounds are marked as orange stars and orange arrows illustrate the decomposition pathways of Li6Zr2O7 and Li6ZrCl10, respectively. The equilibrium voltage profiles and phase equilibria for lithiation reactions of (c) Li6Zr2O7 and (d) Li6ZrCl10. The decomposition products of lithiation reactions at the anode side are labeled in red color, and the electrochemically stable voltage range is marked in green color. | ||
The decomposition pathways of Li6Zr2O7 and Li6ZrCl10 are indicated by the orange arrows in both phase diagrams, respectively, in Fig. 3(b). Along with the phase diagram, the voltage curves that depict the Li uptake of the target compound as a function of voltage for both Li6Zr2O7 and Li6ZrCl10 can be found in Fig. 3(c) and (d). Notably, Li6Zr2O7 intersects with two facets on the phase diagram that possess smaller convex hull depths. The convex hull depth is defined as the formation energy of the ground state in a specific phase facet of the phase diagram, which is illustrated by the color contour in Fig. 3(b). According to the Gibbs phase rule, the facet with larger convex hull depth will lead to lower chemical potential of elements, which will lead to higher voltage with respect to Li metal. To make comparisons, we calculate μZr for both compositional spaces. In particular, the μZr is calculated to be −8.570 eV per atom for the Li2O–Zr3O–Zr4O facet and −8.552 eV per atom for the Li–Li2O–Zr4O facet. Both facets set up the decomposition pathway of Li6Zr2O7. In comparison to Li6Zr2O7, the decomposition pathway for Li6ZrCl10 will encompass the LiCl–ZrCl3–ZrCl2 facet, LiCl–ZrCl2–ZrCl facet, LiCl–ZrCl–Zr facet and Li–LiCl–Zr facet, which has −9.401 eV per atom, −8.747 eV per atom, −8.548 eV per atom and −8.548 eV per atom μZr correspondingly. The higher μZr in Li–Zr–O compositional space when compared with that in Li–Zr–Cl compositional space indicates that the competing phases for halides are much more stable than in the case of oxides. The more stabilized competing phases in halide compositional space will thus create interaction facets with lower μLi. Specifically, Li6ZrCl10 will start to decompose at voltage as high as 1.750 V, yielding reduction of Zr4+ to Zr3+, Zr2+, Zr+ and Zr metal, as voltage goes down continuously. As a contrast, Li6Zr2O7 will not decompose until reaching a voltage of 0.036 V, yielding decomposition products of Zr3O and Zr4O respectively. Based on the case studies involving Li6Zr2O7 and Li6ZrCl10, we elucidate that halide containing compounds lead to an elevated reduction voltage limit due to the existence of stronger competing phases of metal halides.
3.4. Alkali metal dependency of the reduction limit in alkali metal oxides
Additionally, it has been observed that the reduction voltage dependency on the metal differs between Na metal oxides and Li metal oxides, despite having the same stoichiometry. The lowest reduction voltages for each metal, based on our dataset of Li-DRX compounds compared to Na-DRX compounds, are illustrated in Fig. 4(a). From Fig. 4(a), it can be deduced that Na-DRX compounds generally reduce at a lower voltage than Li metal oxides. To gain a deeper understanding of the thermodynamic origins of this phenomenon, we conducted a comparative analysis of Li2ZnO2 and Na2ZnO2. The phase diagrams for the Li–Zn–O and Na–Zn–O systems are presented in Fig. 4(b), while the respective voltage curves are depicted in Fig. 4(c) and (d).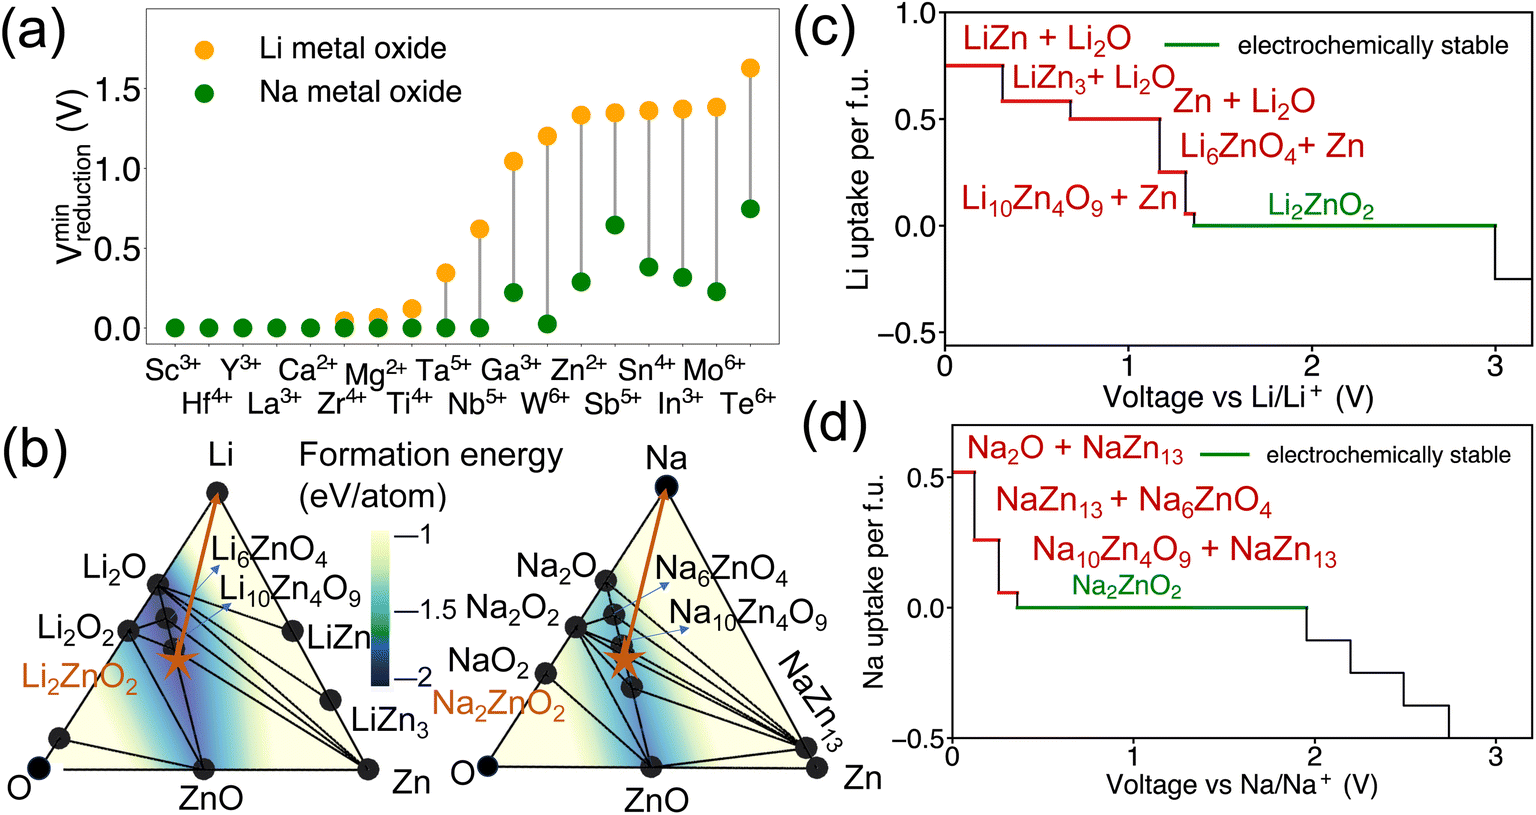 | ||
| Fig. 4 (a) The minimum reduction potential of Li metal oxide and Na metal oxide compounds (combination of Li-DRX and Li-PRX), and (b) phase diagram in Li–Zn–O and Na–Zn–O. The formation energy of compositions in the phase diagram is illustrated by the color gradient, and its value is marked by the color contour. The stable phases are shown by black circles, the target compounds are marked as orange stars and the orange arrows illustrate the decomposition pathway of Li2ZnO2 and Na2ZnO2, respectively. The equilibrium voltage profiles and phase equilibria for lithiation reactions of (c) Li2ZnO2 and (d) Na2ZnO2. The decomposition products of lithiation reactions at anode side are labeled in red color, the electrochemically stable voltage range is marked in green color. | ||
The orange arrows in Fig. 4(b) serve to highlight the variations in the decomposition processes. Specifically, in the comparison between Li2ZnO2 and Na2ZnO2, Li2ZnO2 is situated on a facet with a darker blue hue, indicating greater convex hull depths. This suggests that the formation energy of ground states within a particular facet of the Li–Zn–O phase diagram is lower than that within the Na–Zn–O space, as demonstrated by the color contour in Fig. 4(b). Specifically, the decomposition pathway for Li2ZnO2 includes transitions through the Li10Zn4O9–Li6ZnO4–Zn facet, Li6ZnO4–Li2O–Zn facet, Li2O–Zn–LiZn3 facet, Li2O–LiZn3–LiZn facet, and finally Li2O–LiZn–Li facet. Conversely, the decomposition pathway for Na2ZnO2 involves transitions through Na10Zn4O9–Na6ZnO4–NaZn13, Na6ZnO4–Na2O–NaZn13, and Na2O–NaZn13–Na facets. While the chemical potentials for Zn are similar in both decomposition pathways, as detailed in Table S1,† lithium is more stabilized in the competing phases than sodium (Table S2†), resulting in significantly higher reduction voltages for lithium compared to sodium. This can be attributed to the competing phases of sodium metal oxides being less stable than their lithium counterparts, which may be attributed to sodium's lower compatibility within the metal oxide framework. This difference in stability is generally understood in terms of the significantly different ionic sizes between Na+ and transition metals, such as Zn2+, as illustrated in Fig. 4.
In addition to examining the dependency of reduction limits on alkali metals in alkali metal oxides, the influence of alkali metals on the reduction limits in alkali metal halides was also explored. As shown in Fig. 5(a), both lithium and sodium metal halides exhibit comparable reduction voltages across a range of metal species, indicating that the reduction limit in alkali metal halides is largely unaffected by the choice of alkali metal. This observation suggests that the alkali metal component does not significantly impact the reduction limit within alkali metal halides. To better understand the role of alkali metals in this context, a comparative analysis was conducted using Li3SbBr8 and Na3SbBr8 as examples. This analysis, carried out within the Li–Sb–Br and Na–Sb–Br chemical spaces, aimed to uncover the thermodynamic principles underlying these observations, as depicted in Fig. 5(b). The selection of Li3SbBr6 and Na3SbBr6 for this comparison was based on their fulfillment of the stoichiometric requirements typical for alkali metal halide chemistry.
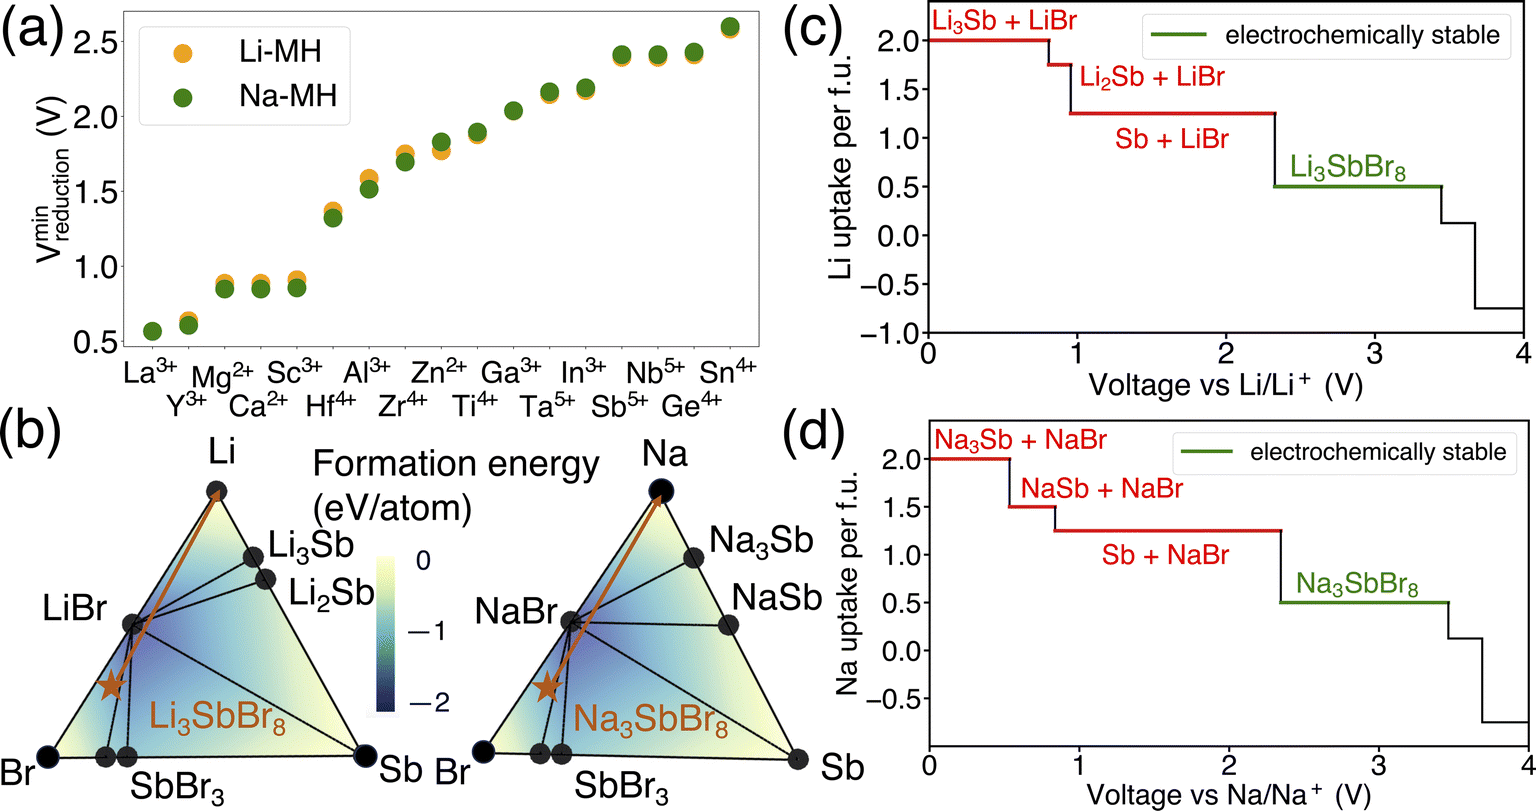 | ||
| Fig. 5 (a) The minimum reduction potential of Li metal halide and Na metal halide compounds and (b) phase diagram of Li–Sb–Br and Na–Sb–Br. The formation energy of compositions in the phase diagram is illustrated by a color gradient, and its value is marked by the color contour. The stable phases are shown by black circles, the target compounds are marked as orange stars and the orange arrows illustrate the decomposition pathways of Li3SbBr8 and Na3SbBr8. The equilibrium voltage profiles and phase equilibria for lithiation reactions of (c) Li3SbBr8 and (d) Na3SbBr8, respectively. The decomposition products of lithiation reactions at the anode side are labeled in red color, and the electrochemically stable voltage range is marked in green color. | ||
The differences in the decomposition pathway can be illustrated by the orange arrows in Fig. 5(b). Together with the phase diagram, the voltage curves that plot the Li uptake of the target compound as a function of voltage for both Li3SbBr8 and Na3SbBr8 can be found in Fig. 5(c) and (d), respectively. Notably, Li3SbBr8 and Na3SbBr8 intersect with three facets on the phase diagram that possess similar convex hull depths, which is illustrated by the color contour in Fig. 5(b). With the chemical potentials across key facets tabulated in Table S3,† it is notable that there is no obvious difference between these two chemical systems. The decomposed products of Li3SbBr8 and Na3SbBr8 are both metallic Sb and simpler binary compounds (like LiBr or NaBr) followed by continuous reduction tendency of antimonides to form lithium/sodium antimonides. Therefore, lithium metal halide and sodium metal halide compounds have similar reduction voltages as a result of being minimally influenced by the specific alkali metal present.
4. Discussion
Our phase diagram calculations and analyses have unveiled several design principles for developing Li or Na solid-state electrolytes with enhanced stability against the anode. A key finding from our study is the significant role of metal electronegativity in determining electrolyte stability. This insight extends beyond the typical metals used in cathodes, such as V, Cr, Mn, Fe, Co, Ni, and Cu, indicating that the redox stability of metals can vary widely. As suggested by our findings, represented in Fig. 1, electronegativity serves as a useful indicator for assessing the redox compatibility of a metal with Li or Na metal anodes. Generally, metals that are more electropositive tend to have lower redox voltages, rendering them more stable against the anode. However, this trend can be influenced by other factors, including the standard oxidation potential of different cations.43 For instance, while K+ is significantly more electropositive than Mg2+, compounds containing K+ exhibit higher reduction voltages than those with Mg2+. This anomaly can be attributed to the considerably lower standard oxidation potential of Mg2+ compared to K+, highlighting the complex interplay of other factors that affect the stability of electrolyte.43Beyond the electronic properties of various metal species, the effects of different material types are summarized in Fig. 6. This figure illustrates the kernel distribution of reduction voltages for six types of solid-state electrolytes examined in this study. Unlike the trends seen in electrochemical stability against cathodes, where the oxidation limit is consistently linked to the oxidation potential of the anion group and typically above 3 V, often exceeding 4 V, the stability against the anode is influenced by more than just chemical species. It also depends on structural types and compositions. Based on the general trends depicted in Fig. 6, we can identify several key insights regarding the compositional and structural aspects of these materials.
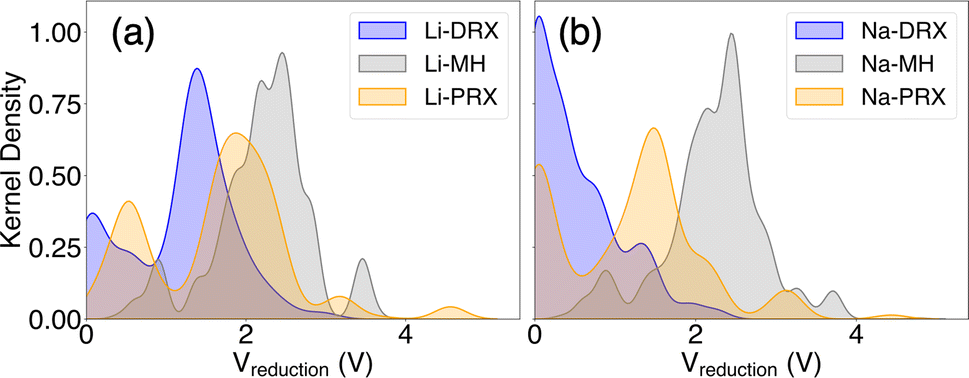 | ||
| Fig. 6 The kernel distribution of the reduction limits of (a) Li-DRX, Li-MH, and Li-PRX and (b) Na-DRX, Na-MH, and Na-PRX, respectively. | ||
Our discovery indicates the interesting fact that Li stuffed compounds will tend to outperform Li deficient compounds in terms of electrochemical stability against the anode. Even though both Li stuffing (often referred to as interstitial mediated diffusion) and Li removal (often referred as vacancy mediated diffusion) are widely used for enhancing ionic conduction, our study reveals the advantages of Li stuffing if the designed electrolytes form direct contact with the anode. Such findings also explain the limited anode stability of some well-known Li-deficient metal oxides, e.g. Li-PRX, as reported in the literature.1,3,4 In contrast, Li rich oxides, such as Li-DRX, or state-of-the-art Li7La3Zr2O12 and its derivatives,44,45 should in principle have much better stability against the anode. This pattern is further corroborated by the kernel distribution presented in Fig. 6. Specifically, the formation of electronically conductive SEI layers poses a significant concern for Li-poor metal oxides and Li/Na metal halides, as most of these compounds have a reduction voltage significantly higher than 0 V and produce electronically conductive decomposition products. Conversely, SEI formation is much less of a concern for Li-rich compounds, such as Li-DRX, and sodium metal oxides. In general, the threshold for ideal Li or Na stoichiometry is to have the target compound stay in the facet that contains Li metal as one end compound. For many DRX and Na metal oxides, this will be the case, but for Li perovskite, this will barely be possible.
On the other hand, our theory elucidates two primary sources of instability against the anode in Li-MH-based electrolytes. In recent years, there has been a surge in the study of Li-MH, noted for their remarkable ionic conductivities.8–13 However, these electrolytes are predominantly utilized as components in catholytes.46 This trend can be understood by examining both the effect of Li content and the role of halogens as anions. The challenges for Li-MH stem from: (a) their typically lower Li content compared to Li metal oxides, as exemplified by the common prototype formulae Li3MX6 or Li2MX447,48 and (b) the generally more stable metal halide competing phases within the convex hull of Li(Na)–M–X (X = Cl, Br), as opposed to their oxide counterparts, a phenomenon illustrated in Fig. 4 and 6.
Importantly, we find that stability against the anode is less of a concern for sodium metal oxides than for lithium metal oxides. Nevertheless, sodium metal halides exhibit similarly poor electrochemical stability as lithium metal halides. The contrast between Li containing systems and Na containing systems can also be clearly demonstrated in Fig. 6(a) and (b). This distinction is largely attributed to the differences in the anion frameworks between oxides and halides. Specifically, the Shannon radius of an O2− anion is much smaller than that of Cl− and Br−, resulting in a more compact framework in metal oxides than in metal halides. Consequently, it is easier to incorporate Li+ ions into the dense oxide framework due to their smaller size compared to Na+ ions, whose ionic radius is much larger than that of most transition metals found in metal oxides. Conversely, the more spacious halogen-based anion framework accommodates Li+ and Na+ well, leading to no significant difference in reducibility between lithium and sodium metal halides. These observations suggest that sodium metal oxides might offer advantages over sodium metal halides, especially in the development of all-solid-state sodium ion batteries. However, it should be mentioned that the size effect is only a hypothesis that aims to describe a general trend when comparing Na electrolytes with Li electrolytes. There are likely other case-by-case factors that determine the actual electrochemical stability of specific compounds.
In addition to our thermodynamic insights, we would like to highlight that electrochemical stability can be affected by kinetic factors. A thorough review of all potential kinetic factors is beyond the scope of this work. Nonetheless, a preliminary understanding can be obtained from the analysis conducted herein. Primarily, systems with a substantial thermodynamic drive for decomposition can generally be expected to exhibit faster decomposition reaction rates. This hypothesis aligns with the ‘max deltaG theory’ for solid-state phase transformations,49,50 also known as the Bell–Evans–Polanyi principle in catalysis.51 Furthermore, there are instances where reduction occurs in a more topotactic manner. For example, when LixMOy with a rocksalt phase is reduced, it is possible for the rocksalt phase to be maintained during reduction, as this reaction can proceed without displacing all the atoms. A systematic exploration of such phenomena would require considerably more extensive further research.
5. Conclusions
We have systematically examined every conceivable chemical factor influencing the electrochemical stability of metal-containing solid-state electrolytes. It has been indicated that the electrochemical stability is not solely dependent on the metal species but can also be significantly influenced by the stoichiometry of Li (Na), the types of anion groups, and the specific alkali metal species involved. This comprehensive analysis sheds light on the inherent instability of most Li perovskite-based electrolytes and Li (Na) metal halides when in contact with anodes. Conversely, it highlights the promising potential of Li-rich metal oxides and sodium metal oxides. These materials emerge as solid-state electrolytes capable of offering more dependable electrochemical stability, thus paving the way for their use in creating more reliable and long-lasting battery technologies.Data availability
All data of reduction/oxidation voltage as well as reduction products are made available at https://github.com/Jeff-oakley/EchemWindow/.Author contributions
T.-L. P. and L. W. performed the data processing. T.-L. P. and B. O. conducted the theoretical analysis of the data. B. O. supervised the project, provided critical feedback, and helped guide the research. T.-L. P. and B. O. discussed the results, contributed to the final manuscript, and gave final approval for publication.Conflicts of interest
The authors declare no conflict of interest.Acknowledgements
The authors acknowledge support from the startup funding from Florida State University. The computational resources were provided by the Advanced Cyberinfrastructure Coordination Ecosystem: Services & Support (ACCESS), the National Energy Research Scientific Computing Center (NERSC), a DOE Office of Science User Facility supported by the Office of Science and the U.S. Department of Energy under contract no. DE-AC02-05CH11231 and the Research Computing Center (RCC) at Florida State University. The computation and data processing were also supported by the supercomputing resources from the Department of Energy's Office of Energy Efficiency and Renewable Energy at the National Renewable Energy Laboratory.References
- D. Sun, N. Wu, C. Qin, R. White and K. Huang, Energy Technol., 2023, 11, 2201455 CrossRef CAS.
- A. Manthiram, X. Yu and S. Wang, Nat. Rev. Mater., 2017, 2, 16103 CrossRef CAS.
- O. Bohnke, C. Bohnke and J. L. Fourquet, Solid State Ionics, 1996, 91, 21–31 CrossRef CAS.
- Y. Zhu, X. He and Y. Mo, J. Mater. Chem. A, 2016, 4, 3253–3266 RSC.
- Y. Chen, Z. Lun, X. Zhao, K. P. Koirala, L. Li, Y. Sun, C. A. O’Keefe, X. Yang, Z. Cai, C. Wang, H. Ji, C. P. Grey, B. Ouyang and G. Ceder, Nat. Mater., 2024, 23, 535–542 CrossRef CAS PubMed.
- R. Clément, Z. Lun and G. Ceder, Energy Environ. Sci., 2020, 13, 345–373 RSC.
- H. Ji, A. Urban, D. A. Kitchaev, D.-H. Kwon, N. Artrith, C. Ophus, W. Huang, Z. Cai, T. Shi, J. C. Kim, H. Kim and G. Ceder, Nat. Commun., 2019, 10, 592 CrossRef CAS PubMed.
- X. Li, J. Liang, J. T. Kim, J. Fu, H. Duan, N. Chen, R. Li, S. Zhao, J. Wang, H. Huang and X. Sun, Adv. Mater., 2022, 34, 2200856 CrossRef CAS.
- T. Asano, A. Sakai, S. Ouchi, M. Sakaida, A. Miyazaki and S. Hasegawa, Adv. Mater., 2018, 30, 1803075 CrossRef.
- J. Liang, X. Li, K. R. Adair and X. Sun, Acc. Chem. Res., 2021, 54, 1023–1033 CrossRef CAS.
- C. Wang, J. Liang, J. T. Kim and X. Sun, Sci. Adv., 2022, 8, eadc9516 CrossRef CAS.
- Y. Yu, Z. Wang and G. Shao, J. Mater. Chem. A, 2021, 9, 25585–25594 RSC.
- K. Kim, D. Park, H.-G. Jung, K. Y. Chung, J. H. Shim, B. C. Wood and S. Yu, Chem. Mater., 2021, 33, 3669–3677 CrossRef CAS.
- Q. Zhang, D. Cao, Y. Ma, A. Natan, P. Aurora and H. Zhu, Adv. Mater., 2019, 31, 1901131 CrossRef CAS.
- J. Wu, S. Liu, F. Han, X. Yao and C. Wang, Adv. Mater., 2021, 33, 2000751 CrossRef CAS.
- J. Lau, R. H. Deblock, D. M. Butts, D. S. Ashby, C. S. Choi and B. S. Dunn, Adv. Energy Mater., 2018, 8, 1800933 CrossRef.
- A. Lewandowski and A. Świderska-Mocek, J. Power Sources, 2009, 194, 601–609 CrossRef CAS.
- K. Xu, Chem. Rev., 2014, 114, 11503–11618 CrossRef CAS.
- C. H. Chen and K. Amine, Solid State Ionics, 2001, 144, 51–57 CrossRef CAS.
- Y. Inaguma, C. Liquan, M. Itoh, T. Nakamura, T. Uchida, H. Ikuta and M. Wakihara, Solid State Commun., 1993, 86, 689–693 CrossRef CAS.
- H. Kawai and J. Kuwano, J. Electrochem. Soc., 1994, 141, L78 CrossRef CAS.
- L. J. Miara, W. D. Richards, Y. E. Wang and G. Ceder, Chem. Mater., 2015, 27, 4040–4047 CrossRef CAS.
- W. D. Richards, L. J. Miara, Y. Wang, J. C. Kim and G. Ceder, Chem. Mater., 2016, 28, 266–273 CrossRef CAS.
- V. Lacivita, Y. Wang, S.-H. Bo and G. Ceder, J. Mater. Chem. A, 2019, 7, 8144–8155 RSC.
- Y. Zhu, X. He and Y. Mo, ACS Appl. Mater. Interfaces, 2015, 7, 23685–23693 CrossRef CAS.
- A. Jain, S. P. Ong, G. Hautier, W. Chen, W. D. Richards, S. Dacek, S. Cholia, D. Gunter, D. Skinner, G. Ceder and K. A. Persson, APL Mater., 2013, 1, 011002 CrossRef.
- M. K. Aydinol, A. F. Kohan and G. Ceder, J. Power Sources, 1997, 68, 664–668 CrossRef CAS.
- M. K. Aydinol, A. F. Kohan, G. Ceder, K. Cho and J. Joannopoulos, Phys. Rev. B, 1997, 56, 1354–1365 CrossRef CAS.
- M. Aydinol and G. Ceder, J. Electrochem. Soc., 1997, 144, 3832 CrossRef CAS.
- V. F. Mattick, X. Jin, R. E. White and K. Huang, J. Energy Storage, 2019, 23, 537–543 CrossRef.
- L. Lyu, S. Cho and Y.-M. Kang, EES Catal., 2023, 1, 230–249 RSC.
- M. A. Peña and J. L. G. Fierro, Chem. Rev., 2001, 101, 1981–2018 CrossRef.
- A. B. Santibáñez-Mendieta, C. Didier, K. K. Inglis, A. J. Corkett, M. J. Pitcher, M. Zanella, J. F. Shin, L. M. Daniels, A. Rakhmatullin, M. Li, M. S. Dyer, J. B. Claridge, F. Blanc and M. J. Rosseinsky, Chem. Mater., 2016, 28, 7833–7851 CrossRef.
- J. Lee, A. Urban, X. Li, D. Su, G. Hautier and G. Ceder, Science, 2014, 343, 519–522 CrossRef CAS PubMed.
- Z. Lun, B. Ouyang, D.-H. Kwon, Y. Ha, E. E. Foley, T.-Y. Huang, Z. Cai, H. Kim, M. Balasubramanian, Y. Sun, J. Huang, Y. Tian, H. Kim, B. D. McCloskey, W. Yang, R. J. Clément, H. Ji and G. Ceder, Nat. Mater., 2021, 20, 214–221 CrossRef CAS PubMed.
- B. Ouyang, N. Artrith, Z. Lun, Z. Jadidi, D. A. Kitchaev, H. Ji, A. Urban and G. Ceder, Adv. Energy Mater., 2020, 10, 1903240 CrossRef CAS.
- Z. Lun, B. Ouyang, Z. Cai, R. J. Clément, D.-H. Kwon, J. Huang, J. K. Papp, M. Balasubramanian, Y. Tian, B. D. McCloskey, H. Ji, H. Kim, D. A. Kitchaev and G. Ceder, Chem, 2020, 6, 153–168 CAS.
- B. Ouyang and Y. Zeng, Nat. Commun., 2024, 15, 973 CrossRef CAS PubMed.
- Y. Xiao, Y. Wang, S.-H. Bo, J. C. Kim, L. J. Miara and G. Ceder, Nat. Rev. Mater., 2020, 5, 105–126 CrossRef CAS.
- Y. Xiao, L. J. Miara, Y. Wang and G. Ceder, Joule, 2019, 3, 1252–1275 CrossRef CAS.
- B. Ouyang, Y. Wang, Y. Sun and G. Ceder, Chem. Mater., 2020, 32, 1896–1903 CrossRef CAS.
- Y. Chen, Z. Wang, X. Li, X. Yao, C. Wang, Y. Li, W. Xue, D. Yu, S. Y. Kim, F. Yang, A. Kushima, G. Zhang, H. Huang, N. Wu, Y.-W. Mai, J. B. Goodenough and J. Li, Nature, 2020, 578, 251–255 CrossRef CAS PubMed.
- R. H. Petrucci, S. William, F. G. Herring and J. D. Madura, General Chemistry: Principles and Modern Applications, Pearson Education, Upper Saddle River, New Jersey, 9th edn, 2007 Search PubMed.
- A. J. Samson, K. Hofstetter, S. Bag and V. Thangadurai, Energy Environ. Sci., 2019, 12, 2957–2975 RSC.
- C. Wang, K. Fu, S. P. Kammampata, D. W. McOwen, A. J. Samson, L. Zhang, G. T. Hitz, A. M. Nolan, E. D. Wachsman and Y. Mo, Chem. Rev., 2020, 120, 4257–4300 CrossRef CAS PubMed.
- L. Zhou, T.-T. Zuo, C. Y. Kwok, S. Y. Kim, A. Assoud, Q. Zhang, J. Janek and L. F. Nazar, Nat. Energy, 2022, 7, 83–93 CrossRef CAS.
- X. Li, J. Liang, X. Yang, K. R. Adair, C. Wang, F. Zhao and X. Sun, Energy Environ. Sci., 2018, 11, 719–1000 RSC.
- X. Li, J. Liang, J. Luo, M. Norouzi Banis, C. Wang, W. Li, S. Deng, C. Yu, F. Zhao, Y. Hu, T.-K. Sham, L. Zhang, S. Zhao, S. Lu, H. Huang, R. Li, K. R. Adair and X. Sun, Energy Environ. Sci., 2019, 12, 2665–2671 RSC.
- M. Bianchini, J. Wang, R. J. Clément, B. Ouyang, P. Xiao, D. Kitchaev, T. Shi, Y. Zhang, Y. Wang, H. Kim, M. Zhang, J. Bai, F. Wang, W. Sun and G. Ceder, Nat. Mater., 2020, 19, 1088–1095 CrossRef CAS PubMed.
- L. Wang, Z. He and B. Ouyang, Comput. Mater. Sci., 2023, 230, 112513 CrossRef CAS.
- M. G. Evans and M. Polanyi, Trans. Faraday Soc., 1936, 32, 1333–1360 RSC.
Footnote |
| † Electronic supplementary information (ESI) available. See DOI: https://doi.org/10.1039/d4ta02269f |
| This journal is © The Royal Society of Chemistry 2024 |