
 Open Access Article
 This Open Access Article is licensed under a Creative Commons Attribution-Non Commercial 3.0 Unported Licence
ZIF-8 modified with 2-undecylimidazolate as filler for mixed matrix membranes for CO2 separation†
Marta
Pérez-Miana
 ab,
José Miguel
Luque-Alled
ab,
Mohamed
Yahia
abc,
Álvaro
Mayoral
a and
Joaquín
Coronas
*ab
ab,
José Miguel
Luque-Alled
ab,
Mohamed
Yahia
abc,
Álvaro
Mayoral
a and
Joaquín
Coronas
*ab
aInstituto de Nanociencia y Materiales de Aragón (INMA), CSIC-Universidad de Zaragoza, Zaragoza, 50018, Spain. E-mail: coronas@unizar.es
bChemical and Environmental Engineering Department, Universidad de Zaragoza, Zaragoza, 50018, Spain
cChemistry Department, Faculty of Science, Helwan University, Cairo, 11795, Egypt
First published on 22nd March 2024
Abstract
A novel modification of zeolitic imidazolate framework-8 (ZIF-8) with 2-undecylimidazolate (umIm) was explored to enhance its hydrophobic character and improve its compatibility with polymer of intrinsic microporosity PIM-1 when incorporated as a filler in mixed matrix membranes (MMMs). In addition to the study of the best conditions to exchange the structural ligand of ZIF-8 by umIm and the characterization (by FTIR, RMN, XRD, TGA, N2 adsorption and TEM) of the obtained material, comparative analyses were conducted using MMMs containing the original ZIF-8 and the modified version. Different loadings were applied to study the impact on gas separation properties. Remarkably, the MMM with the modified ZIF-8 demonstrated superior performance surpassing the Robeson upper bound line of 2008 and revealing the effectiveness of this MOF modification strategy. In fact, with the 10 wt% ZIF-8-umIm loading MMM, the highest value of CO2/N2 selectivity was 15.4 (12% higher than that of bare PIM-1) at a CO2 permeability of 16![[thin space (1/6-em)]](https://www.rsc.org/images/entities/char_2009.gif) 667 Barrer (52% higher than that of bare PIM-1). These findings highlight the promising potential of the ZIF-8 modification with umIm as a valuable filler material for MMMs in gas separation applications.
667 Barrer (52% higher than that of bare PIM-1). These findings highlight the promising potential of the ZIF-8 modification with umIm as a valuable filler material for MMMs in gas separation applications.
1. Introduction
Gas separation processes are of importance in the chemical industry. In recent years, modern membrane technology has emerged as a promising alternative to traditional, energy-intensive unit operations such as distillation, absorption and adsorption. This is supported by the substantial energy savings and significant economic and environmental benefits offered by membrane technology.1,2 In this context, the membrane industry has experienced significant growth over the last few decades.3 Currently, membranes are being commercialized for several gas separation applications related to O2/N2 (oxygen enrichment), CO2/CH4 (biogas upgrading), H2/CO (syngas ratio adjustment) and CO2/N2 (stopping the emission of CO2 to the atmosphere) mixtures, among others.4,5Several types of membranes are being investigated for gas separation. Polymeric membranes are widely used due to their cost effectiveness, ease of fabrication and customizable properties. Recently developed glassy polymers such as thermally rearranged (TR) polybenzoxazoles and polymers of intrinsic microporosity (PIMs) can exceed the so-called Robeson upper bound due to their large free volume and narrow porosity, making them well suited for gas separation applications.6,7Fig. 1 shows the structure of polymer PIM-1, the most studied member within the PIMs family. Its highly contorted conformation prevents efficient polymer chain packing creating large free voids within the polymer matrix that account for its high free volume and high gas permeability. Besides, these voids are connected through narrow slit-like cavities that provide adequate gas selectivity. Other PIMs with refined microporosity and functionalities have been developed through careful optimization of the chemical and structural properties. An extensive selection of PIM building blocks, each one exhibiting diverse properties,8 along with various post-modifications for PIM-1,9 are readily accessible. Compared to traditional low-free volume glassy polymers, PIMs provide a new paradigm for fabricating high-performance gas separation membranes. Nowadays, the state-of-the-art of polymeric membrane materials for air separation, CO2 removal and hydrogen recovery application is defined by PIMs.10 PIM-1, shows unprecedented gas separation performance for several gas pairs, e.g., O2/N2, CO2/CH4 and CO2/N2.11 However, concerning commercial applications, PIM-1 encounters challenges related to gas-pair selectivity, especially for some relevant separations; stability against physical aging and plasticization; scale-up of polymer production; and reproducible membrane fabrication. Newly developed high-performance benzotriptycene-based and norbornyl-benzocyclobutene-based ladder PIMs, functionalized PIMs, PIM-derived carbon molecular sieves (CMS), thin-film composite membranes, as well as gas transport properties of PIMs tested under subambient temperatures are starting to stand out as possible solutions to a future implementation in industry.12 Substantial progress in the gas separation capabilities of the latest generation PIMs has established the upper bounds for H2/N2, H2/CH4 and O2/N2 in 2015, the mixed-gas upper bound for CO2/CH4 in 2018, and the pure-gas upper bounds for CO2/N2 and CO2/CH4 in 2019.13
 | ||
| Fig. 1 (a) PIM-1 structure and unit cell using different models and (b) 3D spatial polymeric arrangement.14 | ||
The incorporation of nanofiller materials to PIM-1 has been widely reported with the aim of boosting the performance of this polymer and obtaining membranes capable of achieving the required gas separation performance. In particular, metal–organic frameworks (MOFs) are of great interest due to their particular properties (e.g., tailorable chemical composition and structure, high porosity, tunable pore size, compatibility and affordability, among others). MOFs are composed of an inorganic component (a metal cluster) linked to organic ligands through coordination bonds, resulting in organic–inorganic crystalline porous materials.15 Their high and permanent porosity,16 together with the possibility of modifying pore design and functionality,17,18 achieved by varying the ligand component, make them highly appealing for a wide range of applications, including encapsulation,19 drug delivery,20 catalysis,21 gas storage22,23 and membrane separation.24 MOFs based on imidazolate ligands, known as ZIFs (zeolitic imidazolate frameworks), have received much attention due to their tetrahedral coordination geometry and high porosity, which render them suitable for applications where a high surface area is required. The term “zeolitic imidazolate” was given to this family of MOFs because the angle that the metal ion and the ligand create was comparable to that existing in zeolites between silicon or aluminum and oxygen atoms: 145°.25 ZIF-8, the best-known ZIF, is a MOF with the SOD-type zeolitic structure, made of Zn metal ions joined to nitrogen donor atoms present in the organic ligand 2-methylimidazolate. ZIF-8 exhibits high thermal stability (up to 400 °C), 0.34 nm micropores with 1.1 nm cavities and a hydrophobic nature.25 This MOF has been extensively researched for gas separation,26 encapsulation,27 H2 storage,28 and other applications.29
ZIF-8 modifications have been extensively studied in the last years for its use in many of the above mentioned applications, aiming to maintain its original structure but modifying its functionality, external surface or pore opening. These modifications include adjusting ZIF-8 pore for electrochemical sensor applications30 or even in cancer therapy, diagnosis and imaging, often modified with polyethylene glycol or hyaluronic acid, among others.31,32 In the case of gas separation membranes, when incorporating filler particles in polymeric matrix to create the so-called mixed matrix membranes (MMMs), the main concern is the compatibility between discrete filler particles and polymer chains. Some studies have shown that a close structural match between the polymer and fillers proved advantageous in establishing a compatible interfacial structure and improving plasticization resistance. To deal with it, it has been demonstrated that functionalizing fillers or fabricating hybrid ones improve its dispersibility in the solvent, its compatibility with the polymer chains,33,34 and thus the performance of the MMMs.35 It is possible to manipulate both the physical and chemical properties of fillers in order to amplify the diffusion and adsorption processes, respectively. Based on the targeted objective, the strategies for structural manipulation of ZIF-8 can be categorized into five groups: lattice flexibility, ligand structure, crystallinity, physical morphology and chemical properties.36 Some examples of these modifications include studies in which the chemical microenvironment within ZIF-8 was adapted by incorporating room temperature ionic liquids (RTILs) into the ZIF-8 cavity. The success of this modification was guided by the RTILs' negligible vapor pressure, high thermal stability and strong affinity to CO2 when utilized as the solvent in ZIF-8 synthesis, resulting in a notably enhanced CO2 adsorption, although there is a reduction in sorption levels for CH4 and N2 due to the cavity occupation by the ILs.37 ZIF-8 modified with polydopamine (ZIF-8@PDA), integrated into polyimide38 or PEBA-type copolymers,39 also revealed benefits due to the stronger interfacial adhesion thanks to hydrogen bonds. The enhanced interfacial compatibility led to a reduction in interfacial voids, resulting in a notable improvement in CO2/CH4 or CO2/N2 membrane selectivity.
Another approach to synthesize MOFs with specific functional groups is to incorporate a range of linkers during the synthesis process.40 However, this technique has its limitations, because linkers with varying functionalities or lengths may yield a width variety of structures or even result in amorphous material. In this context, the utilization of post-synthetic ligand exchange emerges as an appealing strategy for modifying existing MOF crystals and creating novel MOF structures that are challenging to achieve through direct synthesis. The resultant MOF crystals frequently retain the topologies of the “parent” MOFs but incorporate a specific proportion of new ligands and functionalization.41 This approach is called solvent-assisted ligand exchange (SALE), which was first introduced by Karagiaridi et al. In their pioneering work, they achieved the successful ligand exchange of 2-ethylimidazolate linkers in a cadmium ZIF (CdIF-4, with the RHO topology) with 2-nitroimidazole to produce CdIF-9 and with 2-methylimidazolate to create SALEM-1.42 An analogous method has also been performed in ZIF-8 with different ligands, resulting in an enhancement in CO2 adsorption43 or in an opening in the aperture of ZIF-8.44 For example, Yuan et al. investigated the incorporation of amino-functionalized ZIF-8 into imidazole containing copolyimide MMMs. The introduction of this functionalization facilitated hydrogen bonding with the polymer, increasing the interaction between the two components and thus improving the gas separation performance of the membrane.45
MMMs, which consist of a combination of both polymeric and generally porous filler materials (inorganic or inorganic–organic), provide a balanced trade-off between performance and cost of a membrane. For this reason, MMMs are predicted to emerge as the new generation of gas separation membranes for many of the above-mentioned gas mixtures. ZIF-8 containing MMMs have been reported to overcome the 2008 Robeson upper bounds46 for several gas pairs of great interest: CO2/CH4 (ZIF-8 with PIM-1 (ref. 47)) and CO2/N2 (ZIF-8 in Pebax® 2533 (ref. 48)), among others. Bushell et al.47 prepared the first reported MMMs from PIM-1 and ZIF-8 varying the ZIF loading from 11 to 43 vol%. At the optimum loading, the incorporation of ZIF nanoparticles led to an increase in both gas permeability and selectivity. However, the selectivity of membranes containing ZIF-8 decreased after alcohol treatment, which is required to fully exploit the performance of PIM-1 membranes since it removes the history of the membrane polymer and boosts the free volume.49,50 Later, Yahia et al.51 investigated the influence of particle size (50–450 nm) in PIM-1/ZIF-8 MMMs and concluded that 120 nm is the optimal size.52 Moreover, Wu et al.53 prepared (PIM-1)-based MMMs with ZIF-8 and ZIF-67 nanofillers and found double CO2/CH4 selectivity for the latter ZIF due to its smaller pore size which confers more efficient sieving properties.
To overcome the main challenges of PIM membranes, besides modifying the own polymer as above mentioned, several studies have demonstrated that including fillers to conform MMMs made of PIM can considerably reduce the physical aging of the membranes.54,55 The main concern related to the fabrication of MMMs, including those made of PIM-1 and ZIF-8, is the well-known incompatibility between discrete nanofiller particles and polymer chains.8,56 This incompatibility is closely related to the challenges that this polymer deals with, especially with physical aging and plasticization.54,57 An improvement in the filler-polymer compatibility has allowed to achieve an enhancement in these concerns,33,35 otherwise the incompatibility typically leads to the creation of interfacial defects between both phases that can eventually ruin the membrane performance, i.e., a large increase in gas permeability at the expense of a large decrease in gas selectivity.33,47 In order to minimize this undesired effect, it is critical to prevent agglomeration of the nanofiller, and therefore functionalization of the nanofiller is often performed to improve its dispersibility in the solvent and compatibility with the polymer chains.33,34
Several protocols have tried to be implemented in the practice for achieving optimal polymer compatibility, including complex mixing procedures, such as the gradual addition of precise amounts of the polymer to the colloidal solution to create a stabilizing polymer shell around the nanoparticles.55 Consequently, it is crucial to optimize the interaction between the filler and the polymer. This optimization is necessary not only to minimize compatibility issues but also to enable simple and scalable manufacturing processes. Some studies have already reported an enhanced performance of PIM-1 membranes when adding functionalized fillers, such as ZIF-8 modified with 4,5-dicyanoimidazole.58 Luque-Alled et al. also reported an improvement in the PIM-1 membrane performance when functionalizing a filler with an aliphatic chain.50 Here, we present the first modification of ZIF-8 with 2-undecylimidazolate, which enhanced the hydrophobic character of the MOF, making it more compatible in terms of filler-polymer interaction when adding it to conform MMMs. A comparative analysis was carried out to assess the performance of MMMs containing the original ZIF-8 and the modified version. The results demonstrated enhanced compatibility and membrane separation performance with the incorporation of the modified ZIF-8.
2. Experimental section
2.1 Synthesis of ZIF-8
ZIF-8 was synthesized through a conventional solvothermal method reported elsewhere.59 Two solutions were prepared as follows: 6.85 g of 2-methylimidazole (mIm, 83 mmol, acros-organics, 99%) was dissolved in methanol (MeOH, 200 mL, Sigma Aldrich), while 2.93 g of Zn(NO3)2·6H2O (9.8 mmol, Sigma-Aldrich, 98%) was dissolved in the same amount of MeOH. Both solutions were mixed and stirred during 30 min at room temperature. The suspension obtained was centrifuged at 8000 rpm for 15 min, giving rise to a solid that was washed twice with MeOH (15 mL), centrifuged under the same conditions and dried at room temperature overnight.2.2 Synthesis of PIM-1
PIM-1 polymer with a molecular weight of 75000 Da and a polydispersity index (PDI) of 1.85 was synthesized following a previously reported procedure.51 In brief, 2,3,5,6-tetrafluorophthalonitrile (TFTPN, 2.001 g, 0.01 mol, Sigma Aldrich), 3,3,3′,3′-tetramethyl-1,1′′-spirobisindane-5,5′,6′,6′-tetrol (TTSBI, 3.40 g, 0.01 mol, Sigma Aldrich), anhydrous potassium carbonate (K2CO3, 4.14 g, 0.03 mol), N-methyl-2-pyrrolidone (NMP, 20 mL, Sigma Aldrich) and toluene (10 mL) were homogenously mixed in a three-necked flask equipped with a magnetic stirrer and under a N2 flow. The mixture was then refluxed for 4 h (see synthesis route in Fig. S1†). Afterward, the viscous solution was poured into MeOH. The resulting yellowish polymer precipitate was dried, dissolved in chloroform (CHCl3), precipitated again in MeOH and finally dried at 80 °C for 48 h. The polymer obtained in this synthesis batch was already employed in a previous work and all its characterization can be found there.60
2.3 Ligand exchange procedure
As all the attempts carried out to synthesize a ZIF based on 2-undecylimidazolate (umIm) as ligand were unfruitful, the SALE approach was followed here. For the ligand exchange procedure, 0.500 g of ZIF-8 (2.2 mmol) was suspended in 42 mL of MeOH, while 0.977 g of 2-undecylimidazole (4.4 mmol, TCI – Tokyo Chemical Industry) was dissolved separately in 42 mL of MeOH and stirred during 10 min at room temperature. Afterwards, both dispersions were mixed under stirring for 5 min at room temperature and poured into a Teflon-lined stainless steel autoclave. Then, it was sealed and placed in an oven at 70 °C for 14 days. Then, the product was collected by centrifugation at 9000 rpm for 15 min, washed three times with MeOH and dried overnight at 60 °C under vacuum. Hereinafter, the modified ZIF-8 will be named as ZIF-8-umIm. Fig. 2 shows the molecule of the ligand umIm (a) and the proposed structure of the ZIF-8-umIm after ligand exchange (b).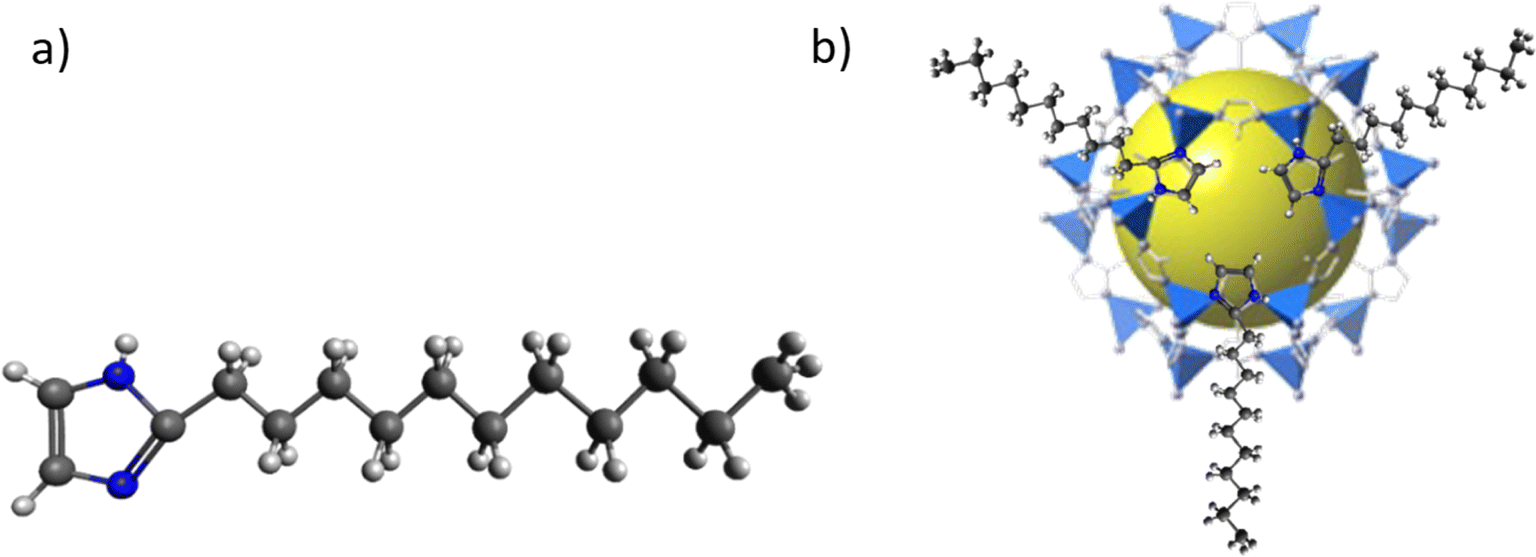 | ||
| Fig. 2 (a) 2-Undecylimidazole (umIm) molecule and (b) structure of ZIF-8-umIm upon ligand exchange on ZIF-8. | ||
2.4 Preparation of membranes
PIM-1 powder (0.1 g) was dissolved in chloroform (3 mL) and stirred during 2 h at room temperature. Different amounts of MOF were added to obtain 1, 2.5, 5, 10 and 15 wt% loadings. The MOF powder was dispersed into the PIM solution alternating 3 cycles of 30 min of stirring and sonicating. Once the MOFs were well dispersed, the casting suspensions were poured onto glass Petri dishes and left to evaporate for 48 h, revealing a membrane thickness of around 100 μm. The membranes were peeled off and soaked in MeOH for 1 h and dried under vacuum in an oven at 80 °C for 4 h.2.5 Characterization and gas separation test
Thermogravimetry (TGA), X-ray diffraction (XRD), Fourier transform infrared spectroscopy (FTIR-ATR), scanning electron microscopy (SEM), energy dispersive spectroscopy (EDS), N2 adsorption–desorption isotherms, nuclear magnetic resonance (NMR) analysis, gel permeation chromatography (GPC), water contact angle (WCA) measurements, spherical aberration scanning transmission electron microscopy (Cs-corrected STEM) and elemental analysis were used to gain insight into the fillers and membrane materials. The corresponding details can be found in the ESI file.†For gas separation, testing membranes were placed in a gas separation membrane module consisting of two stainless steel pieces and a 316L stainless steel macro-porous disk support (Mott Co.) with a 20 μm nominal pore size and 2.12 cm2 of circular area. Membranes were held inside the module with Viton o-rings. The gas separation measurements were carried out by feeding post-combustion gaseous equimolar mixtures of CO2/N2 and CO2/CH4 to the feed side at an operating pressure of 3 bar. Mass-flow controllers (Alicat Scientific, MC-100CCM-D) provided steady and controlled gas flows of the studied molecules. The permeate side of the membrane was swept at atmospheric pressure (∼1 bar) with a 50 cm3 (STP) min−1 of He. Concentrations of CO2, N2 and CH4 in the permeate side were analyzed by an Agilent 3000 A micro-gas chromatograph.
Permeability was calculated in Barrer (1 Barrer = 10−10 cm3 (STP)cm cm−2 s−1 cm Hg−1) once steady-state was reached. The CO2/N2 and CO2/CH4 separation selectivities were calculated as the ratio of the corresponding permeabilities. To control the temperature of the experiment (at 35 °C), the permeation module was placed in a UNE 200 Memmert oven.
3. Results and discussion
3.1 MOF characterization
Unlike other previous studies in which the SALE method was used with ZIF ligands, a ligand never used for the synthesis of ZIFs was applied here, taking into account that this ligand alone was not able to crystallize a MOF (not shown). ZIF-8 particles of ca. 50 nm in size were used for the SALE process. This was performed at different exchange times (24 h, 48 h, 72 h, 7 days and 14 days) and temperatures (25, 50 and 70 °C) as exchange variables. ZIF-8-umIm samples were characterized by TGA, XRD and FTIR and not significant variations were observed above 70 °C and 14 days. The ligand exchange should occur mainly on the external part of ZIF-8 particles as it is the most exposed area and the introduced linker may be quite large to penetrate easily the narrow pore windows of ZIF-8.43,61 So, considering that most of the ligand from the external surface was exchanged (around 26%, as it will be later confirmed with elemental analysis and NMR) at these conditions (14 days and 70 °C), this sample was used for implementing the MOF in MMMs.Focusing on the sample after the SALE treatment during 14 days and at 70 °C, TGA revealed a slight decrease in the MOF stability comparing with original ZIF-8, from around 420 °C to 400 °C (Fig. 3a). The decrease in the temperature of degradation can be related to the presence of the ligand umIm slightly decreasing the stability of the well-defined structure of ZIF-8, thanks to the generation of some distortions in the ZIF structure, but essentially maintaining the original crystal structure of ZIF-8. Moreover, the shape of the TGA curves does not suggest the mere encapsulation of the ligand (e.g., with a weight loss step at a temperature something above that corresponding to the pure ligand)27 being compatible with a structural modification of the MOF. Also, if we compare the TGA of sample exchanged at room temperature (pink line) with the one at 70 °C (blue line), the final amount of product (ZnO) at 700 °C is lower in the sample at 70 °C. This means that having the same amount of Zn (corresponding to the parent ZIF-8), the ratio between the organic part and the ZnO increases at 70 °C, which means that the organic part is higher due to the presence of umIm and, therefore, the temperature promotes the ligand exchange.
Indeed, at a first glance XRD patterns indicated that crystallinity remains identical with the main peaks at 7.5°, 10.5° and 13°, as it is shown in Fig. 3b. Nonetheless, a slight shift from ca. 7.5° to 7.3° was observed (see the inset in Fig. 3b) in the amplified region corresponding to the main peak for the sample after the SALE treatment. This corresponds to a slight increase in the parameter of the unit cell, from 16.65 Å to 17.10 Å, in concordance with the incorporation of the ligand umIm and therefore an increase in the cell volume. Although Fig. 3b collects normalized intensities, when comparing the absolute intensities of the main peaks of ZIF-8 and ZIF-8-umIm, they were in the same order of magnitude: ca. 198000 and 162000 a.u., respectively, corroborating the preservation of a high crystallinity after the ligand exchange.
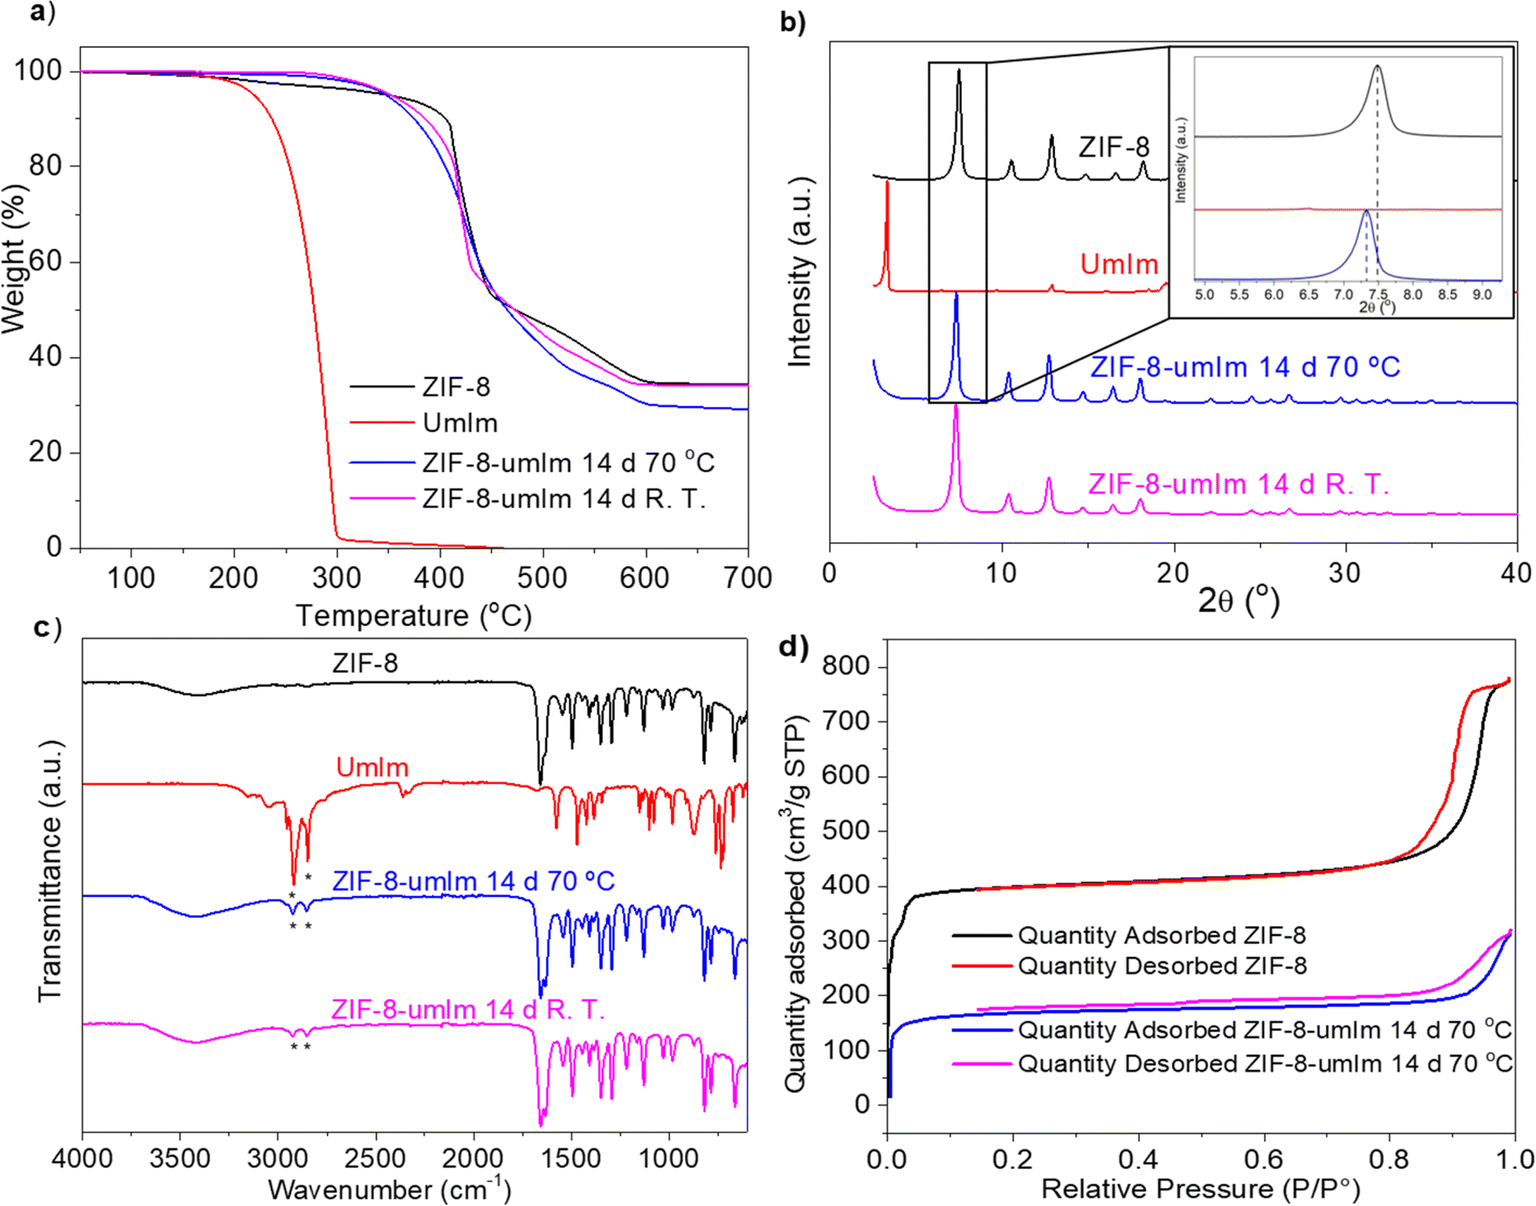 | ||
| Fig. 3 (a) Thermogravimetric analysis, (b) XRD patterns and (c) FTIR spectra of ZIF-8 synthesized by solvothermal method (black line), umIm (red), and modified ZIF-8 with umIm during the same exchange time but at different temperature, 70 °C and room temperature (blue and pink, respectively). (d) N2 adsorption–desorption isotherms at −196 °C for original ZIF-8 (red and black lines) and ZIF-8 after SALE treatment during 14 days and 70 °C (pink and blue lines). | ||
Fig. 3c shows the FTIR spectra of ZIF-8 synthesized through solvothermal method, umIm and two of the modified samples by ligand exchange prepared at the same time but different temperatures. After the exchange procedure, the corresponding samples revealed the presence of C–H bonds at 2850 and 2900 cm−1 characteristic of the aliphatic chains from umIm. This demonstrates that the exchange took place, showing a higher intensity in the sample carried out at 70 °C. The other features correspond to conventional ZIF-8.
N2 adsorption–desorption isotherms in Fig. 3d agree with a decrease in the BET specific surface area (SSA) after the SALE treatment from 1444 m2 g−1 of parent ZIF-8 to 573 m2 g−1. This is possibly associated to an impediment caused by the aliphatic chain from umIm that would also reveal that the ligand exchange was achieved.
SEM and Cs-corrected STEM data, in Fig. 4, revealed that no significant changes in size and shape occurred during the SALE process, maintaining the characteristic rombododecahedral shape of ZIF-8 and a particle size around 50 nm in both cases, before and after the exchange (Fig. 4a and b, respectively). This was confirmed when the Cs-corrected data using an annular dark field detector (ADF) was recorded. Fig. 4c–f display an overview of several particles and the correspondent high-magnification images before (Fig. 4c and 4d) and after exchange (Fig. 4e and 4f). From the STEM observation it was also corroborated that even after the exchange the morphology and size of the ZIF-8 nanoparticles were maintained, even reaching the observation of the MOF framework. Additional Cs-corrected STEM-ADF micrographs of ZIF-8-umIm have been included in Fig. S2† where the facets have been marked by dashed yellow lines to clarify its visualization.
 | ||
| Fig. 4 SEM and Cs-corrected STEM-ADF images of: (a) original ZIF-8 synthesized by solvothermal method and (b) ZIF-8-umIm from SALE method during 14 days at 70 °C. (c) Cs-corrected STEM-ADF image of the original ZIF-8 with its correspondent closer up observation (d). (e) Cs-corrected STEM-ADF image of the ZIF-8-umIm from SALE method during 14 days at 70 °C and the correspondent zoomed up micrograph (f). | ||
Elemental analysis was performed to calculate the variation of C and H in the sample after the SALE treatment, related to the ligand exchange between mIm and umIm. The amounts of C, H and N in original ZIF-8 and ZIF-8-umIm are collected in Table 1. The percentage of exchange was calculated focusing on the amount of C in relation to the total molecular weight of the molecule. First, the theoretical amount was calculated for samples where 0% of exchange (considering that all the ligand present in the sample is mIm from original ZIF-8) and 100% of exchange (considering that all mIm molecules present in original ZIF-8 were exchanged by umIm) occurs. Then the experimental value (calculated with data from Table 1) was extrapolated revealing a ca. 26% of exchange. This suggests that an important part of the parent ZIF-8 was modified, presumably affecting more the external part of the ZIF-8 crystals due to the difficulties of the bulkier ligand umIm to diffuse through the MOF structure. Another estimation of the ligand exchange percentage was calculated from the TGA data (Fig. 3a) to double-check the value obtained by elemental analysis. The theoretical amount of ZnO that would generate a TGA in air was calculated for ZIF-8, Zn(mIm)2 (0% ligand exchange), and for a supposed 100% ligand exchange, Zn(umIm)2. Considering 100 g of Zn(mIm)2 and Zn(umIm)2, the residue value (ZnO) that would be obtained in TGA in air would be 35.8 and 16.1 g, respectively. The obtained value measured for sample ZIF-8-umIm in TGA was 29.2 g ZnO. Extrapolating this value, the ligand exchange revealed a value of 34%, a quite similar value to the ca. 26% obtained by elemental analysis.
| C (%) | H (%) | N (%) | Sum (%) | |
|---|---|---|---|---|
| ZIF-8-umIm | 48.5 | 6.2 | 19.6 | 74.3 |
| ZIF-8 (theoretical in Zn(mIm)2) | 42.2 | 4.4 | 24.6 | 71.2 |
| ZIF-8-umIm (theoretical 100% exchange) | 66.2 | 9.9 | 11.0 | 87.1 |
13C NMR analysis performed with original ZIF-8 and in ZIF-8-umIm sample also support qualitatively the ligand exchange. Fig. 5 shows a shift in the main peaks corresponding to ZIF-8 in sample ZIF-8-umIm from 15.2 to 12.9 ppm (related to the methyl group), from 125.6 to 123.4 ppm (to the two equivalent double-bonded carbons in the ligand ring) and from 152.6 to 150.3 ppm (to the ring carbon bonded to the two nitrogens). Moreover, Fig. S3† shows simulated 13C NMR spectrum of umIm, where the main peaks of the C corresponding to the aliphatic chain appear at 29.4, 22.6 and 14.0 ppm. They could be related to the peaks at 28.3 and 21.3 ppm present in the sample ZIF-8-umIm but slightly shifted (from 29.4 to 28.3 ppm and from 22.63 to 21.3) due to the interaction with Zn atoms from the ZIF-8 structure. The appearance of these peaks would also confirm the success of the SALE treatment and the ligand exchange between umIm and the mIm present in ZIF-8, in agreement with the previous TGA, XRD, FTIR and N2 adsorption evidences.
 | ||
| Fig. 5 13C NMR spectra of original ZIF-8 (black) and sample after SALE treatment (red). | ||
3.2 MMM characterization
Once the SALE sample treated during 14 days and at 70 °C was characterized, it was applied to produce PIM-1 MMMs. Indeed, membranes with and without filler were first analyzed by thermogravimetry (Fig. 6a). The final values at 700 °C correspond to the ZnO produced because of the presence of Zn from the filler (10 wt% loading) and the performance of the TGA in air atmosphere. Membrane including ZIF-8 as filler revealed a higher remain of ZnO than that with ZIF-8-umIm. This difference is due to the higher molar weight of the MOF after ligand exchange (with a higher amount of organic part), considering 26% of ligand substitution and therefore an increase of molar weight from 227.55 g mol−1 in the case of ZIF-8 to 300.5 g mol−1 in the case of ZIF-8-umIm. Moreover, the membrane with ZIF-8-umIm revealed a slightly higher thermal stability than that with ZIF-8, which suggests a higher interaction between ZIF-8-umIm particles and PIM-1 matrix. Fig. S4† shows the derivative curves corresponding to Fig. 6a, where the temperatures marked with an asterisk (632 °C and 647 °C for ZIF-8 and ZIF-8-umIm, respectively) indicate that ZIF-8-umIm is about 15 °C more stable than the original ZIF-8.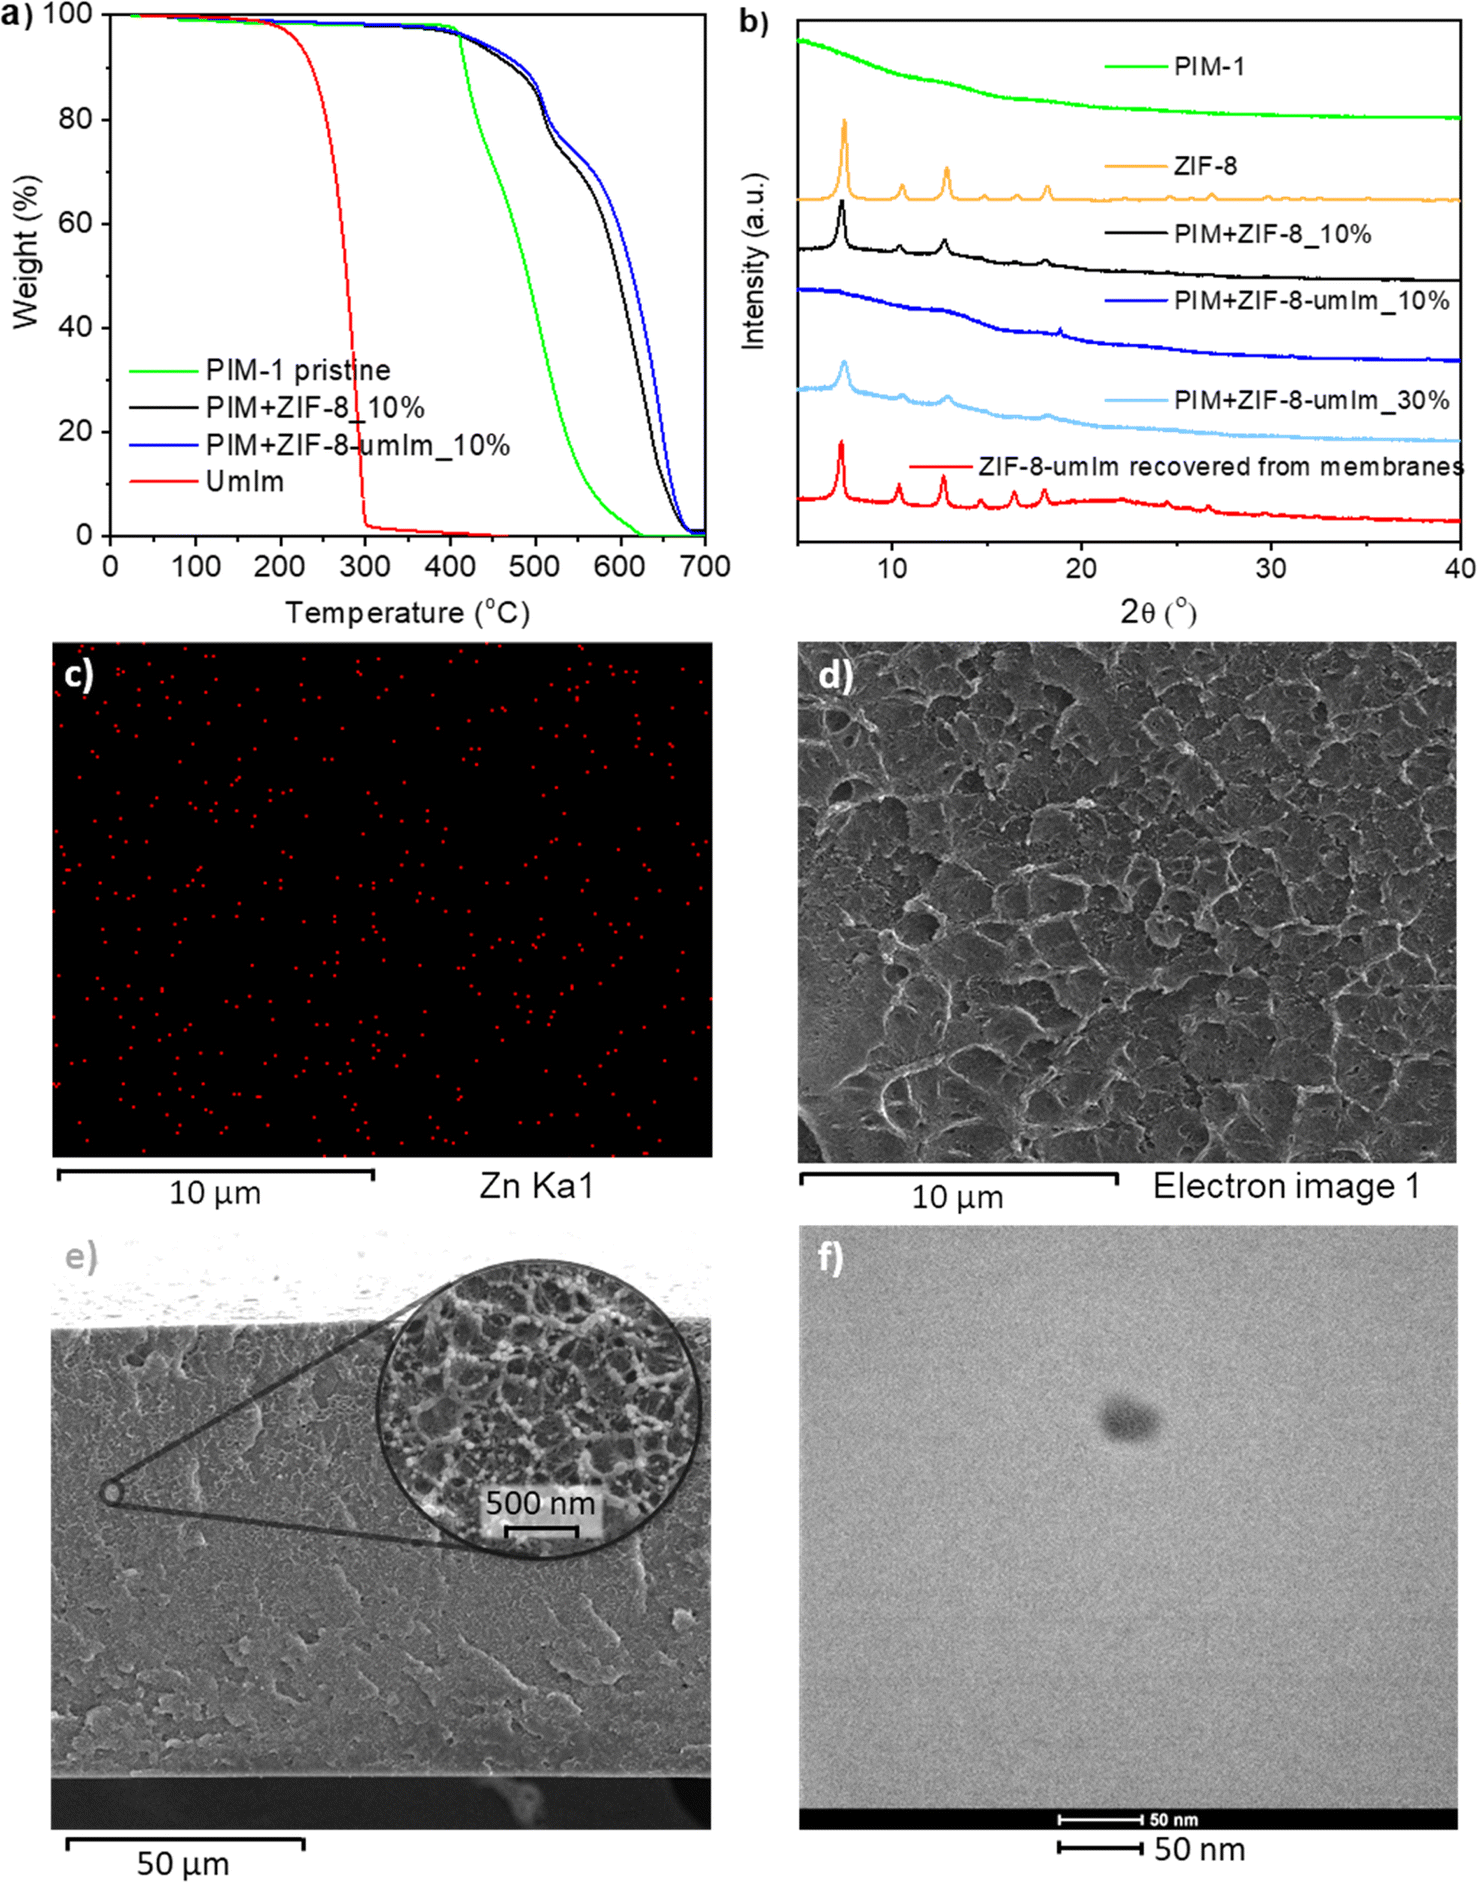 | ||
| Fig. 6 (a) TGA curves of 2-undecylimidazole (red) and membranes of pristine PIM-1 (green), PIM-1 with ZIF-8 as filler (black) and PIM-1 with ZIF-8-umIm as filler (blue); (b) XRD patterns of ZIF-8 powder (orange) and membranes of pristine PIM-1 (green), PIM-1 with ZIF-8 as filler (black), PIM-1 with 10 and 30 wt% of ZIF-8-umIm as filler (dark and light blue, respectively) and ZIF-8-umIm filler after recovering it from membranes; (c) EDS mapping showing the presence of Zn (red dots) from the filler in a cross-section image of a membrane with ZIF-8-umIm as filler (10 wt%); (d) SEM image used to measure the EDS in (c); (e) SEM image of an entire cross-section of a ZIF-8-umIm (10 wt%) membrane with its corresponding zoomed-up area; (f) a cross-section TEM image made on a microtomy cut of a ZIF-8-umIm membrane (15 wt% loading). | ||
XRD in Fig. 6b shows that the membrane with original ZIF-8 (10 wt% loading) has the main peaks corresponding to the filler (black line). However, when using ZIF-8-umIm as a filler at the same 10 wt% loading, the peaks of the ZIF are not so clearly observed (dark blue line). This suggests a higher compatibility between the filler and the polymer chains resulting in well dispersed ZIF nanoparticles within the polymer matrix and therefore shielding the signal in XRD measurements. Other studies have also reported a shielding effect when a compatible filler is well wrapped along the polymeric matrix. Ma et al. analyzed XRD in PIM-6FDA-OH/ZIF-8 MMMs and ZIF-8 peaks were hardly visible at 13 wt% loading,62 while Bushell et al. just included an XRD pattern of sample with 43 vol% ZIF-8 and with a magnification by 5.47 At the same loading (10 wt%), Cao et al. did not find any COF signal when embedded in PVAm.63 In any event, to confirm that the previous observation was not due to a loss of filler crystallinity, the presence of the ZIF was evidenced as follows. The loading of ZIF-8-umIm in membranes was increased up to 30 wt% to attempt to obtain a clear XRD signal of the ZIF, which was confirmed with the measurements depicted in Fig. 6b (light blue line). It is worth mentioning that this 30 wt% membrane was not suitable for gas separation due to the effect of filler agglomeration damaging its separation ability.
Additionally, in order to check that ZIF-8-umIm did not suffer any alteration when embedded in the membrane, the filler was recovered from 10 to 15 wt% membranes and submitted to further characterization. The corresponding XRD pattern in Fig. 6b (red line) shows the main peaks of the filler, which confirms that the filler maintained its crystallinity. The alteration in the base line is due to some remaining polymer surrounding the ZIF. This recovery procedure also provides insight into the potential for recycling the fillers from membranes without compromising any of their characteristics, as it was already reported by Hasan et al. with MMMs made of Pebax® 1657 and ZIF-94 as filler.64
EDS mapping was also performed in a membrane with ZIF-8-umIm (10 wt%) to analyze the presence of the filler along the membrane. Red dots in Fig. 6c demonstrate the presence of Zn atoms from the filler, while the main atoms of the MOF, Zn (red), O (blue) and C (green) can be seen in Fig. S5.†Fig. 6d shows the SEM image used to perform EDS mapping. Fig. 6e was included to show the thickness of the membrane and the structure in a zoomed-up area, where small spheres that could remind the filler size and shape, can be visualized. To compare its structure with a pristine PIM-1 membrane, Fig. S6† with a cross-section SEM image has been incorporated in the S.I. Its corresponding zoomed-up image reveals the typical structures of PIM-1 (consistent with images shown in bibliography47), with similar small spheres to the ones visualized in ZIF-8-umIm membrane. The similarity in size and shape between both structures make it difficult to differentiate by SEM polymeric structures and filler particles. For this reason and to avoid speculation, EDS was performed in ZIF-8-umIm membrane revealing the presence of Zn atoms coming from the ZIF particles. Comparing with other studies concerning PIM-1 in MMMs, they neither present clearly images of the filler unless it is larger than 250 nm of particle size51,65 or it is agglomerated.66 A TEM image of a ZIF-8-umIm membrane slice, which were prepared by ultramicrotomy is shown in Fig. 6f. As the cut thickness was 60 nm, the 15 wt% loading membrane was chosen to increase the probability of finding filler nanoparticles in such a small volume of membrane. Even being a high loading and thus the probability of agglomeration was higher, individual particles of filler could be seen (as shown in Fig. 6f). Considering the thickness of the membrane and the severe beam damage suffered by the polymer, images of the MOF introduced into the polymer could not be recorded with higher quality.
Water contact angle was performed to elucidate the expected changes in MMM hydrophobicity when adding as filler the original ZIF-8 as compared to the modified one (Fig. 7). The average of six measurements (in different areas of the membrane) provided contact angle values of 90 (±1)°, 92 (±1)° and 97 (±2)°, for pristine PIM-1 membrane, PIM-1 membrane with original ZIF-8 as filler and with ZIF-8-umIm as filler, respectively. The incorporation of hydrophobic ZIF-8 as filler in a PIM-1 membrane increased the membrane WCA from 90° (measured in a PIM-1 pristine membrane) to 92° (measured in PIM-1 + ZIF-8, 10 wt%). Adding the modified version of ZIF-8 (ZIF-8-umIm) as filler in PIM-1 membrane, the hydrophobicity increased in terms of WCA from 92° to 97°, revealing the effect of the aliphatic chain of umIm. The increase in hydrophobicity was not that high due to the low loading and the well dispersion of embedded fillers producing a small, but consistent, effect on the hydrophobicity of the membrane.
 | ||
| Fig. 7 Contact angle images of a water drop of 4 μL in: (a) pristine PIM-1 membrane, (b) PIM + ZIF-8 membrane and (c) PIM + ZIF-8-umIm membrane. | ||
3.3 Gas separation
Membranes were tested for the separation of equimolar CO2/N2 mixtures at pressure differences of 2 bar (3 and 1 bar in the feed and permeate sides, respectively). Fig. 8a collects permeabilities of CO2 and N2 and CO2/N2 selectivity of pristine PIM and MMMs with ZIF-8-umIm at different loadings (5, 10 and 15 wt%). Pristine PIM-1 exhibited around 11000 Barrer of permeability of CO2 and almost 14 of CO2/N2 selectivity. At 5 wt% loading, PIM-1 with ZIF-8-umIm enhanced the permeability of CO2 reaching a maximum value of ca. 15000 Barrer and slightly increased the selectivity above 14. At 10 wt% loading, both permeability of CO2 and selectivity slightly increased up to 16600 Barrer and 15, respectively, while increasing the loading to 15 wt% both parameters slightly decrease to 16000 Barrer and almost 15 of CO2/N2 selectivity. The remarkable improvement achieved with ZIF-8-umIm suggests that the compatibility between PIM-1 and the filler was improved. The higher hydrophobicity of ZIF-8-umIm (as illustrated in Fig. 7) allows for a better dispersion of the ZIF within the PIM-1 matrix and thus preventing ZIF agglomeration. Even a low loading (5 wt%) improve the performance of the membrane where the well-dispersed ZIF particles allow the passage of gas molecules through the pores of the ZIF increasing the gas permeability and slightly enhancing the selectivity due to sieving effects that lead to selective diffusion through the ZIF nanochannels, in turn enhanced by the narrowing of the microporosity in agreement with the decrease of the BET SSA shown above for ZIF-8-umIm. This effect continues improving the performance of the membrane as the loading increase to 10 wt% but starts to decrease at 15 wt% loading. This suggest that above this loading, filler starts to agglomerate blocking the interconnection of pore channels and thus decreasing the permeability and the sieving effect (translate in a decrease of selectivity).
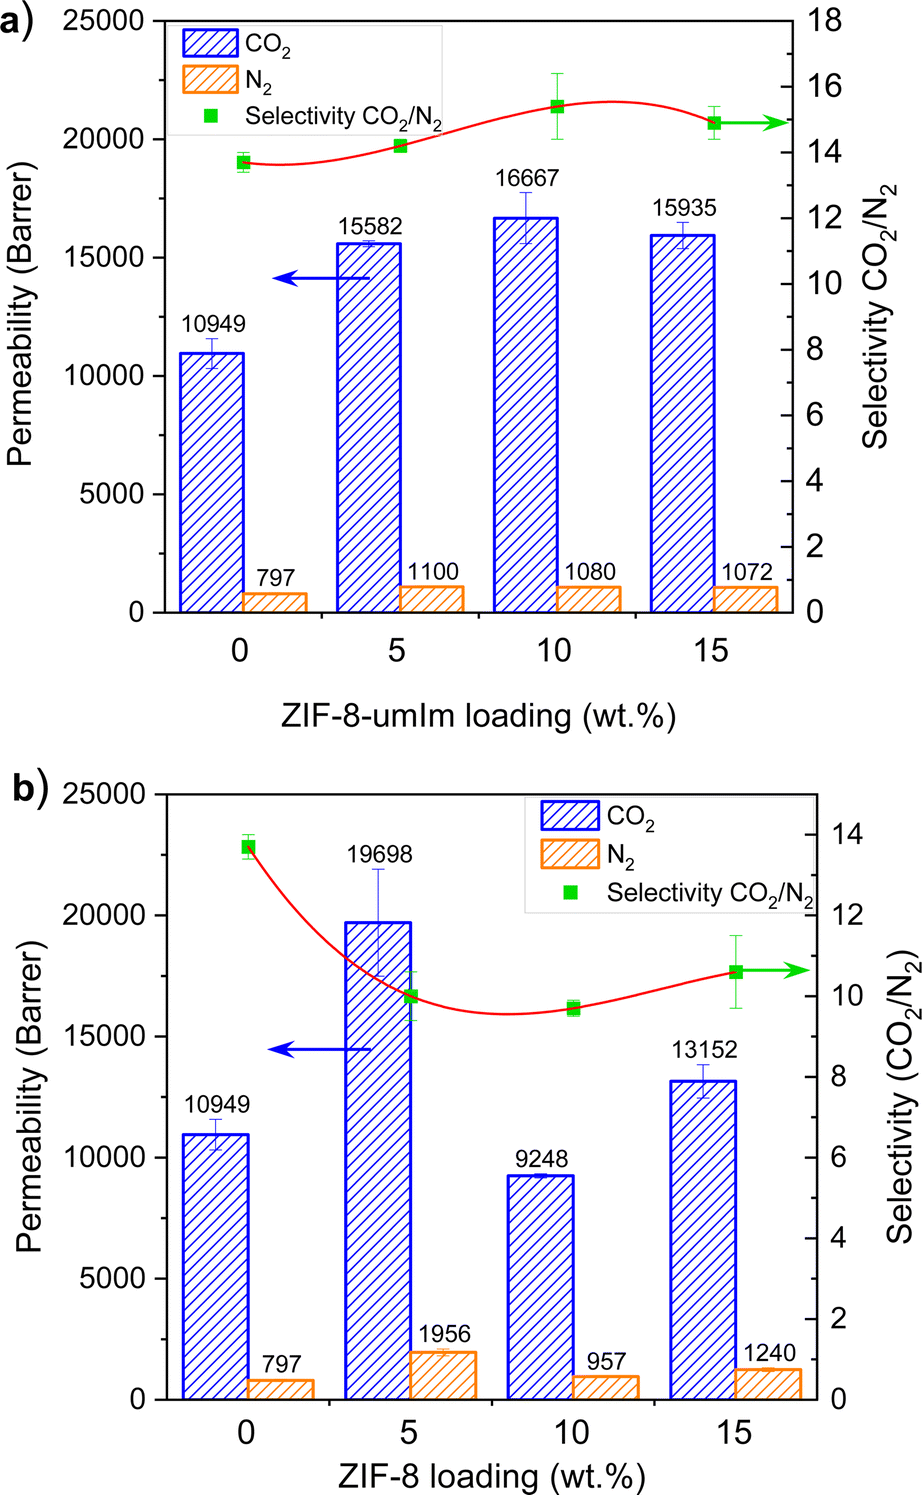 | ||
| Fig. 8 Gas separation performance of PIM-1 membranes with different loadings of (a) ZIF-8-umIm and (b) ZIF-8 for 50/50 CO2/N2 mixture, measured at 3 bar feed pressure and 35 °C. The selectivity lines are a guide to the eye. | ||
However, when adding ZIF-8 as filler (shown in Fig. 8b), a 5 wt% loading gave rise to almost 20000 Barrer of permeability of CO2 but the selectivity dropped to ∼10. Increasing the ZIF-8 loading to 10 wt% both permeability of CO2 and CO2/N2 selectivity decreased to 9000 Barrer and below 10, respectively, lower values than those achieved with ZIF-8-umIm at the same loading. Then, at 15 wt% filler loading, the permeability of CO2 increased to 13000 Barrer with a similar value of selectivity. These results allow us to infer that when ZIF-8 is used as filler the poor filler-polymer compatibility results in detrimental gas separation performance. When adding a low loading (5 wt%), permeability increases considerably, which can be associated to a worse filler-polymer interaction creating regions of bad adhesion and interfacial voids that allow gas molecules going through them, besides going through the pores of the ZIF-8 and polymer channels. As the ZIF-8 loading increases, agglomerates are more frequent, resulting in a reduction of the effective surface area of the ZIF that is available for interaction with the polymer (and hence for selective molecular transport) with a higher probability of filler particles uncoated with polymer. As filler agglomeration increase (as happened at 15 wt% loading), more interfacial voids favor the non-selective transport of gas molecules. In these conditions, the ZIF microporosity is by-passed depriving MMMs of the positive effect of the filler, not only in terms of permeance but also of separation selectivity. In this situation, the modification of the filler, creating ZIF-8-umIm, improves the filler-polymer interaction and, in consequence, the MMM separation performance, obtaining at 10 wt% loading a highest CO2/N2 selectivity of 15.4 at 16667 Barrer of CO2 permeability (see Fig. 8a). A similar tendency was observed in other study with PIM-1 and ZIF-8.47 CO2 permeabilities slightly increase when adding 11 vol% filler (from 4400 to 4800 Barrer), then decrease when adding 28 vol% (4300 Barrer), increase again when 36 vol% is used (6800 Barrer) and finally slightly decrease when reaching 43 vol% (6300 Barrer). Selectivitiy values also follows a similar trend: 24, 19, 22, 18, 18, respectively. Although the tendency is similar, data have to be carefully compared to ours because synthesis conditions and gas measurements procedures are not the same and even the filler loading that we used (0–15 wt%) is not in the same range.
ZIF-8-umIm MMMs at different loadings (2.5, 5, 10 and 15 wt%) were also tested for CO2/CH4 mixtures at 3 bar feed pressure. Permeabilities of CO2 and CH4 and CO2/CH4 selectivity are collected in Fig. 9. A small amount of the modified filler already produced a positive effect, increasing both CO2 permeability and gas pair selectivity as compared to pristine PIM-1, reaching the values of ∼13000 Barrer and 10 (far below the value for CO2/N2 of ca. 15 due to the high solubility of CH4 in PIM-1 as compared to N2 (ref. 67)), respectively. This effect suggests that the well dispersion of the modified filler follows an ideal gas transport as Moore et al. defined in 2005,68 where both permeability and selectivity increase with the added filler. The adsorption and molecular sieving effect of the filler allow the passage of gas molecules through its pores improving both permeability and selectivity. As the loading of filler increases, it may start to agglomerate creating small defects that cause an increase in gas permeability at expenses of losing selectivity. Above 15 wt% agglomerates became more frequent and block or by-pass ZIF channels, definitively worsening the membrane separation performance, as discussed in more detail for CO2/N2.
 | ||
| Fig. 9 Gas separation performance of PIM-1 membranes with different loadings of ZIF-8-umIm for 50/50 CO2/CH4, measured at 3 bar feed pressure and 35 °C. The selectivity lines are a guide to the eye. | ||
Maxwell model was preliminarily applied to gain insight into the performance of the membranes and the influence of the modified ZIF-8 as compared to the parent filler. The effective permeability of a MMM, PMMM, depends on the volume fraction of the dispersed phase, Φd, and the permeabilities of the dispersed and continuous phases, Pd and Pc, respectively, according to Maxwell model:69
 | (1) |
The volume fraction of the dispersed phase, Φd, was calculated considering 0.93 and 1.1 g cm−3 as densities of ZIF and PIM-1,47 respectively, and a 5 wt% filler loading. Due to the agglomeration effect that occur more often at higher loadings, a low loading was used for the calculations to be closer to the ideal membrane morphology followed in Maxwell model. Fig. S7† shows the theoretical PMMM/Pcversus Pd of Maxwell model prediction which achieve a maximum value of 1.19 for this volume fraction. Experimental PMMM/Pc values of ZIF-8 and ZIF-8-umIm (1.80 and 1.42, respectively) are also represented, being higher than the maximum predicted. These results suggest that our experimental values do not follow Maxwell model probably because it does not consider parameters such as particle dispersion, filler shape and size distribution and third phase creation,70 among others. However, Maxwell prediction gave an estimation of a closer to the ideal morphology of ZIF-8-umIm membranes than the ones with ZIF-8 as filler, supporting the enhanced compatibility between filler and polymer achieved by our modified MOF.
Finally, Fig. 10 depicts that the performance of membranes, particularly those containing modified ZIF-8, overcome the Robeson upper bound from 2008 due to an enhanced gas permeability and slightly increased in selectivity. However, MMMs prepared with ZIF-8 shows a modest improvement as compared to PIM-1 due to the loss of selectivity induced by the agglomeration of the ZIF. In addition, it is worth discussing the positive effect of ZIF-8-umIm on the CO2/N2 separation. The small pore size of ZIF-8 (0.34 nm) makes possible to distinguish between the two molecules favoring the smallest one (CO2 and N2 have kinetic diameters of 0.33 and 0.364 nm, respectively). Upon achieving the mentioned ca. 26% of ligand exchange, the ZIF-8 structure was maintained with a noticeable decrease in the BET SSA (from 1444 to 573 m2 g−1) compatible with a narrowing of its microposority. This would hinder the diffusion of the larger N2 molecules in agreement with the enhancements shown for the CO2/N2 separation selectivities achieved at the three studied MOF loadings, the highest value being 15.4 (12% higher than the value of 13.7 corresponding to bare PIM-1) at 10 wt% ZIF-8-umIm loading (16667 Barrer of CO2 permeability, 52% higher than the value of 10949 Barrer of pure PIM-1). Selected data of permeability of CO2 and CO2/N2 selectivity from the bibliography, closely related to our work, are also collected in Fig. 10. Membranes made of PIM-1, 6FDA-DAM and ZIF-8,71 PIM-1,72 PIM-PI-EA73 and CPIM-1 (ref. 74) are numbered from 1 to 4, respectively. Our results not only depict a clear improvement of the MMM performance over that of the bare polymer but are also placed above the 2008 Robeson upper bound.
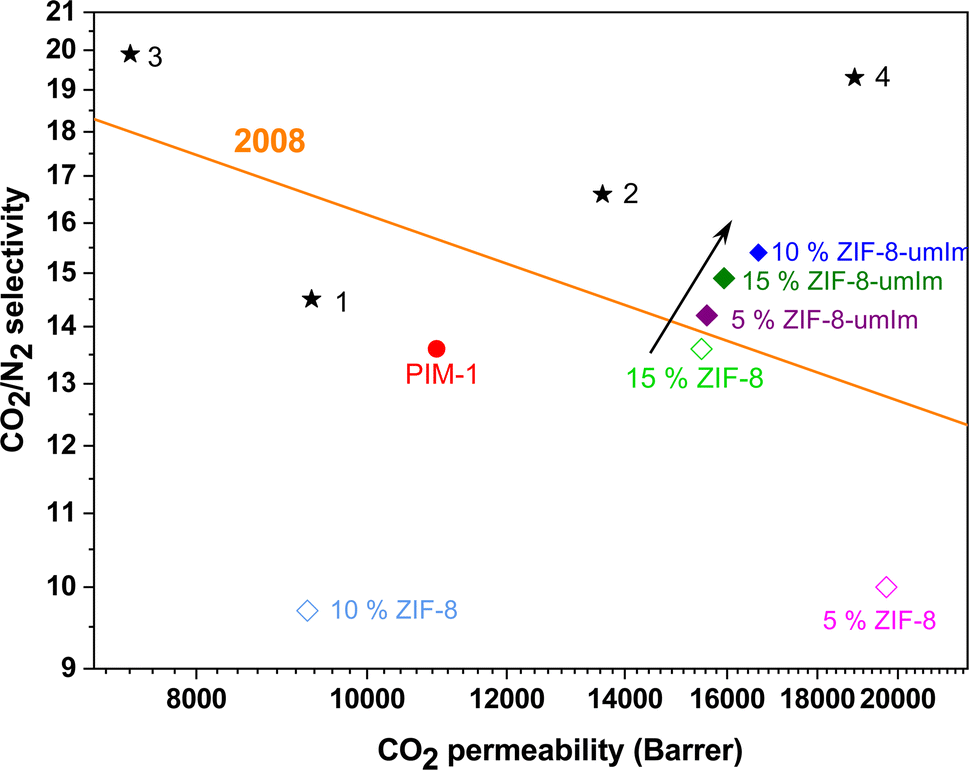 | ||
| Fig. 10 Robeson6,7 upper bound from 2008 (orange line) for CO2/N2 separation, comparison with MMMs prepared in this work for both original ZIF-8 and ZIF-8-umIm and selected data from bibliography (stars 1–4: PIM-1, 6FDA-DAM and ZIF-8,71 PIM-1,72 PIM-PI-EA73 and CPIM- 1,74 respectively). | ||
4. Conclusion
In conclusion, evidenced by the different characterizations done of TGA, XRD, FTIR, NMR, N2 adsorption, Cs-corrected STEM and WCA, the introduction of a novel modification in ZIF-8 based on the ligand exchange with 2-undecylimidazolate has proven to be a significant advancement in enhancing the filler-polymer interaction characteristics for MMMs. This modification has effectively addressed compatibility issues when incorporating the modified ZIF-8 into polymer PIM-1 for MMMs applications. The comparative assessment between MMMs containing the modified ZIF-8 and the original ZIF-8 revealed substantial improvements in gas separation performance.The resulting membranes presented in this study exceed the Robeson upper bound of 2008, highlighting the remarkable potential of ZIF-8-umIm as an exceptional candidate for enhancing gas separation processes. The achievement of improved hydrophobicity, narrowed porosity and amplified filler-polymer interaction emphasizes the efficacy of this modification strategy, also in agreement with the thermal stabilization reached, the XRD characterization and the gas separation results achieved. Notably, the exceptional permeability reached, particularly in CO2/N2 separation (but also acceptable results in CO2/CH4 separation), demonstrates the new capabilities of the PIM-1 with ZIF-8-umIm in MMMs, also in line with the preliminary Maxwell modeling carried out.
These findings emphasize the successful implementation of 2-undecylimidazolate as a strategic modifier, resulting in enhanced compatibility and superior performance in MMMs. The path of this research opens new routes for advanced gas separation applications, offering an exciting framework for future studies within the field of modified MOFs and MOF based MMMs with the possibility of extrapolating to other MOFs (particularly ZIFs) and other polymers.
Conflicts of interest
There are no conflicts to declare.Acknowledgements
This research acknowledges grant TED2021-130621B-C41 by Spanish Agencia Estatal de Investigación (AEI) and Ministerio de Ciencia e Innovación (MCIN) and the European Union-NextGeneration EU. Also, grants PID2019-104009RB-I00 and PID2022-138582OB-I00, funded by AEI-MCIN, Spain, are acknowledged. In addition, financial support from the Aragón Government (T68_23R and M. P.-M. PhD grant) is thanked. M. Yahia acknowledges the Spanish Ministerio de Universidades and the European Union-NextGenerationEU Fund for funding through the María Zambrano programme. J. M. Luque-Alled acknowledges the Spanish Ministerio de Universidades and the European Union-NextGenerationEU Fund for funding through the Margarita Salas and Juan de la Cierva programmes. A. Mayoral acknowledges the Spanish Ministry of Science through the Ramon y Cajal programme (RYC2018-024561-I) and to regional government of Aragon (DGA E13_23R). Authors acknowledge Servicio General de Apoyo a la Investigación-SAI and the use of instrumentation as well as the technical advice provided by the National Facility ELECMI ICTS, node Laboratorio de Microscopias Avanzadas, both at Universidad de Zaragoza.References
- W. J. Koros and C. Zhang, Nat. Mater., 2017, 16, 289–297 CrossRef CAS.
- M. Galizia, W. S. Chi, Z. P. Smith, T. C. Merkel, R. W. Baker and B. D. Freeman, Macromolecules, 2017, 50, 7809–7843 CrossRef CAS.
- C. Z. Liang, T.-S. Chung and J.-Y. Lai, Prog. Polym. Sci., 2019, 97, 101141 CrossRef CAS.
- P. Bernardo and G. Clarizia, Chem. Eng. Trans., 2013, 32, 1999–2004 Search PubMed.
- R. Castro-Muñoz, V. Martin-Gil, M. Z. Ahmad and V. Fíla, Chem. Eng. Commun., 2018, 205, 161–196 CrossRef.
- E. Ricci and M. De Angelis, Membranes, 2019, 9, 8 CrossRef PubMed.
- P. M. Budd and N. B. McKeown, Polym. Chem., 2010, 1, 63–68 RSC.
- R. Semino, N. A. Ramsahye, A. Ghoufi and G. Maurin, Microporous Mesoporous Mater., 2017, 254, 184–191 CrossRef CAS.
- S. He, B. Zhu, S. Li, Y. Zhang, X. Jiang, C. Hon Lau and L. Shao, Sep. Purif. Technol., 2022, 284, 120277 CrossRef CAS.
- R. Swaidan, B. Ghanem and I. Pinnau, ACS Macro Lett., 2015, 4, 947–951 CrossRef CAS PubMed.
- L. M. Robeson, M. E. Dose, B. D. Freeman and D. R. Paul, J. Membr. Sci., 2017, 525, 18–24 CrossRef CAS.
- Y. Wang, B. S. Ghanem, Y. Han and I. Pinnau, Curr. Opin. Chem. Eng., 2022, 35, 100755 CrossRef.
- Y. Wang, B. S. Ghanem, Z. Ali, K. Hazazi, Y. Han and I. Pinnau, Small Struct., 2021, 2, 2100049 CrossRef CAS.
- K. Althumayri, W. Harrison, Y. Shin, J. Gardiner, C. Casiraghi, P. Budd, P. Bernardo, G. Clarizia and J. Jansen, Philos. Trans. R. Soc., A, 2016, 374, 20150031 CrossRef PubMed.
- T. Ghanbari, F. Abnisa, W. Mohd and W. Daud, Sci. Total Environ., 2020, 707, 135090 CrossRef CAS PubMed.
- O. K. Farha, A. Özgür Yazaydın, I. Eryazici, C. D. Malliakas, B. G. Hauser, M. G. Kanatzidis, S. T. Nguyen, R. Q. Snurr and J. T. Hupp, Nat. Chem., 2010, 2, 944–948 CrossRef CAS PubMed.
- H. Li, M. Eddaoudi, M. O'Keeffe and O. M. Yaghi, Nature, 1999, 402, 276–279 CrossRef CAS.
- Z. Ji, H. Wang, S. Canossa, S. Wuttke and O. M. Yaghi, Adv. Funct. Mater., 2020, 30, 2000238 CrossRef CAS.
- L. Paseta, E. Simón-Gaudó, F. Gracia-Gorría and J. Coronas, Chem. Eng. J., 2016, 292, 28–34 CrossRef CAS.
- P. Horcajada, T. Chalati, C. Serre, B. Gillet, C. Sebrie, T. Baati, J. F. Eubank, D. Heurtaux, P. Clayette, C. Kreuz, J.-S. Chang, Y. K. Hwang, V. Marsaud, P.-N. Bories, L. Cynober, S. Gil, G. Férey, P. Couvreur and R. Gref, Nat. Mater., 2010, 9, 172–178 CrossRef CAS PubMed.
- Q. Wang and D. Astruc, Chem. Rev., 2020, 120, 1438–1511 CrossRef CAS PubMed.
- H. Li, L. Li, R.-B. Lin, W. Zhou, Z. Zhang, S. Xiang and B. Chen, EnergyChem, 2019, 1, 100006 CrossRef.
- J. L. C. Rowsell and O. M. Yaghi, Angew. Chem., 2005, 117, 4748–4758 CrossRef.
- Ma. J. C. Ordonez, K. J. Balkus, J. P. Ferraris and I. H. Musselman, J. Membr. Sci., 2010, 361, 28–37 CrossRef CAS.
- E. E. Sann, Y. Pan, Z. Gao, S. Zhan and F. Xia, Sep. Purif. Technol., 2018, 206, 186–191 CrossRef CAS.
- Z. Lai, Curr. Opin. Chem. Eng., 2018, 20, 78–85 CrossRef.
- N. Liédana, A. Galve, C. Rubio, C. Téllez and J. Coronas, ACS Appl. Mater. Interfaces, 2012, 4, 5016–5021 CrossRef PubMed.
- A. Noguera-Díaz, N. Bimbo, L. T. Holyfield, I. Y. Ahmet, V. P. Ting and T. J. Mays, Colloids Surf., A, 2016, 496, 77–85 CrossRef.
- W. Xue, Q. Zhou, F. Li and B. S. Ondon, J. Power Sources, 2019, 423, 9–17 CrossRef CAS.
- A. Paul, I. K. Banga, S. Muthukumar and S. Prasad, ACS Omega, 2022, 7, 26993–27003 CrossRef CAS PubMed.
- W. Yu, J. Sun, F. Liu, S. Yu, J. Hu, Y. Zhao, X. Wang and X. Liu, ACS Appl. Mater. Interfaces, 2020, 12, 40002–40012 CrossRef CAS PubMed.
- H. Xie, X. Liu, Z. Huang, L. Xu, R. Bai, F. He, M. Wang, L. Han, Z. Bao, Y. Wu, C. Xie and Y. Gong, Cancers, 2022, 14, 3935 CrossRef CAS PubMed.
- J. M. Luque-Alled, A. W. Ameen, M. Alberto, M. Tamaddondar, A. B. Foster, P. M. Budd, A. Vijayaraghavan and P. Gorgojo, J. Membr. Sci., 2021, 623, 118902 CrossRef CAS.
- N. Tien-Binh, D. Rodrigue and S. Kaliaguine, J. Membr. Sci., 2018, 548, 429–438 CrossRef CAS.
- M. M. H. Shah Buddin and A. L. Ahmad, J. CO2 Util., 2021, 51, 101616 CrossRef CAS.
- Y. Song, M. He, J. Zhao and W. Jin, Sep. Purif. Technol., 2021, 270, 118722 CrossRef CAS.
- Y. Ban, Z. Li, Y. Li, Y. Peng, H. Jin, W. Jiao, A. Guo, P. Wang, Q. Yang, C. Zhong and W. Yang, Angew. Chem., Int. Ed., 2015, 54, 15483–15487 CrossRef CAS PubMed.
- Z. Wang, D. Wang, S. Zhang, L. Hu and J. Jin, Adv. Mater., 2016, 28, 3399–3405 CrossRef CAS PubMed.
- L. Dong, M. Chen, X. Wu, D. Shi, W. Dong, H. Zhang and C. Zhang, New J. Chem., 2016, 40, 9148–9159 RSC.
- M. Schröder, Functional Metal–Organic Frameworks: Gas Storage, Separation and Catalysis, Springer, 2010 Search PubMed.
- O. Karagiaridi, M. B. Lalonde, W. Bury, A. A. Sarjeant, O. K. Farha and J. T. Hupp, J. Am. Chem. Soc., 2012, 134, 18790–18796 CrossRef CAS PubMed.
- O. Karagiaridi, W. Bury, A. A. Sarjeant, C. L. Stern, O. K. Farha and J. T. Hupp, Chem. Sci., 2012, 3, 3256 RSC.
- C.-W. Tsai, J. W. Niemantsverdriet and E. H. G. Langner, Microporous Mesoporous Mater., 2018, 262, 98–105 CrossRef CAS.
- C. J. Stephenson, J. T. Hupp and O. K. Farha, Inorg. Chem., 2016, 55, 1361–1363 CrossRef CAS PubMed.
- X. Yuan, H. Yu, S. Xu, G. Huo, C. J. Cornelius, Y. Fan and N. Li, J. Membr. Sci., 2022, 644, 120071 CrossRef CAS.
- L. M. Robeson, J. Membr. Sci., 2008, 320, 390–400 CrossRef CAS.
- A. F. Bushell, M. P. Attfield, C. R. Mason, P. M. Budd, Y. Yampolskii, L. Starannikova, A. Rebrov, F. Bazzarelli, P. Bernardo, J. Carolus Jansen, M. Lanč, K. Friess, V. Shantarovich, V. Gustov and V. Isaeva, J. Membr. Sci., 2013, 427, 48–62 CrossRef CAS.
- V. Nafisi and M.-B. Hägg, J. Membr. Sci., 2014, 459, 244–255 CrossRef CAS.
- M. L. Jue, C. S. McKay, B. A. McCool, M. G. Finn and R. P. Lively, Macromolecules, 2015, 48, 5780–5790 CrossRef CAS.
- J. M. Luque-Alled, M. Tamaddondar, A. B. Foster, P. M. Budd and P. Gorgojo, ACS Appl. Mater. Interfaces, 2021, 13, 55517–55533 CrossRef CAS PubMed.
- M. Yahia, Q. N. Phan Le, N. Ismail, M. Essalhi, O. Sundman, A. Rahimpour, M. M. Dal-Cin and N. Tavajohi, Microporous Mesoporous Mater., 2021, 312, 110761 CrossRef CAS.
- J. Sánchez-Laínez, B. Zornoza, S. Friebe, J. Caro, S. Cao, A. Sabetghadam, B. Seoane, J. Gascon, F. Kapteijn, C. Le Guillouzer, G. Clet, M. Daturi, C. Téllez and J. Coronas, J. Membr. Sci., 2016, 515, 45–53 CrossRef.
- X. Wu, W. Liu, H. Wu, X. Zong, L. Yang, Y. Wu, Y. Ren, C. Shi, S. Wang and Z. Jiang, J. Membr. Sci., 2018, 548, 309–318 CrossRef CAS.
- M. Z. Ahmad, R. Castro-Muñoz and P. M. Budd, Nanoscale, 2020, 12, 23333–23370 RSC.
- B. Hosseini Monjezi, K. Kutonova, M. Tsotsalas, S. Henke and A. Knebel, Angew. Chem., Int. Ed., 2021, 60, 15153–15164 CrossRef CAS PubMed.
- M. Benzaqui, R. Semino, N. Menguy, F. Carn, T. Kundu, J.-M. Guigner, N. B. McKeown, K. J. Msayib, M. Carta, R. Malpass-Evans, C. Le Guillouzer, G. Clet, N. A. Ramsahye, C. Serre, G. Maurin and N. Steunou, ACS Appl. Mater. Interfaces, 2016, 8, 27311–27321 CrossRef CAS PubMed.
- M. Alberto, R. Bhavsar, J. M. Luque-Alled, A. Vijayaraghavan, P. M. Budd and P. Gorgojo, J. Membr. Sci., 2018, 563, 513–520 CrossRef CAS.
- Z. Wang, W. Wang, T. Zeng, D. Ma, P. Zhang, S. Zhao, L. Yang, X. Zou and G. Zhu, Adv. Mater., 2022, 34, 2104606 CrossRef CAS PubMed.
- M. Pérez-Miana, J. U. Reséndiz-Ordóñez and J. Coronas, Microporous Mesoporous Mater., 2021, 328, 111487 CrossRef.
- M. Yahia, L. A. Lozano, J. M. Zamaro, C. Téllez and J. Coronas, Sep. Purif. Technol., 2024, 330, 125558 CrossRef CAS.
- J. Sánchez-Laínez, A. Veiga, B. Zornoza, S. R. G. Balestra, S. Hamad, A. R. Ruiz-Salvador, S. Calero, C. Téllez and J. Coronas, J. Mater. Chem. A, 2017, 5, 25601–25608 RSC.
- X. Ma, R. J. Swaidan, Y. Wang, C. Hsiung, Y. Han and I. Pinnau, ACS Appl. Nano Mater., 2018, 1, 3541–3547 CrossRef CAS.
- X. Cao, Z. Qiao, Z. Wang, S. Zhao, P. Li, J. Wang and S. Wang, Int. J. Hydrogen Energy, 2016, 41, 9167–9174 CrossRef CAS.
- M. Rafiul Hasan, A. Moriones, M. Malankowska and J. Coronas, Sep. Purif. Technol., 2023, 304, 122355 CrossRef CAS.
- J. Ahn, W.-J. Chung, I. Pinnau, J. Song, N. Du, G. P. Robertson and M. D. Guiver, J. Membr. Sci., 2010, 346, 280–287 CrossRef CAS.
- K. Zhang, X. Luo, S. Li, X. Tian, Q. Wang, C. Liu, Y. Tang, X. Feng, R. Zhang, S. Yin and S. Wang, Chem. Eng. J., 2024, 484, 149489 CrossRef CAS.
- P. Li, T. S. Chung and D. R. Paul, J. Membr. Sci., 2014, 450, 380–388 CrossRef CAS.
- T. T. Moore and W. J. Koros, J. Mol. Struct., 2005, 739, 87–98 CrossRef CAS.
- J. C. Maxwell, A Treatise on Electricity and Magnetism, Clarendon Press, 1873 Search PubMed.
- R. Mahajan and W. J. Koros, Polym. Eng. Sci., 2002, 42, 1432–1441 CrossRef CAS.
- J. Sánchez-Laínez, A. Pardillos-Ruiz, M. Carta, R. Malpass-Evans, N. B. McKeown, C. Téllez and J. Coronas, Sep. Purif. Technol., 2019, 224, 456–462 CrossRef.
- C. G. Bezzu, M. Carta, A. Tonkins, J. C. Jansen, P. Bernardo, F. Bazzarelli and N. B. McKeown, Adv. Mater., 2012, 24, 5930–5933 CrossRef CAS PubMed.
- Y. Rogan, L. Starannikova, V. Ryzhikh, Y. Yampolskii, P. Bernardo, F. Bazzarelli, J. Carolus Jansen and N. B. McKeown, Polym. Chem., 2013, 4, 3813–3820 RSC.
- J. Zhang, H. Kang, J. Martin, S. Zhang, S. Thomas, T. C. Merkel and J. Jin, Chem. Commun., 2016, 52, 6553–6556 RSC.
Footnote |
| † Electronic supplementary information (ESI) available. See DOI: https://doi.org/10.1039/d3ta07109j |
| This journal is © The Royal Society of Chemistry 2024 |